1. Introduction
Ice rumples are locally-grounded and elevated features over which the surrounding floating ice shelves maintain their flow speed, because the ice overrides the pinned bed, such that horizontal divergence of the main flow does not occur [
1,
2]. These features are distinct from ice rises, which are locally accumulated and have their own flow dynamics, including a radial ice-flow center separate from the main ice shelf [
3]. Ice rumples are typically elevated only tens of meters above the surrounding ice shelf surface [
2] and can vary in size. For example, the Doake ice rumples in the Ronne Ice Shelf are relatively large with an area of 1700 km
2 [
4], while smaller ice rumples may only be a few kilometers wide in other ice shelves [
5].
Despite their relatively subtle physical features, ice rumples may have a significant impact on the dynamics of ice-shelf grounding lines, which are closely related to ice shelf stability. Favier et al. [
6] demonstrated that an ice rumple can reduce shelf velocity and trigger the advance of the grounding line over the long-term increasing stability. Conversely, Tinto and Bell [
7] observed that the flow velocity of the eastern Thwaites ice shelf dramatically increased after the unpinning of an ice rumple. However, despite growing interest in and realization of the importance of local pinning points on ice-shelf stability [
8,
9,
10,
11], field observations are still difficult to obtain due to the presence of crevasses and rifts [
2]. Additionally, surface responses due to short-term progressive basal perturbation have not previously been discussed in the literature. Such analysis is thus required, especially in West Antarctica where many ice shelves are experiencing rapid and notable thinning.
Moreover, continuous monitoring using satellite techniques is also challenging because the detection of ice rumples usually requires a minimum of four separate SAR acquisitions for Double-Differential Interferometric SAR (DDInSAR). Recently, the availability of high-resolution satellite imagery has enhanced our ability to detect and observe ice rumples. One of the main objectives of TanDEM-X, a twin satellite of TerraSAR-X that orbits in a helix formation for various interferometry modes, is to construct digital elevation models (DEMs) of the globe with absolute vertical accuracy of better than 10 m and a spatial resolution of 12 × 12 m [
12]. This enables the ice rumples’ topographic features to be observed, as well as the monitoring of changes when data are available in time series.
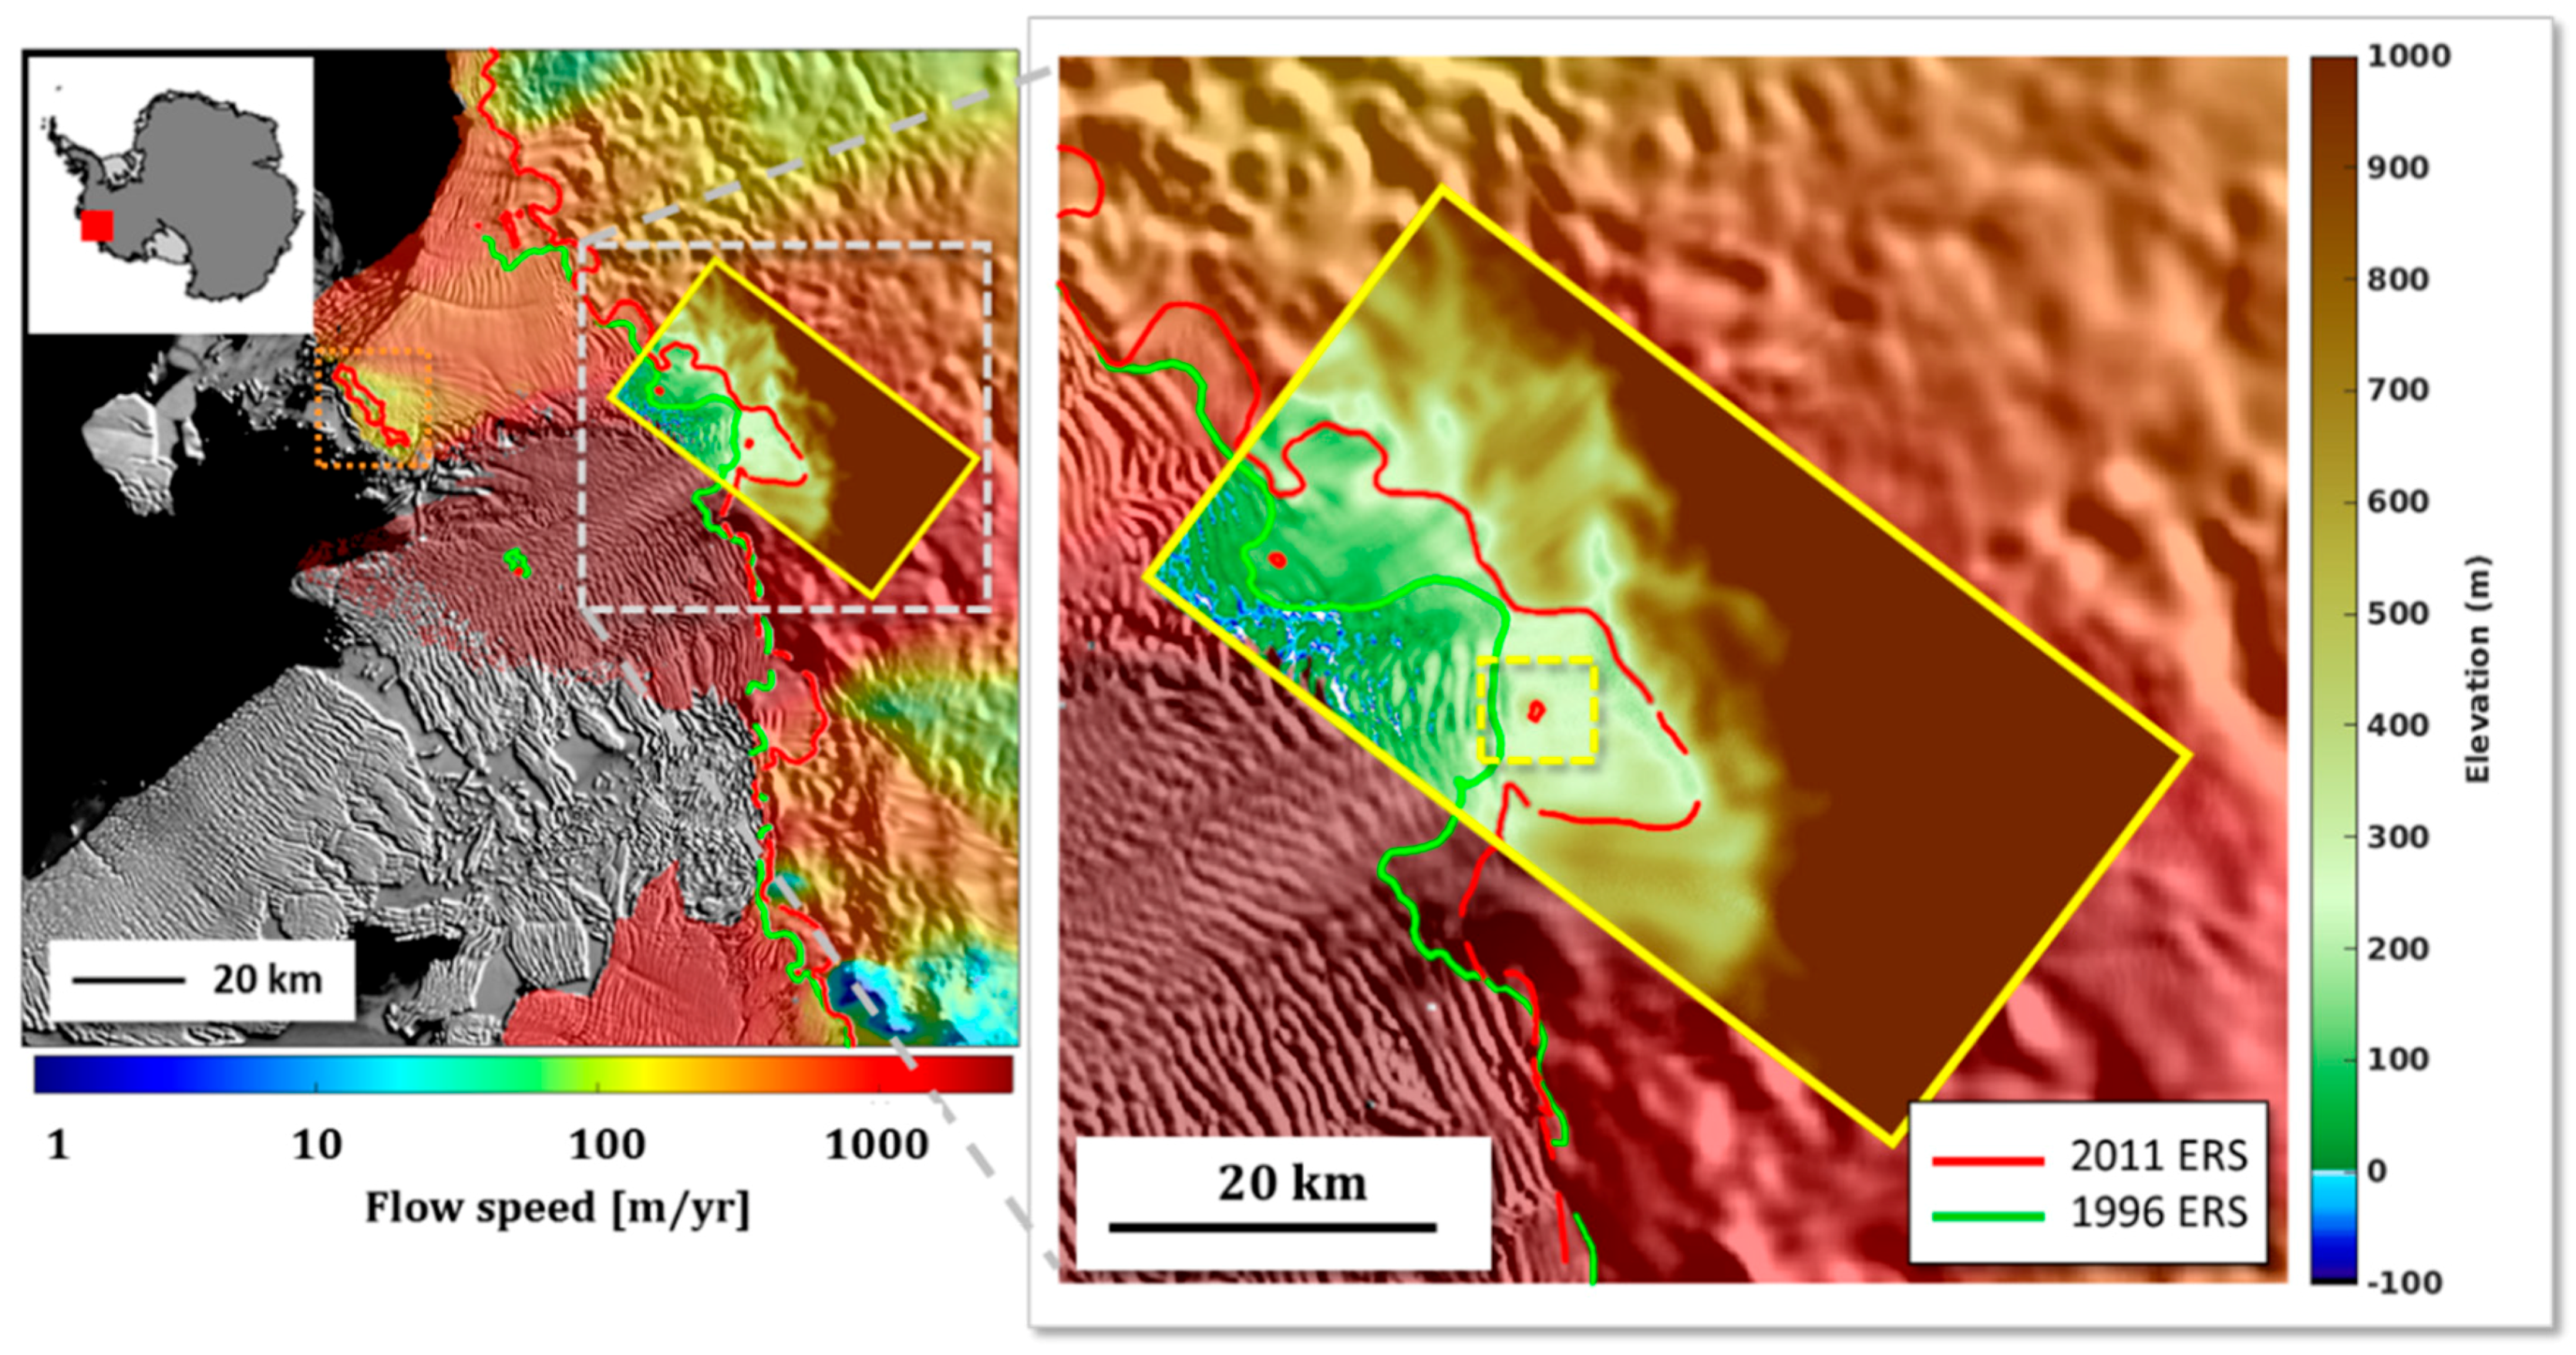
In this study, we used multiple 2011–2013 TanDEM-X datasets to study an ice rumple in Antarctica’s Thwaites ice shelf, previously observed via DDInSAR by Rignot et al. [
13]. The pinning point appeared sometime between the initial observation in 1996 and the last observation in 2011 by DDInSAR. Subsequently, we compared each DEM, derived from TanDEM-X datasets, in an original way by anticipating surface deformation of the ice rumple, because the Thwaites ice shelf has recently been experiencing rapid thinning [
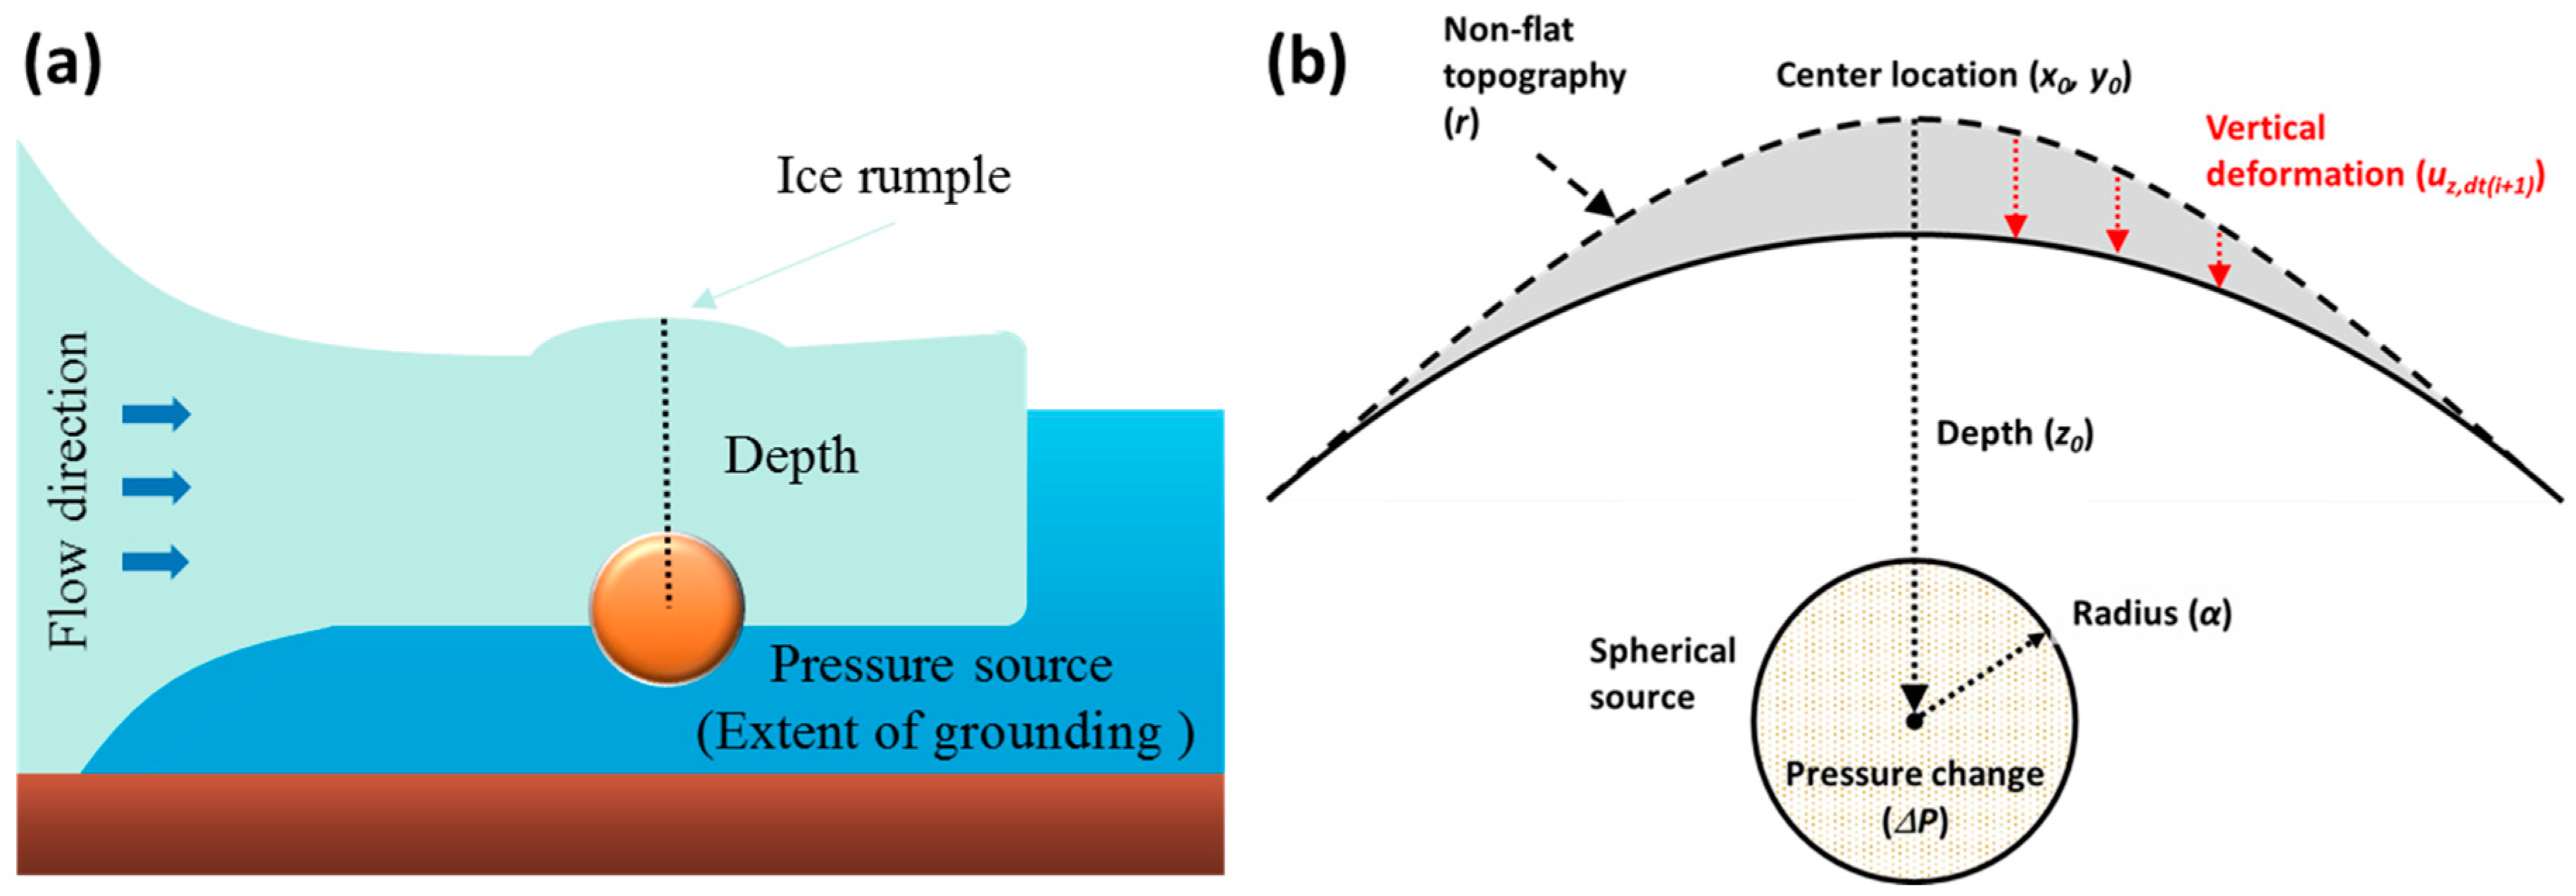
14]. Finally, we investigated the surface response due to short-term progressive basal stress perturbation using a simple deformation model, assuming that the extent of grounding underneath the ice acted as a spherical stress source.
3. Results
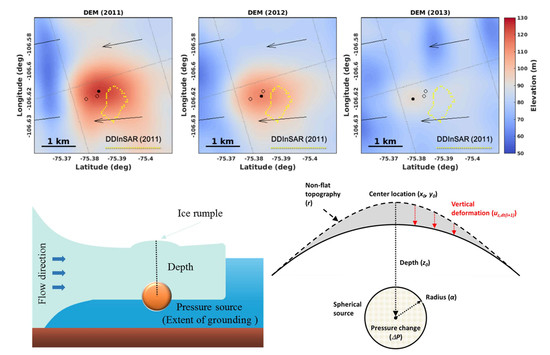
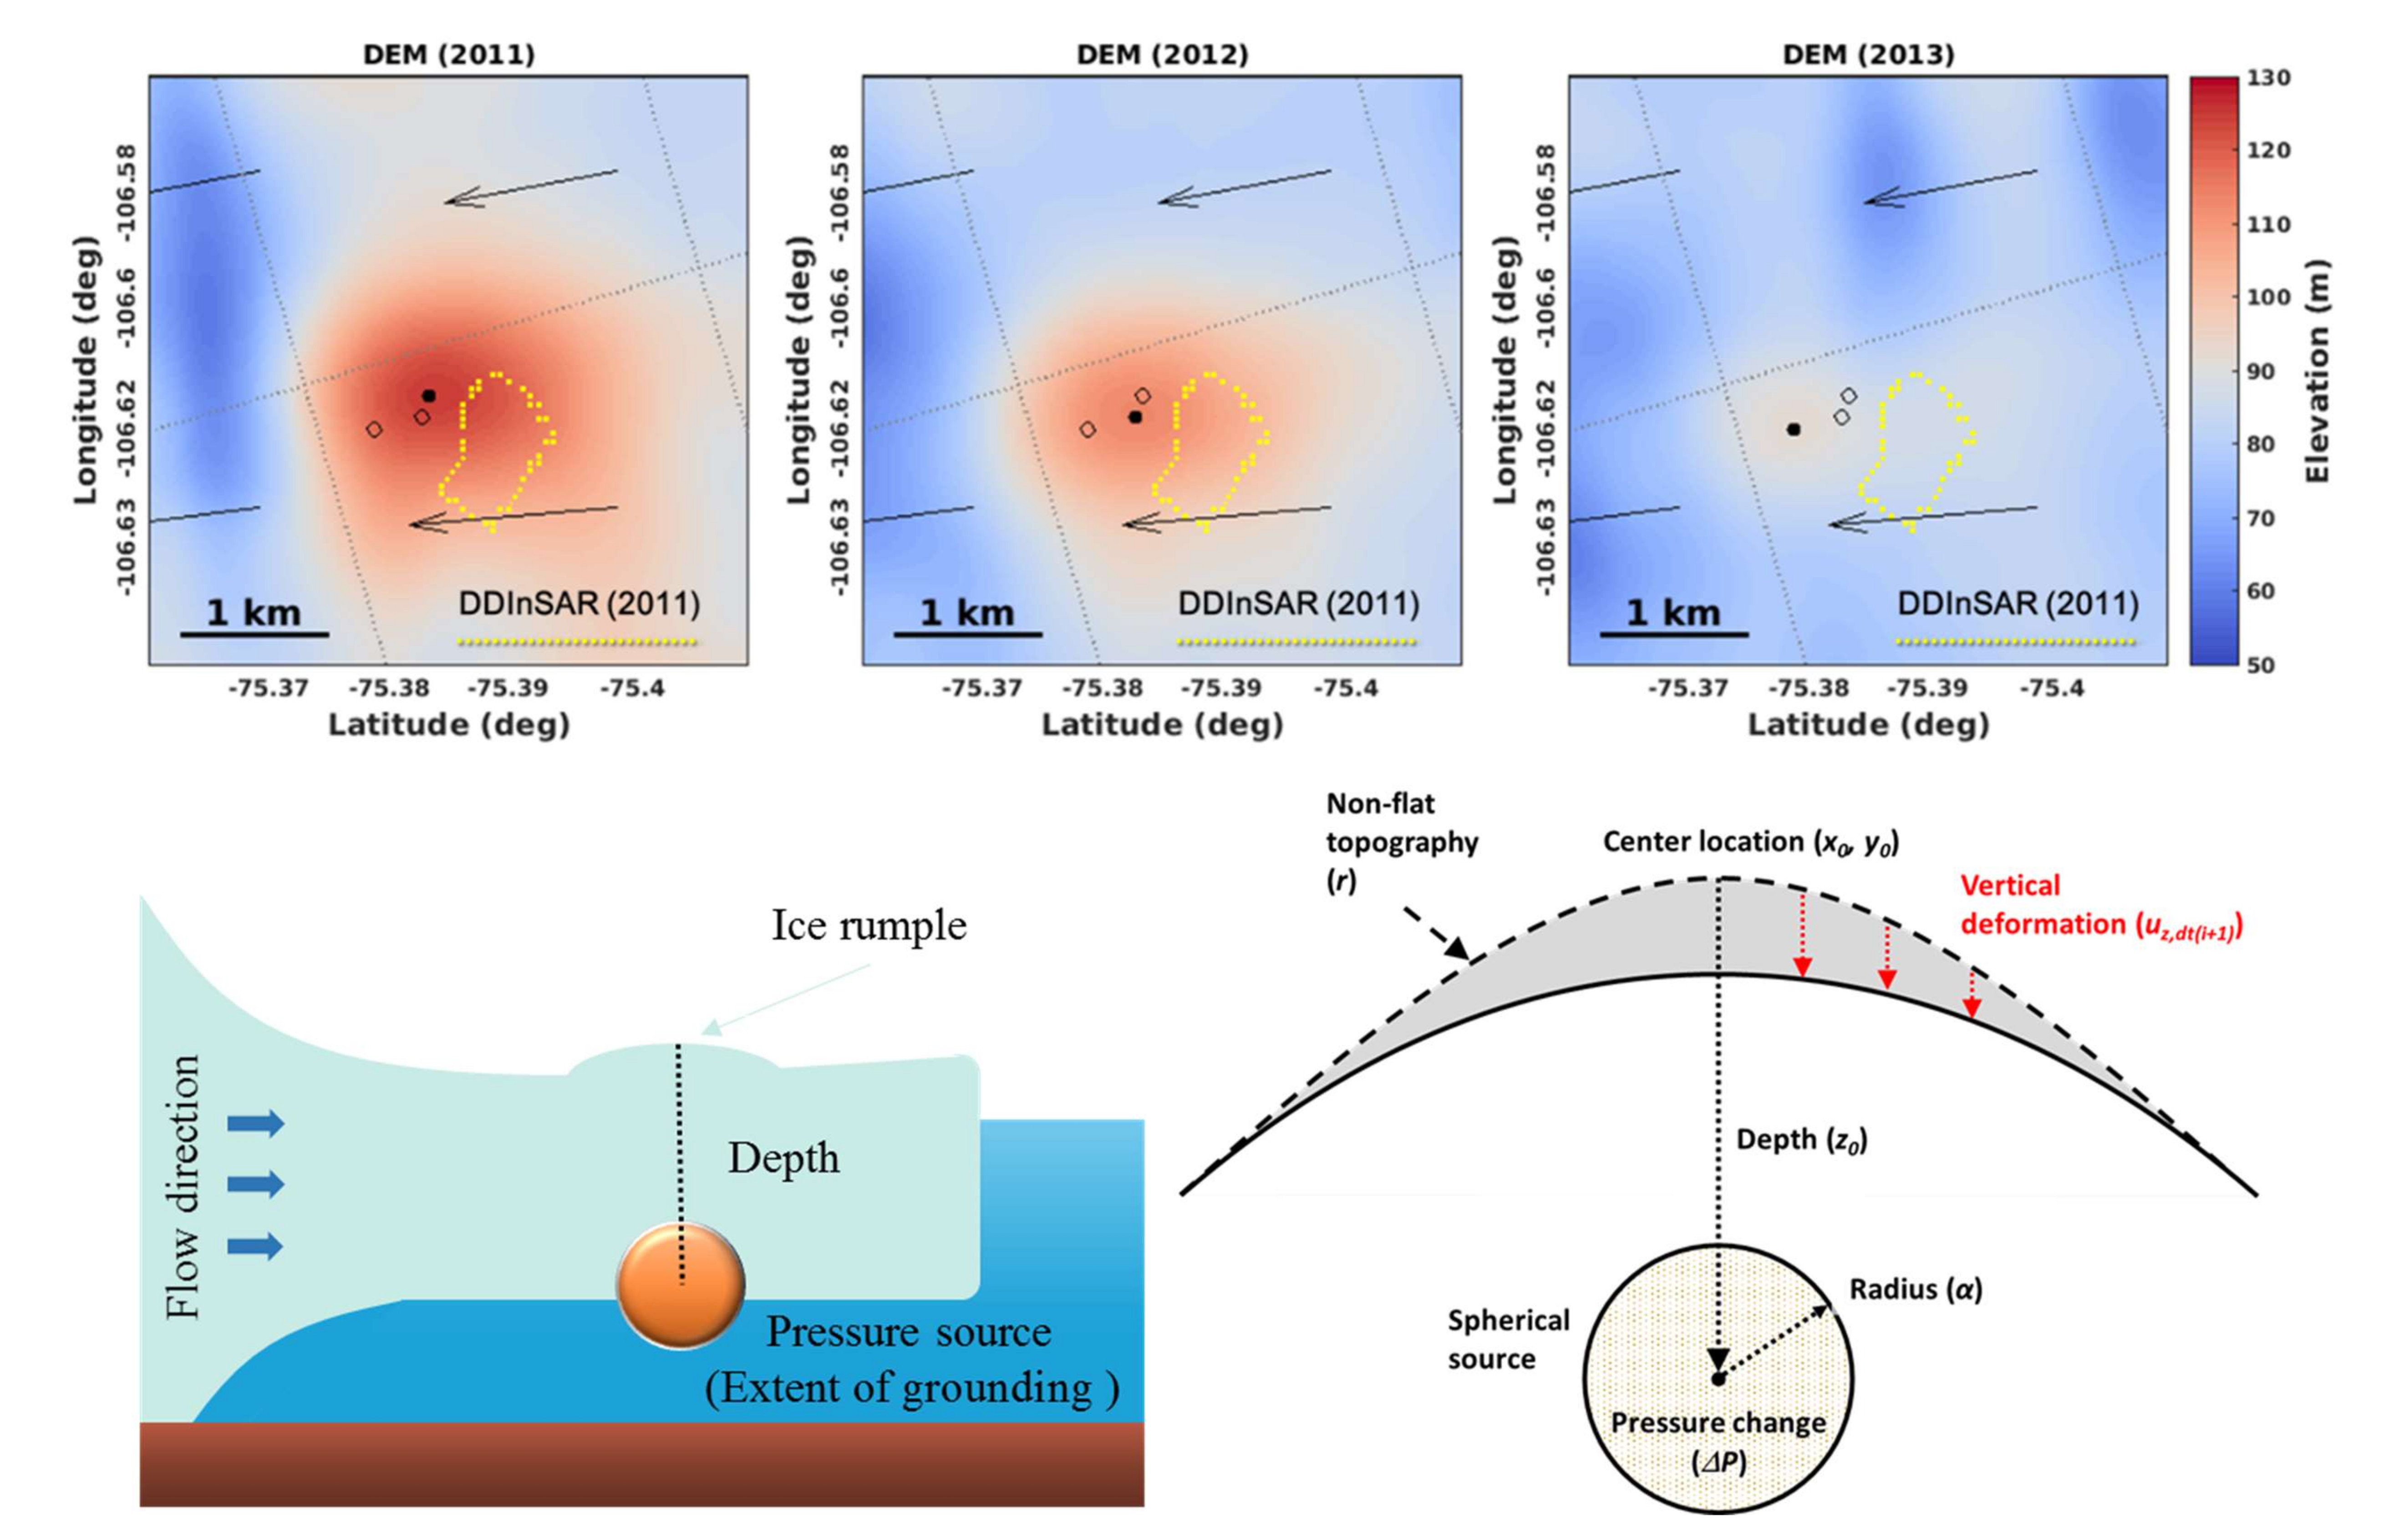
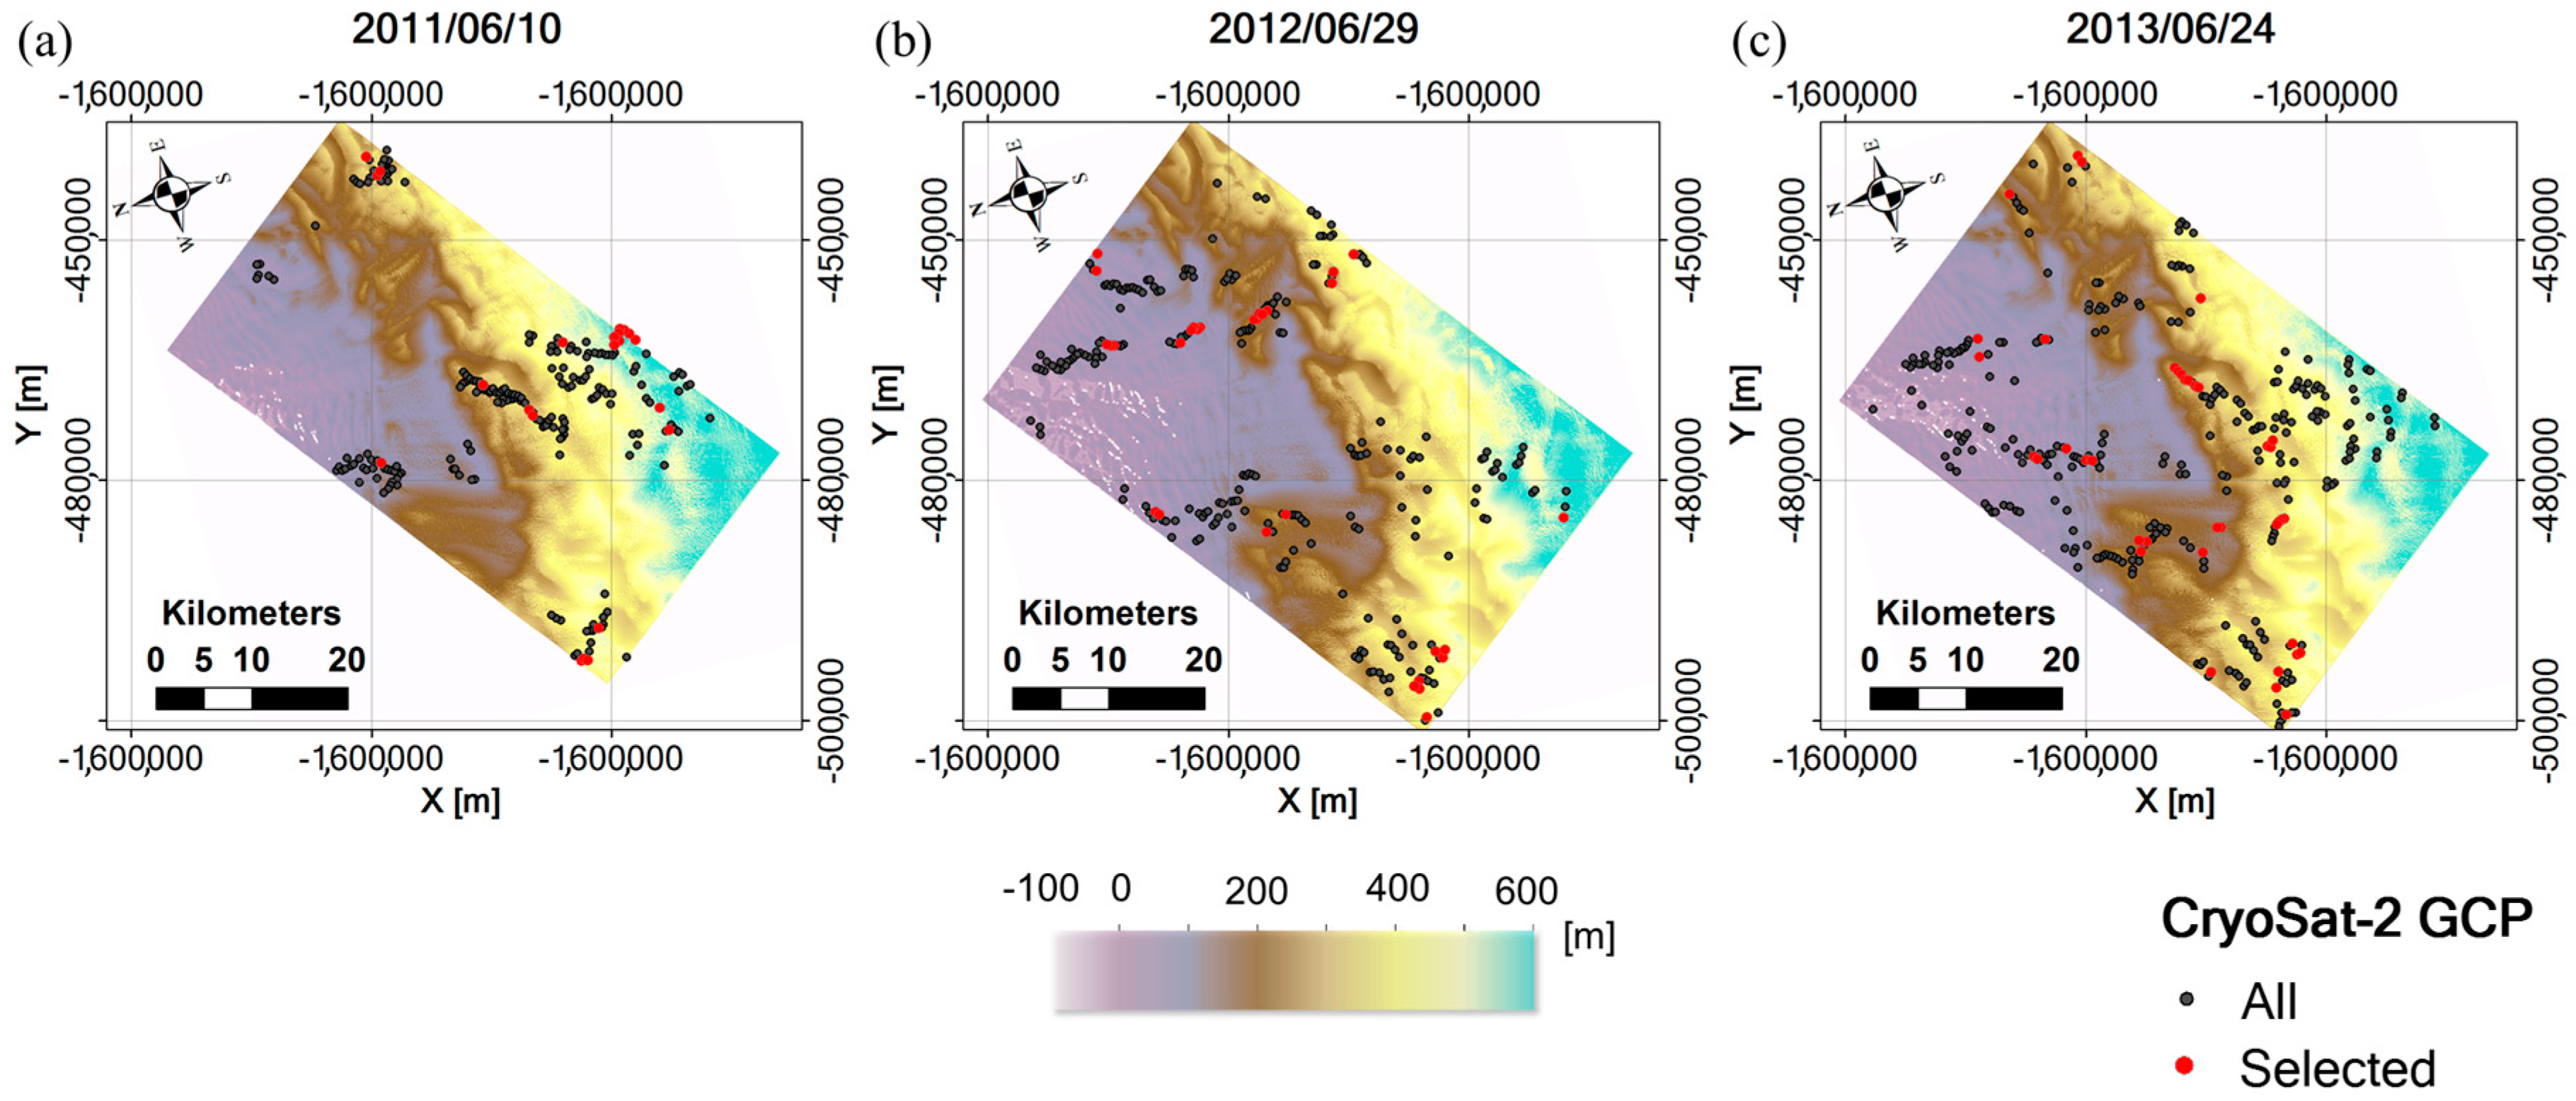
High-resolution surface topography maps of the Thwaites ice shelf from 2011 to 2013 were generated using bi-static interferometry of TanDEM-X and TerraSAR-X SAR data, with selected CryoSat-2 radar altimeter elevation data as ground control points in calibrating absolute elevation (
Figure 3). For each topography map, there were 7 overlapping altimeter tracks, with 222, 250, and 320 elevation points before the selection in 2011, 2012, and 2013, respectively (shown by dark grey circles in
Figure 3). The selection process then sorted out 22, 31, and 39 points with mean cross-correlation coefficients of 0.97, 9.98, and 0.98, respectively (shown by yellow circles in
Figure 3). Using these selected elevation data as ground control points, the correction for absolute elevation was carried out. The root-mean-square errors (RMSEs) between the ground control points and the corrected surface topography maps were 5.26, 2.02, and 1.96 m in 2011, 2012, and 2013, respectively.
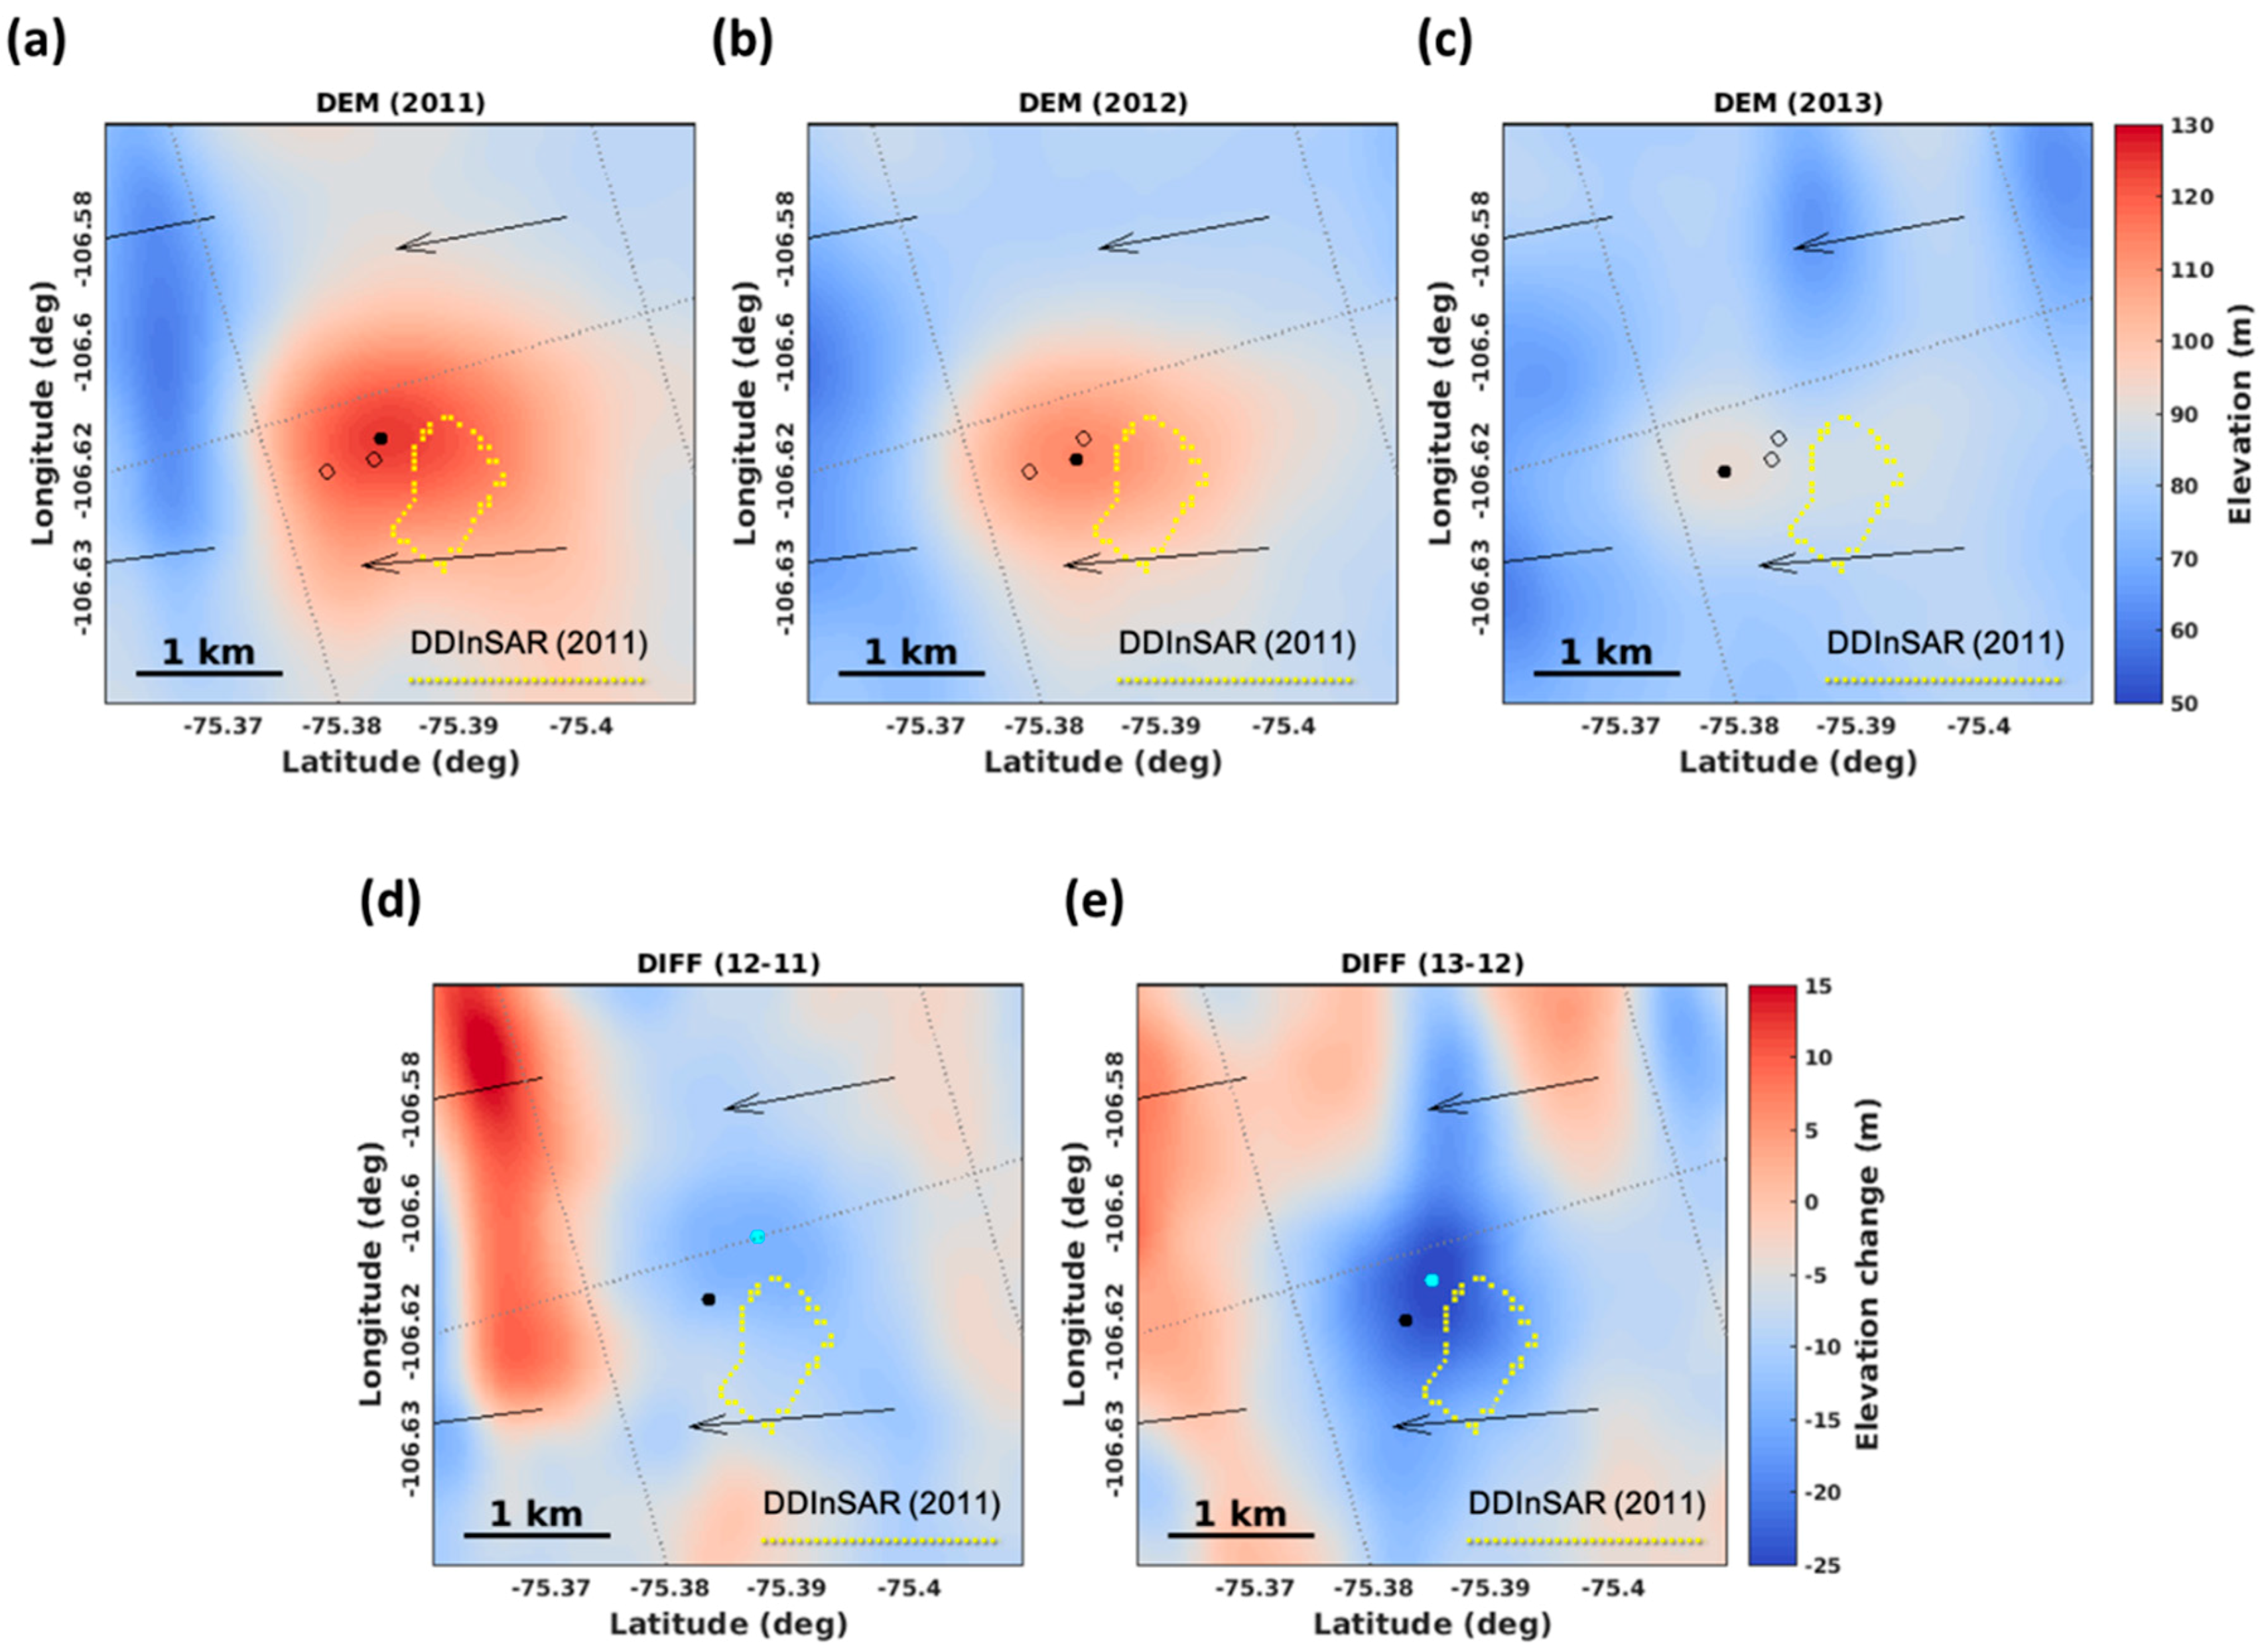
The ice rumple had a circular shape with a downstream slope steeper than that upstream (
Figure 4a–c), resembling the simulation results of Gudmundsson et al. [
24] showing that surface undulations are in phase with basal perturbations under a high basal slip ratio. The elevation anomaly from the surrounding region was approximately 35 m, supporting its characterization as an ice rumple. It appears that the peak of the ice rumple advanced downstream by 125 m and 340 m while decreasing in elevation by 11.67 m and 21.02 m during the periods of 2011–2012 and 2012–2013, respectively. Both deformation maps show surface depressions with a circular main shape and a weak elliptical signal in the cross-flow direction (
Figure 4d,e). The peak of the deformation advanced downstream by 250 m and the maximum deformation was −14.55 m and −24.23 m during the periods of 2011–2012 and 2012–2013, respectively.
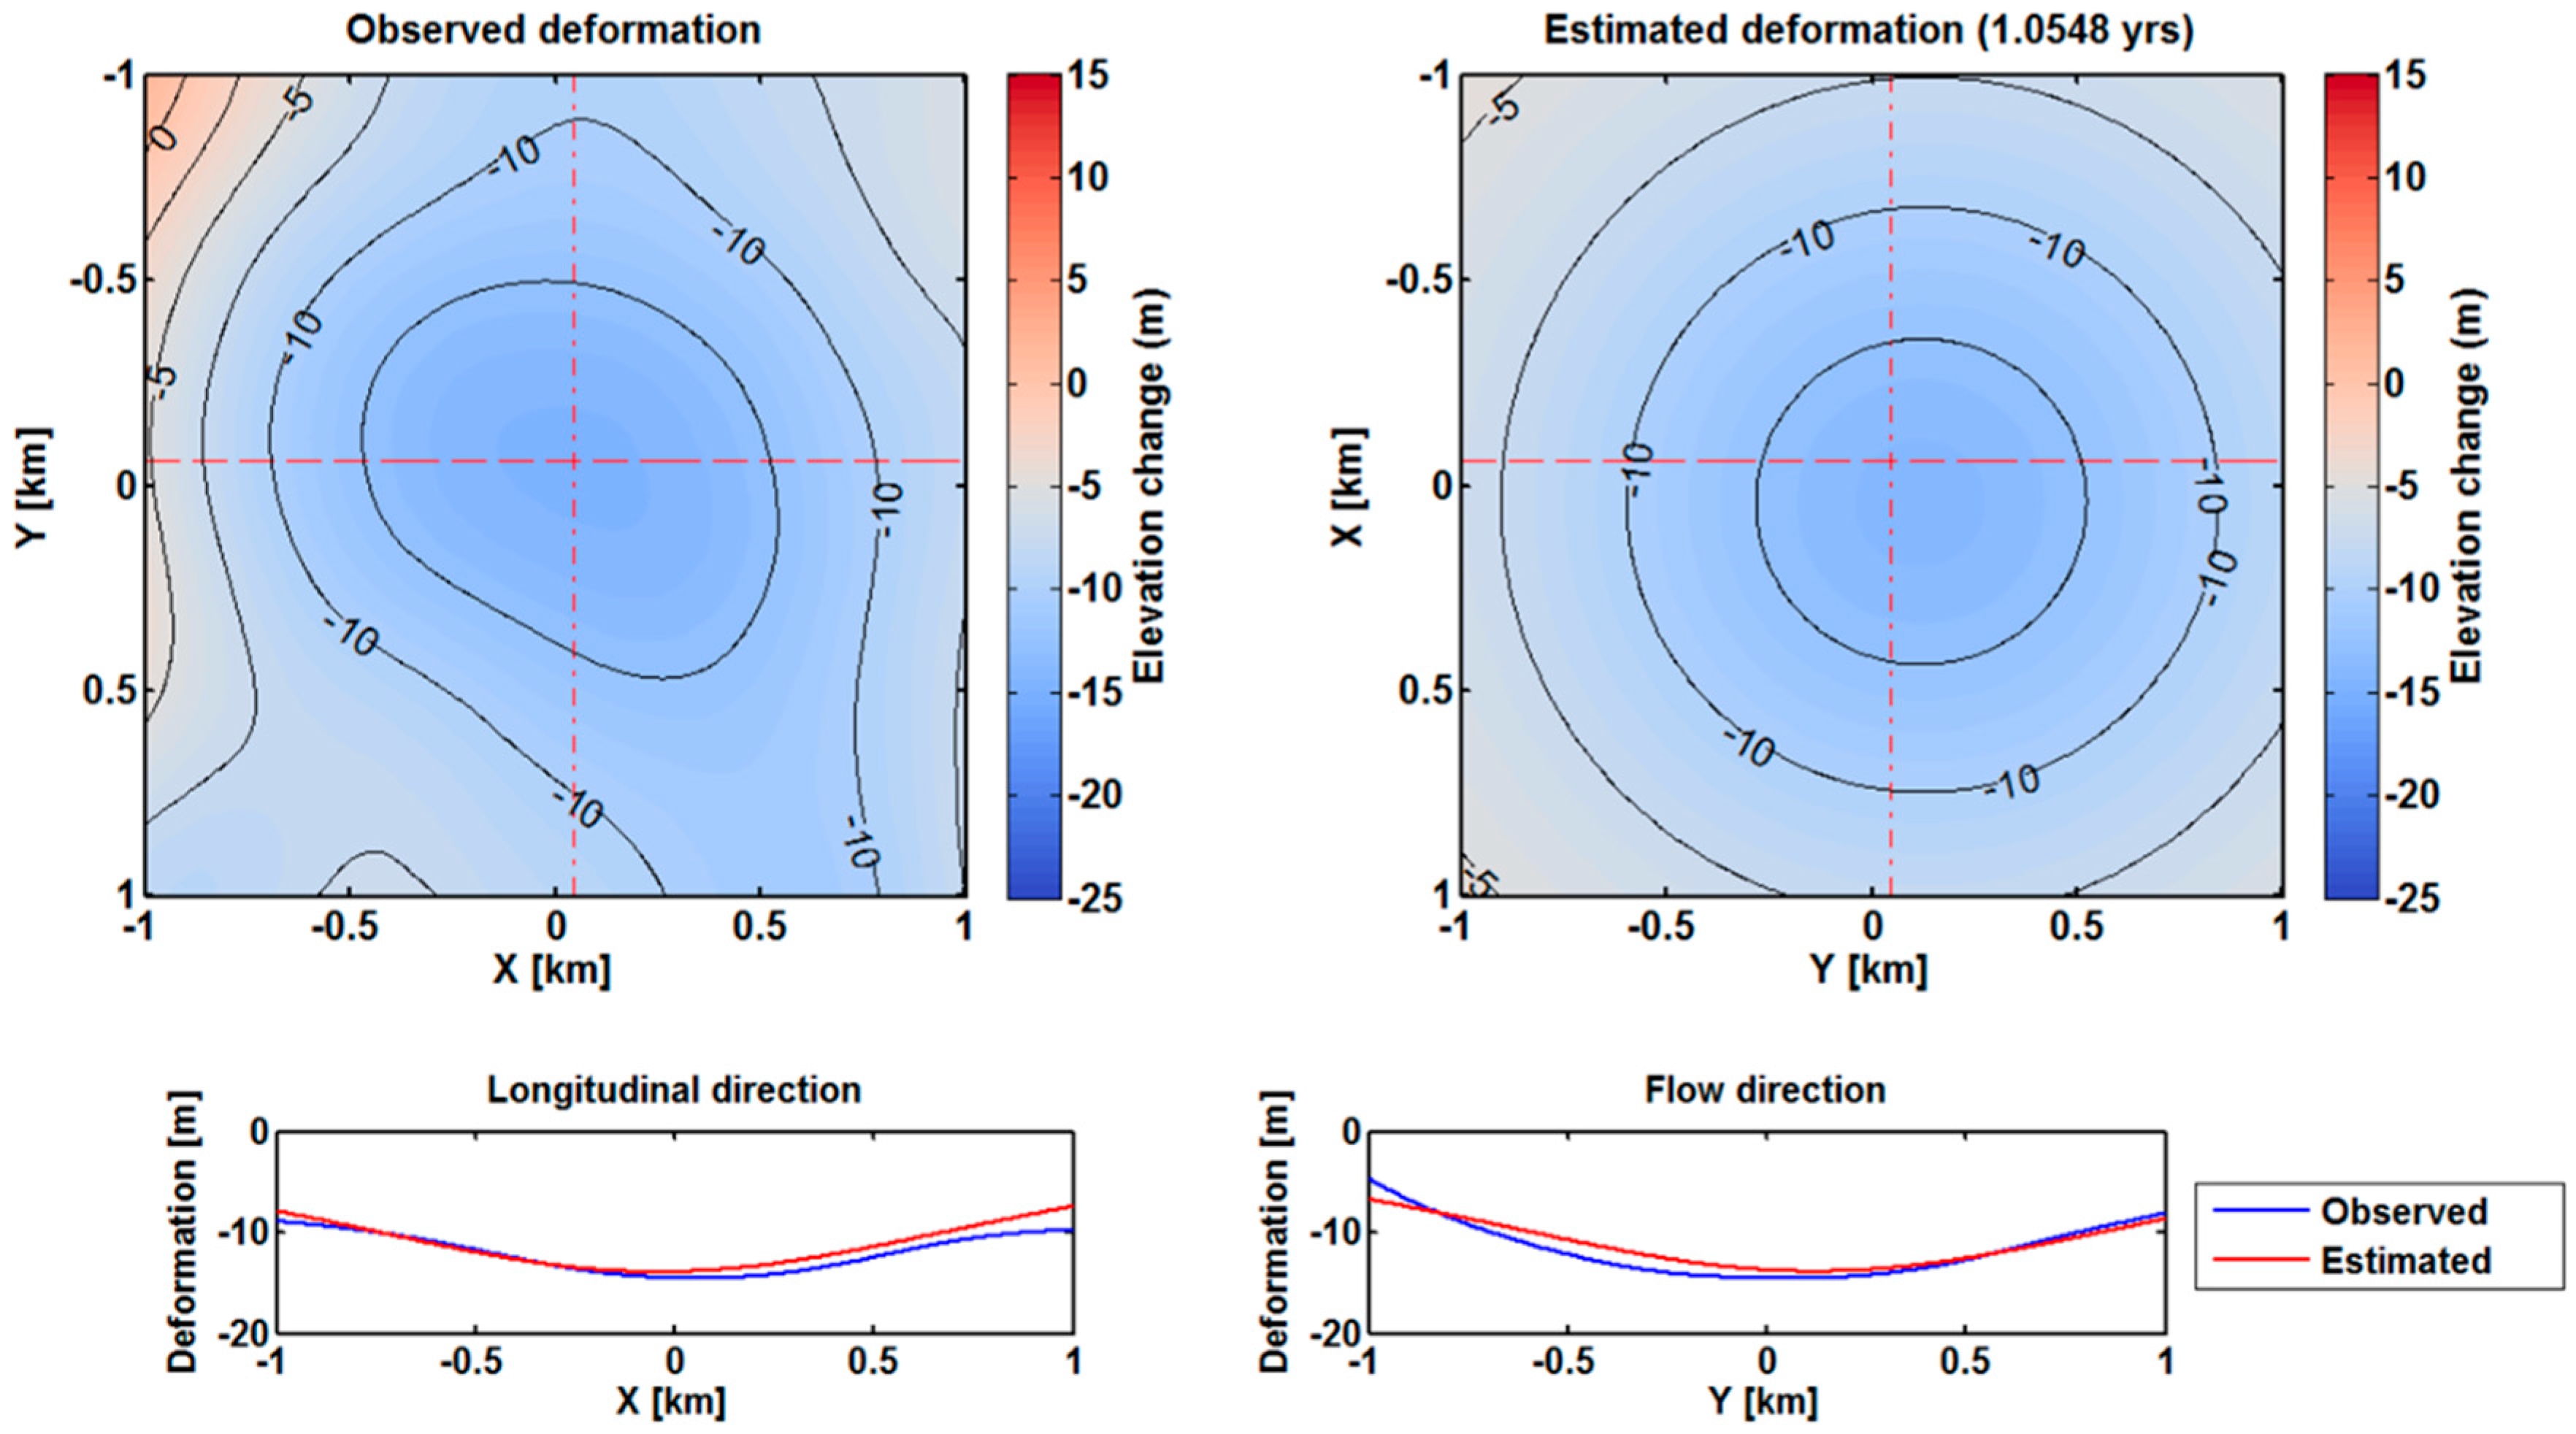
The optimization searches the best approximation of parameters so that the modified deformation model can reproduce the near-circular pattern observed in the surface deformation for both periods. The optimization result predicted a pressure source at a shallow depth of 1072.42 ± 0.93 m, with a radius of 360.78 ± 15.16 m and pressure increment of −0.86 ± 0.16 GPa during 2011–2012 (
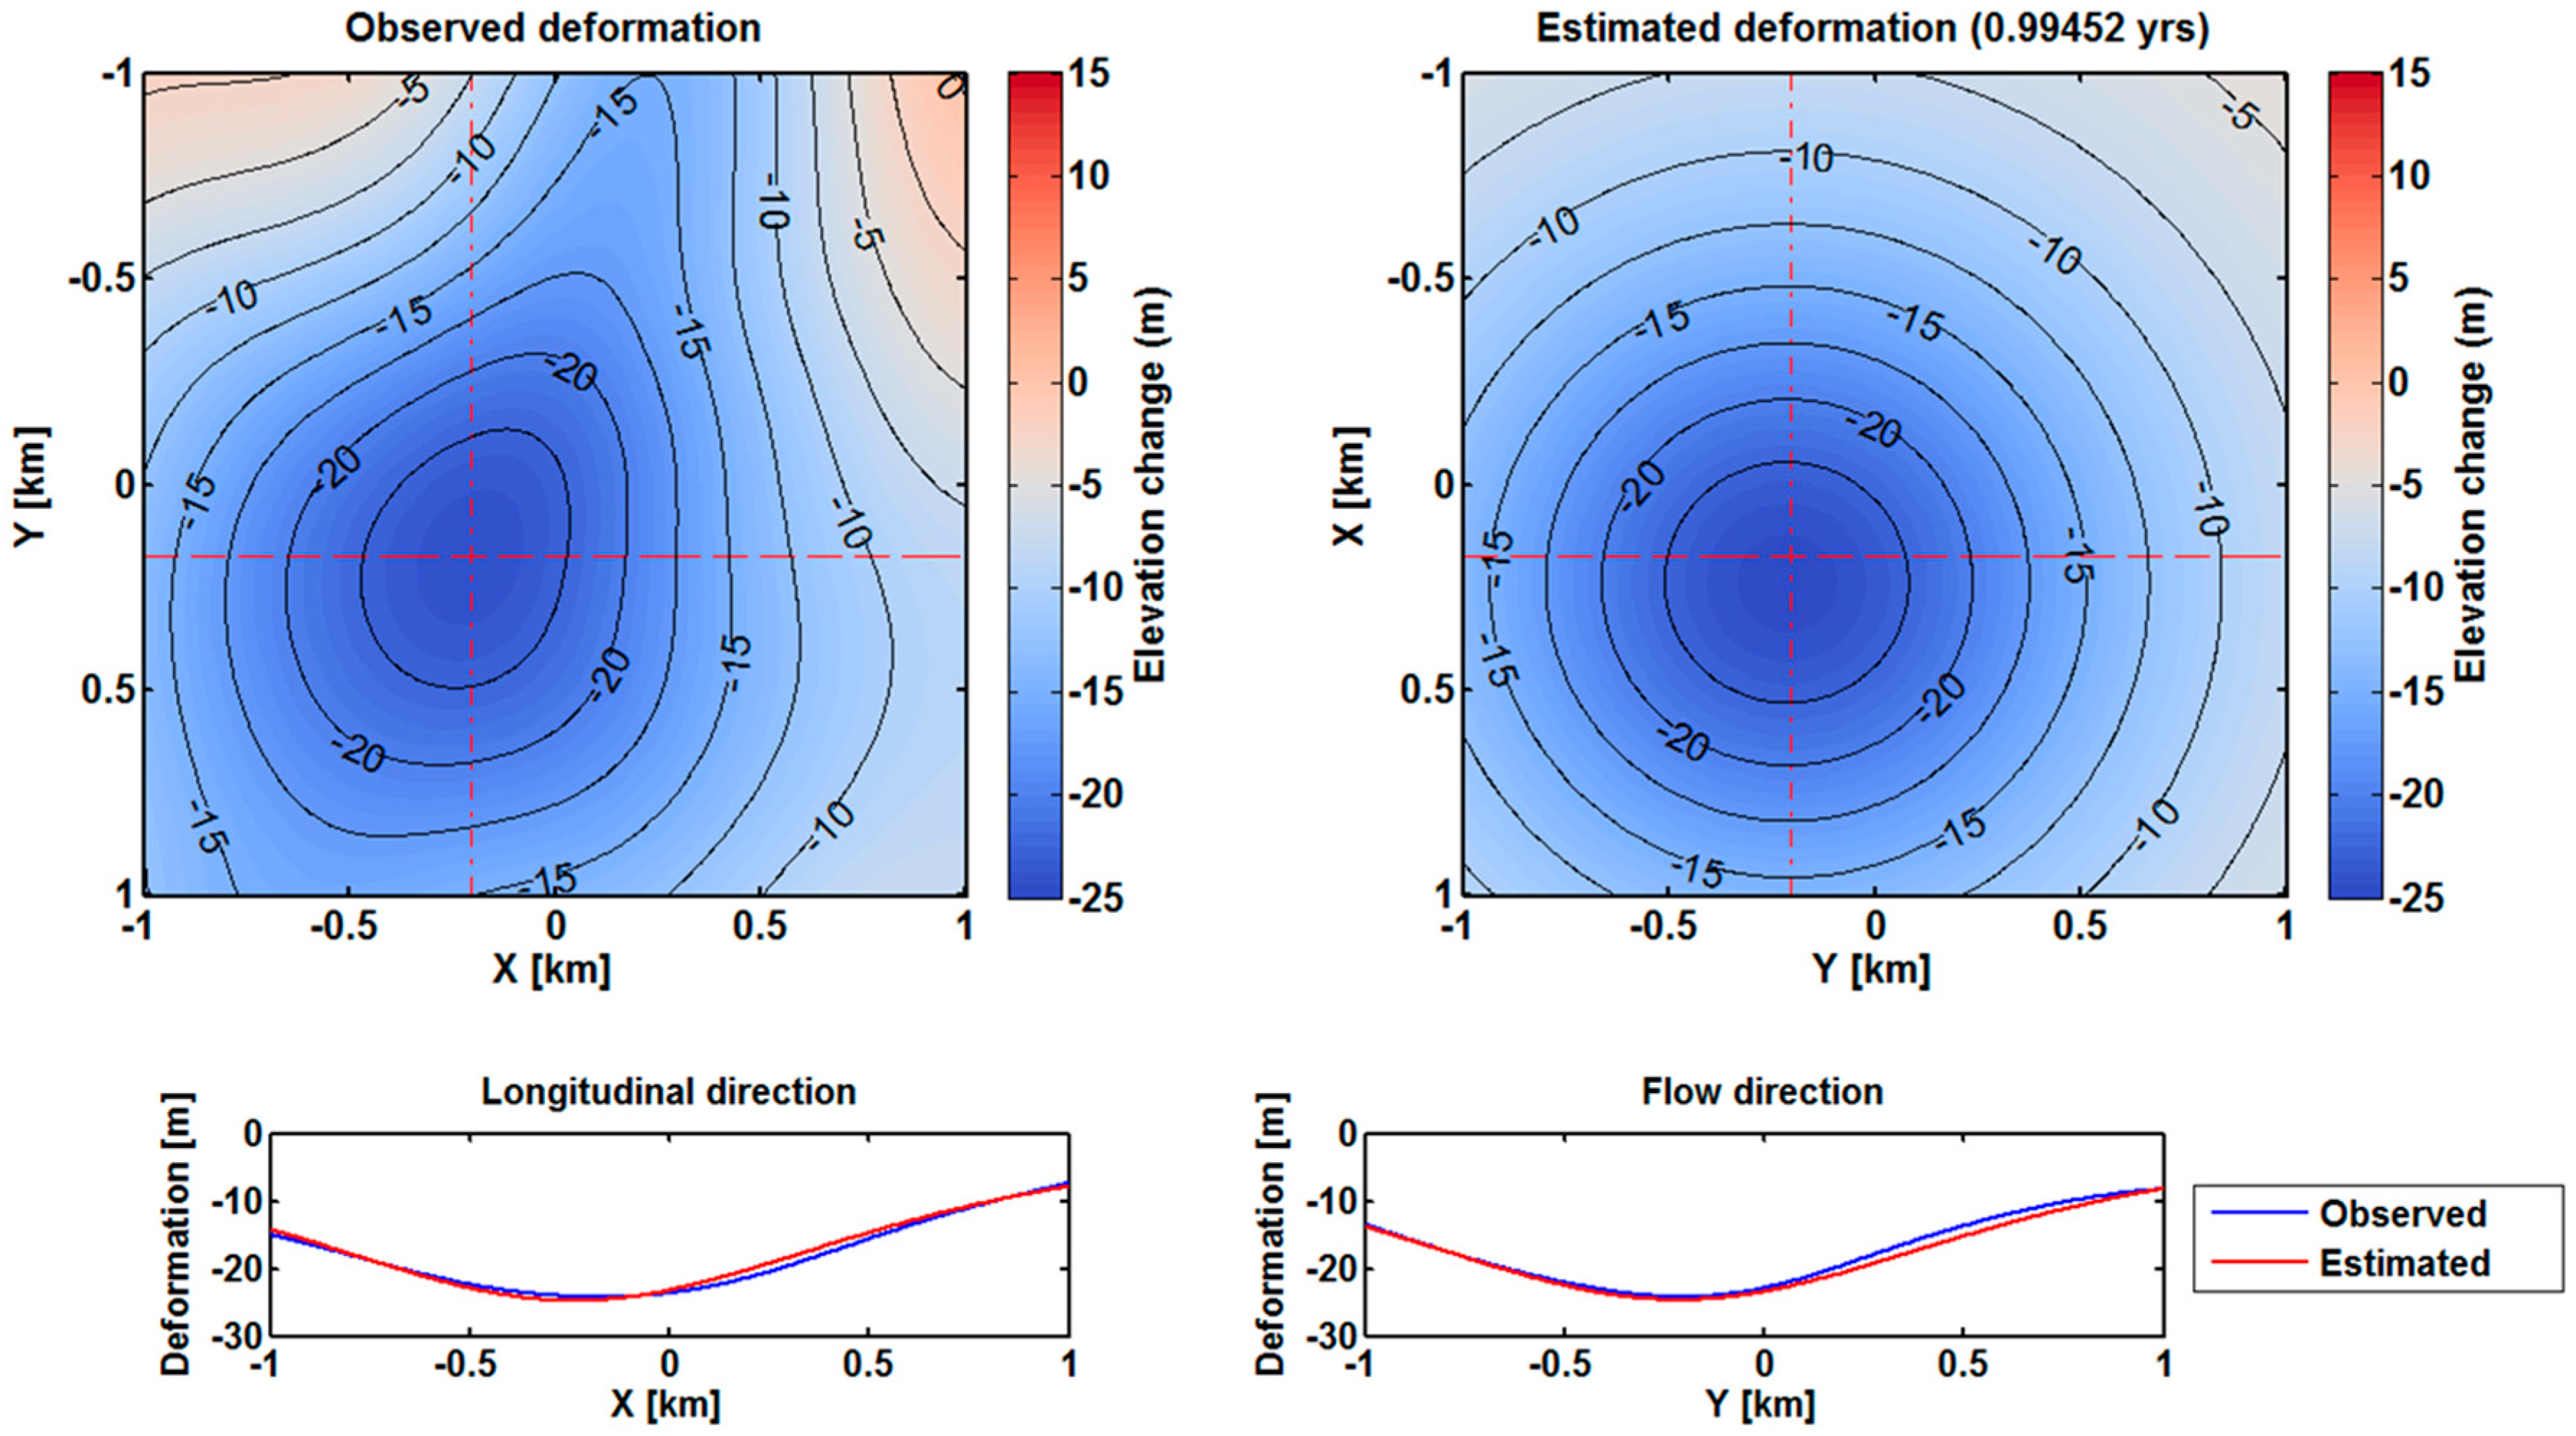
Figure 5). The minimum RMS difference between the observed and estimated deformation was 1.13 m. Likewise, the result predicted a pressure source at a depth of 832.03 ± 1.04 m, with a radius of 148.27 ± 13.51 m and pressure increment of −8.59 ± 0.38 GPa during 2012–2013 (
Figure 6). The RMS difference between the observed and estimated deformation during this period was 2.11 m. During both periods, there was a slight offset of the pressure source’s center location compared to the peak of observed deformation.
4. Discussion
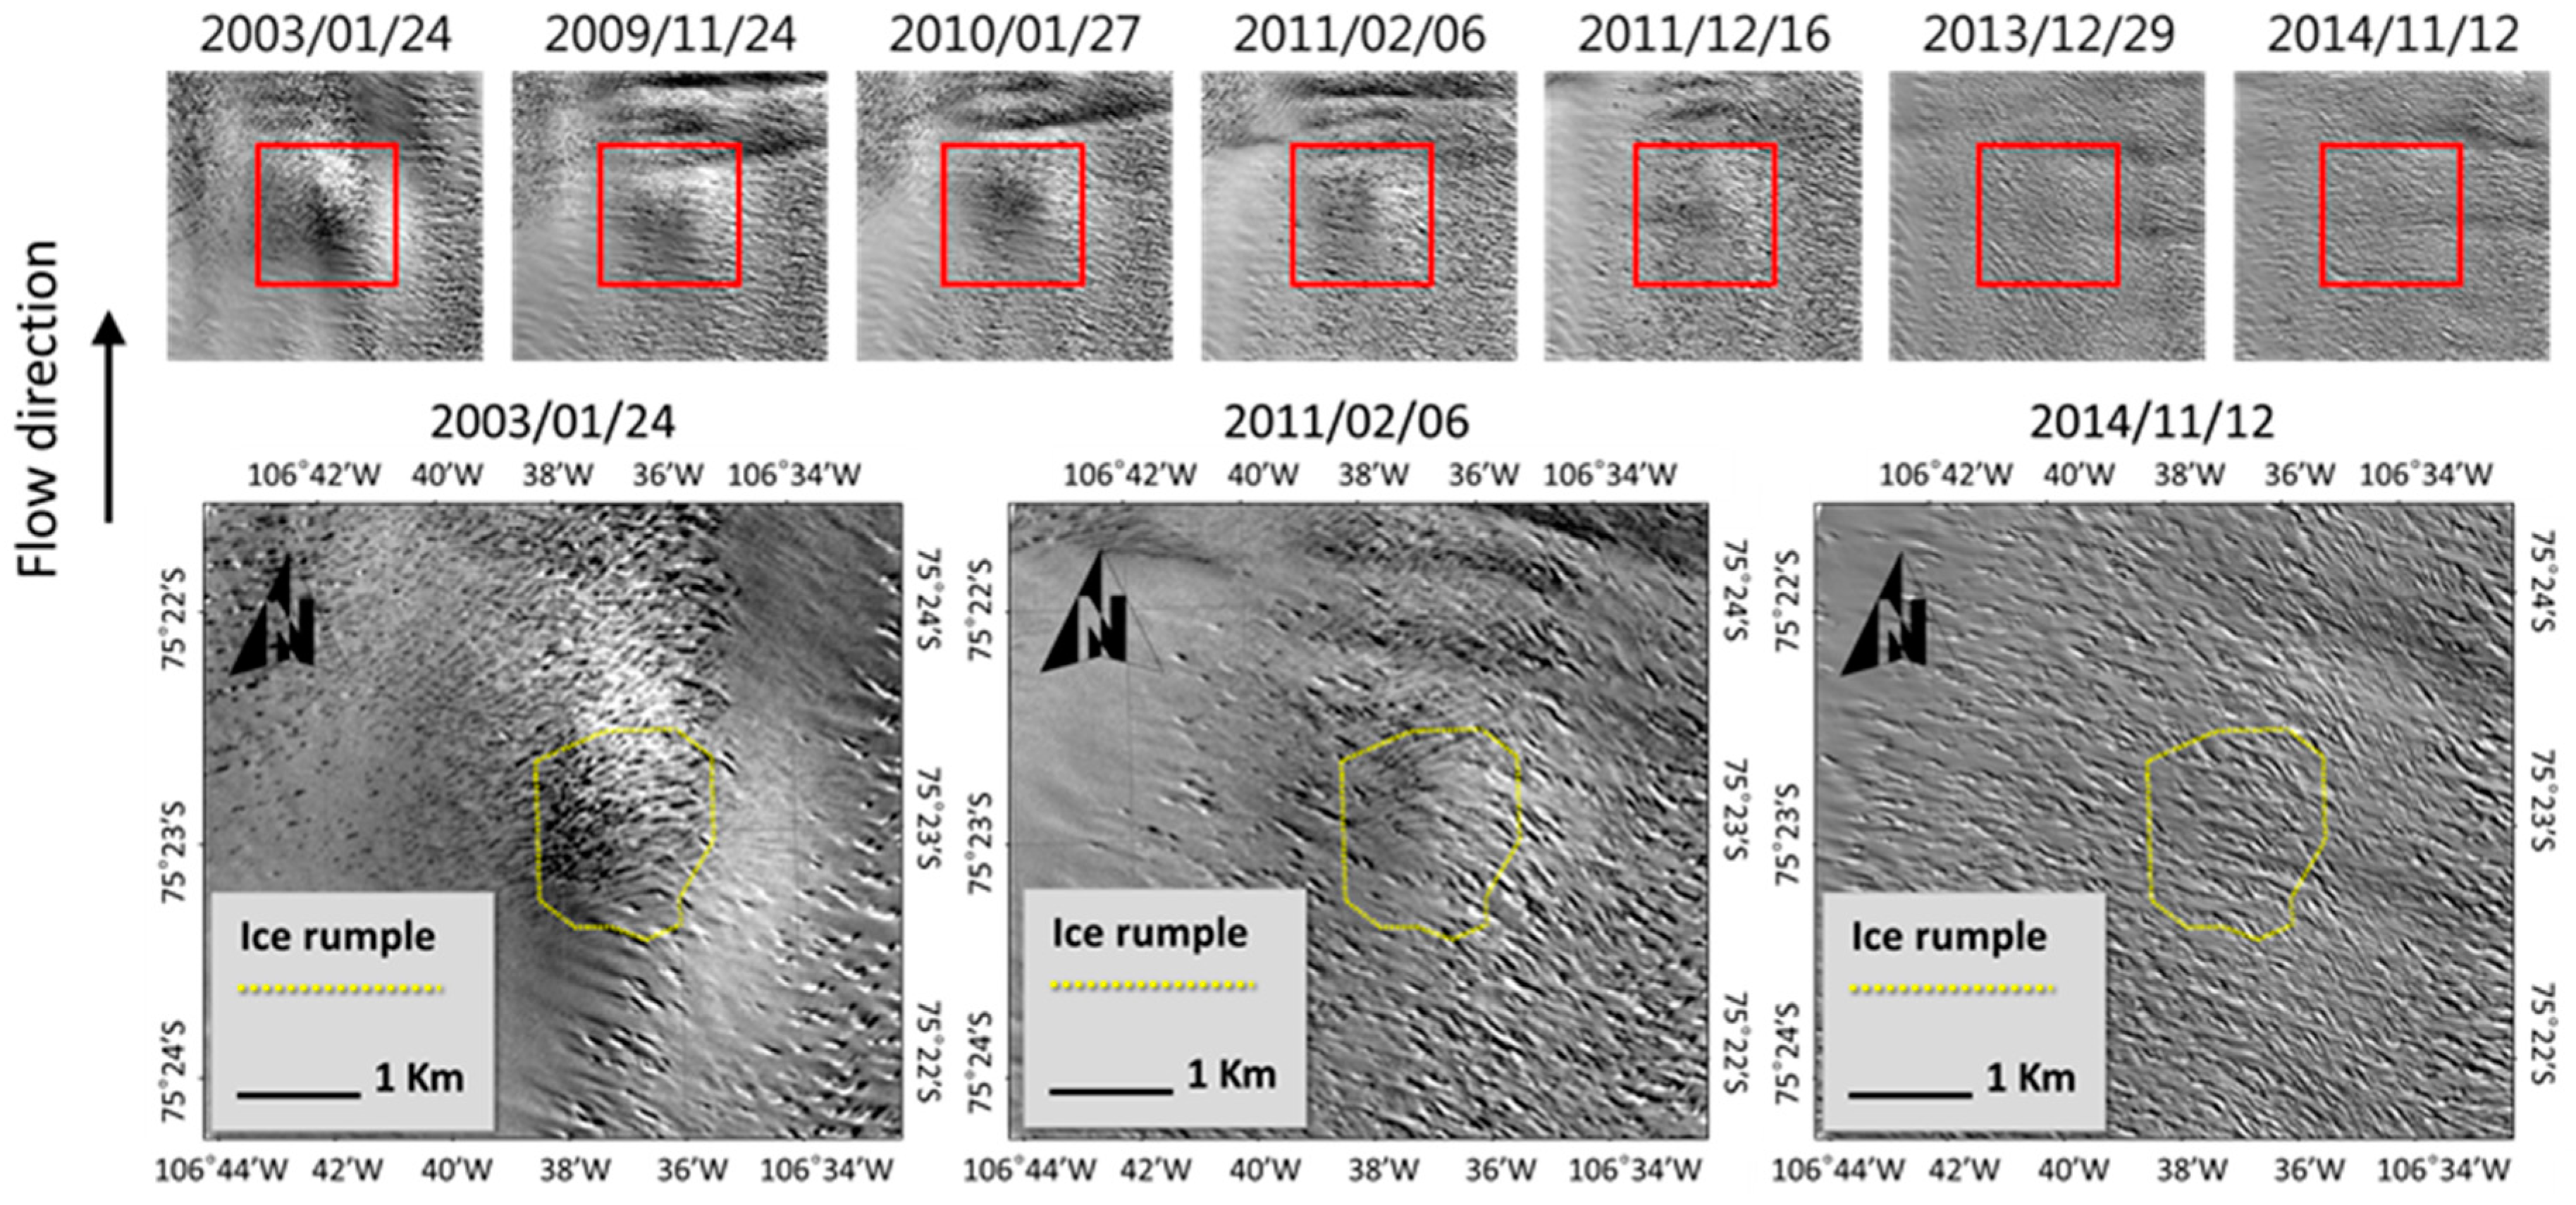
The instant deformation map alone cannot uniquely resolve whether such a deformation is caused by a progressive or ephemeral process. For example, surface deformation could also have been the result of tidal displacement instead of less grounding due to ice thinning. If the deformation was due to tidal displacement, the observable features of an ice rumple must have been present periodically throughout the study period. In order to validate that the deformation signal between the measurements was indeed due to progressive thinning of the floating ice, we monitored the surface features of the ice rumple using Landsat 7 ETM+ images from 2003–2014 (
Figure 7). The images in this time series showed a gradual dissipation of the ice rumple, strongly indicating continuous thinning of the Thwaites ice shelf. Furthermore, the disappearance of surface features (e.g., crevasses and surface gradient) from 2013 onwards suggests that the ice shelf has been ungrounded, removing the pressure point that had been maintaining the ice rumple. Nonetheless, the ice shelf might have been in contact with the pinning point even after the disappearance of surface features, as intermittent ice contact to the pinning point could be possible due to ice shelf thickness fluctuations [
29].
Furthermore, the fact that the surface expression was not advected downstream during the observation period suggests that the ice shelf was still in contact with the basal topography. Although the peak of the surface topography did advance downstream by hundreds of meters each year, the surface expression would have already disappeared from the defined map window if the ice shelf was ungrounded. This is due to the overall flow velocity in this region which is nearly 3 km/year. The advance of the peaks was probably due to unknown irregular shapes of the basal topography in contact with the ice, producing spatially variable pressure as the ice thinned. The differences in the elevation and deformation peaks are related to the asymmetric shape of the ice rumple, as well as the nearly circular shape of the deformation pattern (
Figure 4d,e). Surface undulations were also observable on the surface in the downstream from the ice rumple in
Figure 7. These undulations advect downstream at the flow velocity of the ice shelf and cause positive (or negative) deformations when they are not aligned between the observations, as shown in
Figure 4d,e. An elliptical deformation pattern in
Figure 4e was likely due to this surface undulation.
As the linear theory is invalid under high stress, the presence of surface crevasses in the area might suggest that the ice shelf was influenced by high stress. Landsat images show that crevasses were generated at a local pinning point, and high stress seemed to have affected the ice in the early years (e.g., 2003 in
Figure 7). However, the magnified images show that the surface crevasses present around the ice rumple since 2011 originated from the grounded region upstream of the rumple. Thus, it is likely that the stress beneath the ice shelf decreased significantly due to ice thinning and was not sufficient to create crevasses at the pinning point. Therefore, we conclude that the ice shelf was experiencing low stresses underneath, and that linear viscoelasticity was a reasonable approximation in this study as the TanDEM-X data were acquired in 2011, 2012, and 2013. Nevertheless, the interpretation may be more accurate when a non-linear viscoelasticity is employed, although it is very likely that the problem can be especially difficult to solve. It is expected that further work beyond the scope of linear viscoelasticity is required to advance our assumption.
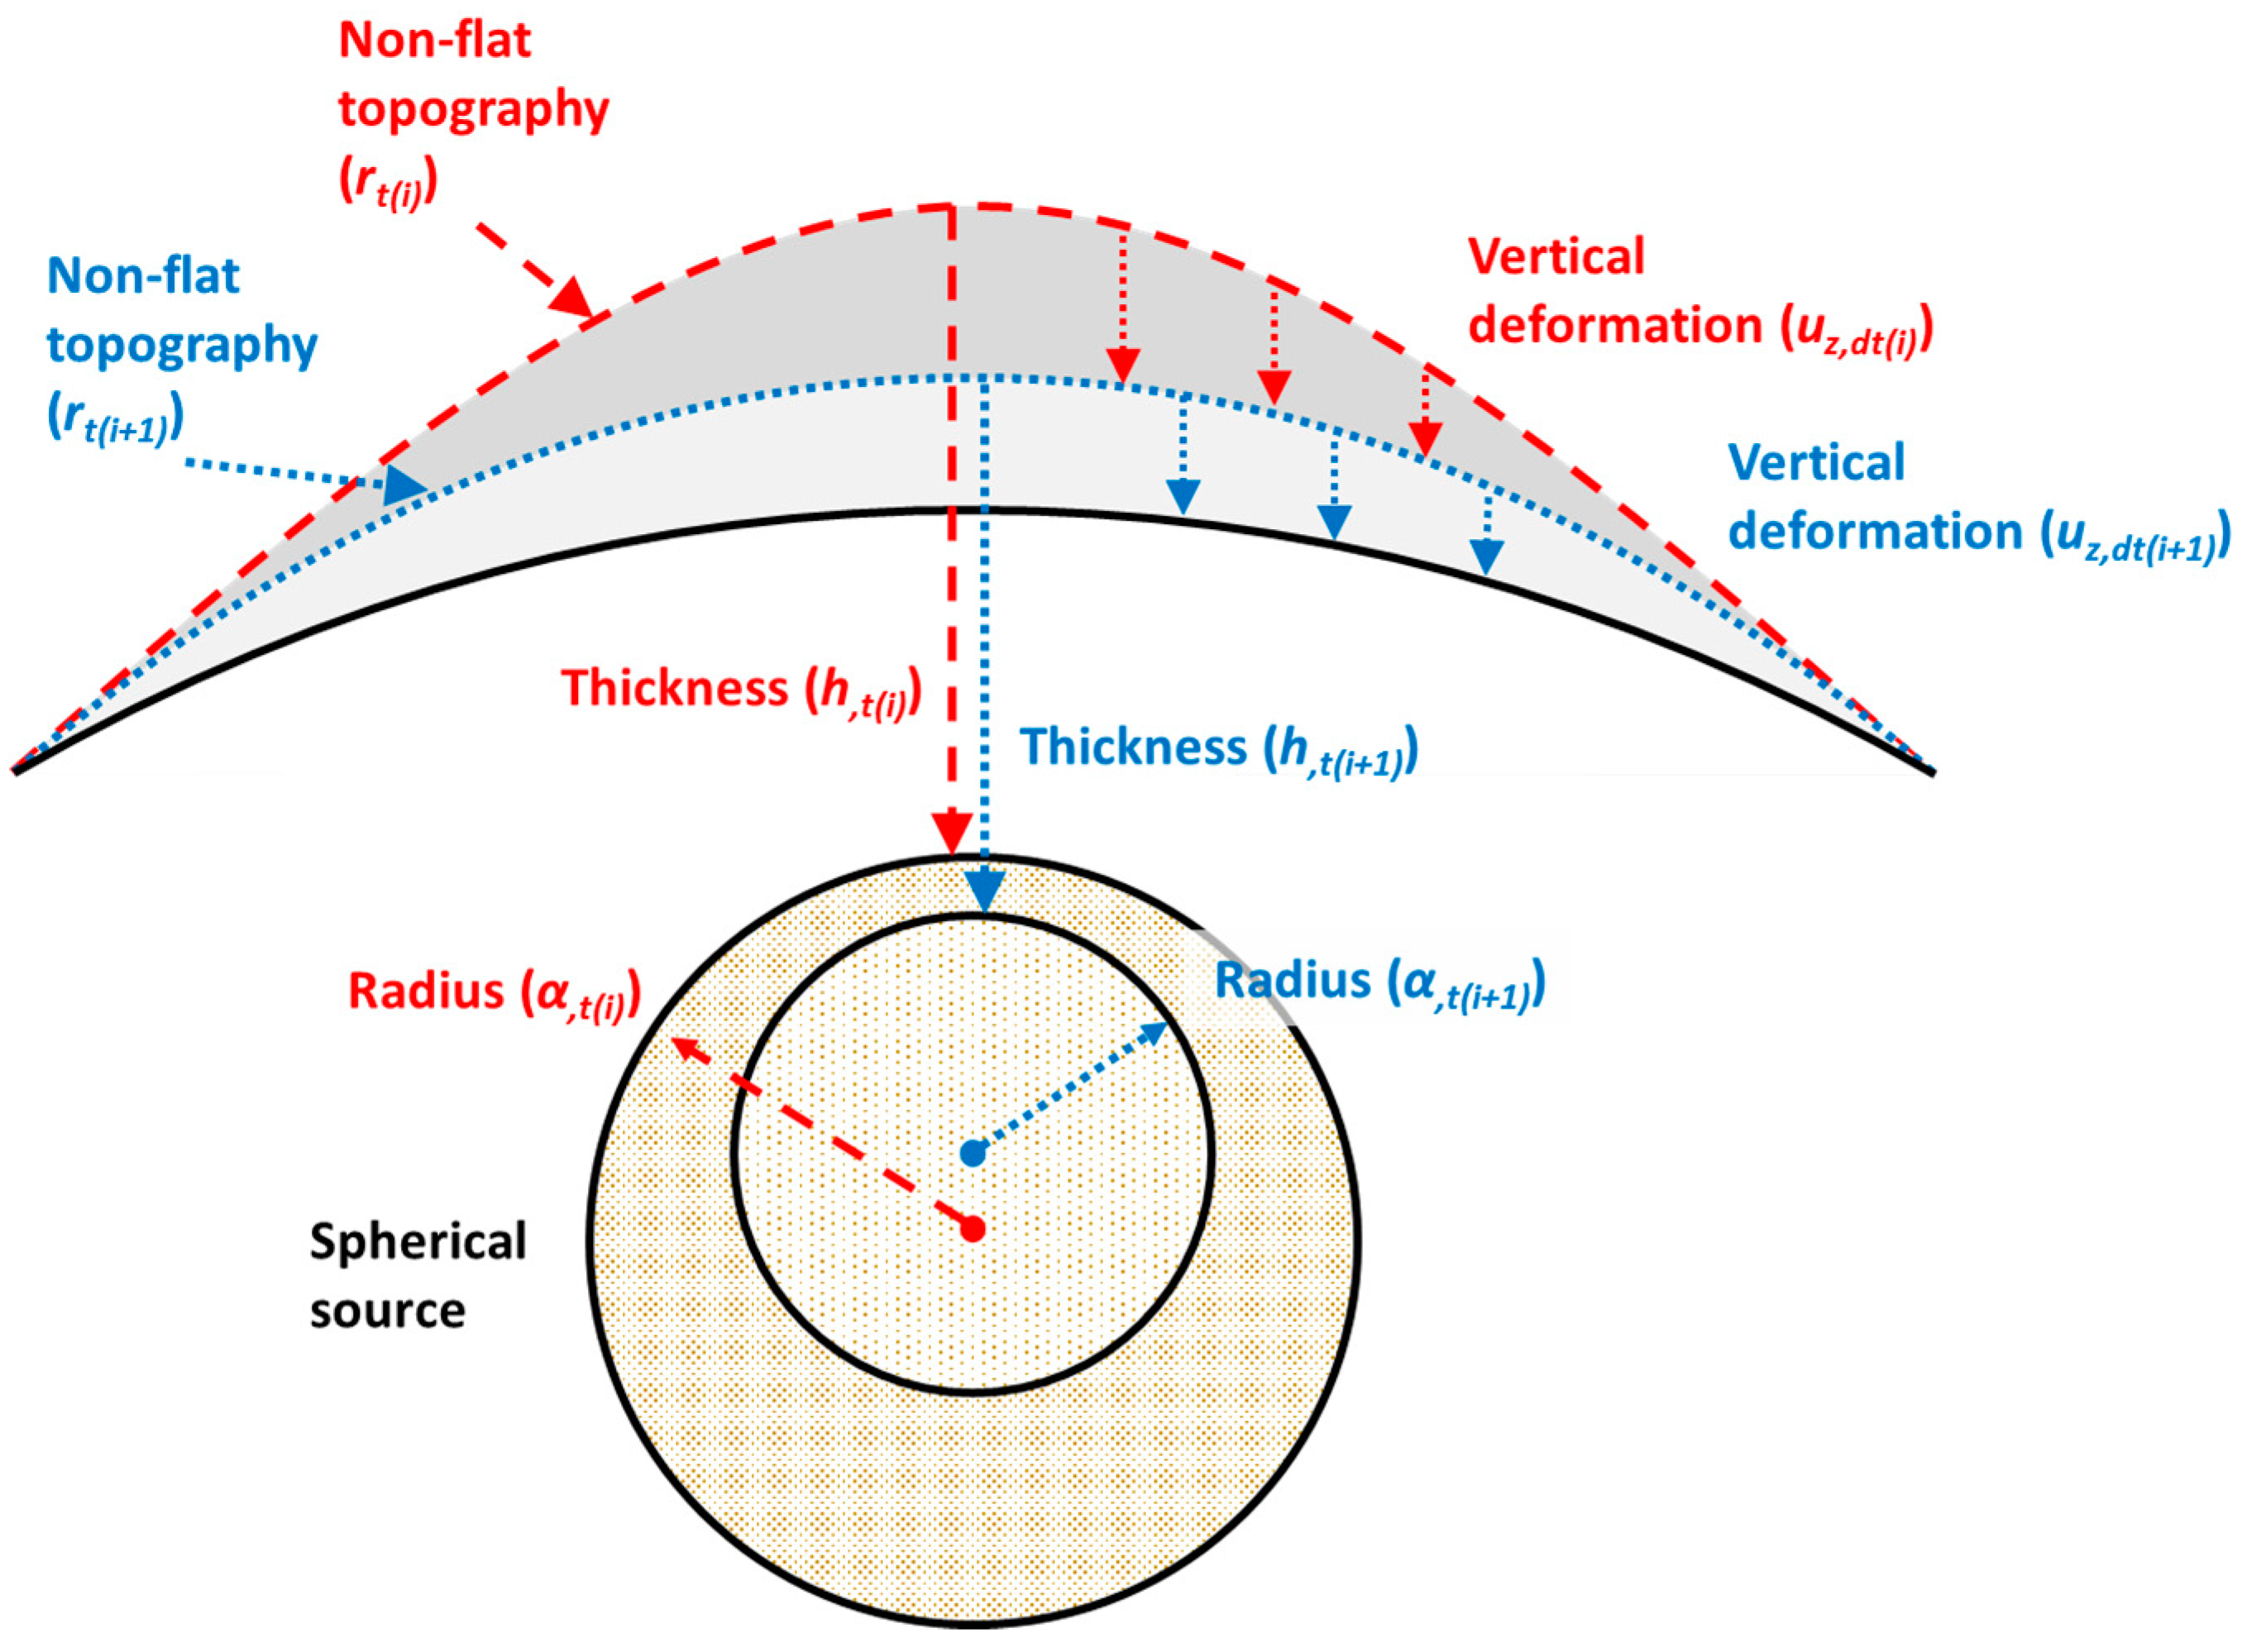
Although a low RMS difference is not necessarily an indication of the validity of the model, we were able to fit the observed deformation with reasonable numbers. Nevertheless, this simple model alone cannot determine the actual shape of what is certainly a more complicated bathymetry, and we can only postulate the extent of grounding using the radius of a pressure source. In this context, we suggest that the initial ice thickness can be defined as the difference between depth and radius, as shown in
Figure 8. Thickness change can then be derived as the variation of thicknesses at different time durations, though only when there are at least three independent observations of the surface. However, this interpretation must be approached carefully because the thickness change is valid only if a pressure source is located at the same center.
According to the optimization result, the ice thickness was 711.64 ± 14.25 m and 683.76 ± 12.48 m in 2011 and 2012, respectively. This is quite different from the known ice thickness of the Thwaites ice shelf near the grounding line (~1 km), despite the low vertical resolution of the radar sounder used for such measurements [
7]. This indicates a thickness decrease of 36.17 ± 17.27 m during that one-year period. However, as the center of the pressure source in 2012 was located 341.96 m upstream and 210.10 m to the west from that in 2011, it is difficult to substantiate the thickness and thickness change with the obtained datasets. Our results for the surface depression and thinning of the ice rumple in the Thwaites ice shelf were much higher than that previously reported. It is rather surprising to observe such high (>10 m) surface depressions in an ice shelf in such a short time; Rignot et al. [
30] and Paolo et al. [
14] reported that the thinning rate of the Thwaites ice shelf was 6.13 and 2.80 m/year, respectively. A major factor contributing to these differences may be related to the extent of the survey area, which was over 4000 km
2 (the entire ice shelf) for the other studies as opposed to a few km
2 focusing on a single ice rumple in our study. Besides, strong circulation near the grounding area might have caused this large localized basal melting. Thus, it should not be assumed that our results represent the overall thinning of the entire ice shelf.
Despite this narrow focus on a local change, such progressive thinning may cause the un-grounding of a pinning point and the acceleration of the entire ice shelf [
7], meaning it is important to realize when this has happened. Based on the Landsat imagery time series in
Figure 7, un-grounding might have taken place sometime after 2013 due to the disappearance of the surface features. It is unclear at this point whether progressive unpinning of the ice rumple caused an increase in ice velocities of the Thwaites ice shelf. However, we suspect that the ice rumple investigated in this study did not have a significant impact on the stability of the Thwaites ice shelf because of the timescale of the observed changes and the already high flow velocity of the ice shelf.
The optimization of the multi-variable problem successfully estimated unknown parameters within the constraints of reasonable values (
Table 1). However, there are still some discrepancies, such as the modelled and measured ice thicknesses. Uncertainties within Young’s modulus and viscosity are possible reasons for such deviations because we only adopted the rheology of the ice shelf based on previous research. It is suspected that the used ice rheology might be different from the actual state of the Thwaites ice shelf or is spatially varying, especially at the exact location of local grounding. Nevertheless, it is still intriguing that the simple viscoelastic deformation model successfully replicated the deformation of the ice rumple in the Thwaites ice shelf with a small RMS difference—the estimated values of the parameters were also plausible. The main cause of the remaining difference is the slight elliptical shape of the deformation, which can take a different form in other ice shelves. In such cases, deformation models for other forms of pressure sources (i.e., sills, dykes [
31], and disks [
32]) could be used to fit the observed deformation.
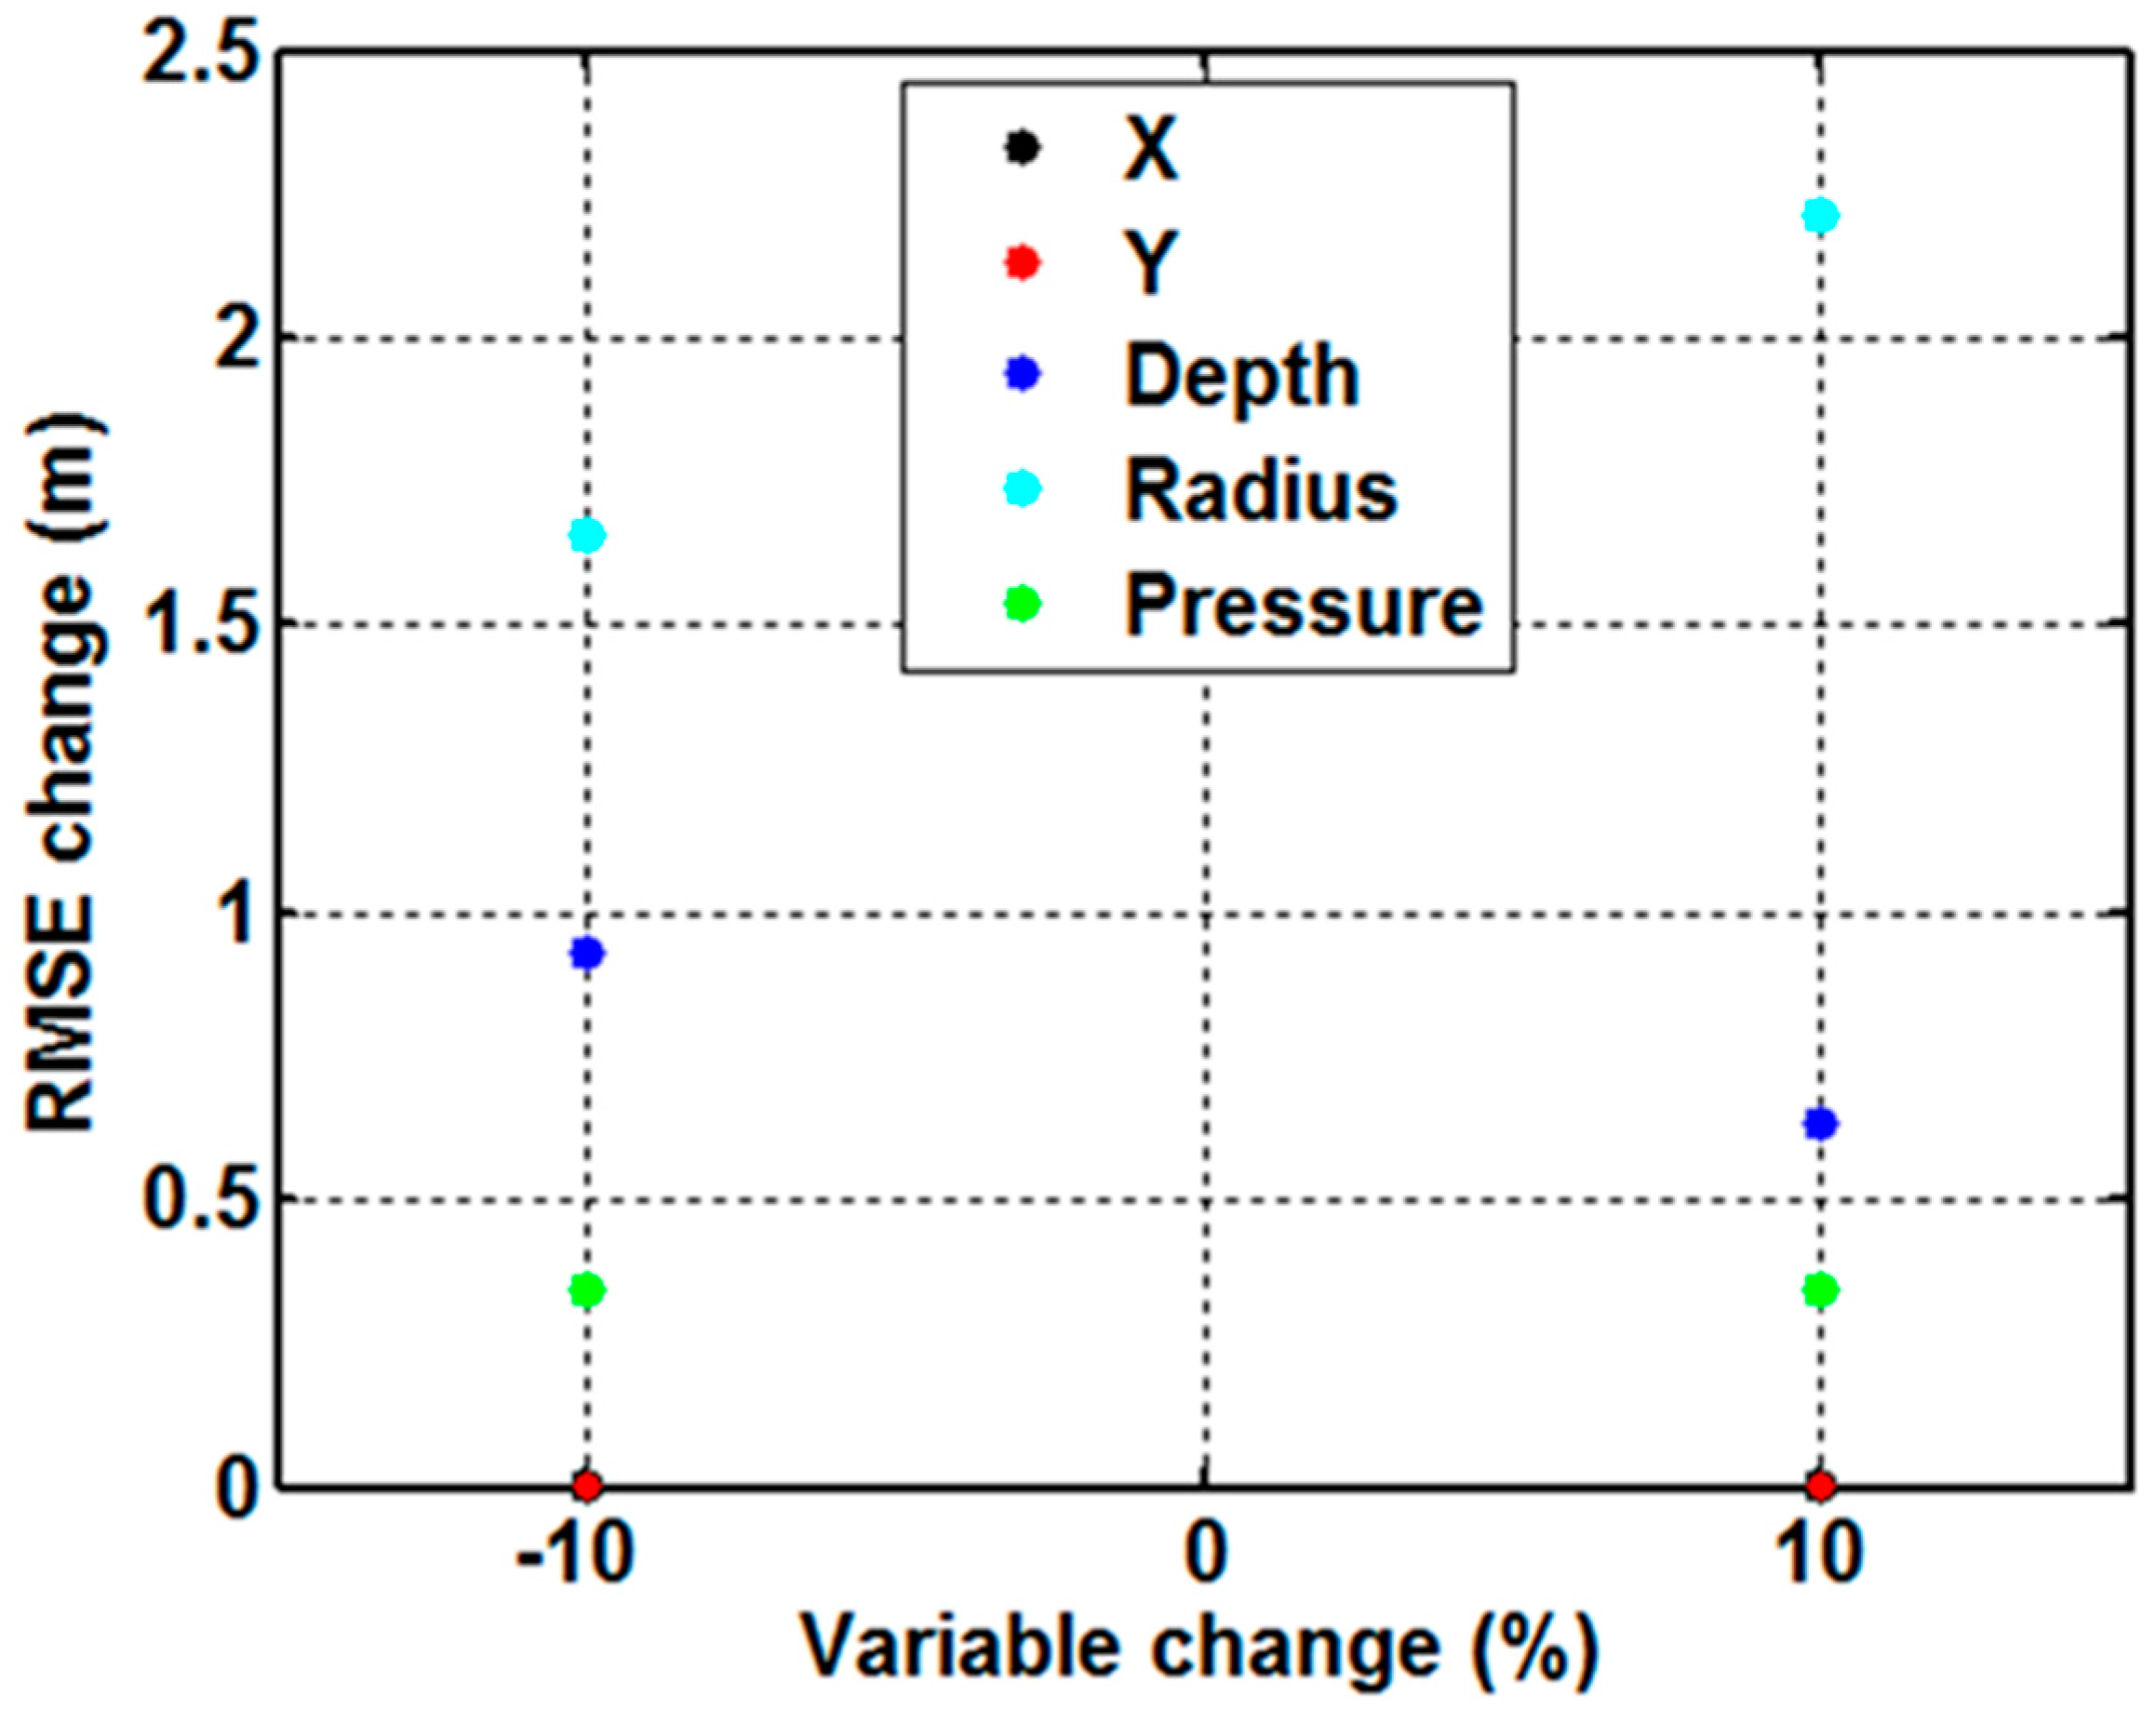
In order to analyze the dominant factor in the optimization result, we conducted simulations of the deformation model by varying the estimated parameters around a nominal value (
Figure 9). The simulation outputs were induced by varying one parameter at a time while keeping all others fixed. The nominal reference values were chosen as the result of the optimization (
Table 1), and the variations were made within 10% from the nominal values. The greatest variation in the result, i.e., the difference between the observed and estimated deformations, came from changing the radius of the spherical source (maximum variations of 1.88 and 2.51 m) from the original RMS difference—the smallest change was observed when varying the location of its center.
5. Conclusions
This study was designed to observe and better understand the transient nature of an ice rumple’s surface elevation. Such detailed monitoring was made feasible for the first time by our use of TanDEM-X and near-coincidental CryoSat-2 data to derive DEMs with sufficient spatial and vertical resolution. Despite the extreme surface conditions of the Thwaites ice shelf, which is heavily crevassed and has high flow velocity, this method has shown the great potential for locating previously unknown small ice rumples, or continuously monitoring such features in other ice shelves.
From 2011–2013, our deformation maps showed the recent fading of a small ice rumple in the surface of the Thwaites ice shelf, West Antarctica. The pinning point was located nearly 5 km offshore from the previously estimated grounding line in 2011, and appeared sometime between 1996 and 2011 when the grounding line of Thwaites Glacier retreated. The deformation pattern we found, along with a time series of Landsat 7 ETM+ imagery, showed that the ice was still in contact with the basal topography as late as 2013 but is likely to have since been unpinned. We then used the deformation maps with the simple viscoelastic deformation model (widely used in volcanic studies) to interpret the surface changes in terms of pressure changes at the bottom of the ice shelf by applying an idealized spherical pressure source. The estimated numbers were reasonable and the ice shelf thickness at the center of the spherical pressure source was also estimated using the depth and radius.
The surface depression and thinning of this ice rumple were found to be much higher than those of previously reported levels for the broader region, though this may be explained by the more local focus of this study (a few km2) compared to other research in this area. Thus, our results may not represent an overall thinning process, but do suggest that significantly strong melting can exist at a local pinning point. Above all, this study contributes to our understanding of the transient nature of rapidly changing ice shelves, such as the Thwaites ice shelf. Our results confirm that DEMs derived from TanDEM-X data have sufficient spatial and vertical accuracy to allow accurate monitoring of fast-moving ice bodies; this approach should be utilized in other regions. In addition, the results of the viscoelastic deformation model have demonstrated the potential to estimate the location of an uncharted pinning point, as well as the ice thickness at the time of the observation. These findings are expected to be of interest to the future modeling of ice shelf instability as initial input data. As several questions still await to be answered regarding this process, more research using an increased number of datasets at different regions will be required.


