1. Introduction
Change detection is used to detect the changed information of the target area by analyzing the multi-temporal images acquired in different periods of the same geographical area. With the rapid development of remote sensing technology, change detection has become an important research topic in the field of remote sensing, and has also been widely used in resource and environmental surveys [
1], environmental monitoring [
2], urban expansion and change information acquisition [
3], land use [
4], fire area survey and disaster detection and assessment [
5], etc. For a geological disaster, researchers can obtain disaster information by analyzing the changed information of multi-temporal remote sensing images without entering the disaster scene. Because landslides seriously endanger people’s property and safety, it is important to study automatic approaches of landslide identification and apply these approaches to mark the location and range of the landslide for mitigating potential harm, assisting post-disaster rescue, and rebuilding. Automatic approaches to landslide identification can quickly provide detailed landslide information including the landslide site, the range, and the degree of disaster without entering the disaster scene. According to the obtained landslide information, rescue and reconstruction work can be effectively carried out to reduce the degree of disaster and personal safety threats and improve work efficiency.
As early techniques used for landslide identification rely on visual interpretation, they are highly labor-intensive and time-consuming. Existing techniques always employ different change detection approaches that compute the difference between pre- and post-event images to achieve automatic landslide identification. The popular change detection approaches can be categorized into three groups: threshold segmentation-based approaches, approaches based on the combination of feature extraction and clustering, and region segmentation-based approaches.
The first group of approaches, i.e., threshold segmentation-based change detection, first computes the difference image of bitemporal images, and then obtains changed regions using a threshold segmentation technique. Nelson [
6] proposed a single-threshold approach used for change detection. Although the approach has a low computational complexity, it is sensitive to noise, and it provides a low accuracy for LM. To improve the single-threshold approach, Jin [
7] proposed a double-threshold segmentation approach and applied it to change detection. Although the double-threshold approach is superior to the single-threshold method for improving the accuracy of change detection, the choice of thresholds is still quite difficult. Moreover, the method has a low robustness for change detection. Based on the previous research, Lv et al. [
8] first computes the difference image by employing multi-threshold segmentation and voting strategy. After that, a region-based image segmentation method is used for obtaining a superpixel result of the post-event image. Finally, the changed regions are obtained by computing the ratio of the number of pixels belonging to the foreground or background. The multi-threshold segmentation is able to provide better results for change detection, but it has a high computational complexity and requires more parameters. Clearly, change detection approaches based on threshold segmentation [
9,
10] are simple and fast, but they generate changed regions only depending on the grayscale value of images. They cannot obtain accurate detection results because the statistical features of image and spatial information are missing. Therefore, it is difficult to obtain accurately changed regions using threshold approaches.
Compared to the first group of approaches used for change detection, the second utilizes the combination of feature transformation and clustering to achieve change detection. Dong et al. [
11] proposed a change detection approach based on the combination of discrete wave transform (DWT) and fuzzy c-means (FCM). First, DWT is used to obtain the frequency feature of bitemporal images. The changed regions are generated by computing the minus value and ratio value of images transformed by DWT. After that, the lower-half frequency components of the minus image and the higher-half frequency components of the ratio image are fused to enhance the contrast of the changed regions and the unchanged regions. The inverse discrete wave transform (IDWT) is then used to generate the final difference image. Finally, FCM is used to obtain changed regions. However, DWT only extracts image features with a single-scale and a single-phase. Because Gabor is able to extract image features of multi-scale and multi-phases, it is more popular than DWT for image transformation. Li et al. [
12] employ Gabor to extract the texture features of an image instead of DWT. Then, the difference image is obtained by computing the difference of bitemporal images processed by Gabor. Finally, a clustering method is used to extract the changed regions. Because the local spatial feature of images is exploited, the approach is superior to DWT-based approaches for change detection. To obtain a better difference image, Zheng et al. [
13] applied a logarithm operation to the ratio of bitemporal images to improve the difference image. Moreover, the saliency map of a post-event image is used for guiding the detection of changed regions. Finally, a
k-means is used to detect the truly changed regions. Though the approaches based on the combination of feature transform and clustering [
14,
15,
16] provide better results than threshold segmentation-based approaches for change detection, these approaches are only suitable for images that have a clear difference between high frequency and low frequency, but unsuitable for many remote sensing images because of the complex background, texture, and illumination of images [
17]. They usually fail to detect changed regions for images that have a complex background and blurred edges. Besides, these methods are sensitive to noise because fuzzy clustering algorithms are sensitive to noise [
18,
19].
The third group of approaches achieves change detection using region-based segmentation and the attributes of regions such as the ratio of length and width of objects, the shape of objects, the slope of objects, etc. The advantage of this kind of method is that it is insensitive to noise and is able to provide better contours. Zhang et al. [
20] proposed a method of object-based change detection for high-resolution remote sensing images in urban areas. The method firstly employs region-based image segmentation to obtain the spatial attributes of objects. Then, the relationship between the spatial attributes of objects and characteristics of changed regions is explored to achieve change detection. However, the method proposed by Zhang et al. requires complex region descriptors to constrain changed regions. Ren et al. [
21] compared pixel-based methods to region-based methods to demonstrate that the latter is able to provide better results since the region attribute is exploited and falsely-changed regions are removed. To overcome the problem, Lv et al. [
22] proposed an object-based expectation maximization (OBEM) post-processing method to obtain truly-changed regions while removing falsely-changed regions. The method uses multi-scale segmentation to obtain region attributes and uses an expectation-maximization (EM) algorithm to compute truly-changed regions. Although change detection based on region segmentation has some advantages, the global information of images is missed, and manual feature descriptors are required [
23]. More approaches used for change detection are reported in References [
24,
25,
26].
Landslide mapping (LM) is an important research topic in change detection [
27,
28]. However, it is difficult to directly use change detection approaches to achieve LM due to the irregular texture, shape, and size of landslide regions. Therefore, the common approaches used for LM usually include two steps. First, change detection is used to obtain candidate landslide regions, i.e., coarse regions [
8]. Second, an image post-processing approach is used to optimize the obtained landslide regions [
9,
10]. However, it is difficult to obtain effective candidate landslide regions [
8]. Two difficulties in the problem need to be addressed. One difficulty is that the candidate landslide regions are obtained by computing the difference results of bitemporal images; the difference image only depends on the grayscale values of pixels but misses the structuring information of images. The other difficulty is that the existing approaches for LM have a clear high computational complexity for very-high resolution (VHR) remote sensing images.
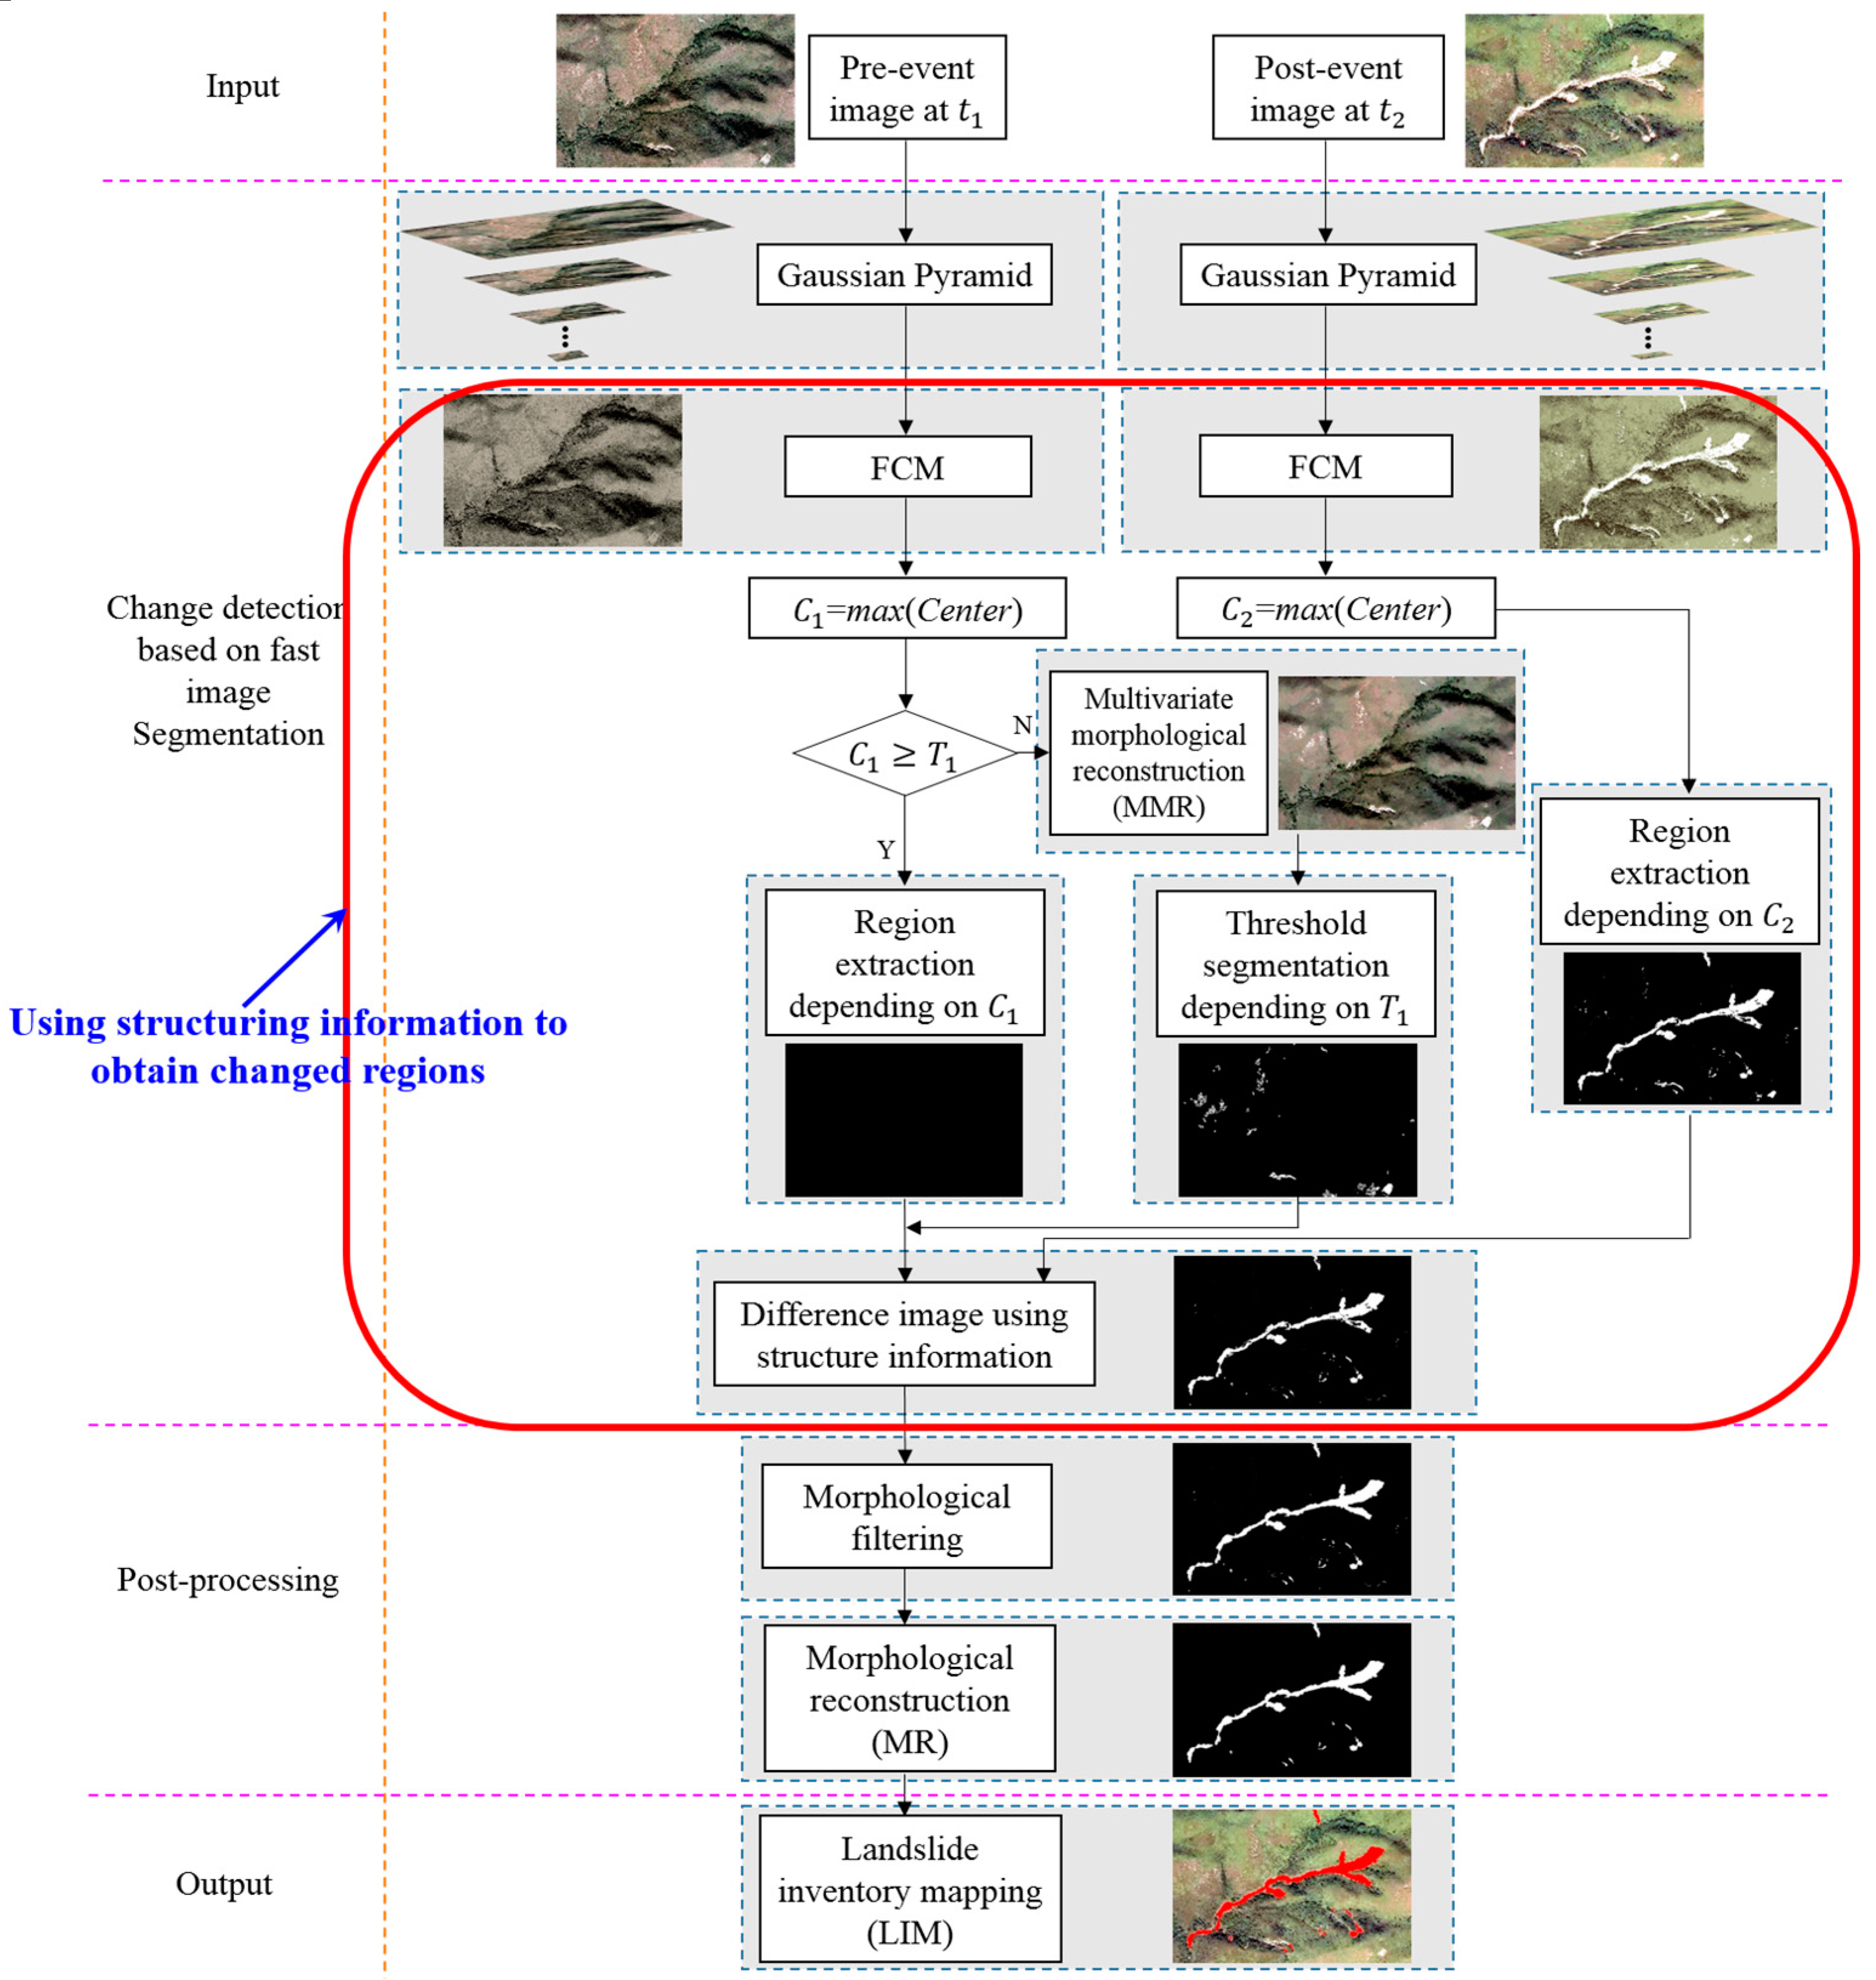
To address the issues mentioned above, we propose a change detection approach based on fast FCM clustering (CDFFCM) and apply it to LM. The proposed method has two advantages:
- (1)
The difference image provided by the proposed CDFFCM is insensitive to illumination, noise, and environmental change. Furthermore, a large number of falsely changed regions are removed and truly changed regions are filled due to the incorporation of local spatial introduction and global image features.
- (2)
The proposed method has a low computational complexity because the Gaussian pyramid is able to remove the data redundancy of images for FCM. Moreover, the post-processing is fast because it is performed on binary images.
2. Motivation
According to the spectral characteristics of landslides, the grayscale value of pixels belonging to landslides is large. We can, therefore, obtain landslide regions using image segmentation. It is well known that threshold segmentation [
29] is the simplest and the fastest approach for image segmentation. However, it is also the least effective because it is difficult to obtain a good segmentation result for the threshold segmentation. At present, a large number of intelligent segmentation algorithms, such as the active contour model [
30], watershed [
31], random walker [
32], graph cut [
33], spectral clustering [
34], FCM [
35], Gaussian mixed model [
36], fully convolutional network (FCN) [
37], etc., have been widely used in image segmentation. These algorithms can be categorized into four groups: partial differential equation (PDE)-based algorithms, region-based algorithms, graph-based algorithms, and pixel-based algorithms. Different algorithms are suitable for different types of image. As the computational complexity of most image segmentation algorithms is influenced by the image size, it is important to design a fast segmentation algorithm for VHR images.
Generally, PDE-based approaches [
38] require prior information, i.e., an initial level set function, these approaches are noneffective for images with a complex background. Region-based approaches [
39] usually rely on the quality of gradient images, but it is always difficult to obtain a good gradient image for remote sensing images due to noise and the complexity of the earth’s surface. Graph-based approaches [
40,
41,
42] usually rely on the construction of an affinity matrix. However, a high-resolution image usually corresponds to a huge similarity matrix, and the eigenvector decomposition of the matrix is time-consuming and memory-consuming. Although pixel-based segmentation approaches [
43] are sensitive to noise, they are able to obtain more accurate segmentation results than the previous methods for high-resolution remote sensing images. In this paper, FCM is employed to obtain segmented bitemporal images that can be used for subsequent change detection.
2.1. Motivation for Using Image Structuring Information
Although a great number of change detection approaches [
6,
7,
8,
11,
12,
13] have been proposed in the past decades, most of these approaches rely on the difference result obtained by bitemporal images and threshold segmentation. These approaches are thus complex and inefficient.
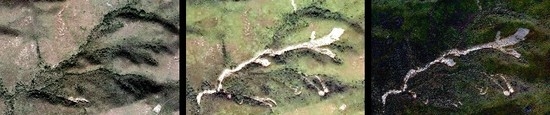
Figure 1 shows the bitemporal images and their difference image.
For
Figure 1c, some popular approaches obtain changed regions using threshold segmentation. The segmentation result is sensitive to the threshold as shown in
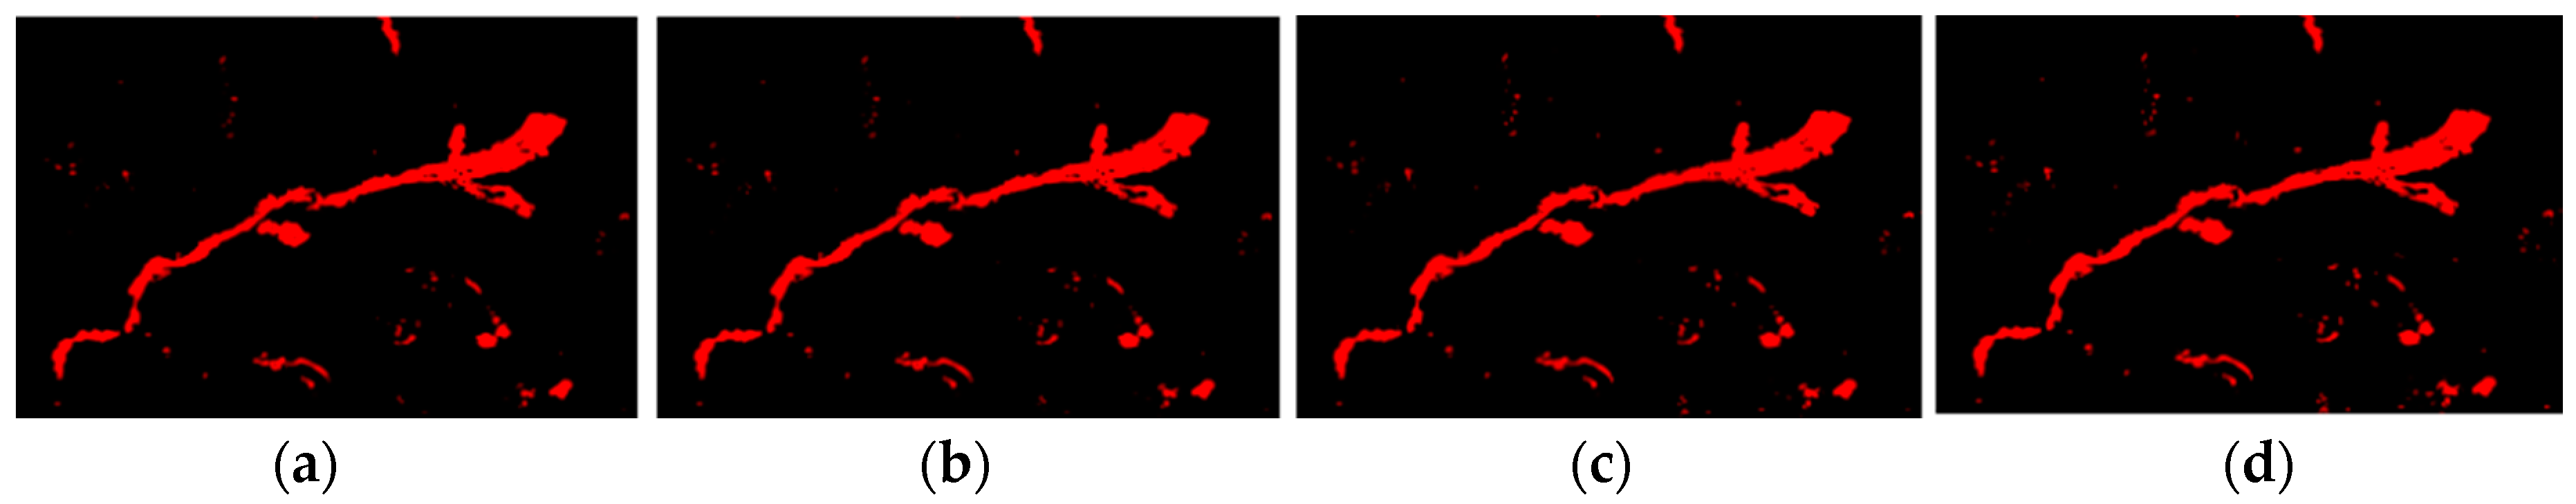
Figure 2.
To address the issue, Lv et al. [
8] employ multi-thresholds and voting technologies to achieve change detection. Although the approach is superior to a single threshold, more parameters are necessary. Actually, it is a multi-threshold image segmentation approach by introducing local spatial neighboring information. Moreover, the approach is also sensitive to parameters. Therefore, it is unable to overcome the drawback of a single-threshold for change detection. To address the problem, we proposed a clustering-based image segmentation approach used for change detection. Although the difference image of bitemporal images is complex, as shown in
Figure 1c, the structuring information of the bitemporal image is similar. We try to compute the difference image using the structuring information of images instead of the grayscale value. We have known that image segmentation is able to address the problem because the segmentation result of an image includes rich spatial structuring information that is useful for change detection.
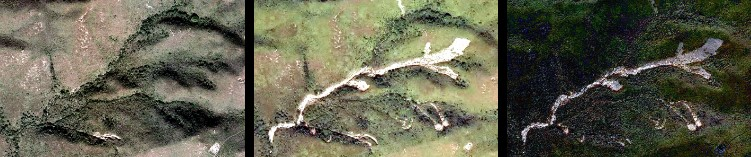
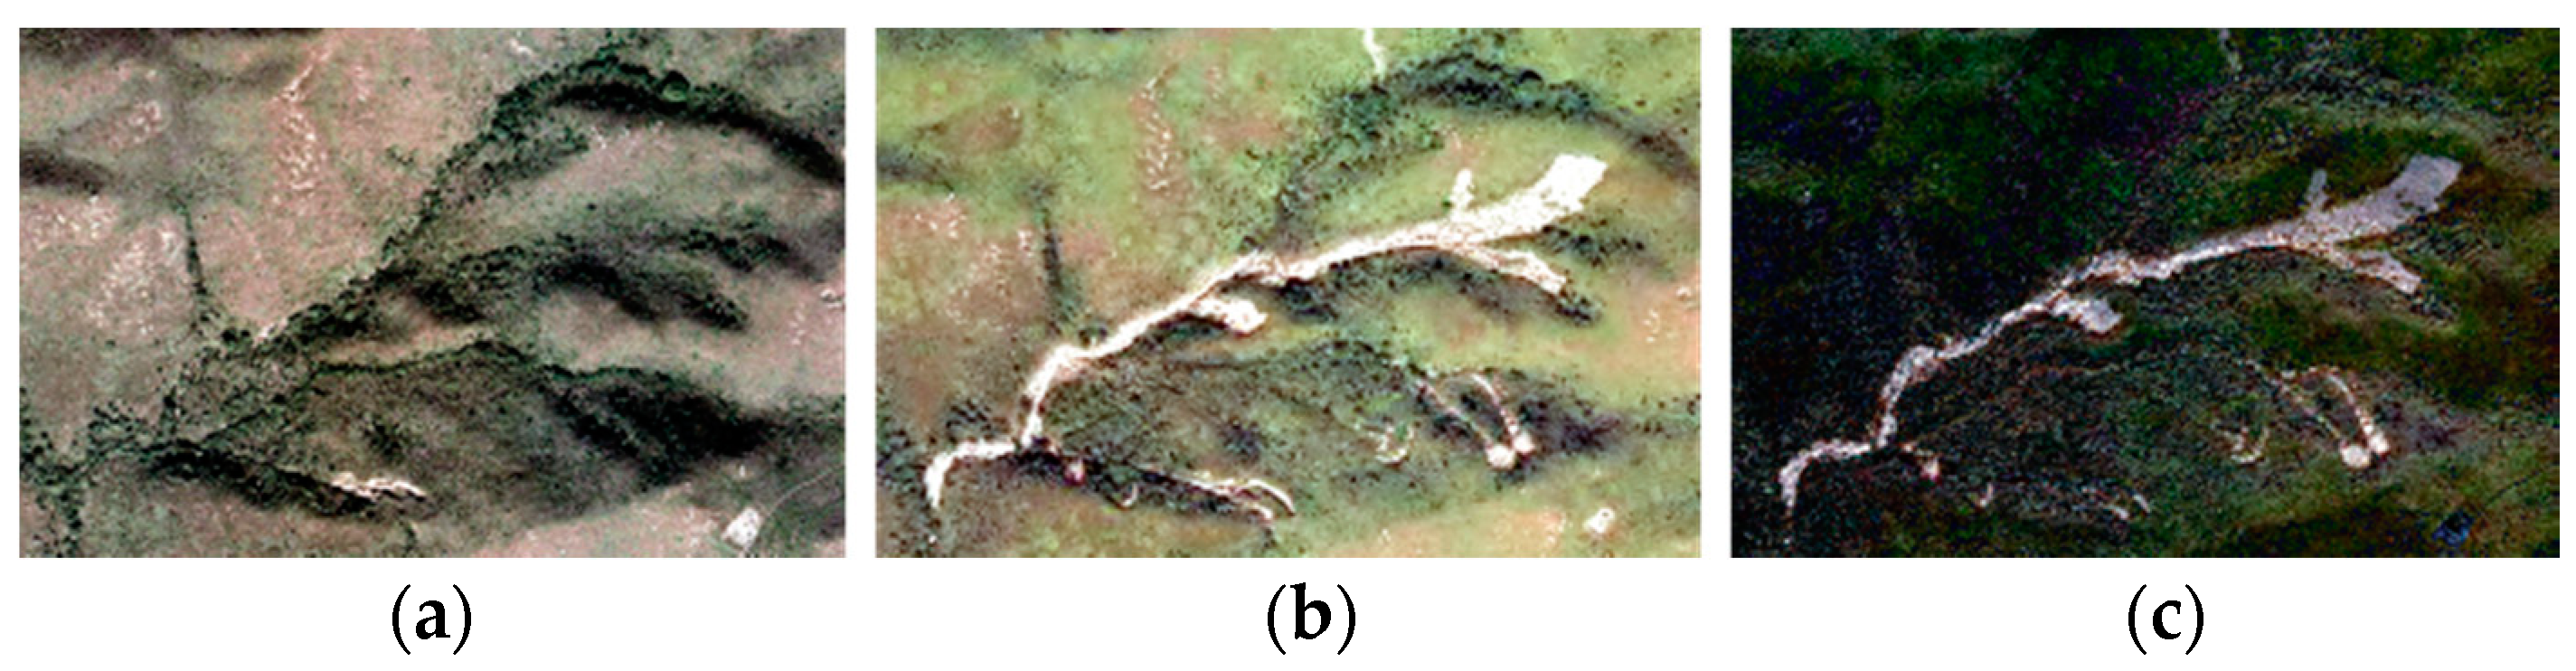
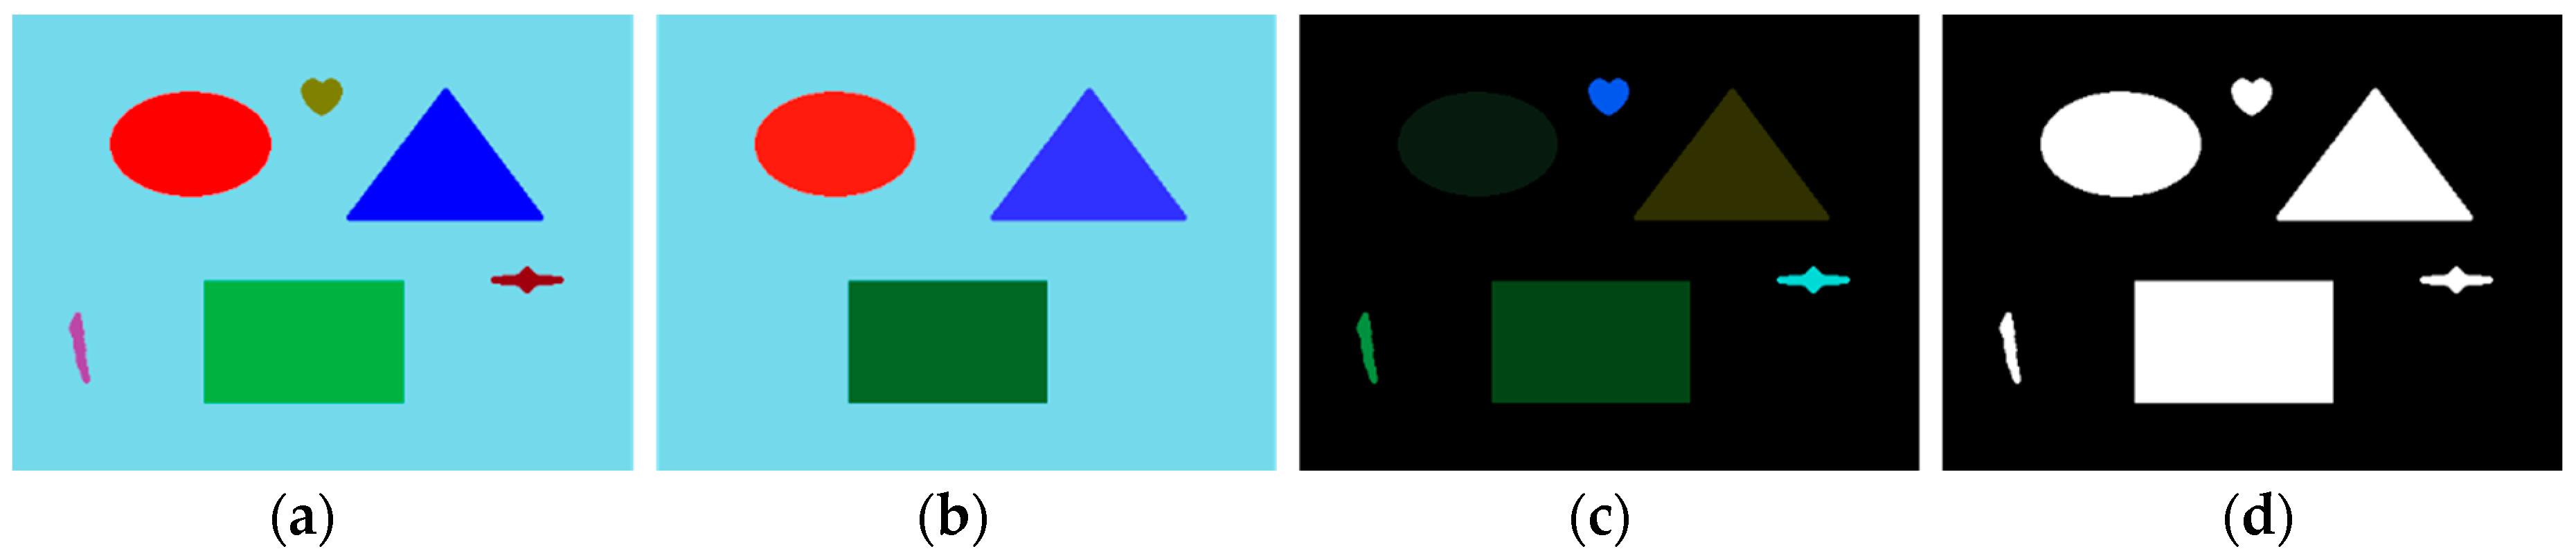
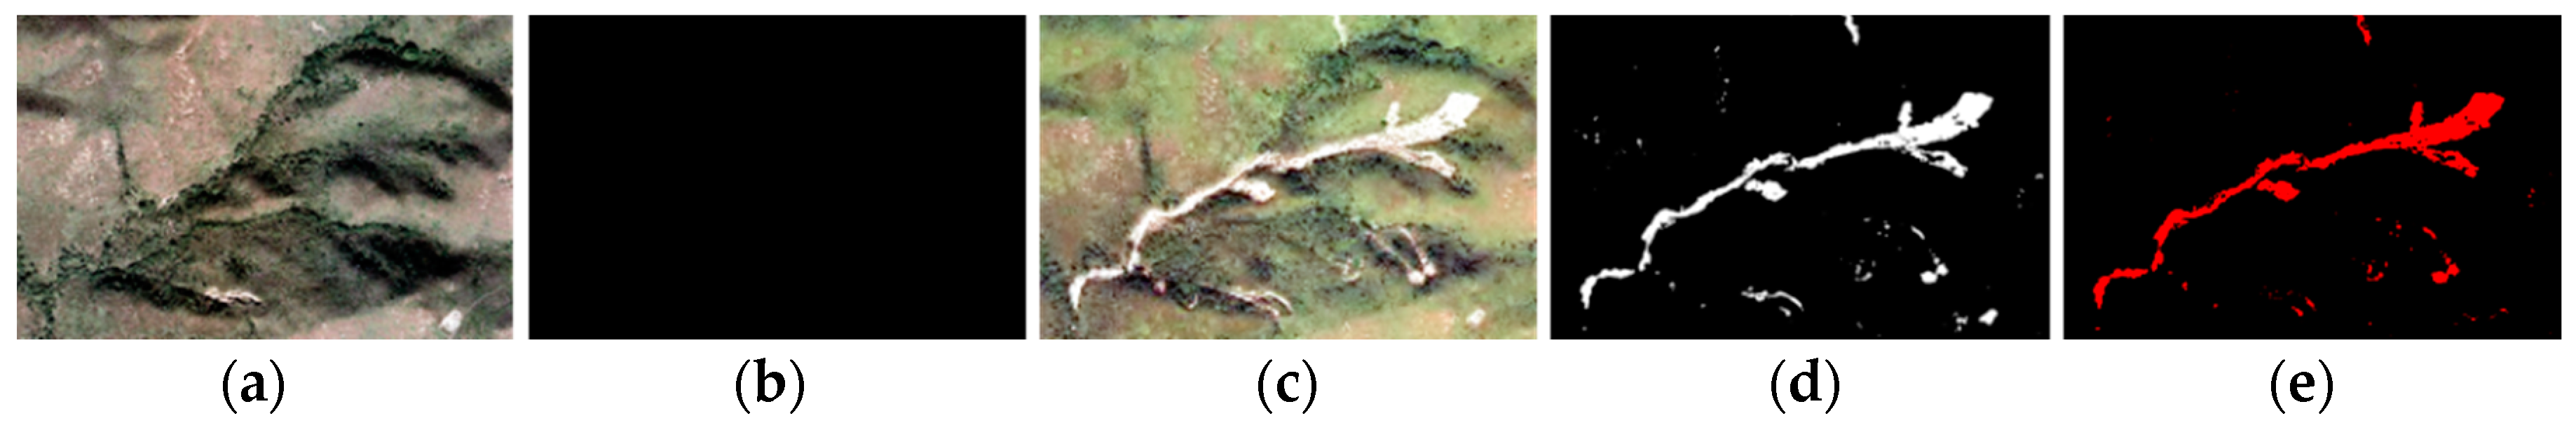
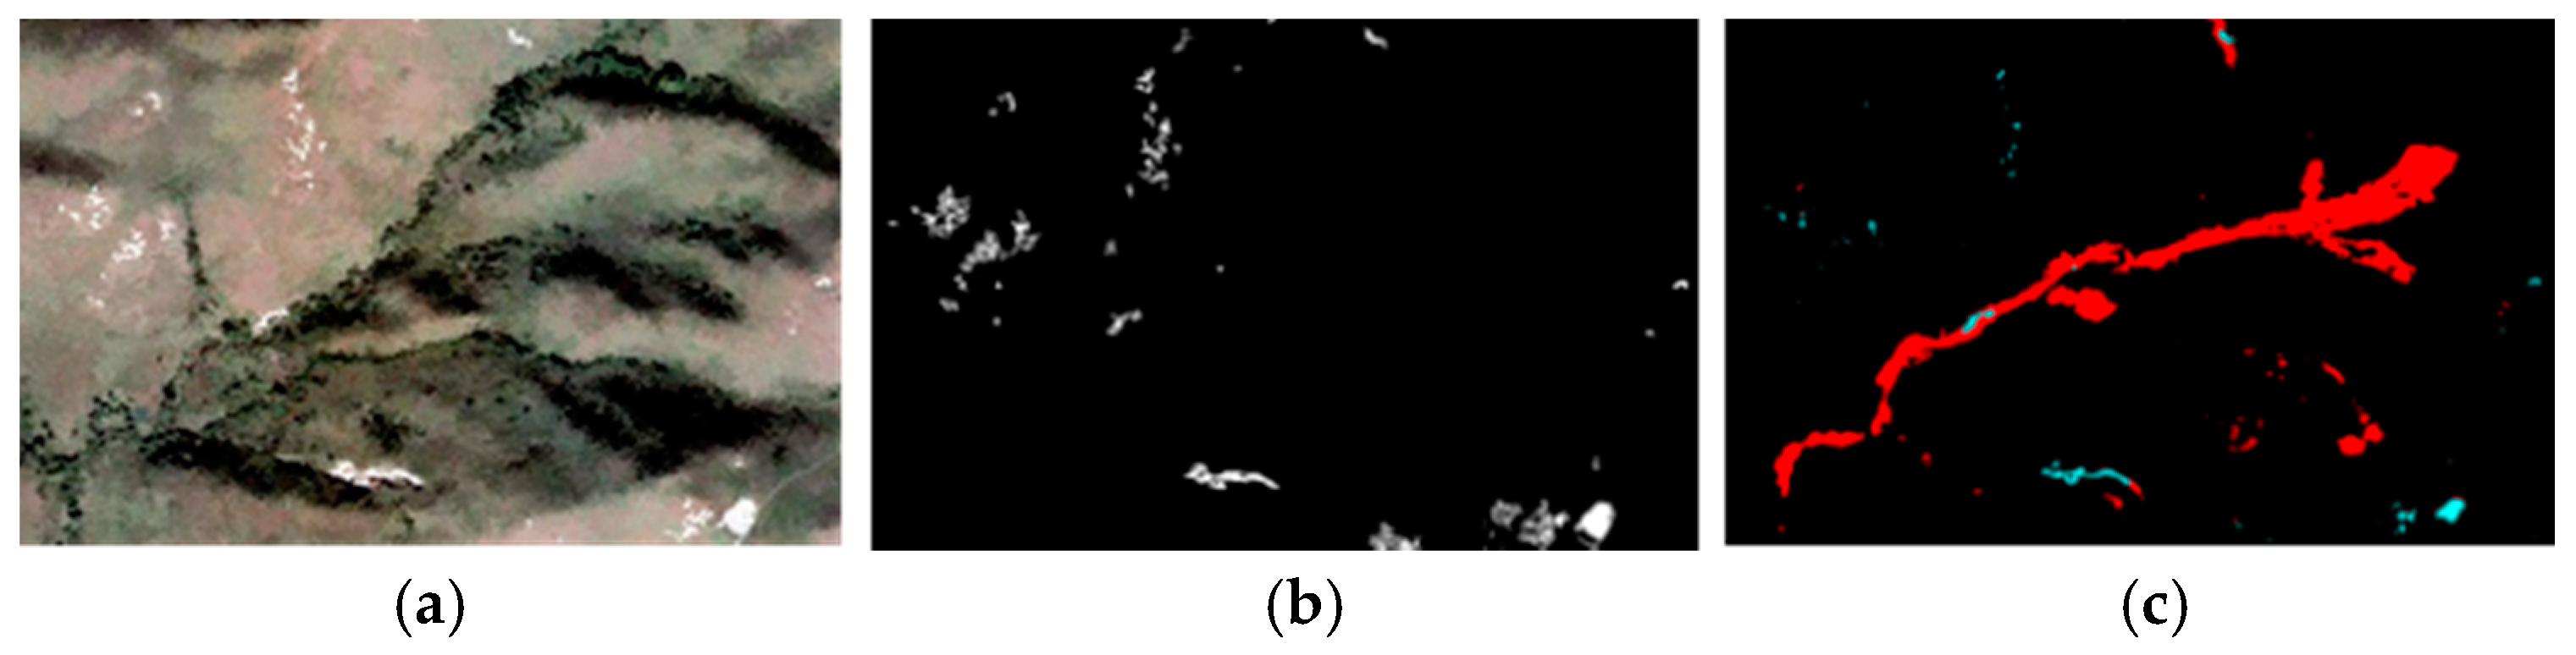
To show our motivation for change detection,
Figure 3 shows change detection based on the difference in grayscale value. It is clear that the difference image is sensitive to the change in grayscale value. To overcome the drawback,
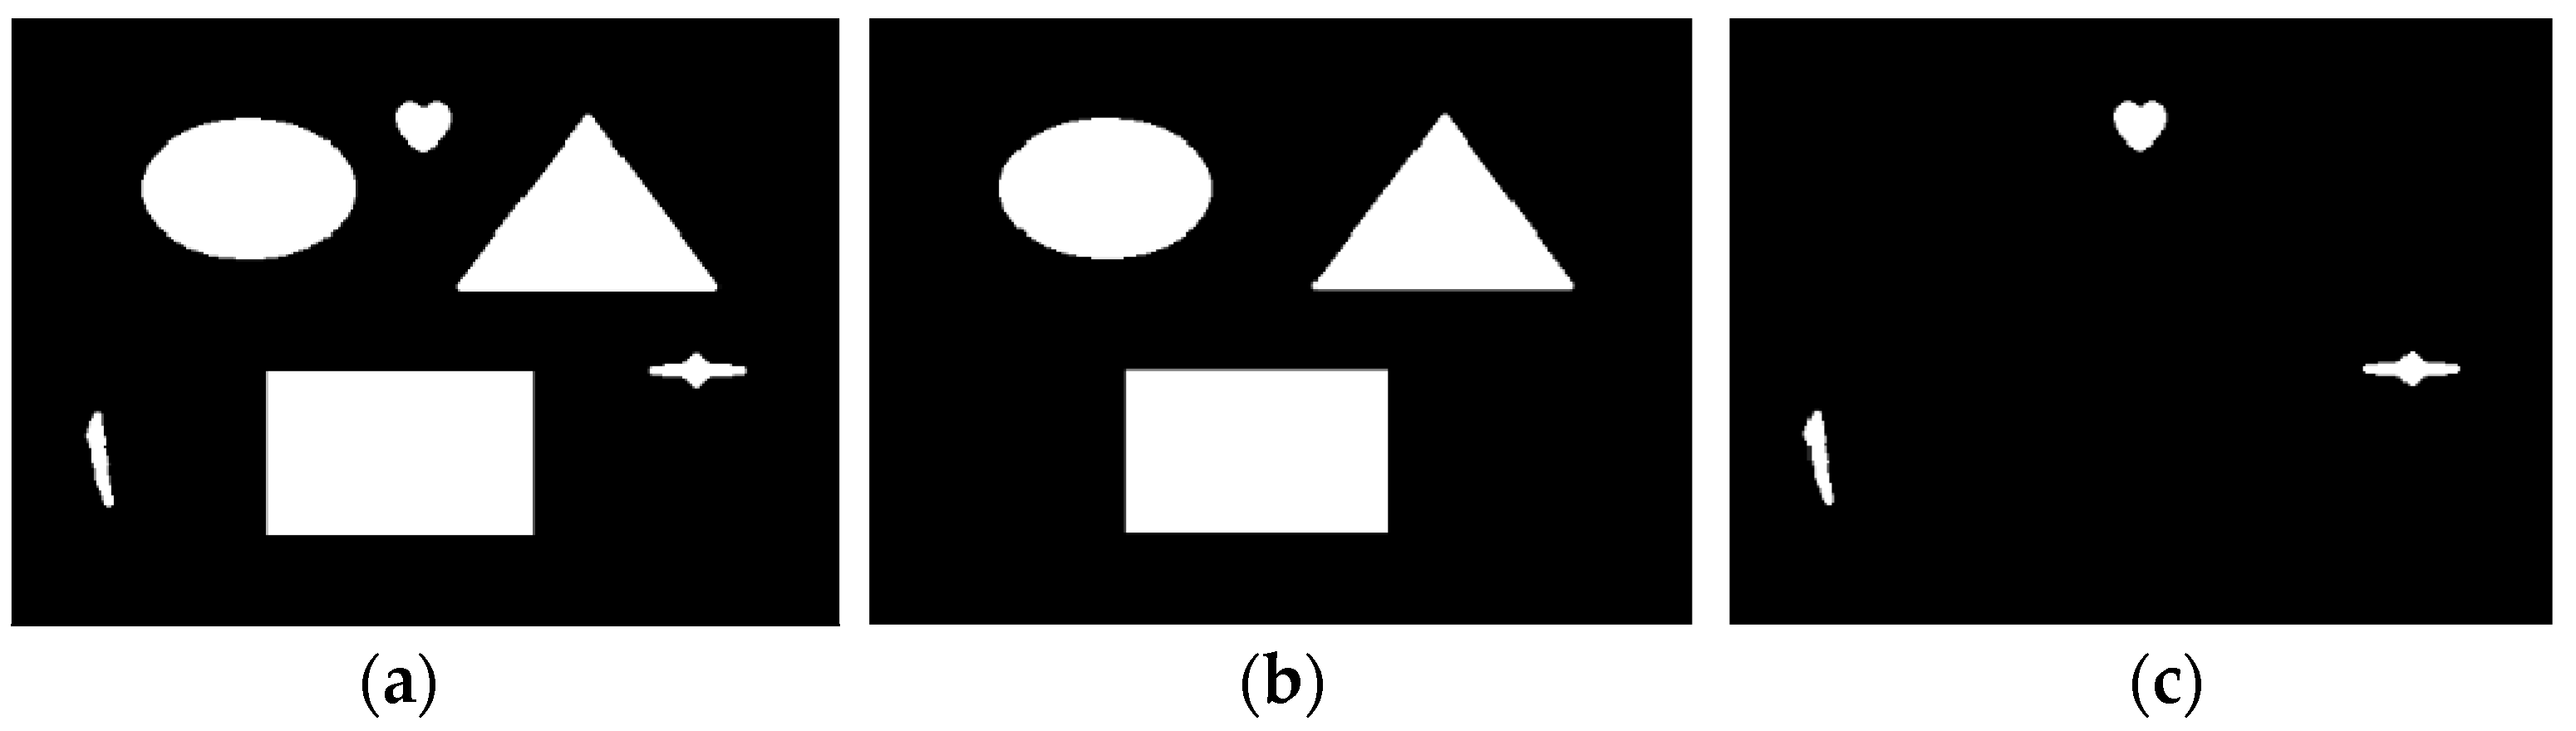
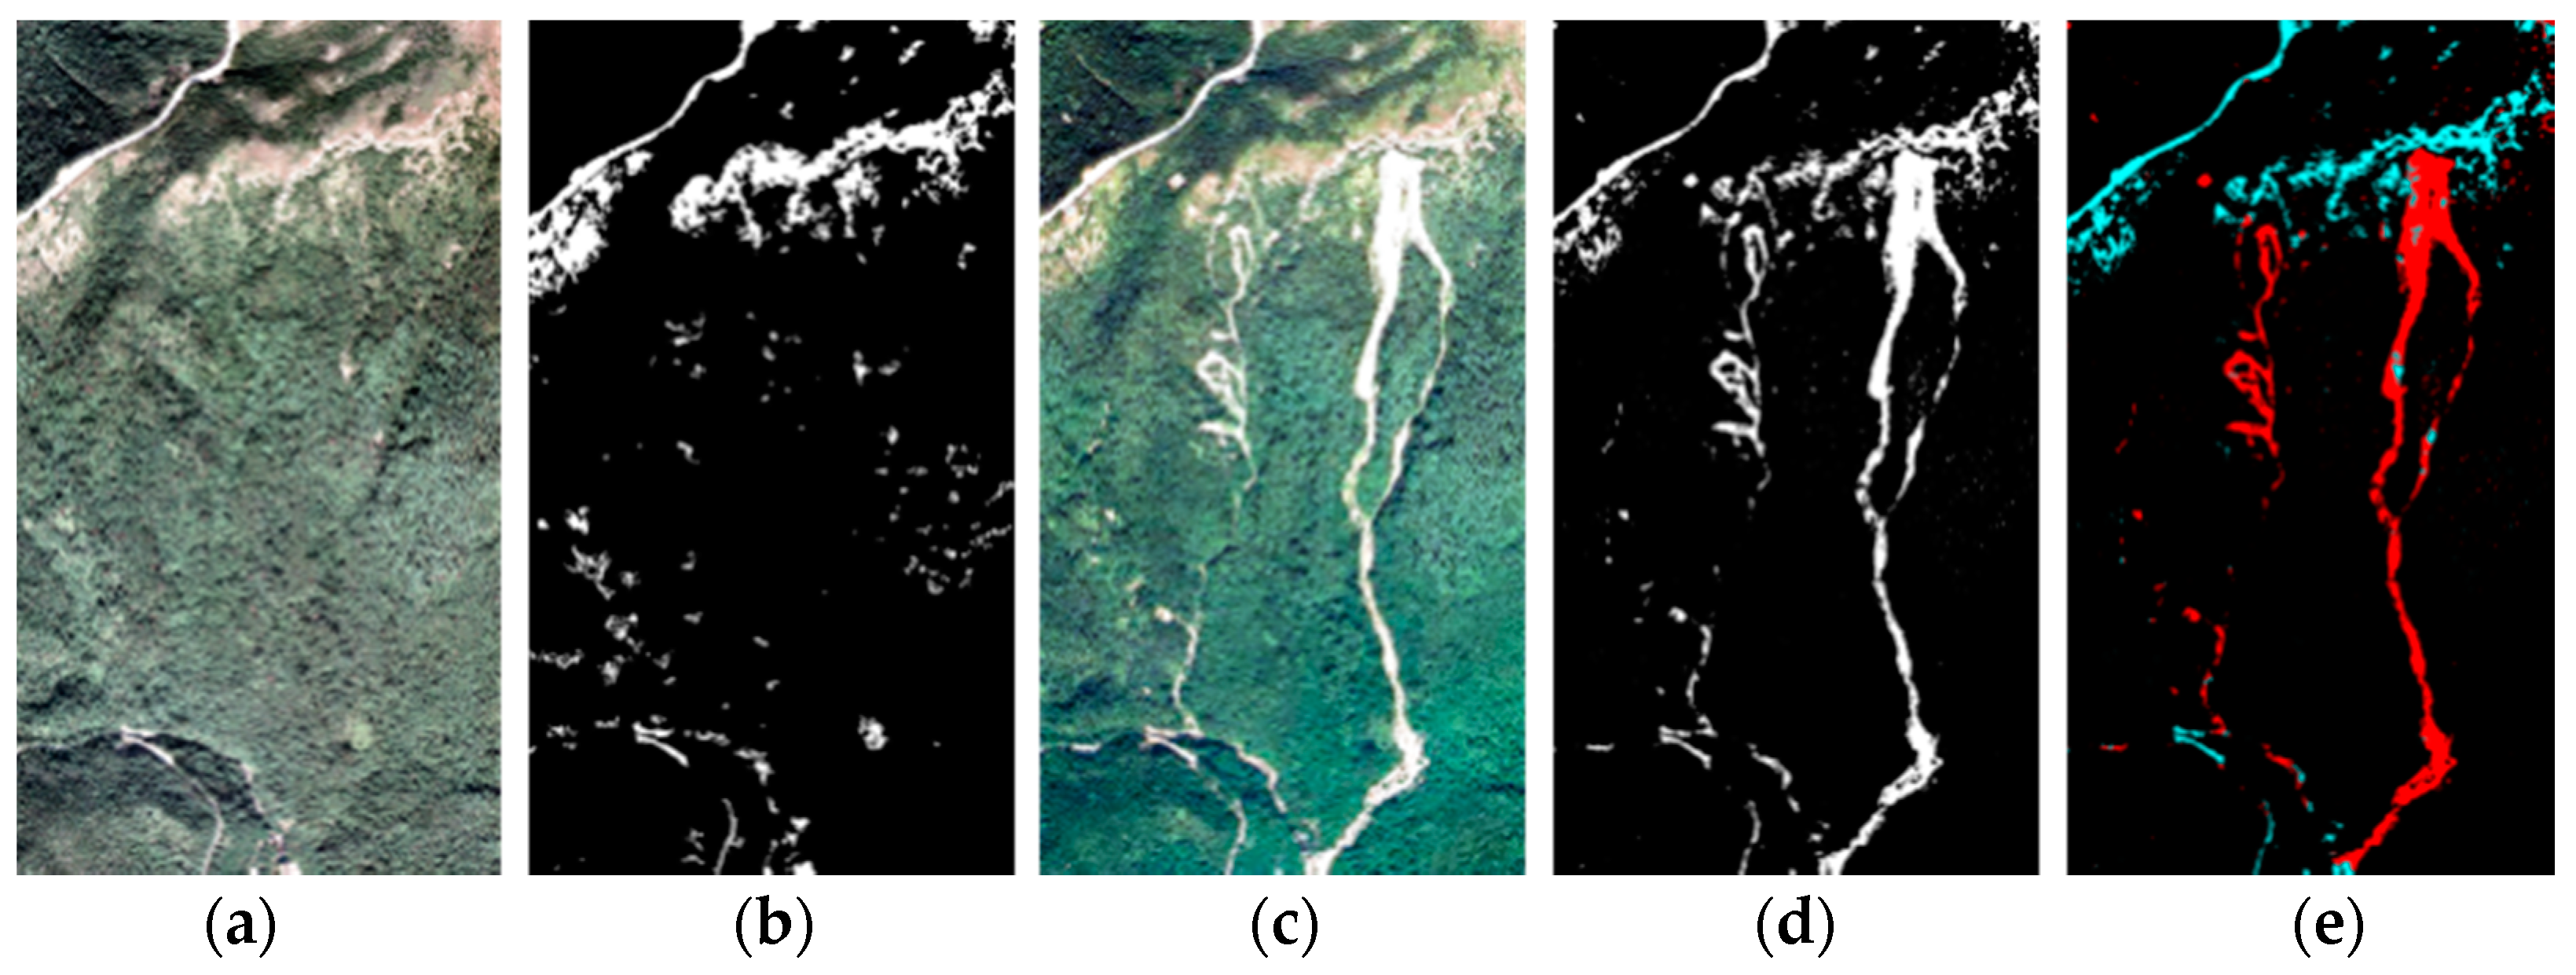
Figure 4 shows the effect of employing image structuring information for change detection.
We can see that
Figure 3d includes falsely-changed regions because the difference image is sensitive to the change of grayscale values.
Figure 4c shows a better result than
Figure 3d due to the utilization of the structuring information for the images in
Figure 4c. Consequently, we can achieve a novel clustering-based image segmentation approach that is able to obtain accurately-changed regions by computing the structuring difference between bitemporal images.
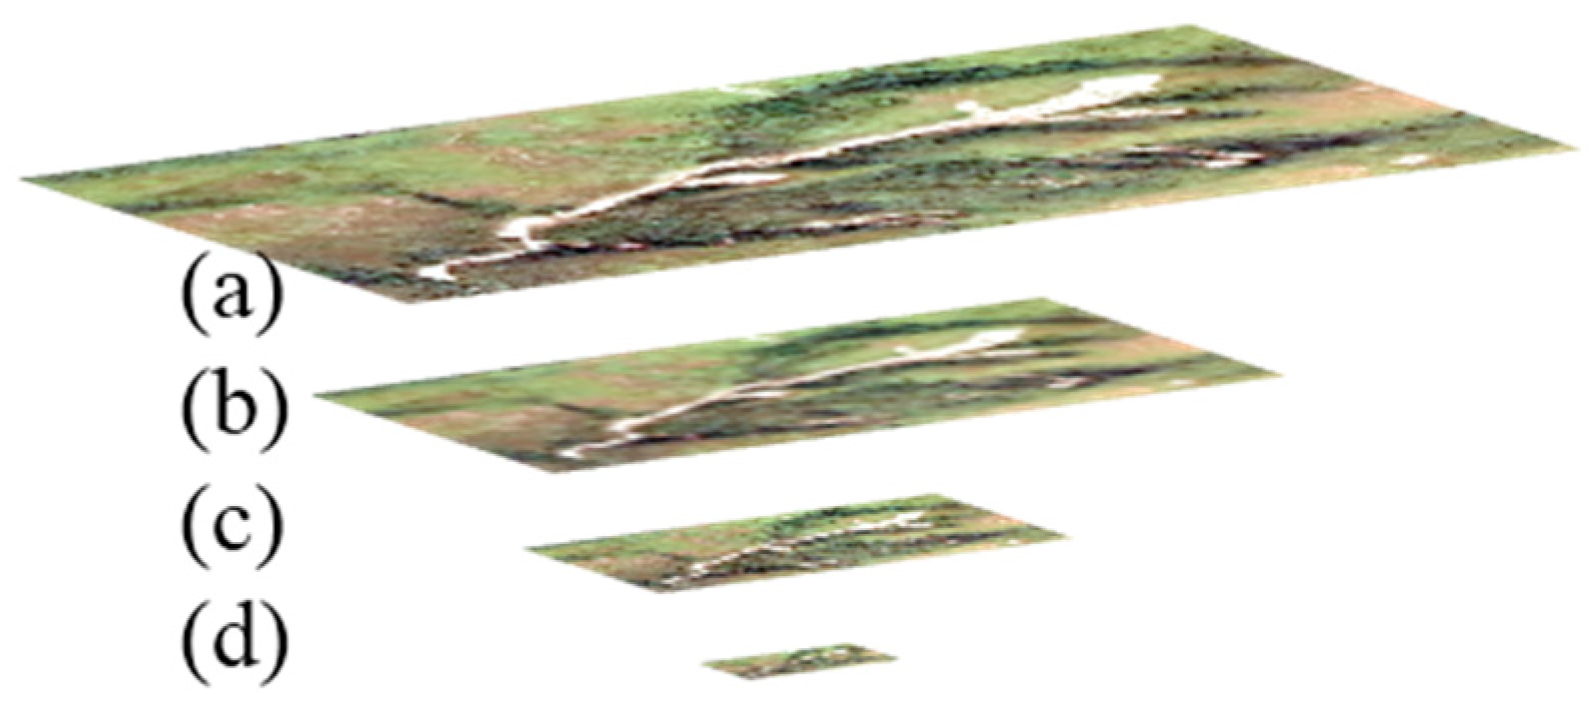
2.2. Motivation for Using a Gaussian Pyramid
In this paper, FCM is first employed to generate segmentation results of bitemporal images. Second, the segmentation results are used for computing the difference of image structuring to obtain changed regions. Because the computational complexity of FCM is influenced by the image size, it requires a long running time to perform FCM on a VHR image. Although some improved FCM algorithms, such as Enhanced fuzzy c-means (EnFCM) [
44] and fast and robust fuzzy c-means (FRFCM) [
45], are able to reduce the computational complexity of FCM, they are only suitable for grayscale image. Both EnFCM and FRFCM employ a histogram to replace pixels to remove the redundant information of images. However, it is difficult to extend EnFCM and FRFCM to multi-band remote sensing images. The Gaussian pyramid [
46] is an excellent approach for addressing the problem because it is able to remove the redundant information while preserving structuring information for multi-band images. We use the Gaussian pyramid to obtain multi-resolution images that have similar structuring information, and then implement FCM on a low-resolution image to speed up the algorithm. After that, we use the obtained clustering centers to compute the final membership on the original VHR image.
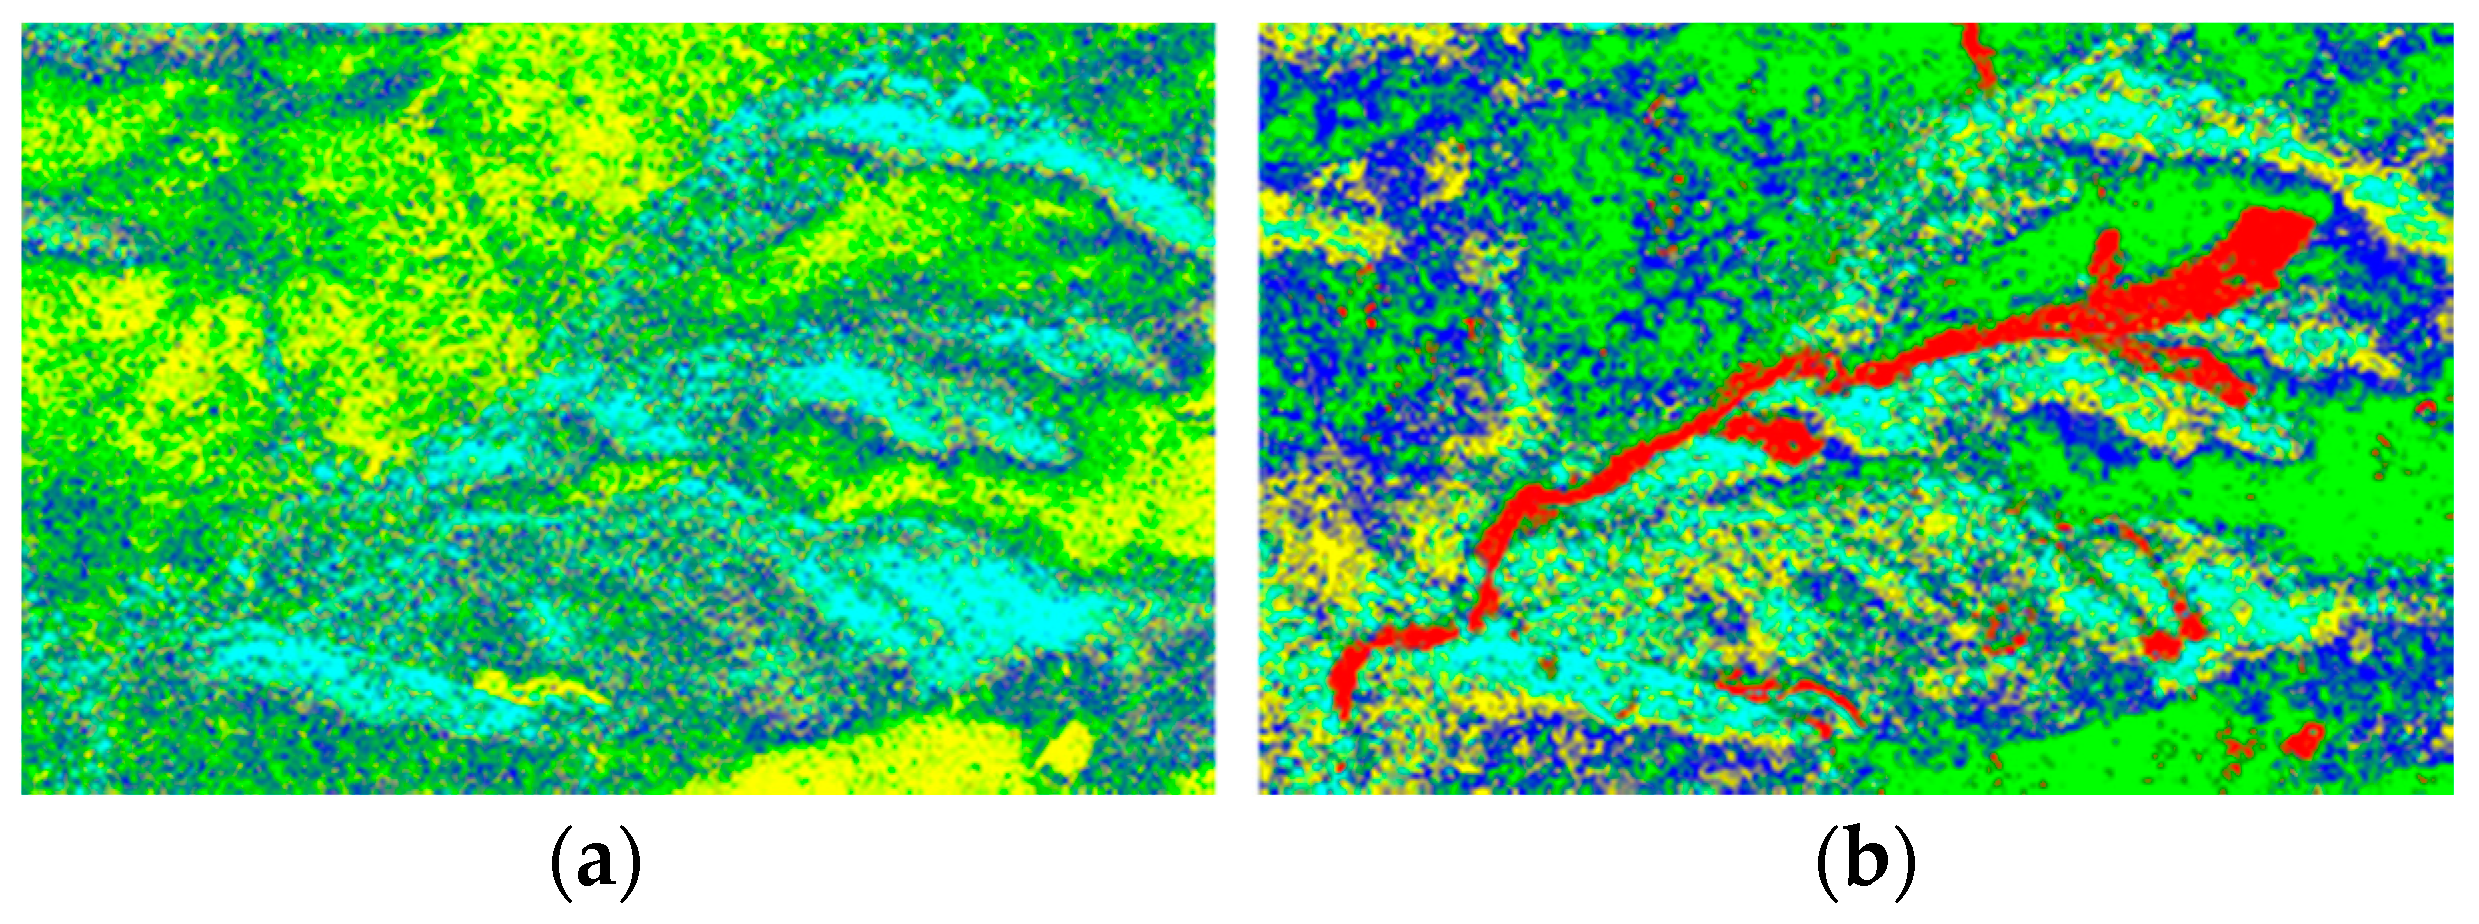
Figure 5 shows the multi-resolution images obtained by the Gaussian pyramid.
Because FCM algorithms aim to obtain the clustering centers and classification labels, we can compute the clustering centers of a low-resolution image instead of the original high-resolution image from the Gaussian pyramid. Since there is a high data redundancy for images, we can obtain the similar clustering centers for multi-resolution images obtained by the Gaussian pyramid.
Table 1 shows the clustering centers obtained by FCM for the image shown in
Figure 5.
Furthermore, we can obtain the segmentation results of original bitemporal images using clustering centers shown in
Table 1.
Figure 6 shows the corresponding segmentation results, where five colors represent five classes.
In
Table 1, we can see that the clustering centers are similar for four different-resolution images shown in
Figure 5. Therefore, a fast clustering algorithm can be achieved by using Gaussian pyramid for VHR images.
4. Experiments
In order to evaluate the proposed approach, three groups of bitemporal VHR landslide remote sensing images were used in our experiments. Three popular approaches [
9,
10], i.e., edge-based level-set (ELSE), region-based level-set (RLSE) [
10], and change detection-based Markov random field (CDMRF) [
9] were considered as comparative approaches to demonstrate the effectiveness and efficiency of CDFFCM for LM. All approaches were implemented with MATLAB 2017b (
https://www.mathworks.com/) and performed on a DELL desktop with Intel(R) Core(TM) CPU, i7-6700, 3.4 GHz, and 16 GB RAM (Dell, Shanghai, China).
4.1. Data Description
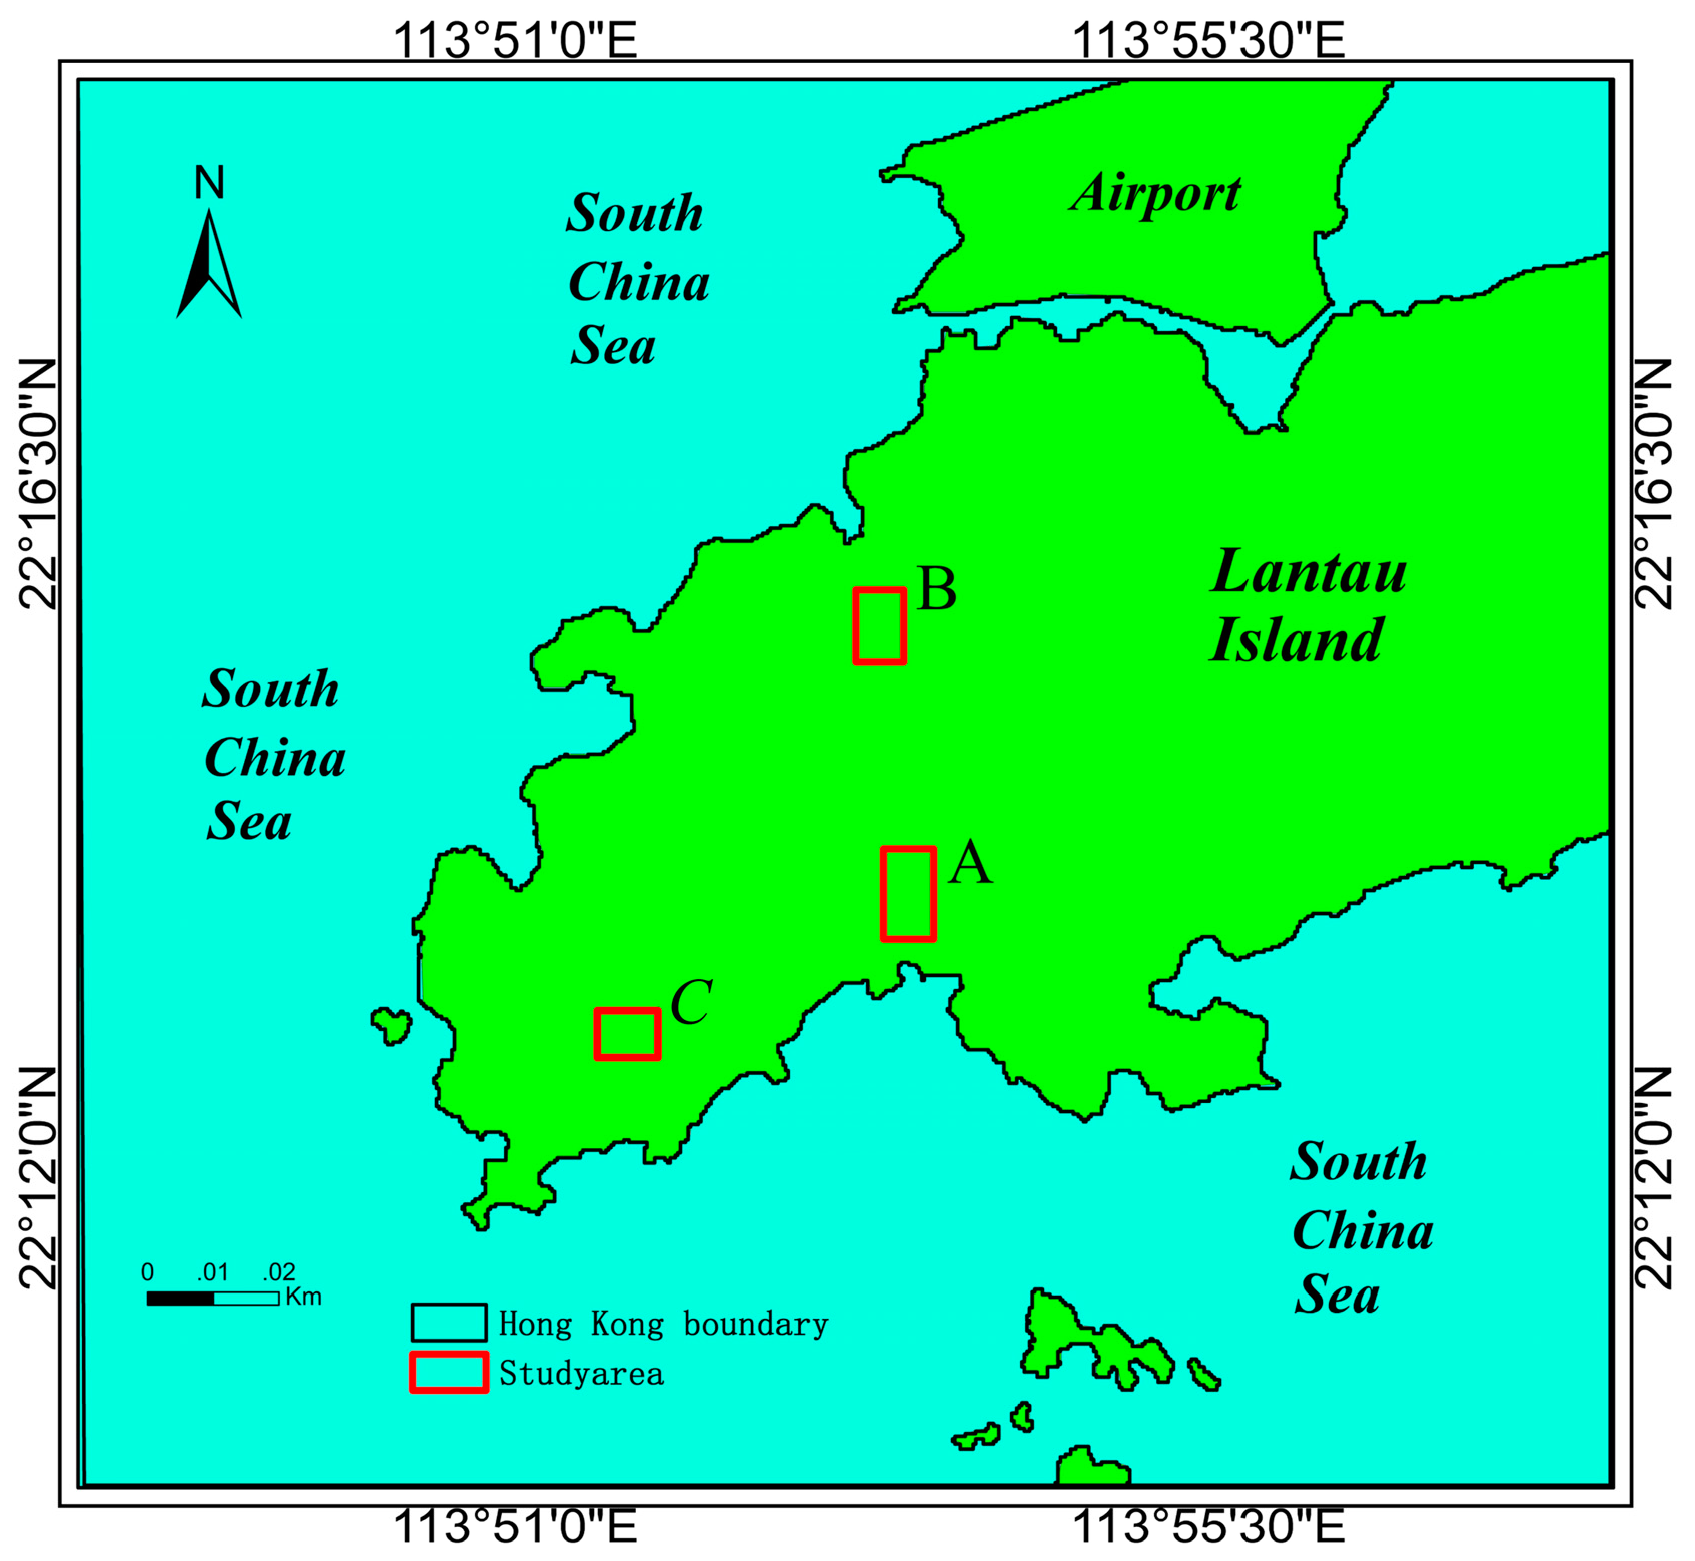
Three groups of bitemporal images on A-area, B-area, and C-area were captured by the Zeiss RMK TOP 15 Aerial Survey Camera System (Jena, Germany) at a flying height of approximately 2.4 km in December 2007 and in November 2014, respectively. The locations of A-area, B-area, and C-area are shown in
Figure 12. The geometrical resolution of the bitemporal images is 0.5 m. All images used in the experiments were preprocessed via geometry registration and radiometric correction.
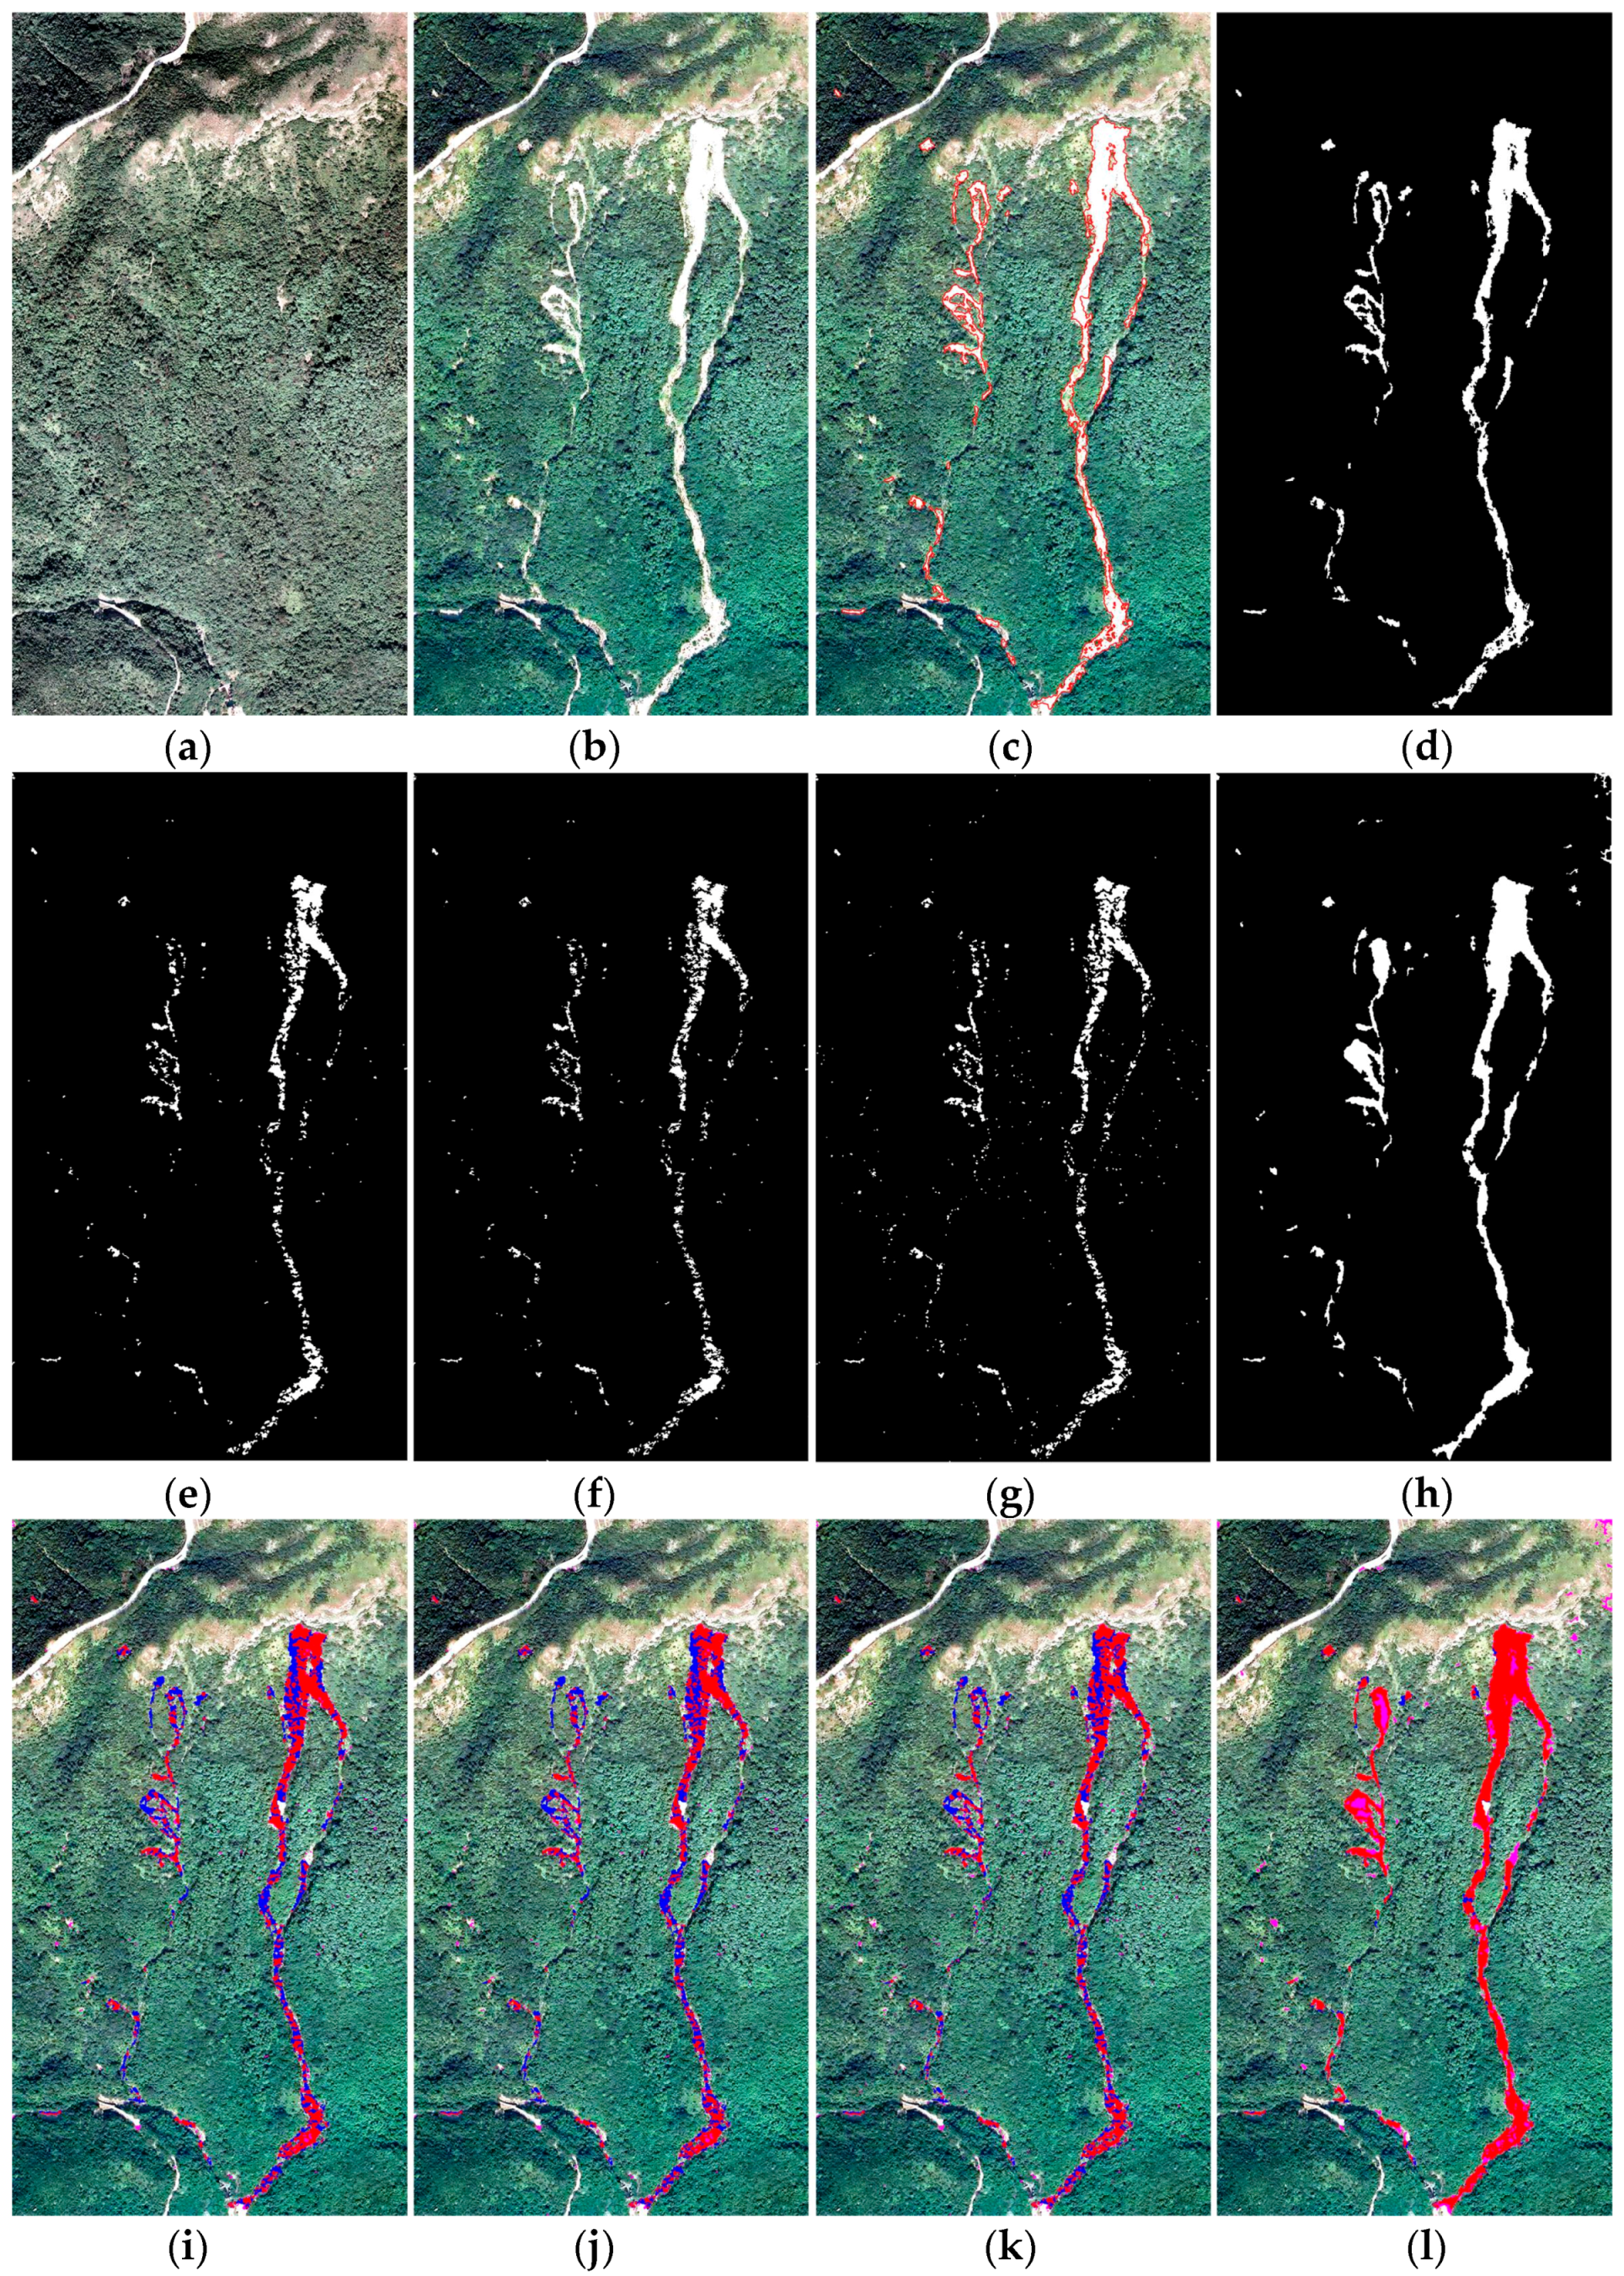
A-area:
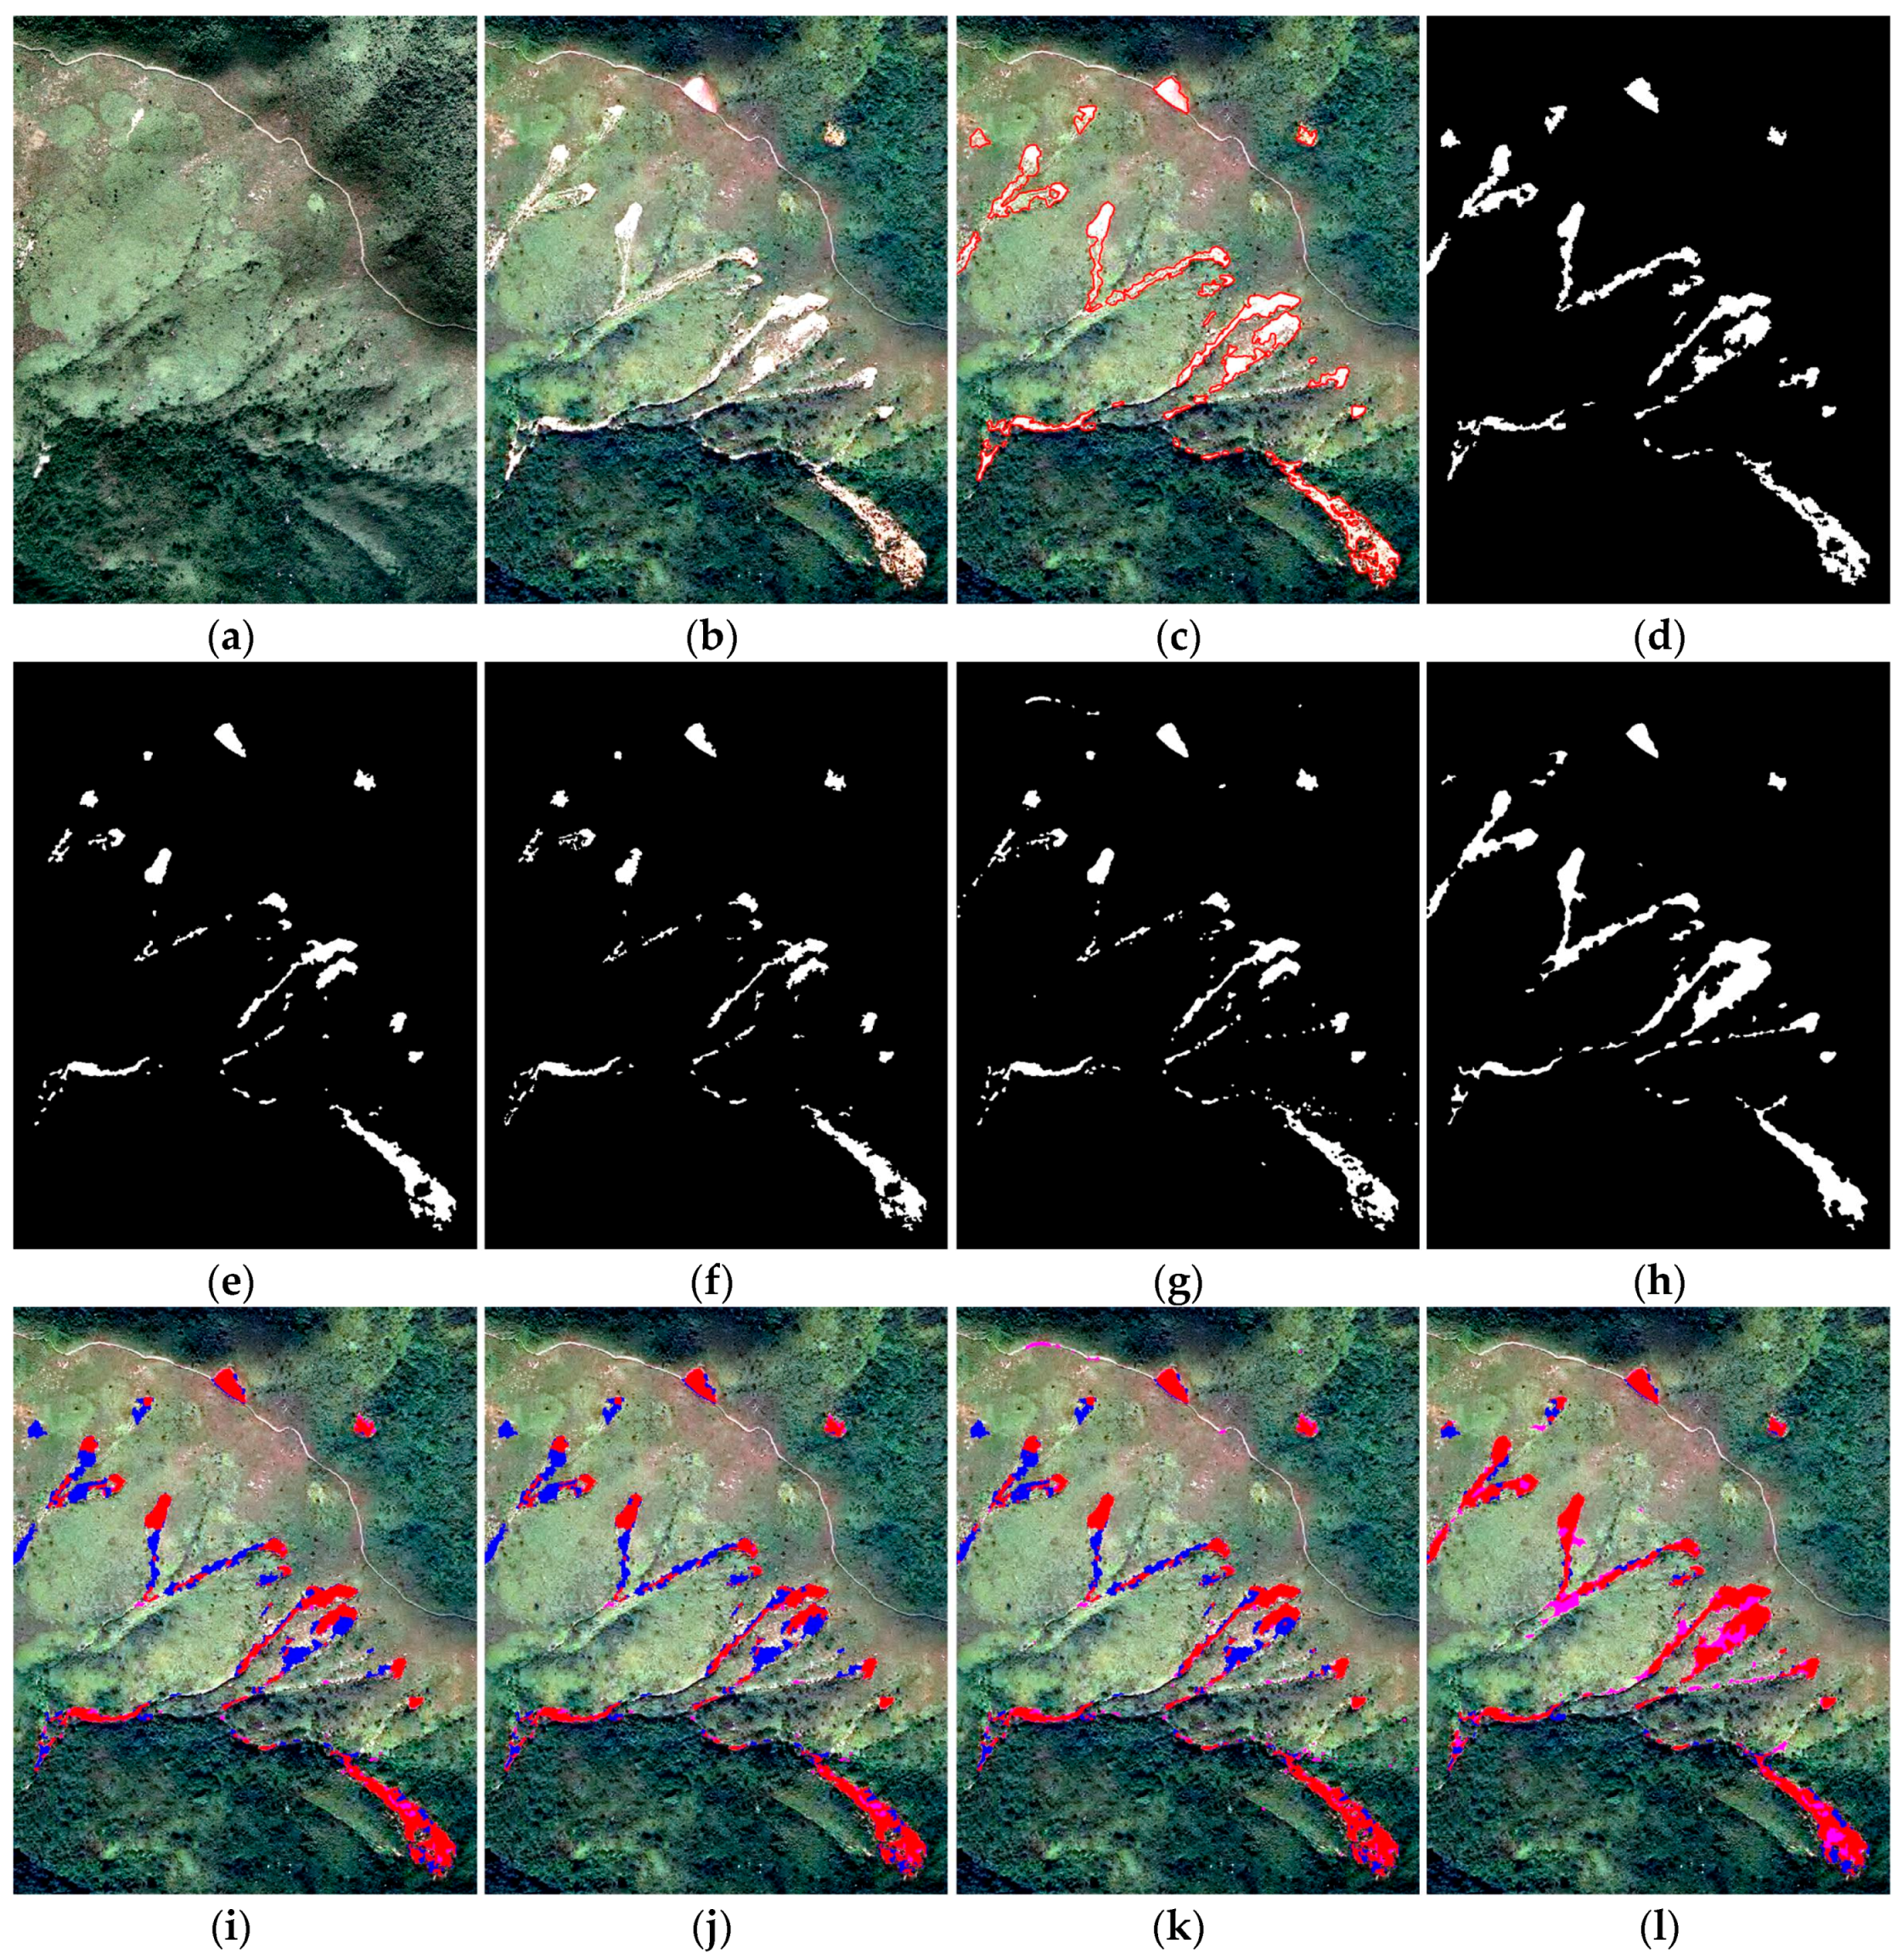
Figure 13a,b shows the pre- and post-event images of A-area. The size of the bitemporal images was 1252 × 2199. The true boundaries of the landslides in the images were generated manually by human experts in the field of remote sensing, and they are shown in
Figure 13c.
Figure 13d shows the corresponding ground truth segmentation.
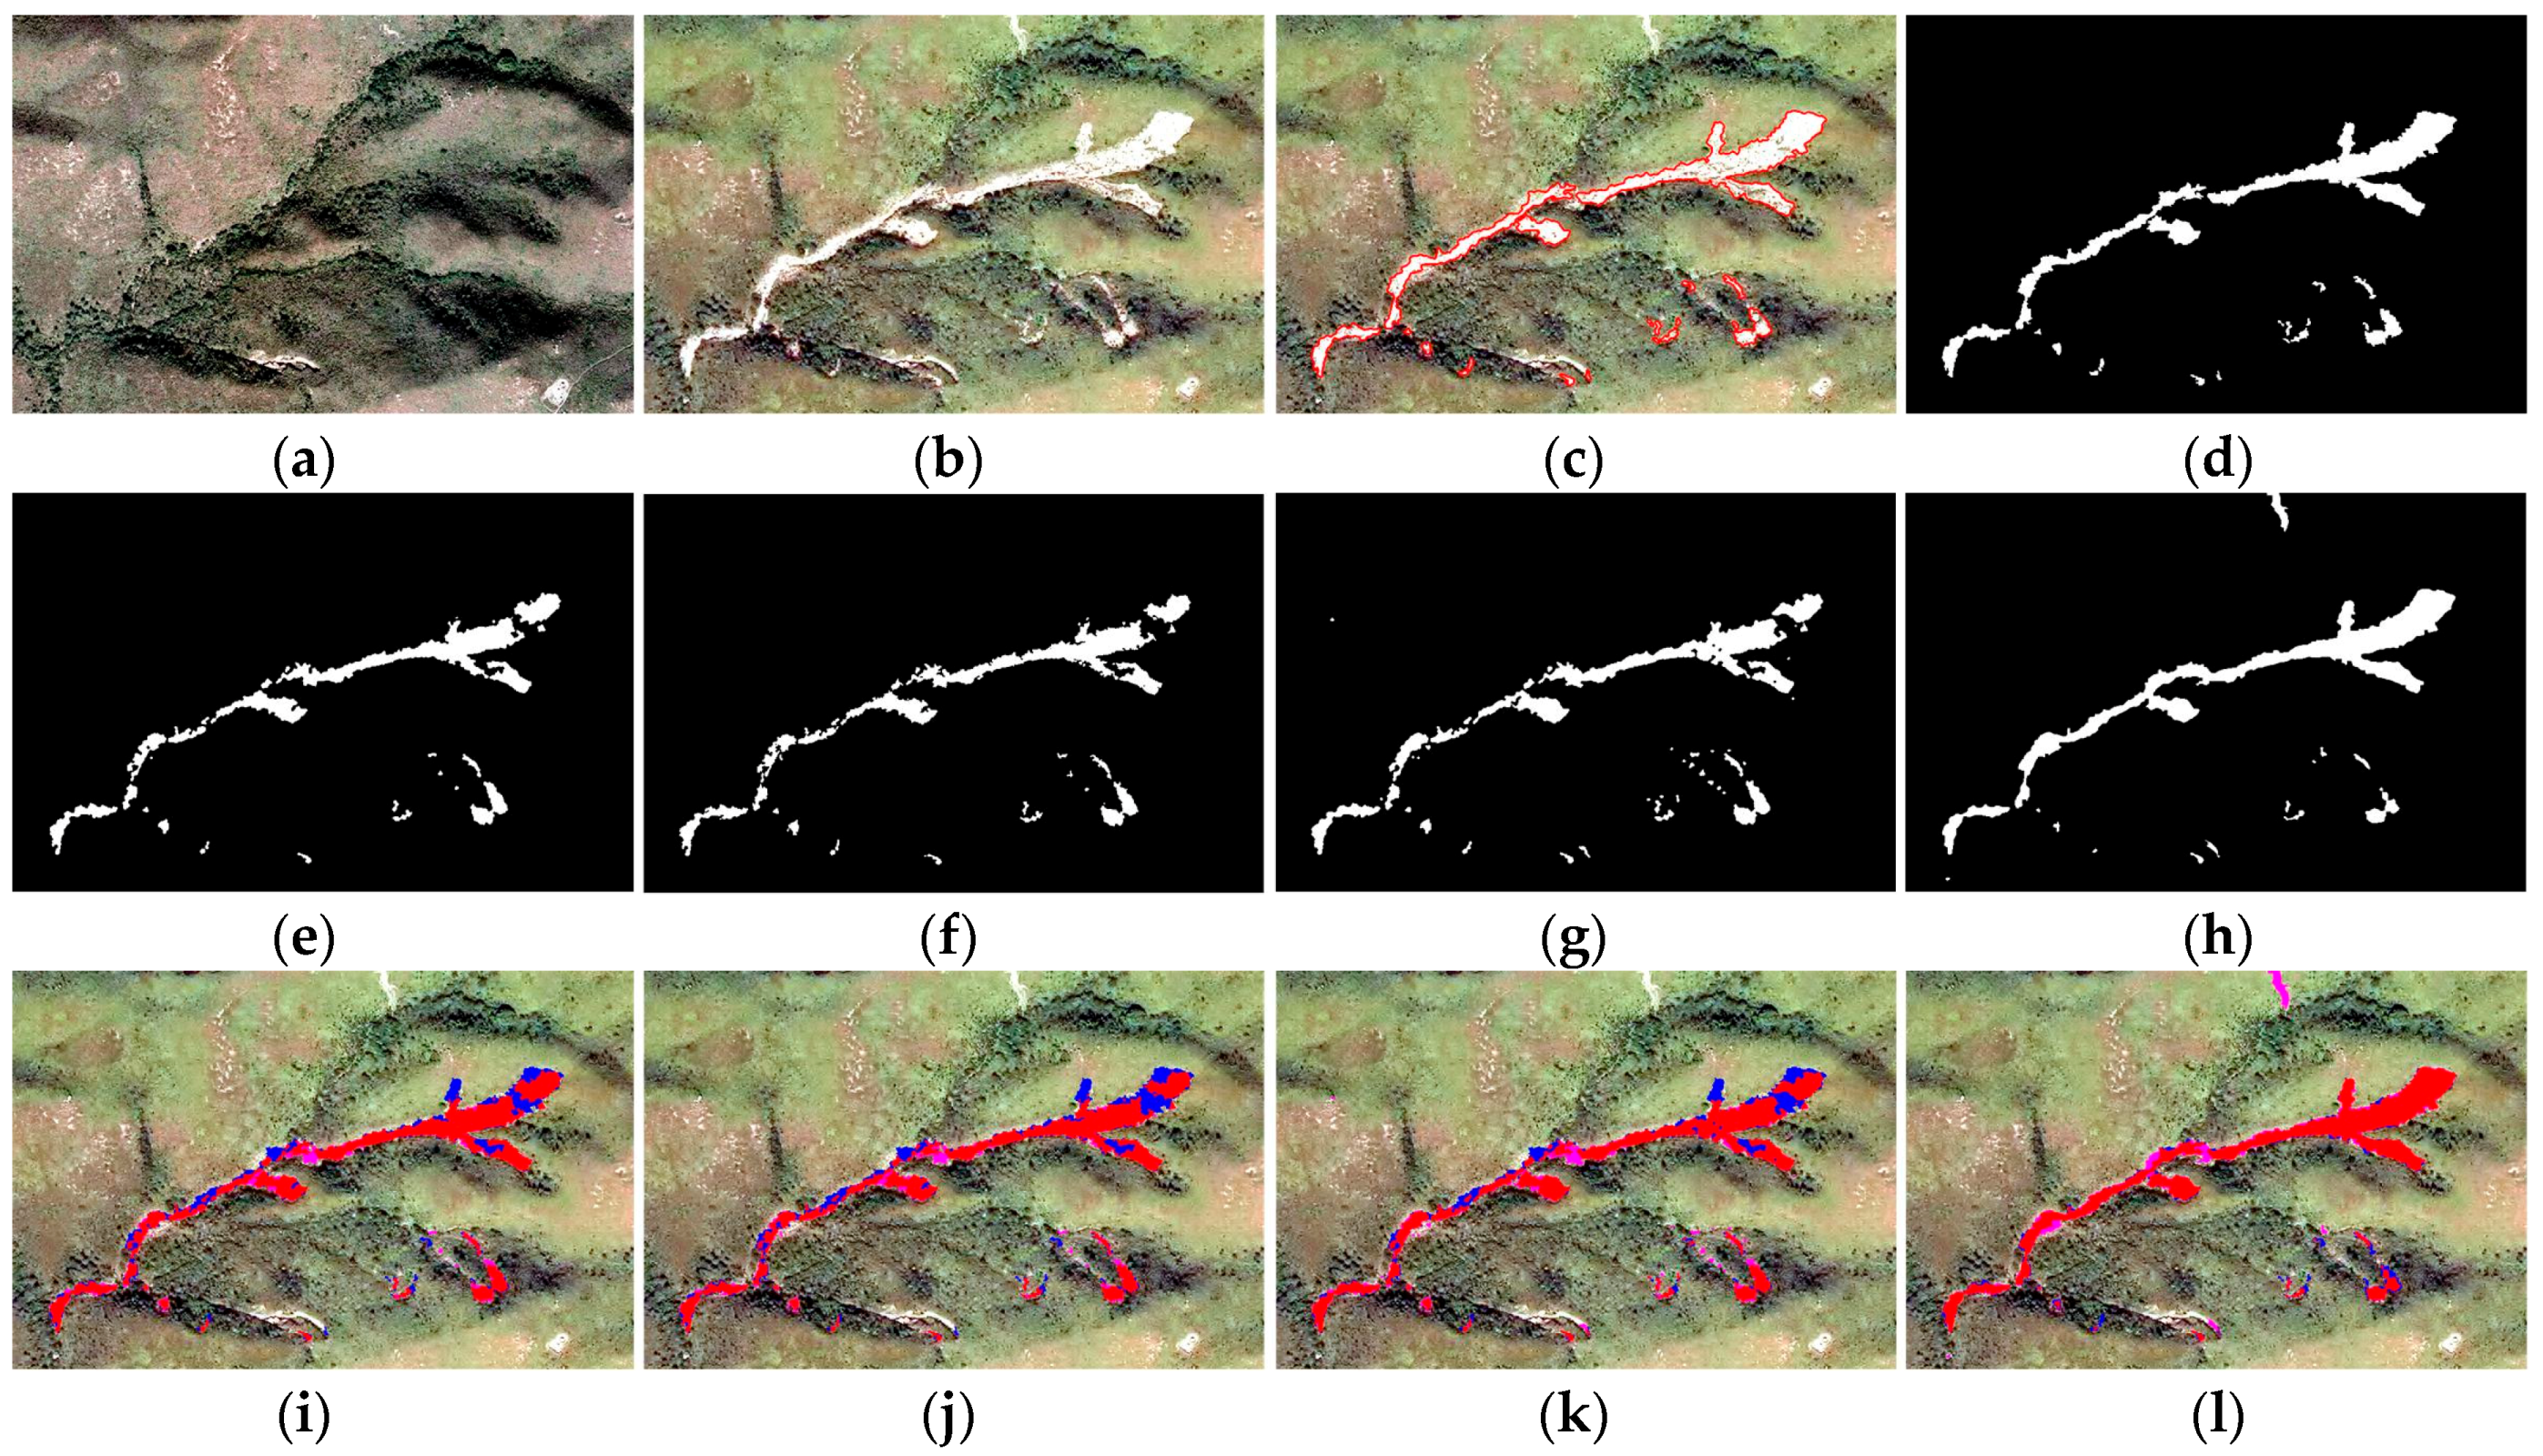
B-area:
Figure 14a,b shows the pre- and post-event images of B-area. The size of the images was 923 × 593. The ground truths, i.e., the boundaries and segmentation results of landslides in the post-event image, are shown in
Figure 14c,d, respectively.
C-area:
Figure 15a,b shows the pre- and post-event images of C-area. The size of the images was 750 × 950. The ground truths, i.e., the boundaries and segmentation results of landslides in the post-event image are shown in
Figure 15c,d, respectively.
4.2. Experimental Setup
To fairly compare the performance of different approaches, the parameter values used for the experiments follow the original papers. The parameter values, α = 1.5, = 1.0, and = = 1.0 were used for ELSE and RLSE, where is a constant coefficient to reduce the effect of data dispersion on the experimental results by increasing the standard deviation term, and is the standard deviation of the Gaussian filter used for preprocessing. The template size of the Gaussian filter was 9 × 9, and the time step was = 5.0. The parameter values used for CDMRF were as follows: = 1.0, = 1.5, = 50, and = 5. The value of was consistent with the effect of , i.e., it aimed to reduce the effect of data dispersion on the experimental results. is a weighting coefficient which was used to balance the pairwise potential. is the number of clusters. To our knowledge, the value of the parameters were the best for the comparative approaches. For the proposed CDFFCM, only two parameters, and were required, and other parameters could be computed automatically according to the size of the bitemporal images. We set = 0.8 and = 5 in this experiment. Both the structuring elements used for image filtering and morphological reconstruction, and the multiple of downsampling used for a Gaussian pyramid, were decided by the size of the bitemporal images.
In order to quantitatively compare CDMRF, ELSE, and RLSE with the proposed CDFFCM, four quantitative evaluation indices [
10] are presented:
where
is the total pixel number of the identified landslides that are matched with the corresponding ground truth,
is the total pixel number of the ground truth,
is the total pixel number of the identified landslides, and
is the total pixel number of the corresponding ground truth that is not matched with the identified landslides.
is the total pixel number of detected false landslides.
4.3. Experimental Results
4.3.1. A-Area
Figure 13a,b show the pre-event and post-event images for A-area, respectively. The landslide regions are clear in
Figure 13b. Although we could recognize landslide regions visually according to the difference between
Figure 13a,b, it was difficult to achieve the computer recognition due to a complex background and noise. There was also a clear difference between
Figure 13a,b for background regions due to the influence of the illumination.
Figure 13c shows the contour of true landslide regions that was delineated by experts in the field of remote sensing, and
Figure 13d shows the binary image of landslide regions corresponding to
Figure 13c.
Figure 13e–h shows the identification results of landslide regions generated by ELSE, RLSE, CDMRF, and the proposed CDFFCM, respectively. Compared to the first three results, the last one provided a better visual effect for LM. Moreover, the last one was closer to the ground truth than the other results. The first three results included a great number of breakage regions due to missed detections. Because the bitemporal images were obtained in December 2007 and in November 2014, respectively, the landslide regions had changed during the seven years due to environmental change.
Figure 13b shows that some landslide regions were covered by trees, grass, or soil. Besides, two images taken at different times on the same unchanged area were also different due to the influence of the imaging system, environment, and noise. Therefore, the difference result of bitemporal images usually included a large number of falsely-changed regions caused by illumination or noise. Meanwhile, the difference image usually missed a lot of truly changed regions as well due to fresh trees or grass on landslide regions.
As traditional change detection approaches, such as ELSE, RLSE, and CDMRF, rely on the difference result of bitemporal images, the final identification results had a clear difference from the ground truth, as shown in
Figure 13e–g. Compared to ELSE, both RLSE and CDMRF provided a better visual effect due to two reasons. One is that RLSE employs region segmentation instead of the gradient segmentation employed by ELSE. The other reason is that CDMRF had a stronger capability of noise suppression due to the introduction of spatial context information of landslides.
Figure 13h shows the result obtained by the proposed CDFFCM that overcame the shortcomings existing in ELSE, RLSE, and CDMRF. Because the proposed CDFFCM employed fuzzy clustering to obtain the spatial structuring information of bitemporal images, the difference result relied on the structuring change other than the change of grayscale values. The proposed approach was therefore insensitive to noise. It was not only able to exclude falsely-changed regions, but was also able to supply the missed landslide regions that were truly changed.
Figure 13i–l shows the comparative results of landslide mapping, where the regions marked by red color were true-detected landslide regions, the regions marked by pink were false-detected landslide regions, and the regions marked by blue were true-missed landslide regions. According to
Figure 13l, the proposed CDFFCM provided the best result for LM because the area of red regions was the largest while the sum of pink and blue regions was small.
4.3.2. B-Area
Figure 14a,b shows the pre-event and post-event image for B-area, respectively. The landslide regions shown in
Figure 14b were clearer than those in A-area. There was a very clear difference between
Figure 14a,b due to the environmental change.
Figure 14c shows the contour of true landslide regions and
Figure 14d shows the landslide regions corresponding to
Figure 14c. We can see that there was less bare rock or soil in
Figure 14a compared to
Figure 14b.
Figure 14e–h shows the identification results of landslide regions generated by ELSE, RLSE, CDMRF, and the proposed CDFFCM. Similar to
Figure 13, the last one generated by the proposed CDFFCM provided a better visual effect than the first three results for LM. Moreover, the last one was closer to the ground truth than the three previous results. The four approaches used for LM generated better results for
Figure 14 than
Figure 13 since B-area included less noise.
Figure 14i–l shows the comparison result of different approaches for landslide mapping, where the result generated by the proposed CDFFCM included more red regions and less blue regions in
Figure 14l.
Although A-area is different from B-area in image size and texture features, the proposed CDFFCM achieved the best identification results in four approaches for both A-area and B-area. Furthermore, the proposed CDFFCM had a stronger robustness for LM.
4.3.3. C-Area
Compared to A-area and B-area, it was more difficult to obtain accurate landslide regions for C-area due to the complexity of landslides.
Figure 15a,b shows the pre-event and post-event image for C-area, respectively. We can see that some landslide regions in
Figure 15b were covered by the fresh vegetation of the surrounding. Therefore, it was more difficult and took more time to delineate the true landslide regions in C-area than for A-area and B-area.
Figure 15c shows the contour of true landslide regions of the post-event and
Figure 15d shows the landslide regions corresponding to
Figure 15c.
Figure 15e–h shows the identification results of landslide regions generated by ELSE, RLSE, CDMRF, and the proposed CDFFCM. The proposed CDFFCM provided the best result since
Figure 15h was closer to the ground truth shown in
Figure 15d than
Figure 15e–g.
Figure 15i–l shows the comparison results of different approaches for landslide mapping. There were a lot of blue regions in
Figure 15i–k, which indicated a great number of true landslide regions were missed by ELSE, RLSE, and CDMRF. The proposed CDFFCM provided better visual effects than three comparative approaches because
Figure 15l included more red regions (i.e., true landslide regions) and fewer blue regions (i.e., missing true landslide regions). However,
Figure 15l included more pink regions (i.e., detected false landslide regions) as well.
4.4. Experimental Analysis
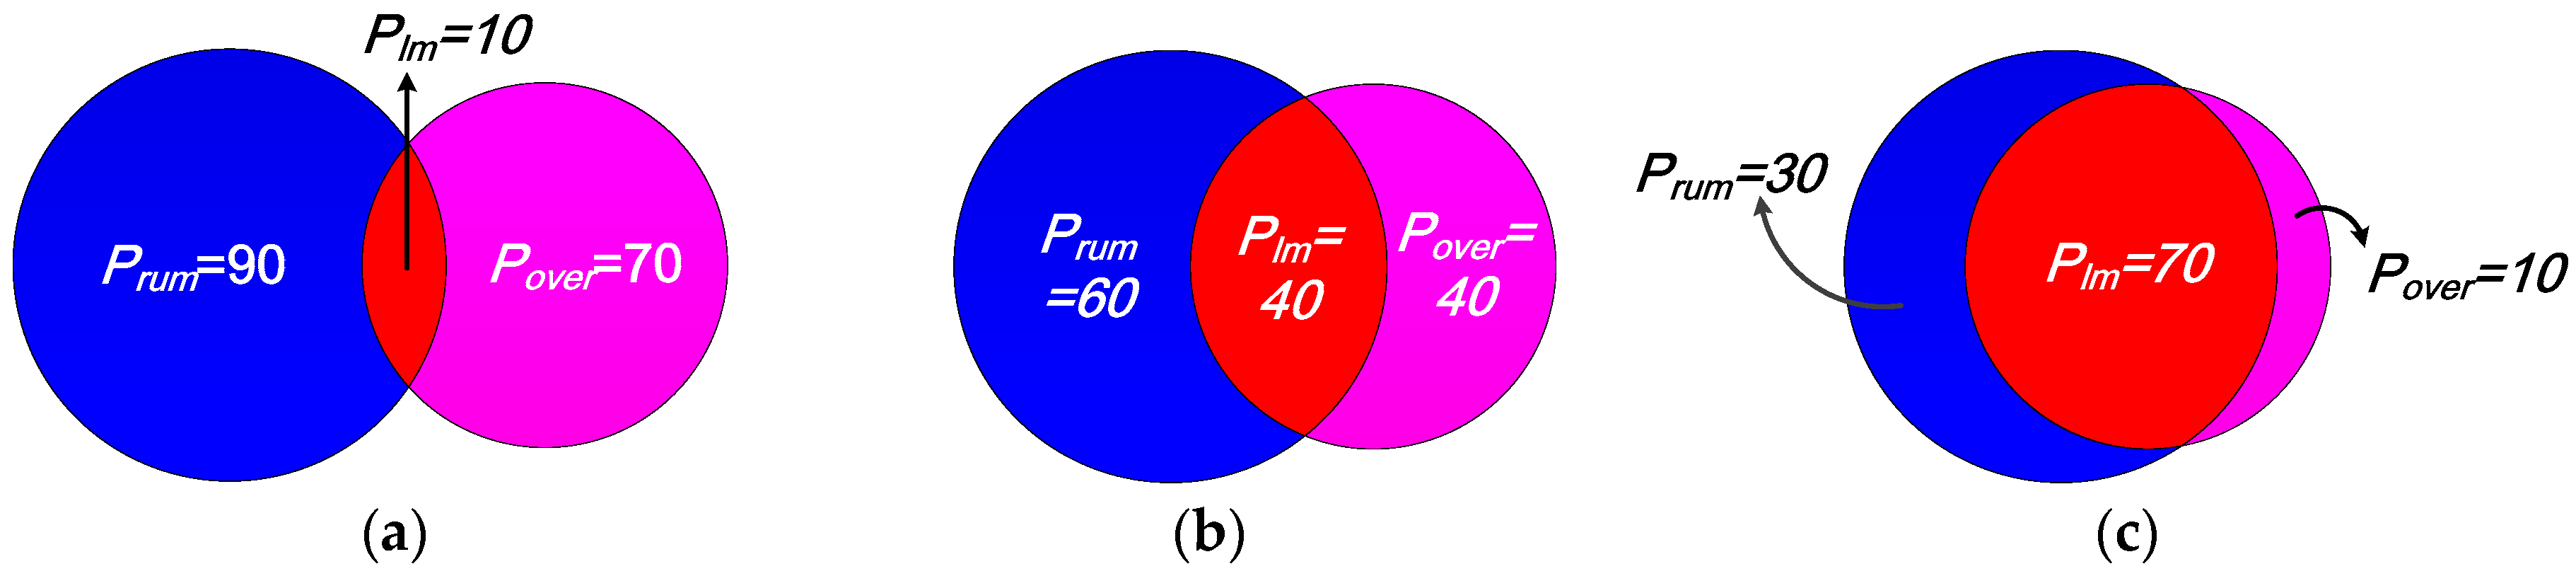
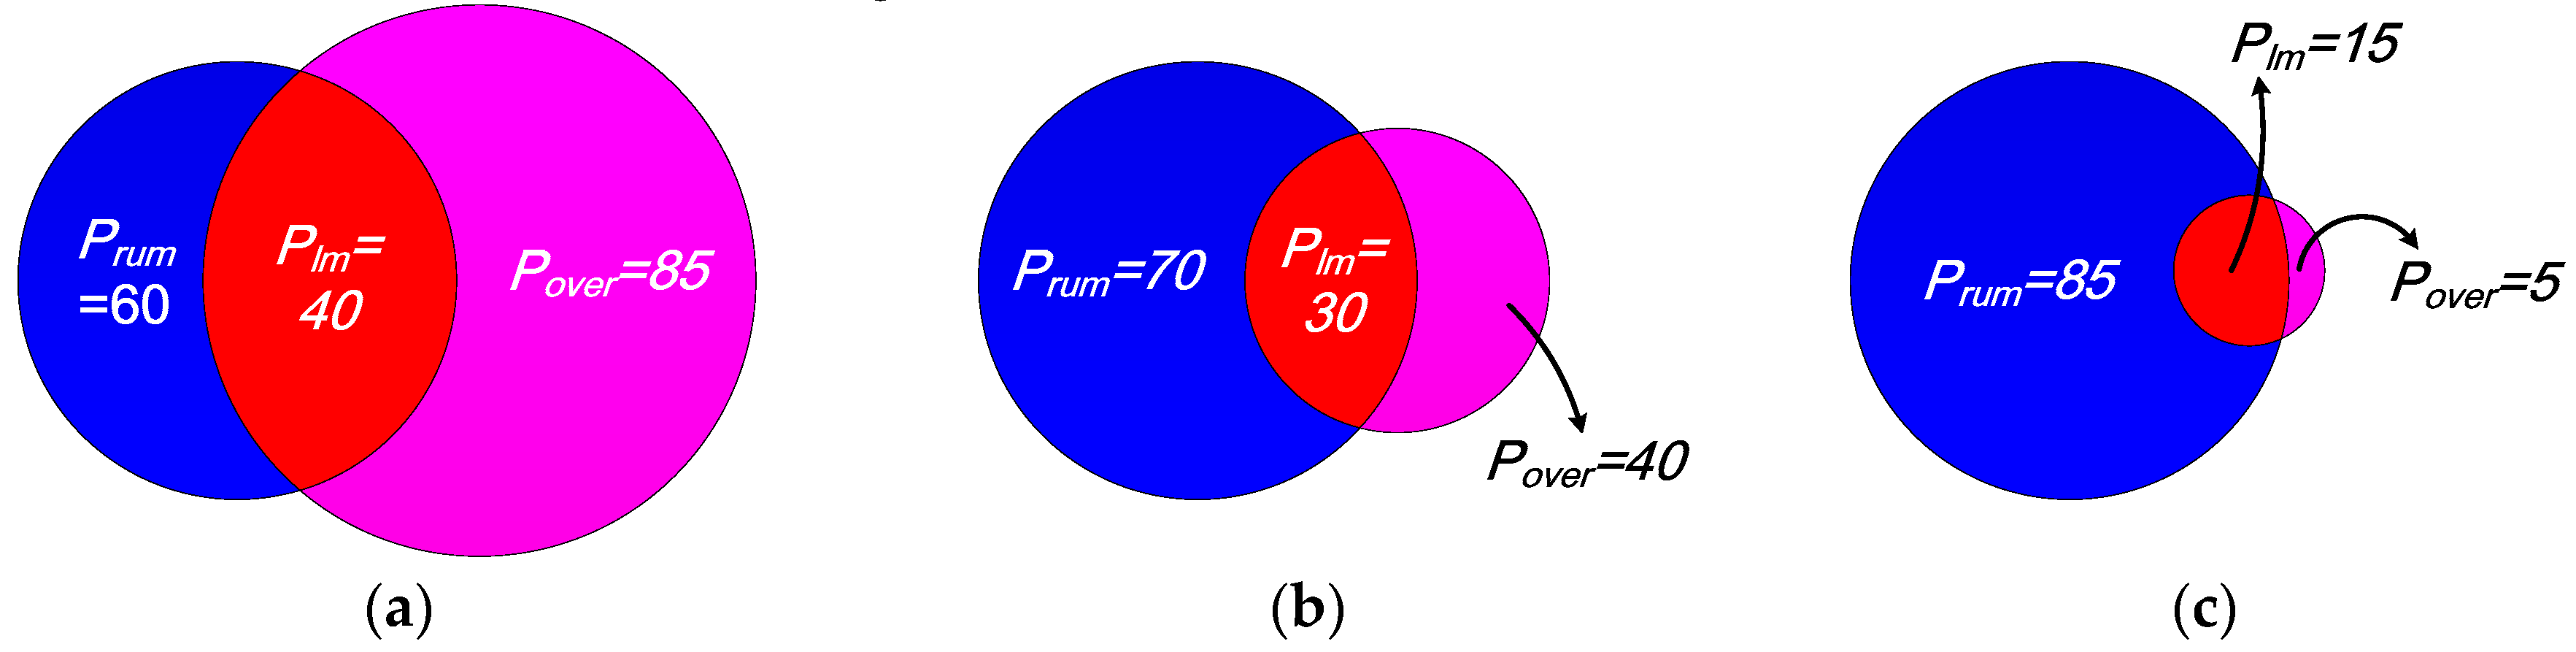
In practical applications, because and are often dissimilar in some cases, - and were usually used for evaluating the effect of LM because they are consistent with a subjective evaluation. To illustrate the relationship between the four indices, two examples are presented as follows.
Example 1: and are similar for performance evaluation of algorithms.
Example 2: and are dissimilar for performance evaluation of algorithms, i.e., a high corresponds to a low . However, - and are consistent larger or smaller.
Generally,
is a constant while
is usually a variant.
and
are inconsistent when
decreases as shown in
Figure 17 and
Table 4.
Table 4 shows that
-
and
become larger or smaller consistently but
and
were inconsistent. It is thus
-
and
that were usually used for evaluating the performance of an approach for landslide mapping.
To further verify the effectiveness of the proposed method, the detected landslides were compared with the ground truths by using two popular indices, i.e.,
-
and
. The final quantitative evaluation results are presented in
Table 5 and illustrated by a corresponding bar-chart shown in
Figure 18 for the four approaches ELSE, RLSE, CDMRF, and the proposed CDFFCM.
For A-area, B-area, and C-area, ELSE, RLSE, and CDMRF provide higher
but lower
than CDFFCM because a larger number of true landslide regions were missed by the first three approaches, i.e., the first three approaches obtained a small value of
while CDFFCM obtained a large value of
. However, the proposed CDFFCM obtained a significantly higher
-
and
than the three other approaches shown in
Table 5, which demonstrates that CDFFCM was superior to the three comparative approaches on three study areas.
The four approaches obtain higher
and
for B-area than A-area and C-area because the landslide regions were covered by more grass and fewer trees in B-area than in A-area and C-area. Trees led to the missing of more true landslide regions than grass. Consequently, there were less pink regions in
Figure 14l than
Figure 13l and
Figure 15l, and B-area obtained higher values with
-
and
than A-area and C-area.
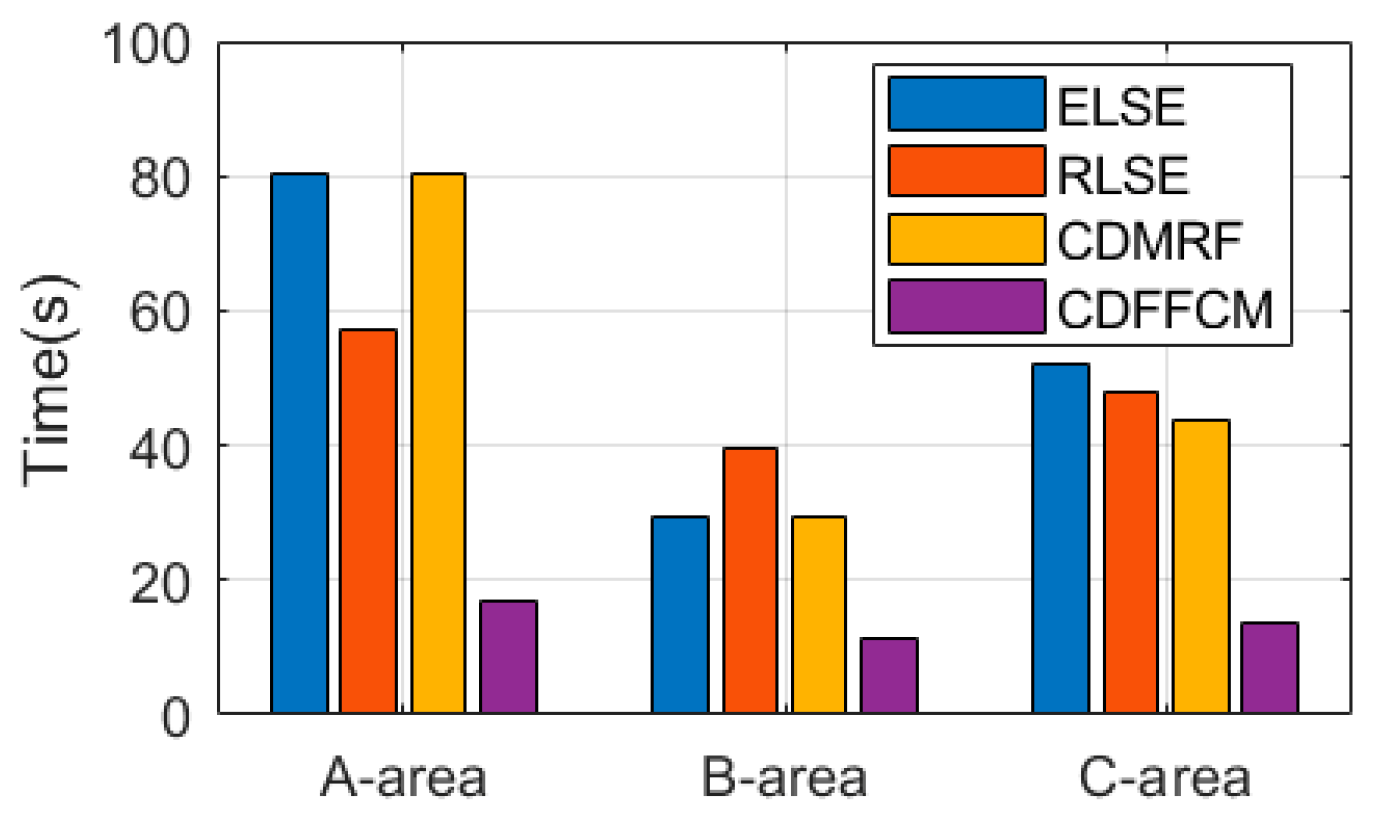
To further demonstrate that the proposed CDFFCM had a high computational efficiency for LM,
Table 6 shows the comparison of the execution time of these different approaches on A-area, B-area, and C-area. The four approaches were implemented repeatedly more than thirty times, the final average execution time is shown in
Table 6. The proposed approach required a shorter execution time than the three comparative approaches. The running time of ELSE, RLSE, and CDMRF relied on the image size. For example, ELSE required 80.12 s for A-area but 29.32 s for B-area since the size of A-area was 1252 × 2199 but 923 × 593 for B-area. The computational complexity of the proposed CDFFCM did not depend on the image size because the Gaussian pyramid method is able to obtain difference resolution images. The fuzzy clustering algorithm was only performed on a low-resolution image to obtain clustering centers. Therefore, the proposed CDFFCM had the advantage of a faster execution time.
In
Table 6, A-area required a longer execution time than B-area and C-area for all four approaches because the size of A-area was larger than B-area and C-area. The proposed CDFFCM required a shorter execution time than the three comparative approaches because it employed the fast FCM algorithm to achieve image segmentation. Therefore, CDFFCM was clearly superior to the three comparative approaches due to the high computational efficiency, as shown in
Figure 19.
5. Discussion
In the paper, the proposed CDFFCM was evaluated for different landslide images under appropriate parameter settings. The CDFFCM included two required parameters, where
was a threshold used for comparing with the values of clustering centers, and it was used for image binarization as well.
was the number of clusters used for FCM. The structuring element denoted by
was used for both image filtering and morphological reconstruction, where
was the radius of structuring element and it could be decided by the image size. The multiple of downsampling denoted by
, was used for the Gaussian pyramid. For the proposed CDFFCM,
and
were required, but
and
were unrequired because the latter two parameters could be computed automatically according to the size of the bitemporal images, i.e.,
The parameter could be computed according to Equation (12). Therefore, the proposed CDFFCM only required setting the values of and .
To test the influence of parameters on the performance of CDFFCM, four quantitative evaluation indices,
, ,
-
, and
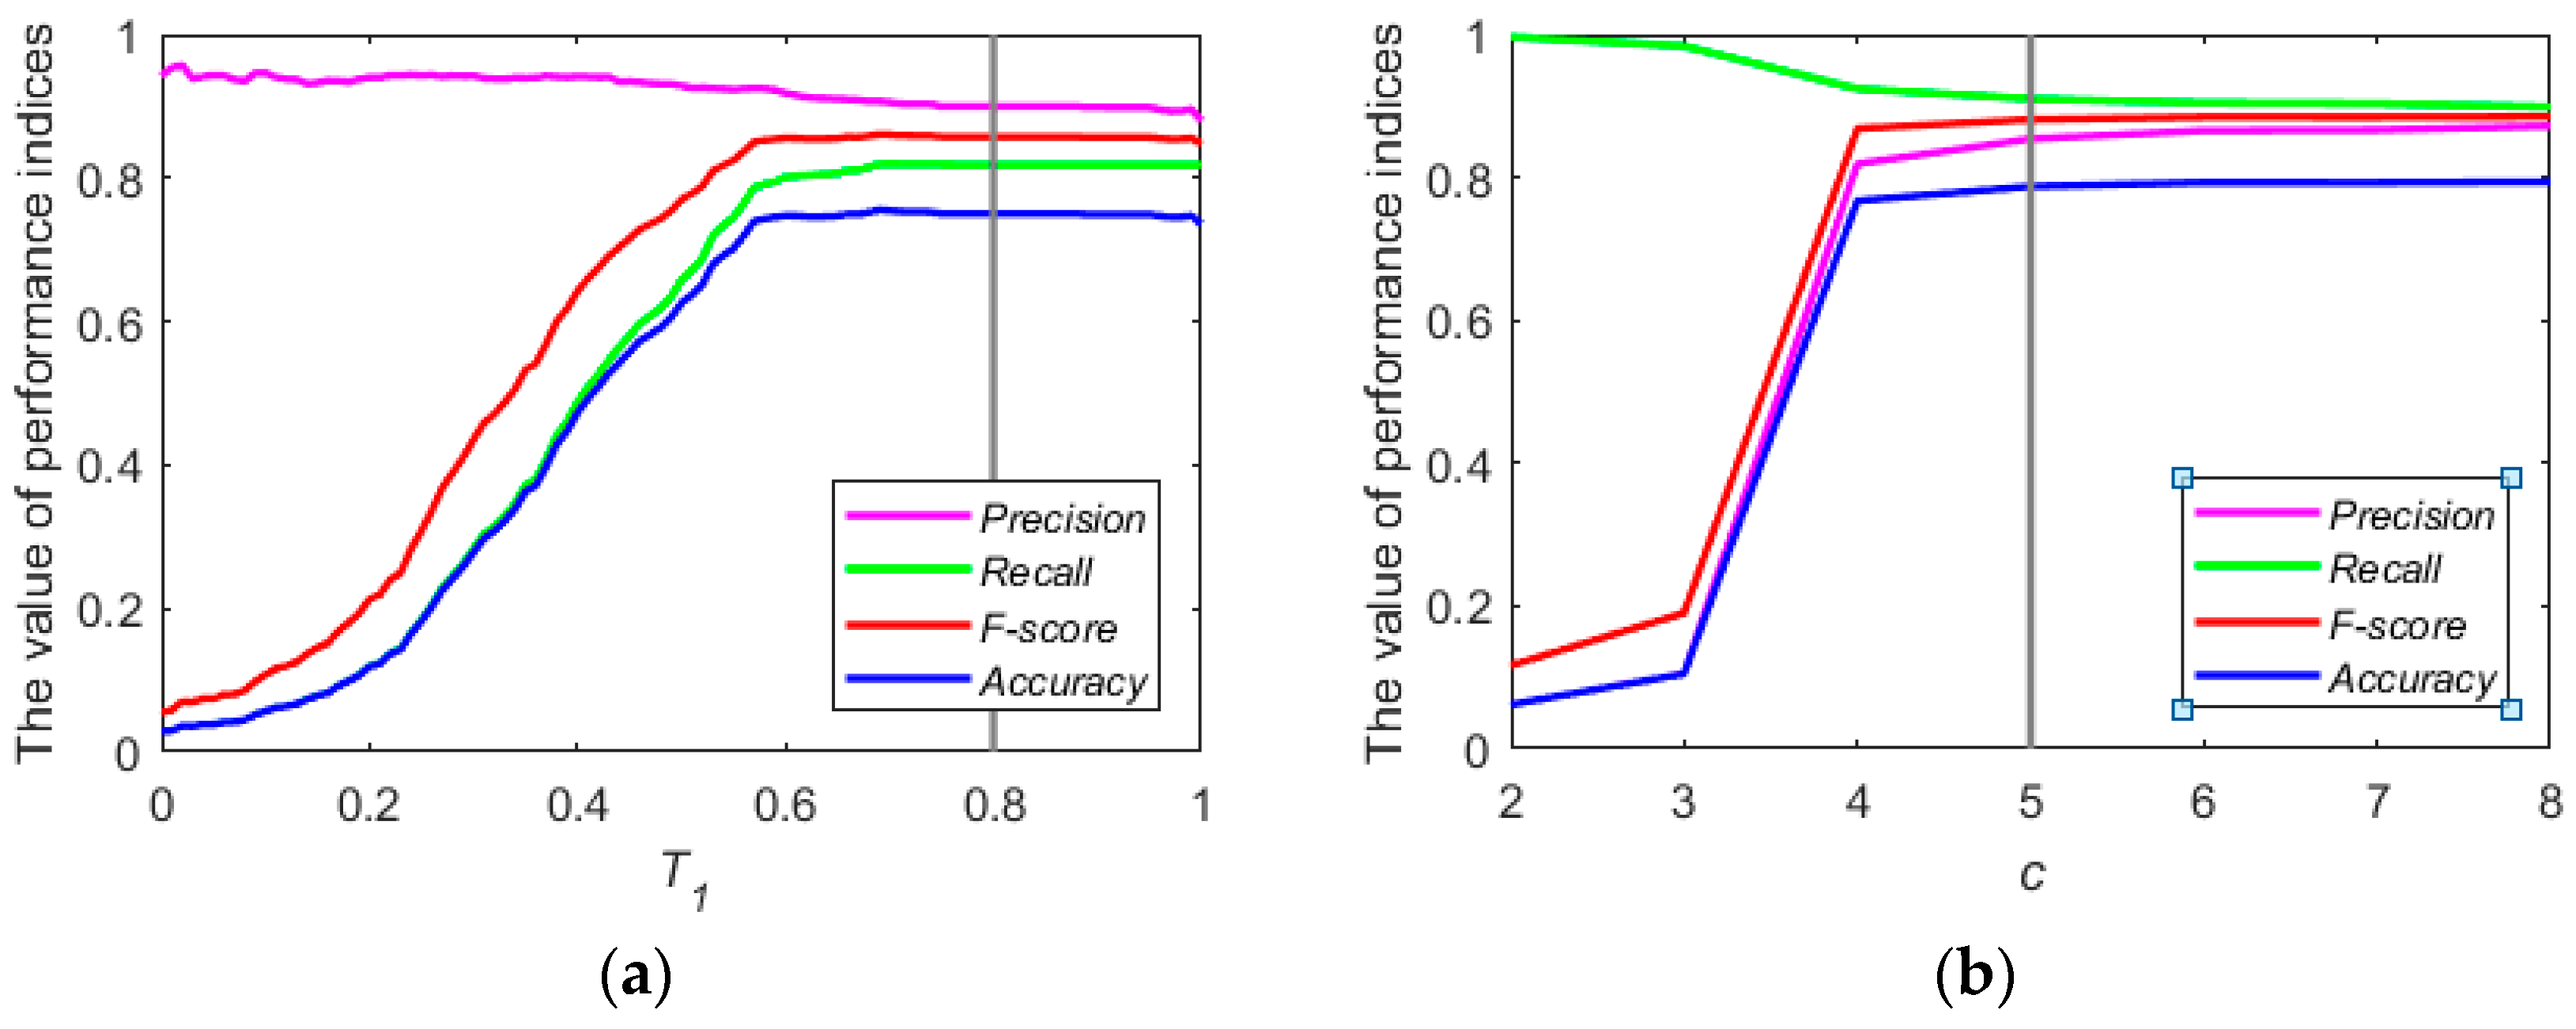
were analyzed. Taking B-area as the research object and setting
c = 5,
Figure 20a shows the effect of a change on each index by setting different values of
. A small value of
meant too many false landslide regions were detected from the pre-event image, which indicated the detected-true landslide regions were much smaller than the ground truth. Consequently, a high
and low
,
-
, and
were obtained in
Figure 18a. By increasing
, the detected result of false landslide regions was closer to the true result, which indicated the detected-true landslide regions were closer to the ground truth. Therefore, the values of
,
-
, and
got significantly larger, while the value of
got slightly smaller, as shown in
Figure 20a. Furthermore, we can see that the four indices were convergent when
. A similar experiment was carried out on A-area and C-area. We obtained
. Therefore, we considered
as an empirical value in our experiments.
Figure 20a shows the influence of on the performance of CDFFCM. Similarly, we analyzed the influence of
on the performance of CDFFCM, as shown in
Figure 20b. When the value of
was small, the detected landslide regions were much larger than the ground truth, resulting in a high
and low
,
-
, and
. With the increase of the value of
, the four indices were convergent, and higher values of
-
and
were obtained. Because a large
would lead to a high computational complexity for FCM algorithm, we considered
as an empirical value in our experiments.
In our experiments, we detected the landslides using bitemporal images, which were acquired at different times. Because the difference image of the bitemporal images mainly included landslides but no other changed information such as land use change, forest deformation, and lake water level change event, etc., the proposed CDFFCM provided a high accuracy of landslide identification in our experiments. However, if the post-event image included other changed information, for example, a new road, it will be difficult to differentiate a new road and landslides because they have similar image features. Therefore, the performance of the proposed CDFFCM relies on the bitemporal images. If we want to identify landslides from changed regions, a classifier is required, and a great number of training samples and label images are necessary as well. However, the collection of a great number of bitemporal images and corresponding label images is difficult to us to obtain, therefore we did not give much discussion about the classification of changed regions.
6. Conclusions
A change detection approach using fast fuzzy c-means clustering for landslide mapping (CDFFCM) has been presented in this paper. The proposed CDFFCM addresses two problems that exist in popular approaches for LM, such as ELSE, RLSE, and CDMRF. On the one hand, the existing approaches mainly depend on the illumination change of bitemporal images but miss the spatial structuring information of images, which leads to a serious landslide region leak. The proposed CDFFCM employs an improved FCM algorithm that incorporates the local spatial information into its objective function to obtain a better difference image. On the other hand, the existing approaches require a long execution time for VHR images. The proposed CDFFCM utilizes a Gaussian pyramid method to reduce the redundant data of images for FCM to improve its computational efficiency. The proposed CDFFCM has been applied to a landslide site with A-area, B-area, and C-area, on Lantau Island, Hong Kong, China. The images of the three areas have a different size, where A-area was larger than B-area. The experimental results demonstrate that the proposed CDFFCM was effective and efficient for LM since the two problems mentioned above were successfully addressed.
Though the proposed CDFFCM was efficient and effective for landslide mapping from VHR remote sensing images, two parameters must be set manually. For future studies, additional remote sensing images with different types of landslides will be collected and applied to verify the performance of the proposed CDFFCM. In addition, it is still a challenge to identify landslides from changed regions when the post-event image includes a complex change information for the proposed CDFFCM. With the development of convolutional neural network (CNN), we try to employ CNN to achieve end-to-end landslide mapping. Therefore, we need to collect more landslide images and corresponding ground truths.


