1. Introduction
Harmful algal blooms (HABs), wherein accumulation of plankton causes discoloration of water, are increasing worldwide. They often cause high mortality of fish and shellfish, and by extension great economic losses in the aquaculture and tourism industries [
1,
2]. HABs in coastal regions cause major damage to aquaculture farms and have harmful effects on human health [
3,
4]. In Korean waters,
Margalefidinium (previous called as
Cochlodinium)
polykrikoides [
5] blooms have gradually become larger, wider, and more frequent since 1995. This species first bloomed in the South Sea of Korea (SSK) and has expanded to the West Sea (Yellow Sea) and East Sea (Sea of Japan) [
6]. In the SSK, large-scale
M. polykrikoides blooms that form offshore are often transported to coastal waters and gradually accumulate there [
7]. This movement is caused by physical factors such as tidal currents, typhoons, wind, and the biological characteristics of red tide species. Thus, accurate and timely surveillance of
M. polykrikoides blooms in the SSK, including both coastal and offshore waters, is needed to minimize the damage caused by such blooms. It is also necessary to establish an early warning system for
M. polykrikoides blooms.
Red tide monitoring in Korean coastal waters has been conducted by the National Institute of Fisheries Science (NIFS) since 1972. Such monitoring has been carried out regularly at monitoring stations by national institutes such as NIFS, local governments, and the national maritime police agency since 1996 [
6]. NIFS provides all types of available data, including biological, hydrological, meteorological, and remote sensing data, in published daily red tide reports [
8]. Daily red tide reports include the causative organisms, cell abundance, and affected and warning areas. These reports also include predictions for the development and spread of on-going red tides. NIFS has adopted a red tide warning system for fishermen and aquaculturists consisting of three levels: red tide emergence attention, red tide attention, and red tide alert. The new red tide emergence attention notice was introduced in 2015, and is issued when the cell density of
M. polykrikoides exceeds 10 cells mL
−1. In addition, attention and alert notices are issued when the cell density exceeds 100 and 1000 cells mL
−1, respectively [
9]. However, because this information is obtained mainly through field sampling at discrete locations using in situ observations, the red tide areas across broader geographic scales are becoming more difficult to manage. In addition, there are limitations to monitoring in terms of manpower, cost, and time [
10]. For this reason, limited information is available on the presence or absence of red tide patches and the spatial distribution of cell concentrations.
M. polykrikoides blooms occur not only in nearshore areas, but also in offshore waters Thus, it is necessary to monitor all waters of the SSK. Remote sensing data are capable of wide area detection and thus may be effectively applied for quick and accurate monitoring when a red tide occurs.
Satellite-based algorithms have been developed for identifying and monitoring HABs [
10,
11,
12,
13]. Red tide detection from satellite data began with the use of chlorophyll concentration (CHL) data gathered by several ocean color sensors, including the Sea-viewing Wide Field-of-view Sensor (SeaWiFS) and MODerate resolution Imaging Spectroradiometer (MODIS) [
3,
14,
15]. However, this method has several limitations, such as uncertainties in atmospheric correction, interference from various colored compounds, and the presence of other types of phytoplankton. When CHL of non-red tide species is very similar to that of red tide species, it is difficult to distinguish the red tide species. In addition, some red tide species have weak chlorophyll signals. Moreover, seawater signal in coastal areas is complex due to various constituents such as suspended particulate matter (SPM) and colored dissolved organic matter (CDOM) that cause the scattering and absorption. These spectral characteristics cause large overestimation of CHL in the SSK [
16,
17]. The fluorescence line height (nFLH) data and enhanced Red-Green-Blue (ERGB) images derived from MODIS or Medium Resolution Imaging Spectrometer (MERIS) have been used in place of CHL data for red tide detection [
18,
19,
20]. However, distinguishing between red tide species and non-red tide species with similar CHL remains difficult. In particular, estimates of CHL may be inaccurate due to interactions between chlorophyll and the abundant SPM present in the SSK.
To overcome the limitation of red tide detection using CHL data, the optical properties of seawater have been used to detect red tides [
12,
13,
21,
22,
23,
24,
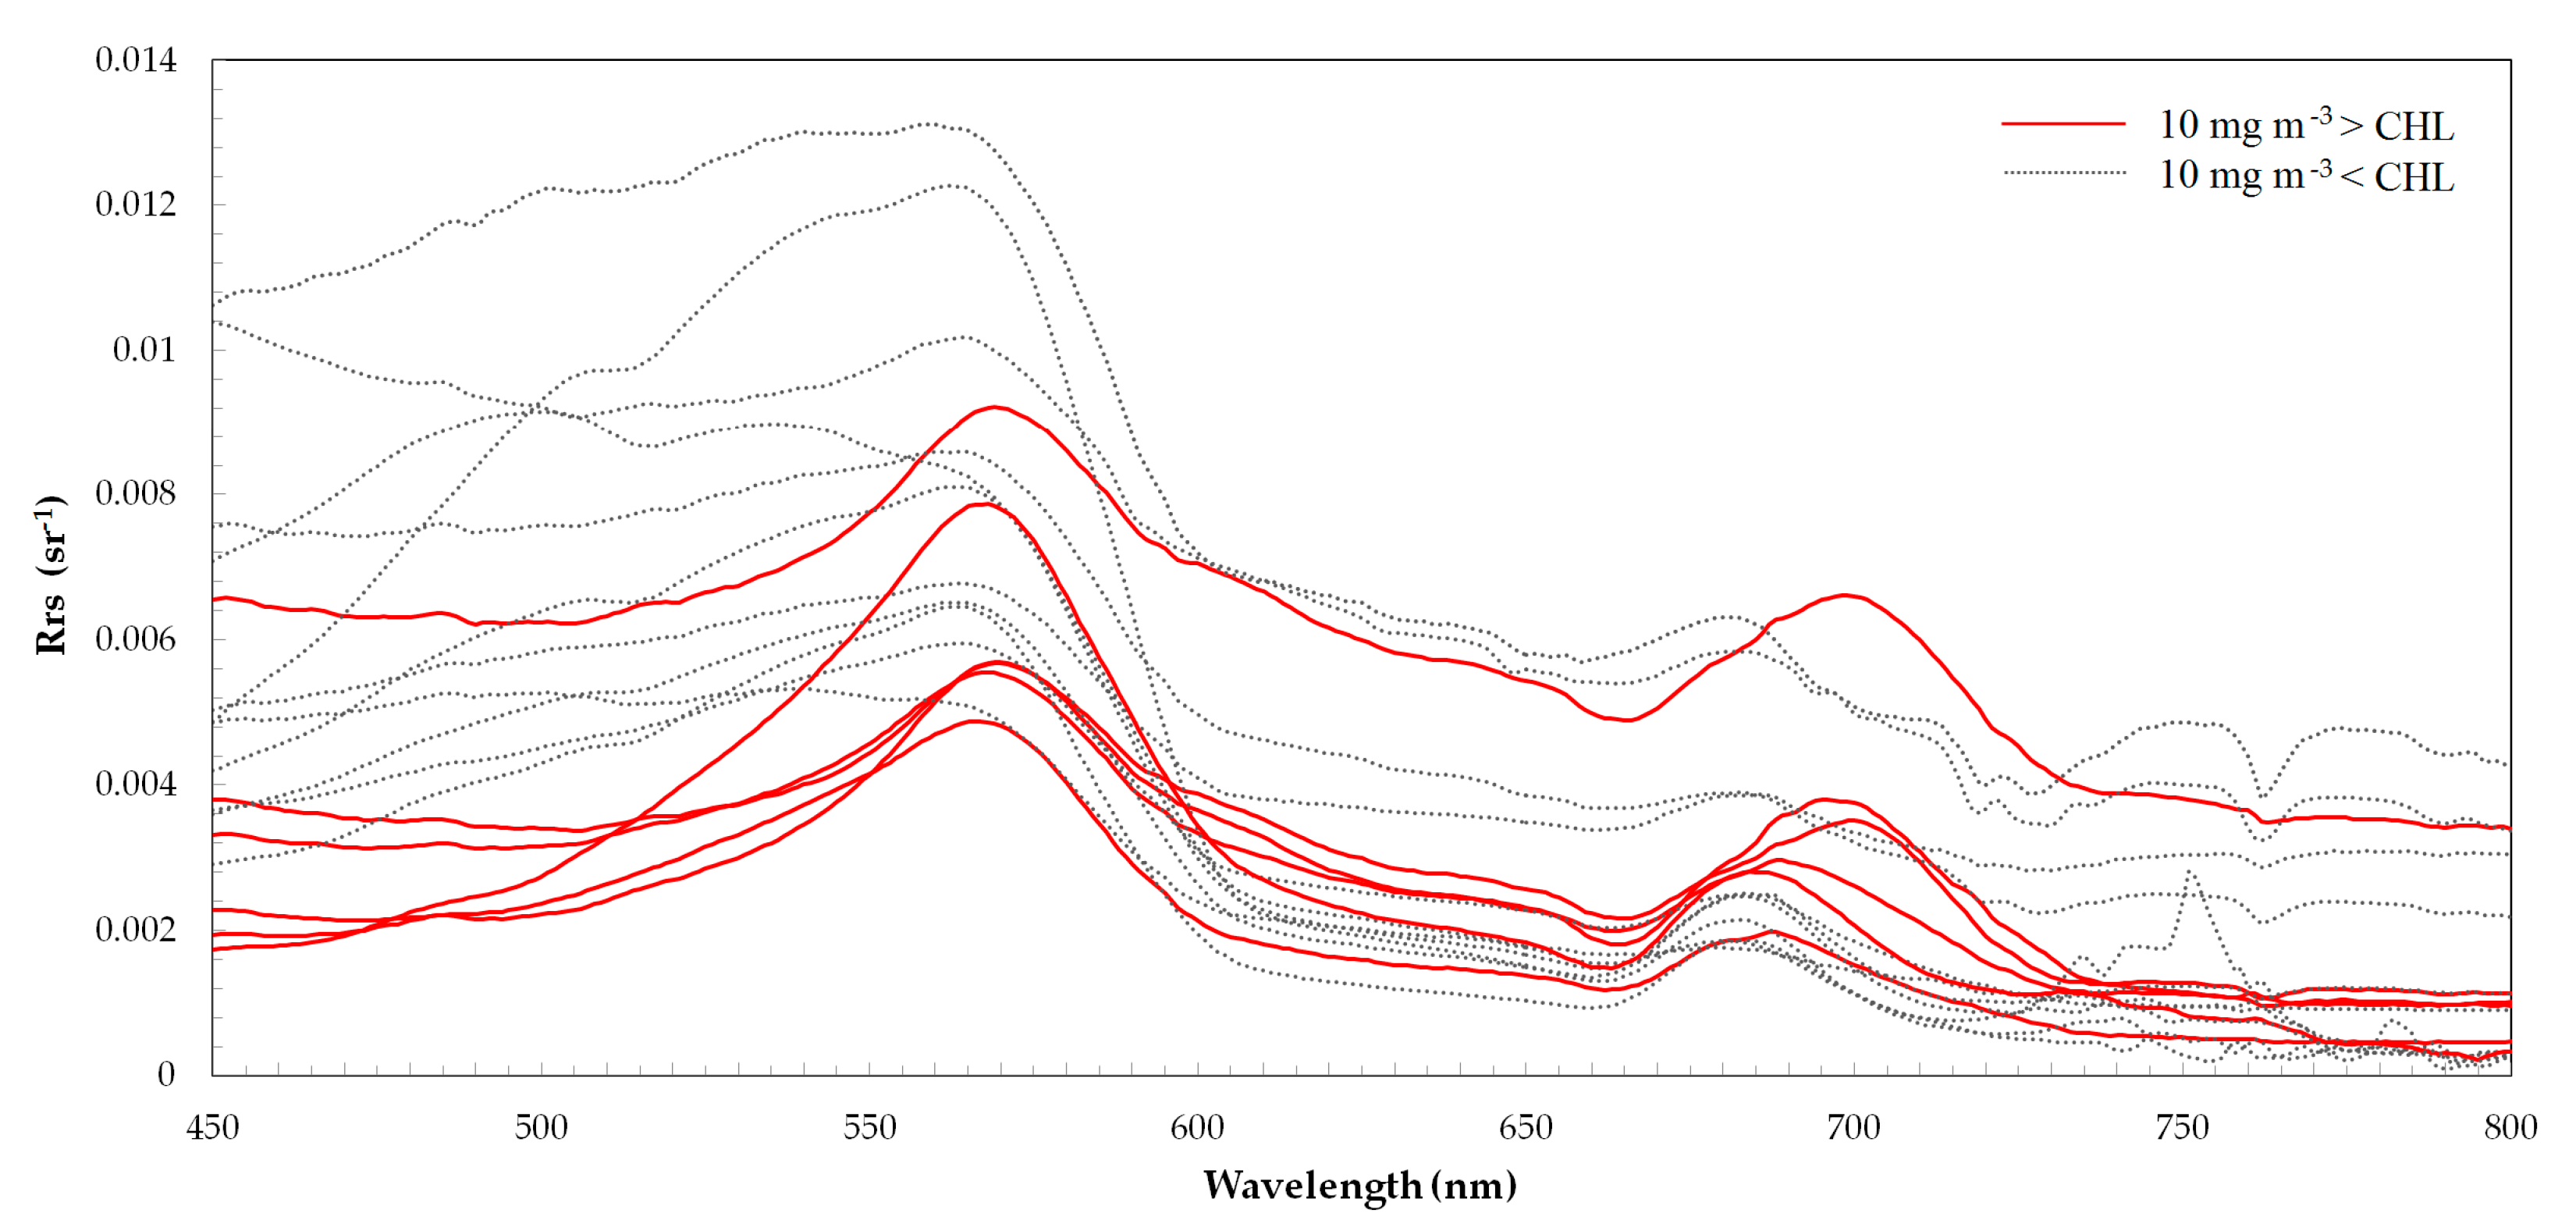
25]. Dierssen et al. [
21] and Sasaki et al. [
22] found that the peak of remote-sensing reflectance (R
rs) in visible regions was shifted to long wavelengths (570–590 nm) region during red tide blooms. Cannizzaro et al. [
23] reported that
K. brevis blooms exhibit high CHL but low backscattering values. Wynne et al. [
24] and Tomlinson et al. [
12] suggested that the low backscattering observed in
K. brevis blooms and low detrital absorption may affect the spectral reflectance curve in the blue portion of the visible region. Lou and Hu [
25] developed a modified red tide index (MRI) based on the spectral characteristics of
Prorocentrum donghaiense, which is low in the blue region but high in the green region. Other methods include the use of SPM and sea-surface temperature data collected during red tide blooms [
11,
26] and schematic processes of red tide and non-red tides through spectral classification techniques [
16,
27,
28].
Most methods for red tide detection have been developed based on SeaWiFS, MODIS, and Geostationary Ocean Color Imager (GOCI), because ocean color sensors have higher spectral resolution and signal-to-noise ratio (SNR) than terrestrial sensors such as Landsat Enhanced Thematic Mapper Plus (ETM+), Operational Land Imager (OLI), and Sentinel-2 MultiSpectral Instrument (MSI). These characteristics lead to a high detection rate for red tide patches mixed with seawater and provide an excellent estimate of red tide abundance. Despite the many advantages of ocean color sensors, red tide information often cannot be acquired in coastal areas due to low spatial resolution and coastal masking caused by the uncertainty of atmospheric correction in coastal areas where turbidity is high. As an alternative to ocean color sensors, the use of terrestrial sensors is recommended. Compared with ocean color sensors, the spectral resolution of terrestrial sensors is low. On the other hand, they have excellent spatial resolution. Therefore, terrestrial sensors can provide useful information for red tide detection in coastal areas. In addition, because the terrestrial sensor has a band in the wavelength range used in the red tide detection algorithm, it can be employed with the existing algorithms.
A comprehensive approach based on the characteristics of each sensor is useful for accurate red tide detection over a wide range of conditions, including coastal and offshore areas. There are several issues caused by using multi-sensor data in red tide detection. Various factors such as spatial resolution, spectral resolution, SNR, the modulation transfer function (MTF), the difference in image acquisition time, atmospheric correction, and geo-referencing errors can affect the results of red tide detection. Due to these differences, even when the same red tide detection algorithm is applied to each sensor, the red tide distribution extracted may differ among the sensors. Because it is very difficult to consider all characteristics of various sensors, a red tide detection technique using multi-sensors requires further research. To date, few studies have employed multi-sensors for red tide detection. According to Wang et al. [
29], the spatial resolution of HJ-CCD is better than that of MODIS. Thus, its extraction result is better than that of MODIS. Oh et al. [
30] qualitatively compared red tide areas extracted from MODIS and GOCI. Tao et al. [
13] noted that when an MRI [
25] is applied to MODIS imagery (802 at 488 nm), high values are obtained for near-shore areas due to their low SNR compared to GOCI (1316 at 490 nm) in the blue band. Shin et al. [
31] performed the red tide detection through image fusion of GOCI and Landsat OLI. Red tide detection in the coastal area is carried out using Landsat OLI, while GOCI was used in offshore waters with severe noise caused by sea current and ship trajectories. Using multi-sensor detection rather than a single-sensor, it is possible to extract red tide areas that are more similar to the true value due to improved accuracy of red tide detection.
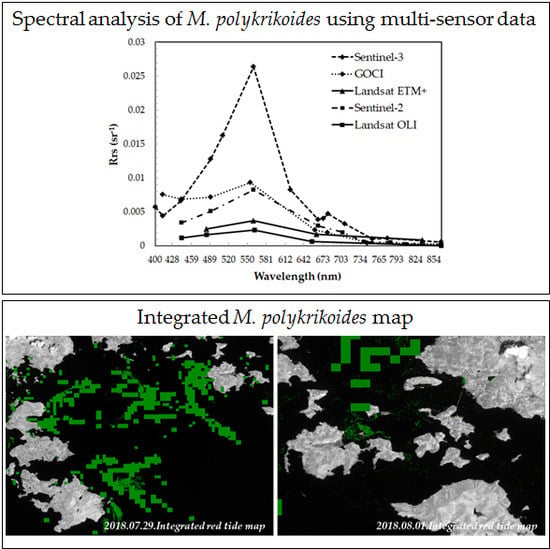
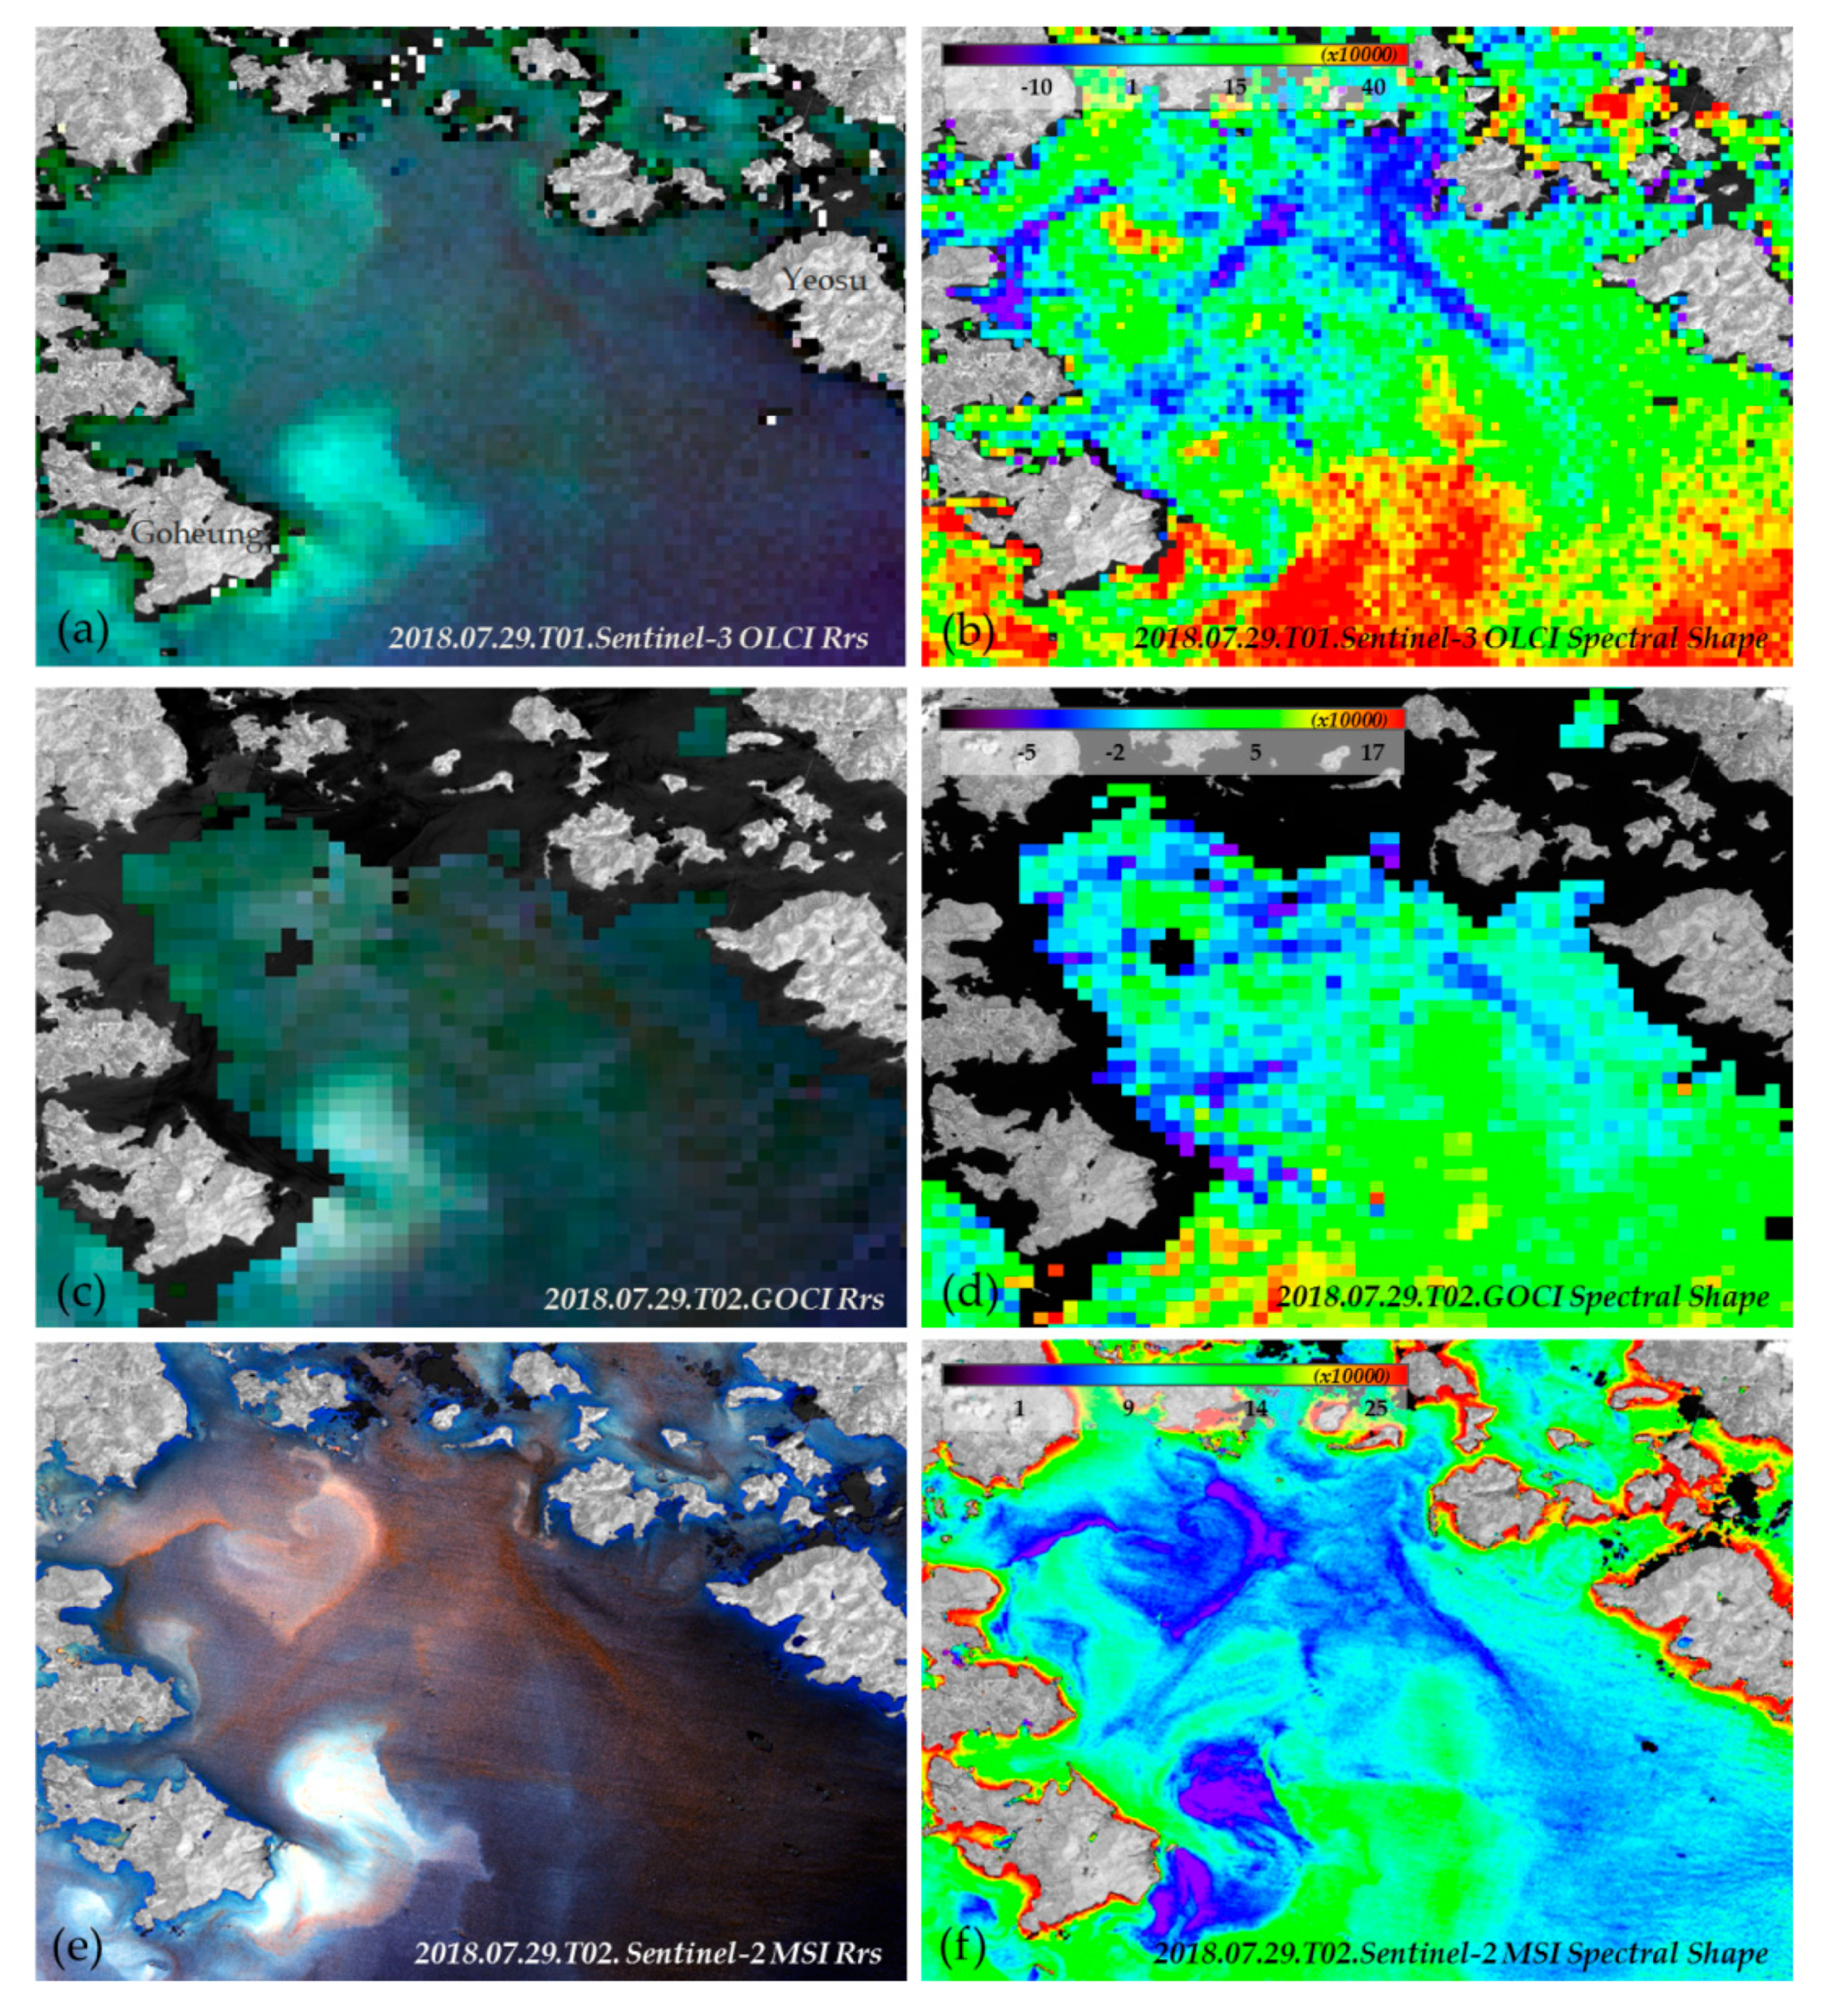
The objective of this study was to identify a possible synergistic effect of multi-sensor data on the detection of M. polykrikoides blooms. For this purpose, we (1) investigated the specifications of various sensors to determine the pros and cons of each sensor’s data; (2) analyzed the spectral characteristics of waters containing M. polykrikoides obtained from in situ measurement; (3) compared Rrs true-color composite and Spectral Shape images created using multi-sensor data for visual inspection and comparison of red tide patches; (4) generated an integrated red tide map using all possible images; and (5) presented the results of statistical evaluation to identify the synergistic effect of multi-sensor data.
4. Discussion
Previous studies have reported a relationship between CHL and cell abundance. Tester et al. [
14] found that a chlorophyll anomaly of 1 μg L
−1 would represent an increase of 10
5 cells L
−1 of
K. brevis, and that remote sensing data can detect
K. brevis along the Florida coast at concentrations above 50,000 cells L
−1. Choi et al. [
48] reported that cell abundance and CHL of
M. polykrikoides in the East Sea of Korea (ESK) are highly correlated (R
2 = 0.99), suggesting that changes in CHL could be determined by changes in
M. polykrikoides cell abundance. From calculations based on their observations, one
M. polykrikoides cell contained ~73 pg chlorophyll during this bloom period. However, Shin et al. [
27] found that estimation of cell abundance from CHL has limitations, as CHL in seawater is determined based on internal chlorophyll content from a mixture of red tide species. Ahn et al. [
49] calculated the amount of chlorophyll per cell for red tide species to determine the internal chlorophyll content of each red tide species.
M. polykrikoides and
Akashiwo sanguinea are red tide species with relatively high internal CHL, while the heterotrophic species
Noctiluca scintillans does not have or contains less internal chlorophyll. If red tide species with different internal chlorophyll contents are mixed in the water, it is very difficult to estimate cell abundance from CHL. This relationship is particularly complicated for
M. polykrikoides because it coexists with other red tide species in the SSK. In addition, estimation of CHL is a great challenge in waters with complex optical properties [
17]. Studies have shown that CHL algorithms that do not consider the influence of SPM can exhibit large errors in turbid waters [
50,
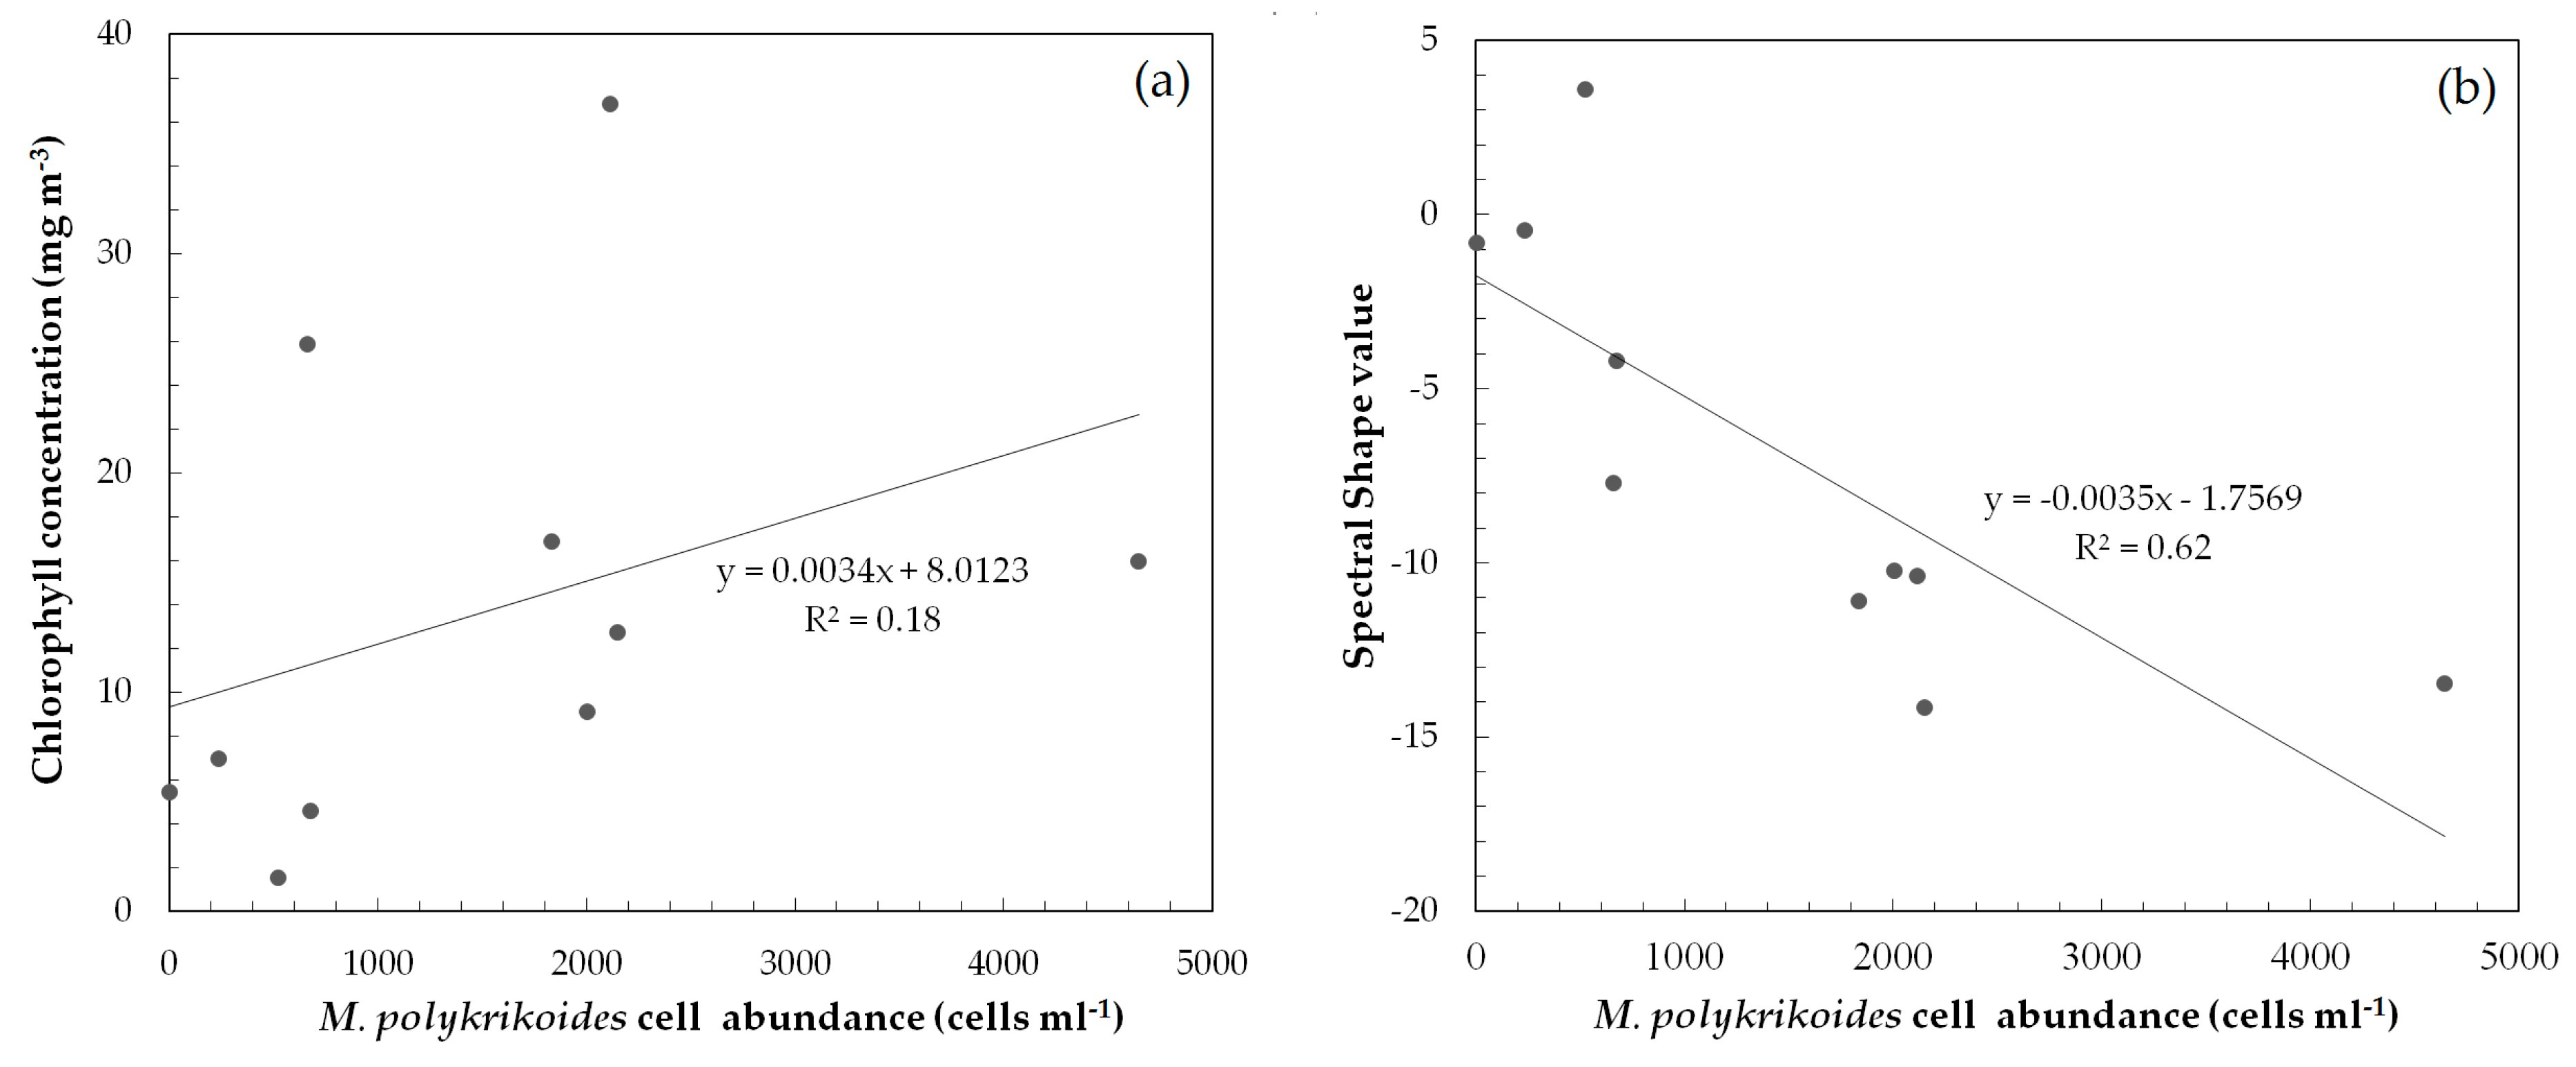
51]. The waters around the Korean peninsula have diverse optical properties, ranging from relatively clear waters in the East/Japan Sea to extremely turbid waters in coastal regions. Because the ESK has clear water prevailing in chlorophyll, it is possible to estimate cell abundance in that area from CHL, as reported by Choi et al. [
48]. In contrast, estimating cell abundance from CHL in the present study area of the SKK was difficult because SPM and CDOM could affect CHL estimation. In fact, the correlation between CHL and cell abundance in this study was low.
Table 6 shows how many false positive (
nmr-MR) were obtained. Because the field survey has the limitations of observation areas, it is difficult to find all red tide areas. False positive means the part that was detected from the satellite but not detected from the field survey. In other words, the areas of false positive may be red tide areas that has been detected as false or has not yet been detected in the field survey. It may be used as a complement to the field survey, but it needs to be considered as the red tide suspicious areas. Several factors can reduce the accuracy of statistical assessment for red tide detection using multi-sensor data. Obtaining multi-sensor data collected at the same time is difficult. In this study, we confirmed that the red tide patches moved slightly, despite using images obtained within a maximum of 1 h. Red tide areas extracted from near-coincident multi-sensor data might also differ from the red tide report provided by NIFS. The red tide report is created by summarizing fishermen’s reports and results of a daily field survey for red tide detection [
6]. Hence, red tide areas extracted in this study might not represent the red tide distribution for the whole day, as the images used herein were acquired at about 02:00 GMT. Another factor that should be considered in red tide detection is vertical migration of red tide species. Some red tide species migrate vertically according to changes in light, temperature, and nutrients in the water [
52].
M. polykrikoides is a relatively slow growing red tide organism. Therefore, it may not be able to outgrow red tide diatoms, flagellates, and other dinoflagellates under the same environmental conditions [
7]. However,
M. polykrikoides has the ability to swim fast and can theoretically reach 50 m in depth. Thus, it may outgrow other red tide species under conditions of low nutrients and high solar insolation. Some studies have investigated the vertical migration of red tide species using satellite data. Choi et al. [
48] found that
M. polykrikoides cell abundance was highest at 05:25 GMT by investigating hourly variations in GOCI-derived chlorophyll images. On the other hand, low cell abundances were observed in the early morning and late afternoon. Lou and Hu [
25] noted that a
P. donghaiense bloom increased from early morning to early afternoon. The bloom size was calculated from MRI using GOCI-derived R
rs. Indeed, GOCI is an optimal sensor for observing vertical migration of red tide species due to its excellent temporal resolution. However, due to its limitation of spatial resolution, it is poor at detecting red tides near the coast. The images used in this study except for GOCI were acquired at about 02:00 GMT, because all sensors are on polar-orbiting satellites with sun-synchronous orbits. Therefore, creating an integrated red tide map representing the entire day from satellite images alone is a great challenge.
SNR and spectral resolution are important factors that determine the red tide detection ability of any sensor. SNR and image quality are highly correlated, and are related to image metrics such as pixel size and edge sharpness [
53]. SNR is not constant within an image, but is a function of the scene radiance level [
54]. Its performance may drive tradeoffs in terms of the design and cost of the satellite sensor. In general, improved SNR comes at the cost of poorer spatial resolution, lower spectral resolution, less coverage, larger optics, and higher data rate. Ocean color sensors have high SNR and spectral resolution but low spatial resolution compared to terrestrial sensors. On August 1, 2018, a red tide occurred along the coast of Namhae. It was not detected at all by GOCI (
Table 6). On the other hand, on 30 July 2018, as shown in
Figure 6f, almost no red tide was detected in Landsat OLI, even though the coast was not masked. In other words, when red tide detection is performed using only a single sensor, estimating the overall red tide occurrence area is difficult. SNR is also related to the minimum cell abundance that can be detected in a satellite image. When low cell abundances can be detected by various sensors, it may be possible to improve the red tide warning system by complementing these data with the existing field survey.


