Article

Deformations and Morphology Changes Associated with the 2016–2017 Eruption Sequence at Bezymianny Volcano, Kamchatka

1
Department of Geophysics, GFZ German Research Centre for Geosciences, Telegrafenberg, 14473 Potsdam, Germany
2
Institute of Volcanology and Seismology, Far East Branch, Russian Academy of Sciences, Piipa boulevard, 9, 683006 Petropavlovsk-Kamchatskii, Russia
3
Kamchatkan Branch of Geophysical Survey, Russian Academy of Sciences, Piipa boulevard, 9, 683006 Petropavlovsk-Kamchatskii, Russia
*
Author to whom correspondence should be addressed.
Remote Sens. 2019, 11(11), 1278; https://doi.org/10.3390/rs11111278
Submission received: 29 April 2019 / Revised: 22 May 2019 / Accepted: 24 May 2019 / Published: 29 May 2019
(This article belongs to the Special Issue Remote Sensing of Volcanic Processes and Risk)

Abstract

:
Lava domes grow by extrusions and intrusions of viscous magma often initiating from a central volcanic vent, and they are frequently defining the source region of hazardous explosive eruptions and pyroclastic density currents. Thus, close monitoring of dome building processes is crucial, but often limited to low data resolution, hazardous access, and poor visibility. Here, we investigated the 2016–2017 eruptive sequence of the dome building Bezymianny volcano, Kamchatka, with spot-mode TerraSAR-X acquisitions, and complement the analysis with webcam imagery and seismic data. Our results reveal clear morphometric changes preceding eruptions that are associated with intrusions and extrusions. Pixel offset measurements show >7 months of precursory plug extrusion, being locally defined and exceeding 30 m of deformation, chiefly without detected seismicity. After a short explosion, three months of lava dome evolution were characterised by extrusions and intrusion. Our data suggest that the growth mechanisms were significantly governed by magma supply rate and shallow upper conduit solidification that deflected magmatic intrusions into the uppermost parts of the dome. The integrated approach contributes significantly to a better understanding of precursory activity and complex growth interactions at dome building volcanoes, and shows that intrusive and extrusive growth is acting in chorus at Bezymianny volcano.

Graphical Abstract

1. Introduction

Many active volcanoes, about 200 worldwide [1], generate lava domes that are often characterised by hazardous explosive eruptions that involve flank instability [2]. As domes grow, the outer flanks oversteepen until they collapse and perilous pyroclastic flows are produced that purge down the slopes, affecting regions at kilometres distance to the dome [3]. Lava domes are thought to grow by interactions between magma injections into the dome (i.e., endogenous dome growth) and the addition of extrusion layers on the top of the carapace (i.e., exogenous dome growth) [4,5,6,7]. So far, these two styles of growth are considered as endmembers, with few examples showing higher complexity that could be instrumentally recorded in nature, such as at the dome building volcanoes Mount St. Helens, Unzen, or Soufrière Hills [5,6,7]. Geophysical sensors often observe short-term precursors, such as seismicity, enhanced rockfall intensity, alternating volcanic gas emissions, or localised deformation when magma reaches shallow depths prior to imminent eruptions [8]. Interferometric Synthetic Aperture Radar (InSAR), for example, provides an estimation of precursory deformation on the mm to cm scale over short [9] and long [10] periods of time, yet the technique is affected by atmosphere and it is less effective when volcanoes are covered in snow or when ground motion exceeds the maximum detectable deformation gradient [11]. Moreover, determining deformation that is associated with dome building volcanoes, and therefore identifying the particularities of lava dome growth, is challenging due to the small dimensions and the hazardous access of most domes. Successful approaches barely include in-situ and, more often, remote sensing approaches, such as ground-fixed cameras [12,13] or satellite radar amplitude images [14,15,16]. A noteworthy case of the strength of camera monitoring for tracking deformation is that of Mount St. Helens during the 2004–2008 dome growth episode, which allowed for the spatial and temporal quantification of endogenous and exogenous growth [17]. The value of satellite radar observation, on the other hand, was underlined during the 2010 cataclysmic eruption at Merapi, where Synthetic Aperture Radar (SAR) amplitude scenes provided vital support in the early detection of dome growth and the associated hazard assessment [14]. The weaknesses of SAR, in turn, come from the poor revisit period (several days), and geometric distortions that limit interpretations due to the regions of shadow, foreshortening, and layover effects.
Here, we integrate the strengths of these techniques to better understand the current dome growth mechanisms acting during the January 2016–June 2017 eruption sequence at Bezymianny. We use camera monitoring to roughly identify topographic changes at Bezymianny’s flank, and we employ a pixel offset tracking algorithm on high-resolution TerraSAR-X amplitude images to quantify ground motion in range and azimuth direction. We show the details of plug extrusion that were identified at least seven months before the first documented effusive eruption, and that exogenous growth at Bezymianny was likely preceded by intrusions into the northern part of the composite dome. The complexity of the observed cascade suggests that this finding may also provide a basis for dome growth observation at other dome building volcanoes, ultimately promoting the understanding of dome growth and related hazard assessment.

2. Bezymianny

2.1. Volcanological Background

Bezymianny is an andesitic, dome building volcano (~3000 m a.s.l.) that is located within the Klyuchevskoy Group of Volcanoes (KGV) in Kamchatka, Russia (Figure 1a). It is thought that Bezymianny, Klyuchevskoy, but also the further south located Tolbachik, derive their fluids from a common deep parental magma chamber at 30 km depth [18,19]. During ascent beneath Bezymianny, the volatile-rich magma arrests at different levels, which are likely associated with magma chambers, at approximately 15 km and 5 km, but also possibly at 1.5 km depth [18,20,21,22].
Bezymianny is a relative young volcano (5.5 ka) whose geologic history was characterised by major eruptive activity between 2400 and 1700 and 1350–1000 before present [23]. In 1955–1956, Bezymianny re-emerged with a phase that culminated in a cataclysmic sector collapse and directed lateral blast eruption, which left behind a horseshoe-shaped crater moat (Figure 1b) [24,25,26]. Eruption characteristics showed strong similarities to the catastrophic eruption at Mount St. Helens in 1980 [27,28,29]. After the 1956 eruption at Bezymianny, near-continuous, mostly endogenous dome growth started to fill the horseshoe shaped crater floor until 1965 [24,25,30,31]. Since 1977, on average, 1–2 explosive eruptions occurred, which showed a characteristic cyclic behaviour: initially, days to weeks long-lasting summit plug extrusions were followed by Vulcanian explosions and pyroclastic flows; eruptions then eventually ceased with lava flow emplacements and degassing until the volcano became quiet again [30,31]. Only few eruptions during the 1980′s and 1990′s were solely characterised by effusive activity, or lava flow emplacements prior to explosions [30]. By 2004, Bezymianny’s dome was completely covered with lava flows, and multiple explosions on its top between 2005 and 2012 a new relatively stable summit crater [19,32,33]. After four years of quiescence, activity initiated in 2016 and was followed by long effusive activity (5 December 2016–9 March 2017) and two strong explosive eruptions on 9 March and 16 June 2017 [31]. Today, the morphology of Bezymianny is characterized by the remnants of the 1956 sector collapse amphitheatre (the “somma”) and the presence of an approximately 500–600 m high composite dome in the centre (Figure 1b).

2.2. Monitoring Activities at Bezymianny

Bezymianny is one of the most active volcanoes in Kamchatka that poses a risk to air traffic between North America and Asia. However, multiparametric and long-term monitoring is challenging due to the remoteness of the volcano. During the past two decades, seismic monitoring was realized by the Kamchatkan Branch of Geophysical Survey [34], allowing for eruption precursor identification days to weeks before eruptions [35]. Enhanced frequency of rockfalls from the central dome is easily identified and indicative of renewed activity at Bezymianny [35,36]. Besides characteristic tremors and high frequency seismic signatures, long-period (LP) seismicity may also identify heralding eruptions [19], but earlier studies suggest that only one out of four eruptions were preceded by LP events [36]. Eruptions at Bezymianny are sometimes concurrent with activity at Klyuchevskoy, which may strongly obscure the records of Bezymianny’s seismic activity [35,36].
Besides the routine seismic monitoring, increasing importance has been ascribed to remote sensing data analysis. Remote sensing comes with two main motivations: first, general monitoring of the volcanic activities exploiting cost-free data and web portals; second, experimental and scientific in-depth analysis of selected volcanic crisis. For instance, the instruments of the Advanced Spaceborne Thermal Emission and Reflectance Radiometer (ASTER) have been episodically used to study heat radiation during eruptions of the last few decades [37,38,39]. Overall, these studies have identified enhanced ground temperature anomalies as a common precursor for Bezymianny’s eruptions, although two eruptions were reported without a preceding change in the thermal level [39].
Yet, existing real-time monitoring methods, as well as event-based observations, could not assess detailed dome growth processes of Bezymianny. Here, we investigate webcam images and high-resolution satellite radar data that cover the December 2016–June 2017 eruption sequence at Bezymianny. The data catalogue enabled the observation of the volcano with unprecedented precision of precursory activity, as well as exogenous and endogenous dome growth.

3. Data and Methods

This study concentrates on camera monitoring and satellite radar data acquired in 2016 and 2017. The eruption had a precursory phase, as identified by rockfalls and seismicity, then an effusive eruption between 5 December 2016 and 28 February 2017, followed by (i) the effusive and explosive eruption on 9 March, and then (ii) the explosive 16 June 2017 eruption. Details of these three stages (precursor–effusive–explosive) were identified in the data. We compare our camera and SAR results to the seismic records of Bezymianny [40].

3.1. Camera Monitoring and Mimatsu-Diagrams

Previous studies have demonstrated the strength of time-lapse camera analysis for the determination of morphology changes at volcanoes, which substantially contributed to the spatial deformation monitoring. Mimatsu (1962) already highlighted the significance of optical volcano monitoring by constantly recording the volcano’s changing shape on his office paper window during the dome growth episode at Showa Shinzan volcano, Japan. Johnson et al. [41] used video-derived imagery to track dome uplift at Santiaguito volcano, Guatemala, and successfully correlated the results with long-period seismic signals. A fixed camera network that was installed around Mount St. Helens, USA, permitted the precise estimation of growth and strain rates during the 2004–2008 spine extrusion [13,17]. Based on displacements between fixed time-lapse photographs, Walter et al. [42] showed that dome deformation at Merapi volcano, Indonesia, is strongly governed by the local topography. In this context, we used time-lapse imagery of Bezymianny during the 2016–2017 eruption series to record the changes at the summit following Mimatsu’s approach.
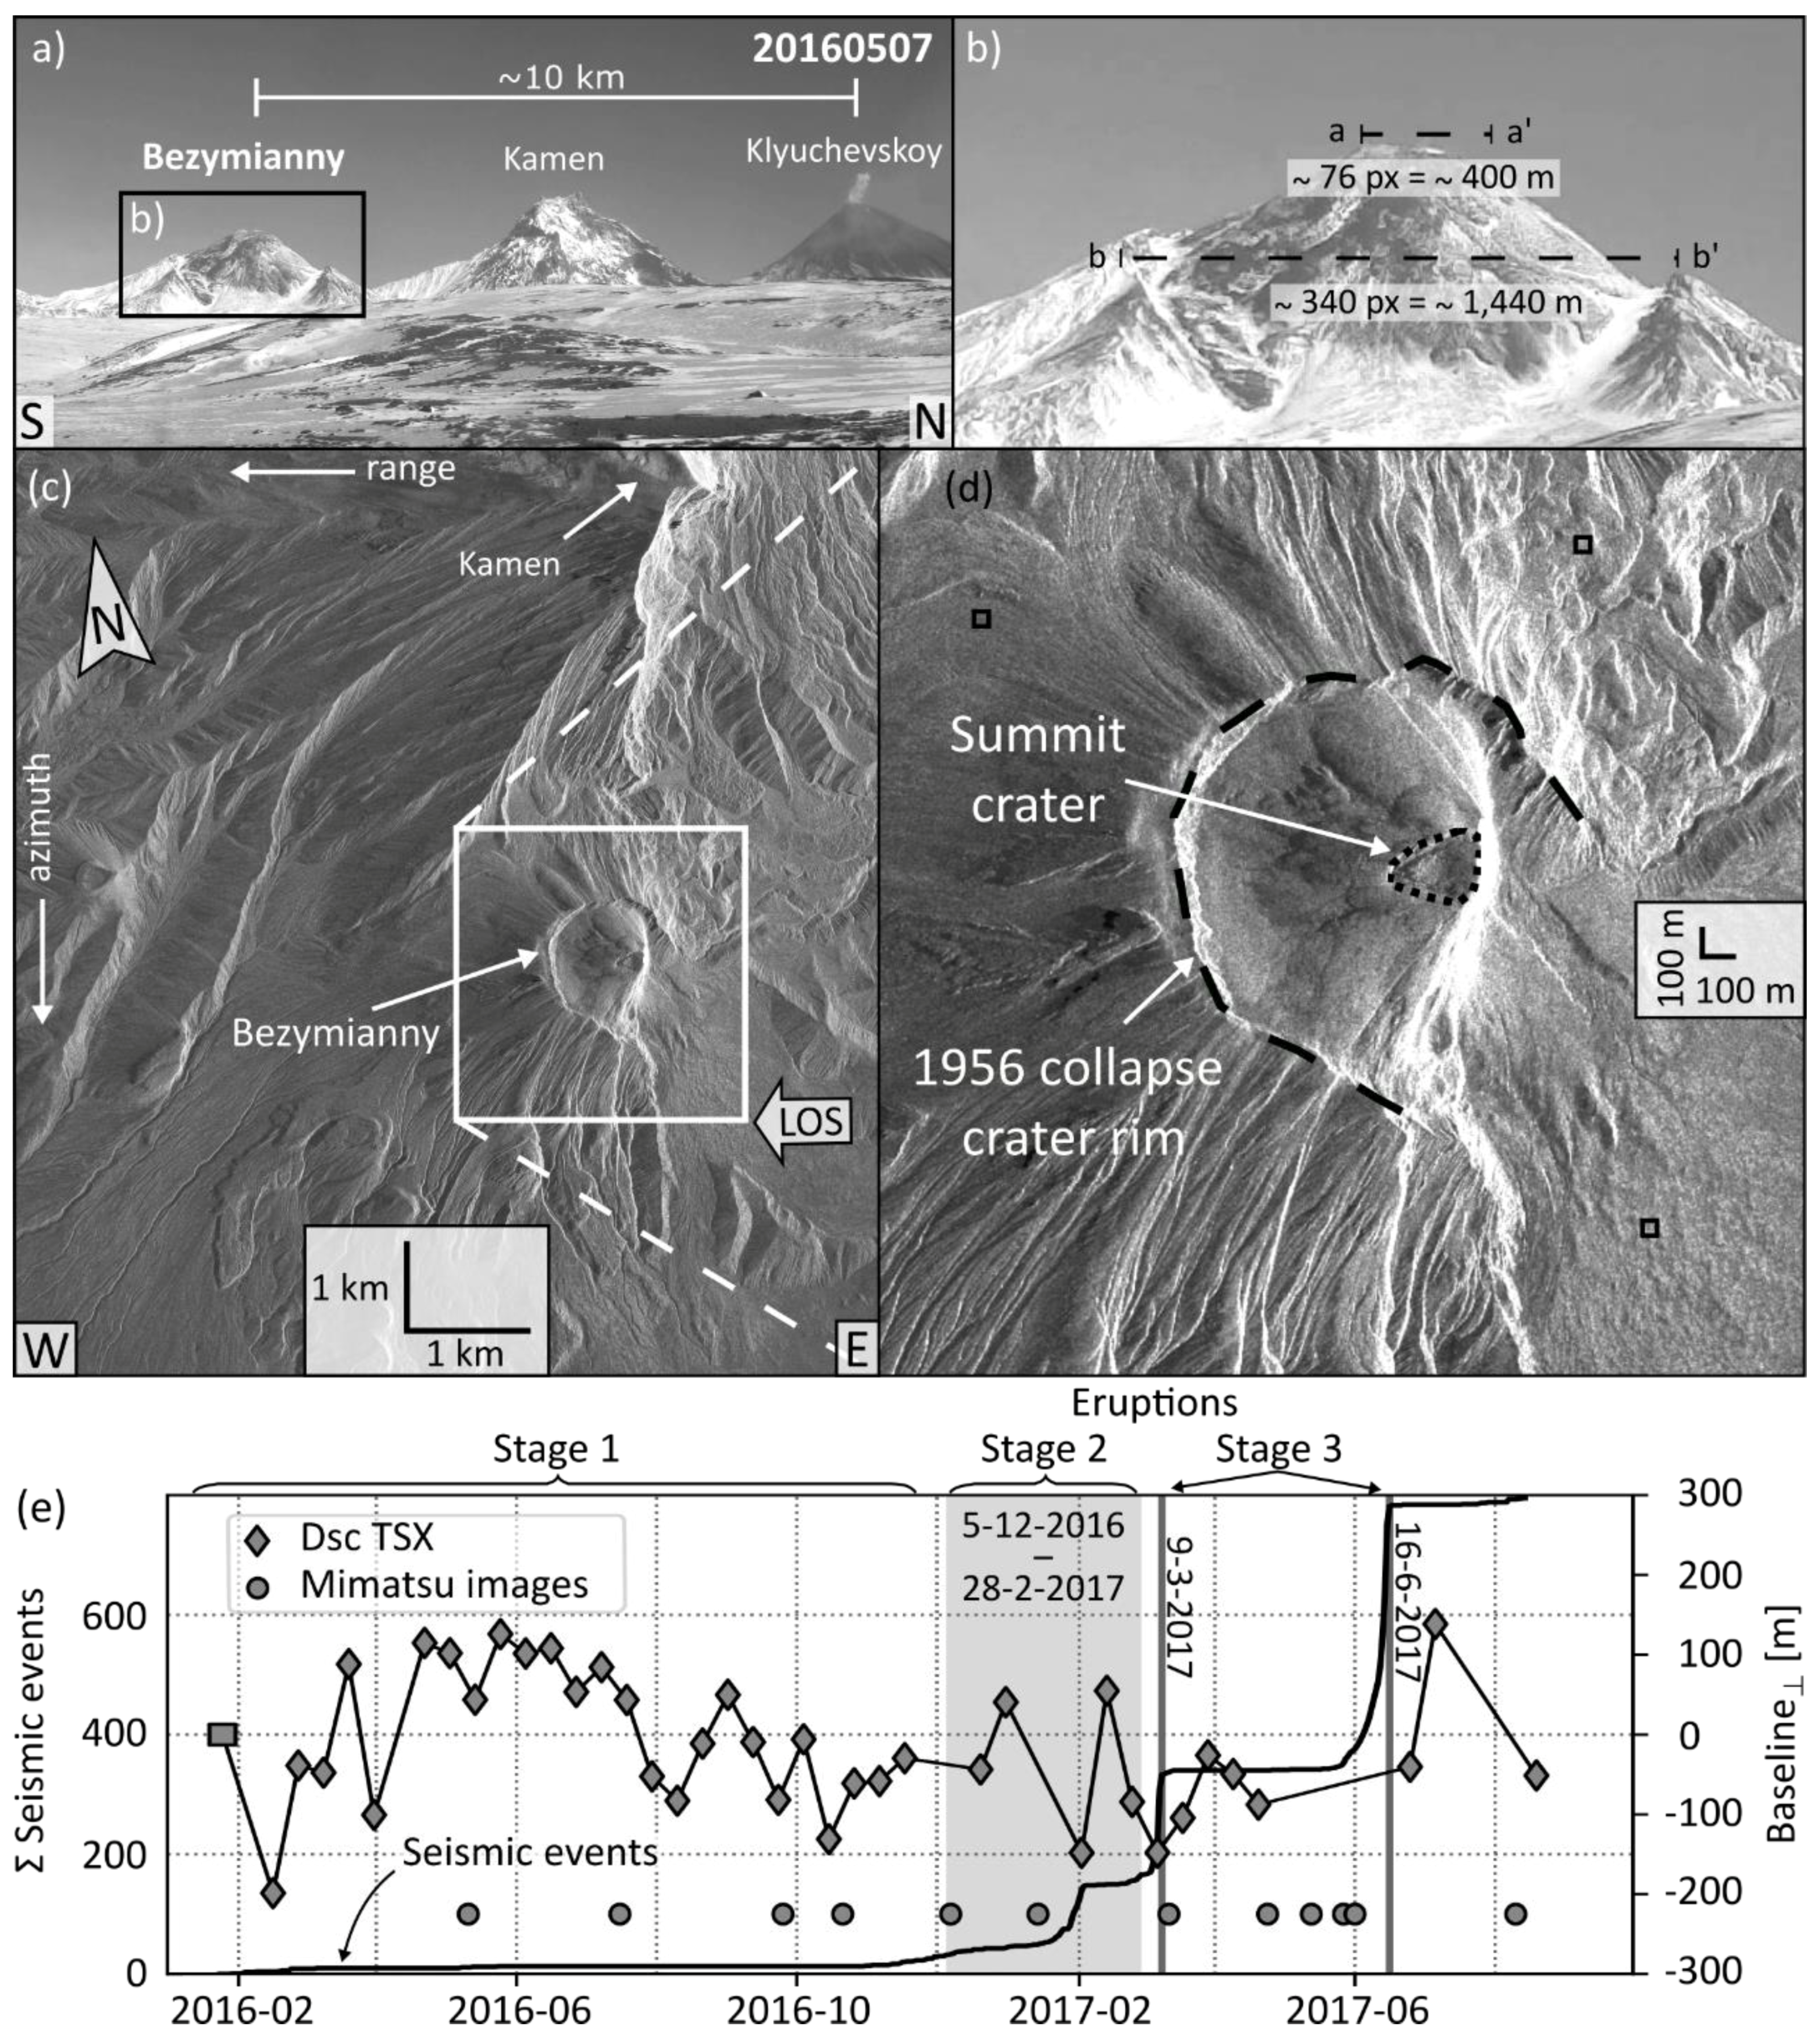
The employed day and night capable network camera (Axis P1346) that is operated by the Kamchatkan Branch of Geophysical Survey [43] has a focal length of 4 mm and it produces one image (2048 × 1536 pixels) per second (Figure 2a). The time-lapse camera is located 7 km to the southeast (160.696E, 55.94N; Figure 1a) and it captures Bezymianny as well as the neighbouring Kamen and Klyuchevskoy volcanoes. The investigated period from May 2016 to August 2017 encompasses 579,180 time lapse images. The images were weeded out for night, no-operation, and cloudy records, but also records where the camera lens was covered with snow. The remaining dataset was then visually checked for clear view and high contrast images that were taken at approximately the same daytime, of which 12 representative images were manually selected and cropped to the area of Bezymianny (Figure 2a,e and Figure S1). From the image stack, we follow the silhouette of the volcano image-by-image, which is referred to as a Mimatsu diagram. Image offsets due to strong winds, recurrent snow cover on top of the camera, and/or temperature changes of the installed camera gear are corrected by manual alignment (translation in x and y, rotation around the image centre) of all the images with respect to the master scene (7 May 2016). We favoured manual over automatic alignment as Bezymianny’s dome was recurrently covered with snow, limiting automatic algorithm performance.
To quantify topographic changes in the field-of-view (FOV), two scales were derived by measuring pixel distances between conspicuous landmarks on the master image (summit crater, 1956 collapse scar) that correspond to landmarks on the digital elevation model (Figure 1b and Figure 2b). Thus, the scale varies between ~4.2–5.3 m/pixel, which is related to the reduction of the three-dimensional topography into the camera’s two-dimensional FOV. As the pixels of the images are approximately squared, the scale is assumed to be valid for horizontal and vertical changes. Since most of the images unveiled insufficient contrast conditions and strongly varying colours (e.g., recurrent snow cover), the outlines of Bezymianny’s composite dome were manually mapped and stacked in the resulting Mimatsu diagram.

3.2. Synthetic Aperture Radar (SAR)

3.2.1. SAR Data Set and Amplitude Images

SAR systems emit electromagnetic pulses to the Earth’s surface. Based on the backscattered intensity (amplitude) and the time delay, the amplitude images are obtained from the illuminated surface independent of daytime and weather conditions [11]. Earlier applications have used SAR amplitude imagery to monitor and comprehend the evolution of dome building [14,15,16,44] and other volcanic processes [45,46,47]. At Bezymianny, we employ 39 descending (track 11) spotlight [48] TerraSAR-X satellite (TSX, wavelength = 31 mm) amplitude images that have been acquired between January 2016 and August 2017, with a recurrence time of mostly 11 days (Figure 2a and Figure S2, Table S1). The images were recorded with an incidence angle of 38.7°, and have a resolution cell (pixel) spacing of 0.9 × 1.25 m in slant-range and azimuth direction, respectively. We also studied eight ascending (track 64) (Figures S9, S10 and Table S2) spotlight-mode TSX images (incidence angle = 49°; 0.9 × 1.20 m in slant-range x azimuth, respectively). The backscattered radar signal is confined by the acquisition geometry, as well as the roughness and dielectric properties of the illuminated surface [11]. Thus, rougher and smoother surfaces correspond to brighter and darker pixels in the amplitude image (Figure 2d,e), respectively. To visualise the reflectivity changes between amplitude images, we created change difference maps [15] that show regions of unchanged, decreased, and increased reflectivity values with yellow, magenta, and green colours, respectively. We note that the amplitude information is strongly influenced by steep topography and the oblique radar acquisition geometry, which causes distortions, such as the foreshortening of Bezymianny’s eastern flank or shadowing at the summit crater floor (both track 11; Figure 2e). We mainly focus on track 11, as the viewing geometry of track 64 creates pronounced foreshortening and shadowing of the western and eastern flanks. However, although distortions in track 11 prohibit comprehensive observations of Bezymianny, the TSX amplitude data set provides unique information to determine exogenous and endogenous dome growth processes during the 2016–2017 eruptive sequence.

3.2.2. SAR Co-registration and Pixel Offset Measurements

Tracking pixel offsets of the co-registered SAR amplitude images may provide unambiguous range and azimuth quantification of surface displacements, where InSAR measurements become decorrelated [11,49]. Here, we co-registered all of the descending scenes with respect to the reference image (master) from 25 January 2016 with the Gamma remote sensing software (Gamma) [50] (Figure S3). We used a Pléiades digital elevation model (DEM) with a grid size of 2 m for real to SAR coordinate conversion. Look-up tables were calculated for the first scene (sub-master) of individual amplitude pairs, which subtracts topographic effects in the sub-master scene from range and azimuth pixel offsets. Moreover, to retain the deformation signal, orbital related offsets were subtracted via application of a cross-correlation based offset estimation, which determines a linear fit all over the offset tracking image pairs. Lastly, the TSX spotlight SAR scenes were deramped to remove azimuth ramps in the Doppler frequency. Subsequently, we employed an iterative image offset tracking algorithm with Gamma on the amplitude data with maximum resolution (i.e., no multilooking). Initially, we used a large tracking patch of 256 × 256 pixels (step-size = 4 pixels) to estimate the large pixel offsets. Then, we refined the offset estimation in a subsequent step with smaller patches that varied from 160 × 160 to 32 × 32 pixels to identify smaller displacements. To avoid aliasing of the spectrum, we oversampled the data by a factor of two. Appendix A details the error estimation.

4. Results

4.1. Precursory Ground Movement

4.1.1. Precursory TSX Observations

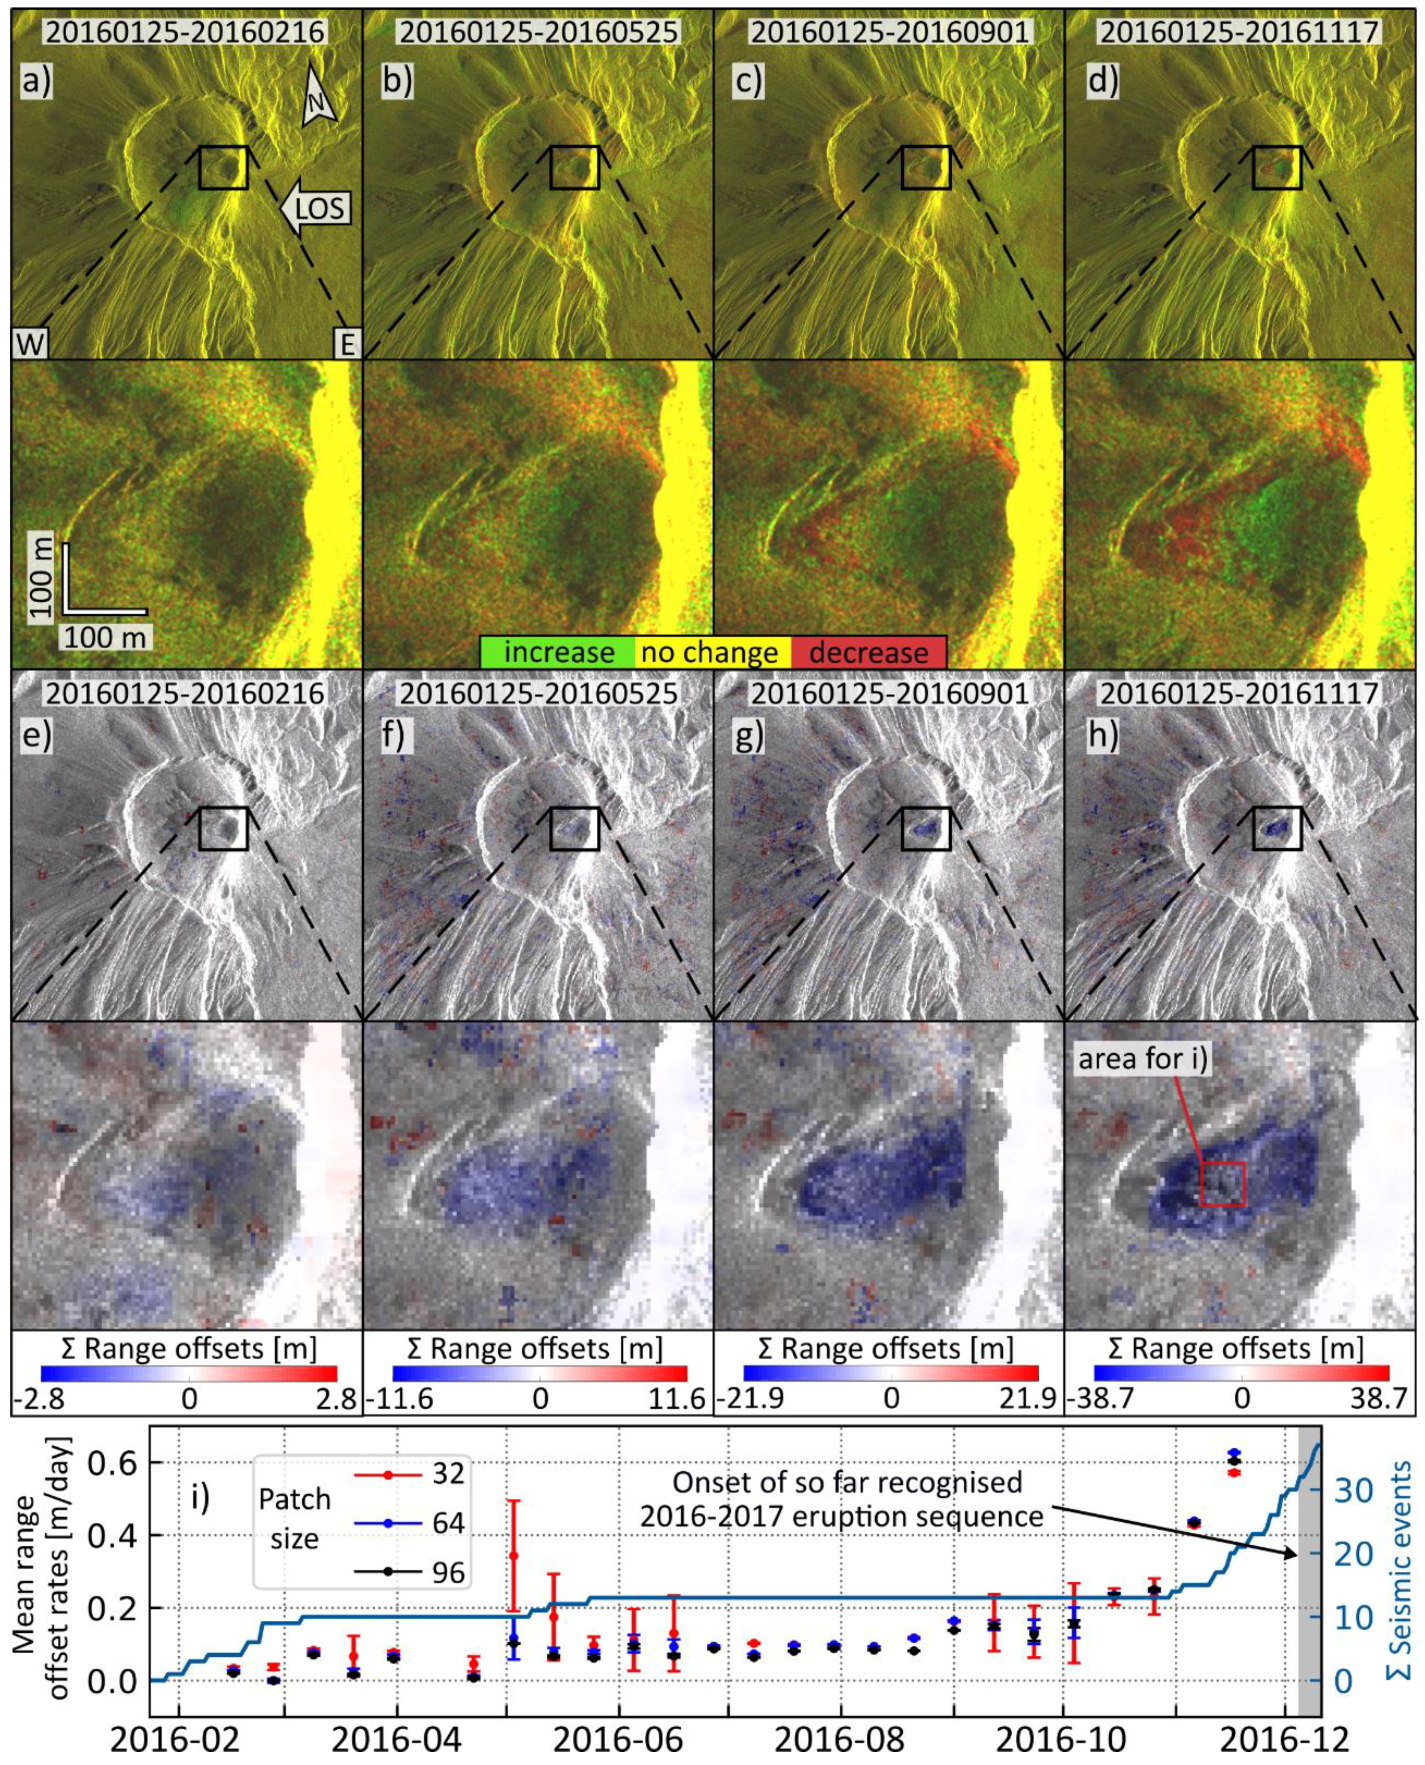
Analysis of 26 TSX amplitude images that were acquired between January and November 2016 provides detailed evolution of surface motion at Bezymianny before the first documented effusive eruption in December 2016. For this episode, we calculated range offset maps based on three cross-correlation patches (32, 64, 96 pixels), and derived mean range offset rates under consideration of the TSX recurrence time (Table S1) for a selected region within the summit crater (Figure 3h).
Initial ground motion (0–0.08 m d−1) is observed between January–April 2016, while the amplitude images do not show clear changes in reflectivity (Figure 3a,e). Simultaneously, only few seismic events occurred between February–March 2016. In May 2016, a new radar shadow area appears at the western portion of the crater floor, which gradually increases in size until August 2016 (Figure 3b). During this time, the crater floor moves at increased, but near constant, rates of 0.07–0.13 m d−1 towards the satellite (Figure 3i). By the beginning of September 2016, the shadow area considerably increased, but it started to diverge with brighter pixels in-between at its western portion (Figure 3c). Moreover, new radar shadows appeared at the north-eastern summit rim. Concurrent range pixel offsets within the summit crater show a stepwise increase from 0.16 to 0.23–0.25 m d−1 during October (Figure 3g,i). At the same time, and after five months of quiescence, seismic events were recorded again, and seismicity continued throughout November 2016. Simultaneously, the summit floor radar shadow considerably increased eastwards, and the ground motion is marked by the most significant stepwise increase from 0.43 m d−1 to 0.63 m d−1 (Figure 3d,i). Eventually, the total detected ground displacement at the summit crater floor amounts to approximately 39 m towards the satellite (Figure 3h).

4.1.2. Precursory Webcam Observations

To visually confirm the overall detected precursory TSX ground motion, we created a Mimatsu-diagram based on five clear webcam images acquired between May and December 2016 (Figure 4a,b). The camera images reveal slight growth of the summit between May–September 2016, whereas other images of the same period show intermittent translucent degassing and white steaming (Figure S7). First clearly distinguishable topographic changes are discernable in October 2016, where the eastern summit uplifts by 9–22 m, and elevations at the southern summit changes by 15 m in FOV. This topographic growth occurs at approximately the same time as the first significant rise of TSX range offsets (see above) and the onset of seismic activity in October 2016. Between September and beginning of December 2016, summit degassing significantly enhanced (Figure S7), and the 7 December 2016 Mimatsu image reveals a striking topographic uplift of 9–37 m of the eastern summit. The latter observations concurrently occurred with the gradual increase of detected seismic events as well as with the most significant increase of radar-derived ground motion detected in November 2016 (Figure 3).

4.2. Co-eruptive Ground Movement Observations

4.2.1. Co-eruptive TSX Observations

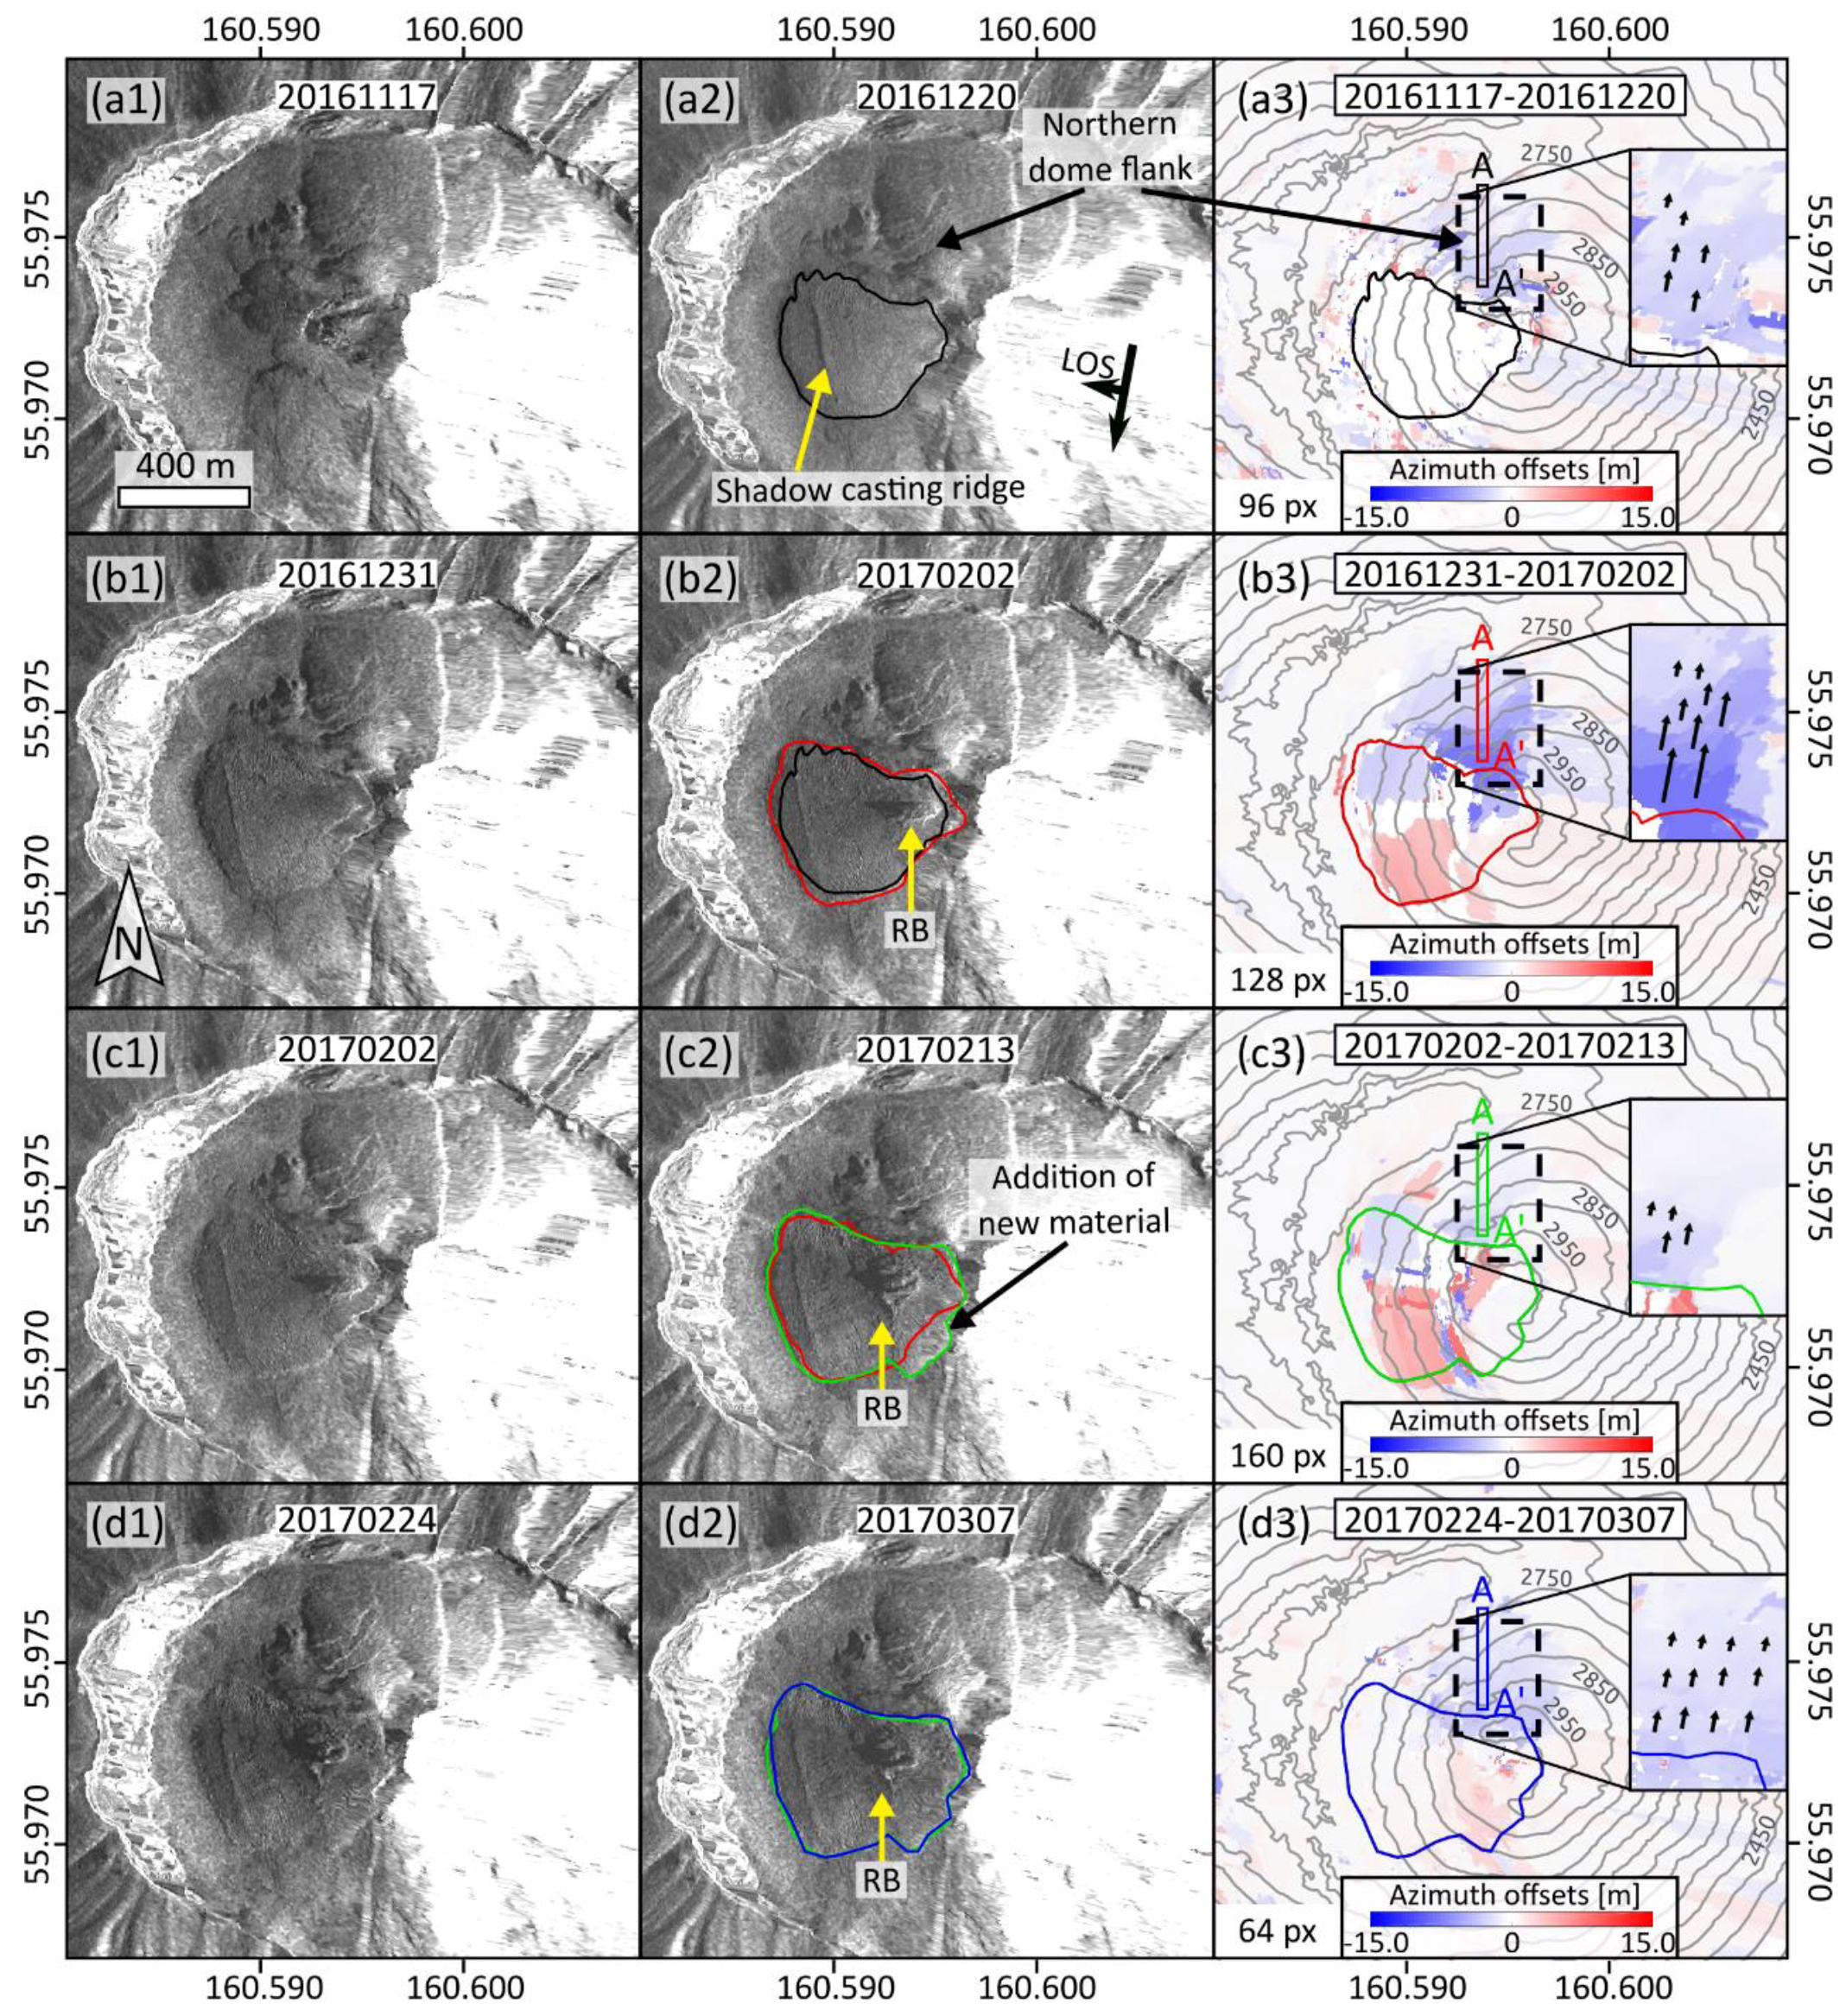
Co-eruptive TSX amplitude images reveal a tongue-like reflectivity change at the western dome, which depicts the emplacement of an extensive lava flow (flow 1) (Figure 5a2 and Figure S5). Its lower parts are marked by radar shadow casting crevasses, as well as radially and flow parallel oriented shadow casting ridges that are bisected by a significantly larger and irregularly oriented, but also flow perpendicular, shadow-casting ridge (Figure 6a). Between 17 November and 20 December 2016, the lava effusion is accompanied by northward-directed rigid (inelastic) bulging of the northern composite dome flank, and the detected azimuth offset rates increase with elevation from approximately 0.05 to 0.1 m d−1 (Figure 5a3 and Figure S5). During the end of December 2016, no motion of the northern carapace was determined (Figure S6), whereas between 31 December 2016 and 2 February 2017 the same motion direction and elevation-related distribution is observed, but at significantly higher rates of approximately 0.1–0.5 m d−1 (Figure 5b3 and Figure S5). A substantial increase in seismic activity is observed during the second half of January 2017, which rapidly decreases by the end of January 2017 (Figure 2e).
By beginning of February 2017, the surface fractures of flow 1 are widely distributed, and a new contrasting radar shadow appears at the summit that indicates uplift of a new rigid body (Figure 5b2). The subsequent scene from 13 February 2017 shows that the reflectivity pattern of flow 1 at the summit area significantly extended, and the shadow-producing rigid body moved westwards (Figure 5c2). Simultaneously, the northern flank bulges again northwards with rates between 0.1–0.3 m d−1 that increase with elevation (Figure 5c3 and Figure S5). In addition, azimuth offset maps between December 2016 and February 2017 reveal differential motion of flow 1, where its northern and southern segments move approximately north- and southwards, respectively. The following amplitude pair does not reveal significant azimuth ground motion anymore (Figure S6).
The azimuth offset map of the last descending amplitude image pair (24 February–7 March 2017) again reveals northward directed motion of the northern composite dome flank, where the rates repeatedly increase with increasing elevation from 0.1 to 0.4 m d−1 (Figure 5d3 and Figure S5). In addition, minor southward directed motion indicates the bulging of the southern flank. Lastly, the only ascending amplitude image pair (17–28 February 2017) of this episode shows southward directed motion of the southern composite dome flank (Figure S11), which implies that the southward and northward directed bulging detected in the last descending pair occurred at different times.
The beginning of March 2017 is characterised by a significant increase in seismic activity that culminated on 9 March 2017, when the first explosive eruption occurred (Figure 2e). The descending amplitude image from 18 March 2017 shows another tongue-like reflectivity change at the north-western composite dome flank, which reveals the outpouring of the second lava flow (flow 2) (Figure 6b). Subsequent scenes do not unveil significant changes neither of flow 2 nor of the dome flanks (Figure S2). The surface reflectivity of flow 2 is more homogeneously distributed than that of flow 1.
By end of May 2017, seismicity picked-up and significantly increased until 16 June 2017, when the second explosive eruption occurred. The descending change difference map between the 18 March and 25 June 2017 amplitude images shows strongly lifted reflectivity within the western and northern 1956 crater moat (Figure 6c). Most of the surface of the two previously emplaced lava flows is now covered by new material, which corresponds to the pyroclastic deposits that were observed in aerial photographs from July 2017 (Figure 6d).

4.2.2. Co-eruptive Webcam Observations

Only one clear image could be selected to determine morphologic changes during the co-eruptive episode because of strong fumarolic activity at Bezymianny and predominant poor weather conditions between 8 December 2016 and 9 March 2017 (cf. Figure 2e). The corresponding Mimatsu diagram between 7 December 2016 and 14 January 2017 reveals growth of the northern and southern summit with approximately 15 m and 11 m, respectively (Figure 4c). The timing of summit growth correlates with the onset of enhanced seismicity, and may also correspond to the beginning of the uplift of the rigid body that produce the significant radar shadow detected on 2 February 2017 (Figure 2e and Figure 5b2).
The 12 March 2017 Mimatsu image demonstrates partial destruction of Bezymianny’s summit after the explosive 9 March 2017 eruption, yet most of the previously developed morphology remained (Figure 4d). The latter agrees with radar shadows that are discernible in both the 7 and 18 March 2017 descending amplitude images (Figure 5d2 and Figure 6a). However, the subsequent 24 April 2017 Mimatsu image shows growth of the summit by 24 m, while during May and June 2017, a repeated partial destruction of the summit is observed (Figure 4e).
Eventually, the 10 August 2017 Mimatsu image reveals that significant parts of the previously determined summit accumulation are destroyed, whereas the southern summit portion is characterised by extrusion of new material (Figure 4e and Figure 6c,d). This last and most significant optically detected summit morphology change corresponds well with the compelling reflectivity change of the summit determined in the 25 June 2017 TSX amplitude image, whereby the southern summit growth is only weakly represented in this amplitude image.

4.3. Three Stage activity

Overall, the TSX amplitude data provided the most detailed (spatially and temporally) observations of precursory and co-eruptive ground motion during the 2016–2017 eruption sequence. Near constant precursory ground motion is observed between January and October 2016, which then rapidly increased two months (stage 1) prior the 5 December 2016–28 February 2017 eruption. The latter observation agrees well with Mimatsu-derived topographic growth of Bezymianny’s eastern summit that was detected in December 2016. During the effusive December 2016–February 2017 eruption (stage 2), the radar data unveil recurrent flank motion at different rates that always increase with increasing elevation. Moreover, SAR data show differential lava flow motion as well as the uplift of a rigid body during January–February 2017 that subsequently moved westwards as the summit reflectivity significantly changed. The timing agrees well with considerably enhanced seismicity and optically derived growth of the eastern summit. The surface texture of the two lava flows 1 and 2 (stage 3, 9 March 2017) differ markedly, as flow 1 is characterised by shadow casting crevasses that are absent on flow 2. Eventually, the 16 June 2017 eruption (stage 3) produced pyroclastic deposits that cover most of the two lava flows and fill the northern 1956 crater moat.

5. Discussion

Our data set captured seven to nine months of precursory ground motion as a rigid body extruded at the summit prior to the first documented effusive December 2016–February 2017 eruption. We interpret the rigid body as extruded, solidified conduit material that we refer to as a plug. Subsequent determined differential lava flow motion was accompanied by a second plug extrusion that rafted westwards as new lava was emplaced near the summit. Besides exogenous growth, the SAR amplitude images also unveiled distinct, recurrent endogenous growth stages as Bezymianny’s dome bulged northwards multiple times. Hereinafter, we first shed light on the limitation of employed techniques, and we will then discuss our observations of the different dome growth stages at Bezymianny.

5.1. Limitations

Seismic activity beneath Bezymianny is monitored by a widespread array of seismometers that covers activity of all volcanoes within the Klyuchevskoy Group of Volcanoes (see locations for stations in Shapiro et al. [19]). The data used here is from a local catalogue and reflects seismic events detected beneath the volcano within a radius of 6 km. However, accurate allocation of events is impeded when other nearby volcanoes are active. In fact, Klyuchevskoy was very active in 2016 (cf. Figure S7), which caused the detection of only few events that are directly associated with Bezymianny. This attracts the attention to other methods to determine activity at Bezymianny, such as SAR and optical observations. However, these techniques are also not immune to shortcomings that have to be considered for interpretation.
Visual observations of volcanic unrest and eruptions are important at volcano observatories to examine topographic changes, levels of gas emissions, and other processes. Time-lapse cameras are increasingly used for documentation and observation as they require low budget and maintenance [13,51]. However, the number of cameras, their location, installation, and weather conditions have strong effects on the resolution to retrieve quantitative information. Multiple terrestrial cameras enable to break down the three dimensional deformation over time, as was demonstrated for dome growth at, for instance, Mount St. Helens during the 2004–2008 eruption [17]. Single cameras, in turn, may have the disadvantage of reducing the three-dimensional displacement into its two-dimensional FOV. Therefore, determined and quantified topographic changes at Bezymianny may over- or underestimate the total amount of deformation, as the absolute displacement may encompass deformation further away or closer towards the camera’s FOV. Moreover, the low spatial resolution is confined to the large distance (7 km) of the camera, which is focused on Bezymianny and its neighbouring volcanoes. This significantly lowers the image contrast and it causes blurry edges at Bezymianny’s dome (Figure S8), which, together with fumarolic activity and background clouds, may have strong impact on the outline mapping quality. While most of the error contributions cannot be further quantified, the mapping error may be equal to the calculated pixel-size-range (i.e., 4.2–5.3 m/pixel), as the choice of the pixels along the cone outline depends on subjective and biased decisions during the mapping. In addition, the employed metric pixel conversion strongly depends upon topography, distance, and image distortion, which was not corrected for in the images. Thus, the mapping error may be even higher. Yet, the webcam imagery provided valuable qualitative information that supports and complements deductions from seismic and TSX observations, such as deformation in foreshortening areas of the radar data. Thus, time-lapse camera observations constitute an indispensable tool to monitor Bezymianny.
Tracking changes at dome building volcanoes is vital for hazard assessment because of the close link to their explosive potential, dome collapse, and associated pyroclastic density currents generation [5,14]. Yet, lava domes are often tied to the volcanic summit, which is often obscured by frequent cloud cover. SAR systems, in turn, penetrate this cover, and hence may significantly aid in identifying dome growth processes. Here, we analysed the amplitude information of TSX data and employed a pixel offset tracking technique to estimate deformation at Bezymianny during the 2016–2017 eruption series. However, specific steps within the processing chain may have substantial influence on the distribution of pixel offsets. Speckle, for instance, causes random noise in the amplitude information that may result in the occurrence of randomly distributed offsets. On the other hand, speckle on surfaces also increases the tracking quality of these features. Multilooking (down-sampling), in turn, may significantly reduce amplitude noise. Yet, it also decreases the spatial resolution and may lead to the omission of small scale pixel offsets, such as the episodically detected distension of the dome or smaller differential offsets during the precursory episode. Additionally, strong scatterers within the cross-correlation window may obtain a high displacement weighting that dominates the whole patch. This causes the appearance of patch-like offsets, where the strong reflector related offset propagates throughout several overlapping and adjacent windows [52]. Patch like offsets occur, for instance, outside the 1956 crater rim (Figure 3e–h), or in the azimuth offset map of the northern dome between images 31 December 2016–2 February 2017 as offsets decrease stepwise downslope (Figure 5b3 and Figure S5). The latter may be caused by bright scatterers at the edges of older lava flows located along the northern dome flank. In addition, offset tracking between May and September 2016 showed that larger cross-correlation windows (64 and 96 pixels) detected near continuous range offset rates with minor errors, whereas the smallest window (32 pixels) revealed varying offsets with much larger errors (Figure 3i and Figure S4). Also, calculated SNRs do not sufficiently aid in the identification for erroneous offsets as both low and high SNRs were calculated for offsets close to zero in the stable areas. The latter is most prominent during the summer months where SNRs in stable areas are temporarily significantly higher, while SNRs in the summit region do not reveal a considerable change (Figure S4). However, other potential offset tracking error sources may result from changing amplitudes that are related to slope processes (e.g., gravity driven toppling rocks as moving bright scatterers), downslope block addition onto lava flows after its emplacement increasing the surface roughness, changing amplitude values due to intermittent snow cover [46], or layover effects as observed at Cleveland volcano [16]. Layover effects may be observable at the 1956 collapse scar rim, but they could not be observed at the summit. Other limitations in pixel offset tracking occur when pixels disappear due to strong motion as observed at the front of flow 1, or when surfaces are shifted into foreshortening areas as observed at the summit crater rim during the precursory plug extrusion episode. Despite the error sources, the method enabled the detailed quantification and analysis of exogenous and endogenous growth stages at Bezymianny.

5.2. Implications and Interpretations of Eruptive Events

The observations from the TSX data allowed us to identify different stages of ground motion activity and to distinguish processes from plug extrusion over endogenous dome deformation to lava flow emplacement. This enables us to derive a conceptual model of volcanic growth at Bezymianny.

5.2.1. Precursory Deformation

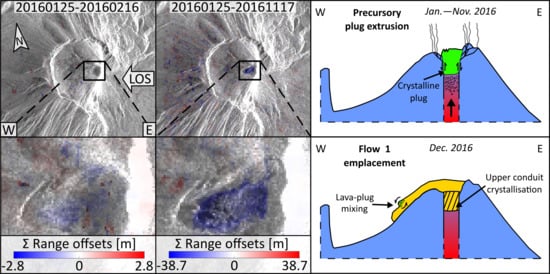
After approximately four years of quiescence, our amplitude data reveal persistent range motion at Bezymianny’s summit seven to nine months prior to the first documented effusive December 2016–March 2017 eruption. We associate this motion with the extrusion of cold crystalline upper conduit material (plug) along a pre-existing, reactivated fracture network (Figure 7a, Table 1). Initially, the plug extrusion was characterised by intermittent offsets and few detected seismic events, which may constrain the extrusion onset to January–April 2016. The subsequently derived range offset rates remained near constant until August 2016, whereas the seismicity of Bezymianny could not be differentiated from that of the active Klyuchevskoy volcano. Moreover, the plug extrusion was accompanied by observed intermittent degassing (cf. Figures S1 and S7), which, in contrast to the observed continuous range offset rates, might indicate a discontinuous precursory plug-extrusion behaviour. Yet, alternating weather conditions, such as daily changing wind directions and atmospheric pressures, may have had major impact on the irregular degassing pattern [53]. Previous seismic and petrographic studies at Bezymianny, in turn, showed that the rising magma is being stored at different depths prior to eruptions, which may also reflect alternating emission patterns [18,20,22,54] during the 2016 precursory stage.
However, between September–October 2016, we observed a gradual change from slower to faster plug extrusion rates, which may have been related to the gradual ascent of magmatic fluids into shallower reservoirs. The simultaneously observed Mimatsu-derived summit growth, as well as new radar shadows at the rim, may have formed due to the presumably related increased gas pressurisation, which eventually pushed volcanic material over the rim, and stress-parallel oriented shadow-casting tensile fractures were formed at the rim. During November 2016, the observed seismicity and extrusion rates in range direction increased simultaneously, and the plug-related radar shadow was bisected by brighter surface reflectivity. This may indicate plug disintegration due to exhumation and concurrent loss of the previously existing circumferential pressure that was induced by the surrounding dense composite dome crust. As the largest Mimatsu displacement was determined between October–December 2016, and because the observed seismicity substantially increased during end of November 2016 and the beginning of December 2016, we assume that the determined cumulative range motion (~40 m) constitutes the minimum of the total amount of plug extrusion.
In general, plug extrusions at Bezymianny were commonly observed days to weeks prior to explosive eruptions [30,31]. Similarly, satellite thermal observations showed enhanced anomalies that are associated with exogenous growth 15 to 20 days prior to >20 eruptions between 1993 and 2008 [39]. Our data set, in turn, documented seven to nine months of precursory ground motion related to plug extrusion prior to the documented effusive 5 December 2016–28 February 2017 eruption. The absence of explosive activity of Bezymianny during the effusive eruption may be caused by insufficient gas pressurisation during magma ascent likely as a consequence of persistent degassing. Similar observations were made prior to a non-explosive eruption at MSH during the dome building phase in 1981 [55]. Lastly, pixel offsets that are derived from the precursory plug extrusion episode may be used in future to refine models and investigate the corresponding source of deformation with, for example, a discrete element method, as described in [56,57].

5.2.2. Effusive 5 December 2016–7 March 2017 Eruption

Our data set has shown that the so far first registered effusive eruption initiated with emplacement of flow 1, its surface characterised by few crevasses and a dominant, radar-shadow producing, flow perpendicular ridge. This ridge does not exhibit the typically observed radial orientation of surface folds of many silicic lava flows, which form as the flows stretch and rotate in the flow direction [58]. Therefore, the ridge on flow 1 could be interpreted as a result of a pronounced step in the paleotopography, but our terrain model from 2014 does not reveal any significant elevation changes on the western composite dome flank (see inset in Figure 2b). Instead, it may reflect the compressional folding [59] of a mixture of the lower viscous flow 1 with the highly viscous precursory plug material (Figure 7b and Table 1). The partial preservation of the plug would emphasize the weak explosiveness of the effusive 5 December 2016–28 February 2017 eruption.
Between the end of December 2016 and the beginning of February 2017, we observed significant unidirectional bulging of the northern dome flank, which were not reversed again and therefore can be considered inelastic. This was either accompanied or preceded by the emergence of a new radar shadow at the summit as well as enhanced seismicity during the second half of January 2017. The expansion may be explained by near vertical magmatic intrusions into the carapace without an existing plug. Yet, deformation experiments of conical shaped volcanoes have shown that, under these conditions, the summit always concurrently subsides [60].
Since summit subsidence was not observed at Bezymianny, we assume that a second plug formed between December 2016 and beginning of January 2017 that caused the unidirectional bulging (Figure 7b,c). This plug may have formed in response to low effusion rates, shallow degassing (see degassing in Figure 4c), and microlite crystallisation [7]. A process also inferred for spine formations during dome growth episodes at Unzen and Soufrière Hills volcanos [6,7]. The second plug at Bezymianny possibly clogged the upper conduit, thereby causing unidirectional bulging of magmatic fluids in the upper conduit, or the deflection of magmatic fluids into structurally weaker parts of the composite dome (Figure 7d). Layer boundaries, interlayered unconsolidated pyroclastic deposits, or pre-existing fractures related to explosive events that formed older summit craters might depict the latter. Eventually, the new summit radar shadow indicates that the second plug was extruded by the beginning of February 2017. By mid February 2017, we observed a general amplitude change at the summit, which we associate with a second pulse of lava emplaced at the summit. Simultaneously observed enhanced crevasse density on flow 1 and the location change of the plug related summit shadow indicate that the new lava flow pushed both flow 1 and the previously extruded plug westwards (Figure 7f).
As inflations were recurrently observed at the northern composite dome flank, a clogging plug may also explain the other observed distinct lateral flank movements. Lava flow emplacements followed the bulging events during February and March 2017 (including flow 2), which reveals that exogenous growth succeeded endogenous growth. Therefore, it may be possible that flank bulging between November and December 2016 also preceded flow 1. This would agree with precursory endogenous growth of Bezymianny that was derived from remotely detected enhanced thermal activity prior to most eruptions during 1993–2008 [39]. Since each bulging event of the recent eruption series increased in magnitude towards the summit (Figure 5 and Figure S5), the nucleus of unidirectional intrusions was likely located in the uppermost few hundred meters (~100–400 m) of the volcanic conduit, thus above the base of Bezymianny’s composite dome (cf. Figure 1b(inset) and Figure 7). This agrees with the deformation observations at Colima in Mexico, where an inferred shallowly located (~200–300 m) clogging plug may have also governed the pathway of rising magmatic fluids prior to the volcano’s 2013 eruption series [9]. Evidence of shallow conduit pressurisation that is derived from ground deformation and seismicity was also identified at other dome building volcanoes, such as Soufrière Hills on Montserrat [61], Unzen in Japan [6], or Lascar in Chile [62].
Lastly, we cannot differentiate this motion from potential endogenous growth motion, since the size of flow 1 continuously changed between adjacent amplitude scenes. Thus, we did not consider employing an elastic modelling approach to identify the source of deformation at the northern flank. In fact, the detected southward motion of the southern flank in the descending and ascending data (Figure 5b3 and Figure S11) indicates that magma may have also been deflected into the southern carapace, but this was observed only once and it occurred very localised near the summit.

5.2.3. Exogenous and Endogenous Dome Growth—Comparison with other Volcanoes

Volcanic activity at Bezymianny identified by TSX radar and optical data indicate precursory plug extrusion, as well as explosive eruptions, both being followed by lava flow emplacements and renewed summit excavation. All of these activities originated from the central summit. At the dome building Colima volcano, Mexico, activity between 1998 and 2010 also originated from a central summit, yet in this case the recurrent growth of blocky domes, from which short lava flows emanated, dominated the summit [63]. Soon after their formation, the summit domes were destroyed by recurrent Vulcanian eruptions that excavated new summit craters similar to the observed reshaped summit craters of Bezymianny. Yet, the repeated emergence of blocky domes at Colima contrasts with the recurrently observed plug extrusions at Bezymianny that depict the stiffened upper conduit. However, minor summit deformation at Colima’s summit (2013) also suggested the existence of a shallow plug, which caused the deflection of the rising magmatic fluids, but was not extruded after all [9]. Yet, deformation at Colima only occurs days or hours prior to new eruptions [9]. Moreover, our data has shown that Bezymianny produced multiple eruptions within one year that significantly increased in explosiveness, whereas Colima produced eruptions with rather similar explosive character [63].
In addition, we showed that the recurrent bulging events of Bezymianny’s northern dome flank occurred at strikingly different azimuth rates near the summit (0.1–0.6 m d−1). These were likely related to intermittent conduit plug formation, which clogged the vent as the magmatic fluids were deflected into the northern carapace. The variance of observed endogenous growth rates at Bezymianny’s mature composite dome strongly contrast with observations of linear endogenous growth rates during the formation of the relatively young domes of Mount St. Helens (1980–1986) and Unzen (1990–1995), which emphasizes the very distinct character of dome growth behaviour at different volcanoes.
Overall, we have shown that Bezymianny evolved during 2016–2017 from precursory plug extrusion over mostly effusive and unidirectional endogenous growth to successively stronger explosions, which produced large amounts of pyroclastic deposits that cover most of the two major lava flows. This may point out that Bezymianny’s dome evolution is on the verge to a stratocone volcano, as was described prior to the 1956 eruption. In fact, all of the observed eruptive activity during the 2016–2017 eruption sequence at Bezymianny was confined to the central summit crater, which is a common feature for many stratocone volcanoes [64].

6. Conclusions

Here, we studied endogenous and exogenous dome growth before and during the 2016–2017 eruption sequence at Bezymianny. Multitemporal TSX amplitude imagery uncovered seven to nine months lasting precursory plug extrusion prior to the known onset of the eruption series. Deformation analysis of the ensuing effusive December 2016–March 2017 eruption revealed repeated exogenous lava flow emplacements that were accompanied and/or preceded by intermittent unidirectional bulging of the northern carapace. These events are likely related to the intermittent rapid formation of upper conduit plugs that deflected the rising magmatic fluids into the uppermost regions of the composite dome. The corresponding endogenous growth rates of Bezymianny’s relatively mature dome significantly varied. Thus, dome growth at Bezymianny may have reached an advanced stage in its evolution close to the formation of a stratocone. Although endogenous growth could not be resolved by the webcam imagery, the images unveiled exogenous growth near the summit undetected by radar data. Yet, the images’ poor resolution only contributed qualitatively to inferences that are drawn from seismic and SAR observations.
In this study, we have demonstrated the strengths of high-resolution SAR amplitude images as an effective observation tool to derive information regarding the detailed course of precursor activity as well as for differentiation of distinct lava flow surface and dome growth processes. However, as these processes rapidly changed, it becomes apparent that more frequent SAR acquisitions in different acquisition geometries would make it even more useful for real-time observations. This becomes obvious for the acquisition gaps prior the June 2017 eruption, which concealed possible precursor ground motion. In contrast, continuous seismic observations revealed a clear picture of magmatic activity and/or associated rockfalls prior to the eruption. Therefore, integration and analysis of different geophysical data sets is a vital base for the monitoring of remote volcanoes, such as Bezymianny, who poses a permanent threat to intercontinental aviation.

Supplementary Materials

The following are available online at https://www.mdpi.com/2072-4292/11/11/1278/s1, Table S1: Descending spotlight TSX amplitude image pairs of Bezymianny. Table S2: Ascending spotlight TSX amplitude image of Bezymianny. Figure S1: Selected clear view images that cover the 2016–2017 eruptive sequence of Bezymianny. Figure S2: Selected co-registered descending TSX amplitude images. Figure S3: Co-registration processing chain of the TSX amplitude data time-series. Figure S4: Summit range pixel offsets compared with stable areas (i.e., no deformation). Figure S5: Average azimuth pixel offset rates during December 2016–March 2017. Figure S6: Azimuth offset maps for descending acquisition intervals without northward dome bulging. Figure S7: Webcam images showing episodic degassing (cf. Figure S1) at Bezymianny during May–November 2016. Figure S8: Illustration demonstrating constraints on the Mimatsu mapping quality because of blurry edges of Bezymianny’s dome. Figure S9: Ascending non-geocoded spotlight-mode TSX amplitude image acquired on 17 February 2017. Figure S10: Co-registered ascending TSX amplitude images. Figure S11: Azimuth offset map between the ascending TSX acquisitions from 17–28 February 2017.

Author Contributions

Conceptualization, R.M. and T.R.W.; methodology, R.M., T.R.W, S.B., and M.B.; software, R.M.; field work, R.M., T.R.W., M.B. and A.B.; formal analysis, R.M.; validation, R.M. and T.R.W.; formal analysis, R.M.; data curation, R.M.; writing–original draft preparation, R.M.; writing–review and editing, T.R.W., A.B., and M.B.; visualization, R.M.; supervision, T.R.W.; project administration, R.M.; funding acquisition, T.R.W. and S.L.S.

Funding

This is a contribution to VOLCAPSE, a research project funded by the European Research Council under the European Union’s H2020 Programme/ERC consolidator grant ERC-CoG Q7 646858. We thank the DLR for support; the acquisition of the spot-mode TerraSAR-X data was realized through proposal GEO1505. DV-B is grateful to CONACYT-PDCAPN project 2579. This study was also supported by Scientific Research Work of Russian Academy of Science: “Complex geophysical studies of the volcanoes of Kamchatka and of the northern Kuril Islands in order to detect the signs of the future eruption, as well as forecast its dynamics with an assessment of the ash hazard to aviation”, # AAAA-A19-119031590060-3.

Acknowledgments

We would like to thank Jacqueline Salzer and Henriette Sudhaus for the numerous discussions on the SAR processing and Bodo Bookhagen for his thoughts on the error analysis of the SAR data. Finally we thank Ilyas Abkadyrov for supporting us during field work.

Conflicts of Interest

The authors declare no conflict of interest.

Appendix A

Error estimation for offset measurements during the precursory plug extrusion

To differentiate significant from erroneous pixel offsets during the precursory plug extrusion stage, we applied an analytical approach that is usually used to remove DEM errors for change analysis of river beds and slope failures. This approach uses stable areas for calculation of errors [65] that follow a normal distribution around 0 (i.e., no changes), and are assumed to be independent [66,67]. Following the approach of Lane et al. [68], we assume that the error of the point-to-point distance between DEMs is equal to the offset uncertainty, which may be expressed as:
σ o f f s e t = σ 2 +   σ 2 ,
where σ is the standard deviation of offsets in a stable area with a size of 100 × 100 pixels. The statistic t-score is then calculated by the following equation of Bennet et al. [69]:
t s c o r e = Δ p x σ o f f s e t ,
where Δpx is the absolute pixel offset within the stable area. To determine whether the offsets of individual pixels in the stable areas are significant, a simple one-sided t-Test with a confidence interval of 80% (tc > 0.845) was applied to the area of real surface motion. Thus, only pixel offsets in the deforming area larger than the median of Δpx > tc were considered as real displacements. Moreover, since motion in the stage prior the first recognised eruption was directed towards the satellite, pixel offsets away from the satellite were omitted in the deformation area. Finally, pixel offsets for the same stage were compared with the Signal-to-Noise Ratio (SNR) to estimate the degree of error estimation:
S N R = c c p s t d ,
where ccp depicts the cross-correlation peak and std the corresponding standard deviation.

References

  1. Sheldrake, T.E.; Sparks, R.S.J.; Cashman, K.V.; Wadge, G.; Aspinall, W.P. Similarities and differences in the historical records of lava dome-building volcanoes: Implications for understanding magmatic processes and eruption forecasting. Earth Sci. Rev. 2016, 160, 240–263. [Google Scholar] [CrossRef] [Green Version]
  2. Ogburn, S.E.; Loughlin, S.C.; Calder, E.S. The association of lava dome growth with major explosive activity (VEI ≥ 4): DomeHaz, a global dataset. Bull. Volcanol. 2015, 77, 40. [Google Scholar] [CrossRef]
  3. Voight, B.; Elsworth, D. Instability and collapse of hazardous gas-pressurized lava domes. Geophys. Res. Lett. 2000, 27, 1–4. [Google Scholar] [CrossRef]
  4. Huppert, H.E.; Shepherd, J.B.; Sigurdsson, H.; Sparks, R.S.J. On lava dome growth, with application to the 1979 lava extrusion of the Soufrière of St. Vincent. J. Volcanol. Geotherm. Res. 1982, 14, 199–222. [Google Scholar] [CrossRef]
  5. Fink, J.H.; Malin, M.C.; Anderson, S.W. Intrusive and extrusive growth of the Mount St. Helens lava dome. Nature 1990, 348, 435–437. [Google Scholar] [CrossRef]
  6. Nakada, S.; Shimizu, H.; Ohta, K. Overview of the 1990–1995 eruption at Unzen Volcano. J. Volcanol. Geotherm. Res. 1999, 89, 1–22. [Google Scholar] [CrossRef]
  7. Watts, R.B.; Herd, R.A.; Sparks, R.S.J.; Young, S.R. Growth patterns and emplacement of the andesitic lava dome at Soufrière Hills Volcano, Montserrat. Geol. Soc. Lond. Mem. 2002, 21, 115–152. [Google Scholar] [CrossRef]
  8. Sparks, R.S.J. Forecasting volcanic eruptions. Earth Planet. Sci. Lett. 2003, 210, 1–15. [Google Scholar] [CrossRef]
  9. Salzer, J.T.; Nikkhoo, M.; Walter, T.R.; Sudhaus, H.; Reyes-Dávila, G.; Bretón, M.; Arámbula, R. Satellite radar data reveal short-term pre-explosive displacements and a complex conduit system at Volcán de Colima, Mexico. Front. Earth Sci. 2014, 2, 12. [Google Scholar] [CrossRef]
  10. Lu, Z.; Dzurisin, D.; Biggs, J.; Wicks, C.; McNutt, S. Ground surface deformation patterns, magma supply, and magma storage at Okmok volcano, Alaska, from InSAR analysis: 1. Intereruption deformation, 1997–2008. J. Geophys. Res. Solid Earth 2010, 115, B00B02. [Google Scholar] [CrossRef]
  11. Massonnet, D.; Feigl, K.L. Radar interferometry and its application to changes in the Earth’s surface. Rev. Geophys. 1998, 36, 441–500. [Google Scholar] [CrossRef]
  12. James, M.R.; Pinkerton, H.; Robson, S. Image-based measurement of flux variation in distal regions of active lava flows. Geochem. Geophys. Geosy. 2007, 8, 3. [Google Scholar] [CrossRef]
  13. Walter, T.R. Low cost volcano deformation monitoring: Optical strain measurement and application to Mount St. Helens data. Geophys. J. Int. 2011, 186, 699–705. [Google Scholar] [CrossRef]
  14. Pallister, J.S.; Schneider, D.J.; Griswold, J.P.; Keeler, R.H.; Burton, W.C.; Noyles, C.; Newhall, C.G.; Ratdomopurbo, A. Merapi 2010 eruption-chronology and extrusion rates monitored with satellite radar and used in eruption forecasting. J. Volcanol. Geotherm. Res. 2013, 261, 144–152. [Google Scholar] [CrossRef]
  15. Wadge, G.; Cole, P.; Stinton, A.; Komorowski, J.-C.C.; Stewart, R.; Toombs, A.C.; Legendre, Y. Rapid topographic change measured by high-resolution satellite radar at Soufrière Hills Volcano, Montserrat, 2008–2010. J. Volcanol. Geotherm. Res. 2011, 199, 142–152. [Google Scholar] [CrossRef]
  16. Wang, T.; Poland, M.P.; Lu, Z. Dome growth at Mount Cleveland, Aleutian Arc, quantified by time series TerraSAR-X imagery. Geophys. Res. Lett. 2015, 42, 10. [Google Scholar] [CrossRef]
  17. Major, J.J.; Dzurisin, D.; Schilling, S.P.; Poland, M.P. Monitoring lava-dome growth during the 2004–2008 Mount St. Helens, Washington, eruption using oblique terrestrial photography. Earth Planet. Sci. Lett. 2009, 286, 243–254. [Google Scholar] [CrossRef]
  18. Koulakov, I.; Abkadyrov, I.; Al Arifi, N.; Deev, E.; Droznina, S.; Gordeev, E.I. Three different types of plumbing system beneath the neighboring active volcanoes of Tolbachik, Bezymianny, and Klyuchevskoy in Kamchatka. J. Geophys. Res. Solid Earth 2017, 122, 3852–3874. [Google Scholar] [CrossRef]
  19. Shapiro, N.M.; Droznin, D.V.; Droznina, S.Y.; Senyukov, S.L.; Gusev, A.A.; Gordeev, E.I. Deep and shallow long-period volcanic seismicity linked by fluid-pressure transfer. Nat. Geosci. 2017, 10, 442–445. [Google Scholar] [CrossRef]
  20. Thelen, W.; West, M.; Senyukov, S. Seismic characterization of the fall 2007 eruptive sequence at Bezymianny Volcano, Russia. J. Volcanol. Geotherm. Res. 2010, 194, 201–213. [Google Scholar] [CrossRef]
  21. Shcherbakov, V.D.; Plechov, P.Y.; Izbekov, P.E.; Shipman, J.S. Plagioclase zoning as an indicator of magma processes at Bezymianny Volcano, Kamchatka. Contrib. Mineral. Petrol. 2011, 162, 83–99. [Google Scholar] [CrossRef]
  22. Turner, S.J.; Izbekov, P.; Langmuir, C. The magma plumbing system of Bezymianny Volcano: Insights from a 54 year time series of trace element whole-rock geochemistry and amphibole compositions. J. Volcanol. Geotherm. Res. 2013, 263, 108–121. [Google Scholar] [CrossRef]
  23. Braitseva, O.A.; Melekestsev, I.V.; Bogoyavlenskaya, G.E.; Maksimov, A.P. Bezymyannyi: Eruptive history and dynamics. Volcanol. Seismol. 1991, 12, 165–194. [Google Scholar]
  24. Gorshkov, G.S. Gigantic eruption of the volcano Bezymianny. Bull. Volcanol. 1959, 20, 77–109. [Google Scholar] [CrossRef]
  25. Bogoyavlenskaya, G.Y.; Braitseva, O.A.; Melekestsev, I.V.; Maksimov, A.P.; Ivanov, B.V. Bezymianny volcano. In Active Volcanoes of Kamchatka; Fedotov, S.A., Masurenkov, Y.P., Eds.; Moscow Nauka Publishers: Moscow, Russia, 1991; Volume 1, pp. 195–197. [Google Scholar]
  26. Belousov, A. Deposits of the 30 March 1956 directed blast at Bezymianny volcano, Kamchatka, Russia. Bull. Volcanol. 1996, 57, 649–662. [Google Scholar] [CrossRef] [Green Version]
  27. Lipman, P.W.; Moore, J.G.; Swanson, D.A. Bulging of the north flank before the May 18 eruption-geodetic data. In The 1980 Eruptions of Mount St. Helens, Washington; Lipman, P.W., Mullineaux, D.R., Eds.; United States Geological Survey: Reston, VA, USA, 1981; pp. 143–155. [Google Scholar]
  28. Voight, B.; Glicken, H.; Janda, R.J.; Douglass, P.M. Catastrophic rockslide avalanche of May 18. In The 1980 Eruptions of Mount St. Helens, Washington; Lipman, P.W., Mullineaux, D.R., Eds.; United States Geological Survey: Reston, VA, USA, 1981; pp. 347–377. [Google Scholar]
  29. Belousov, A.; Voight, B.; Belousova, M. Directed blasts and blast-generated pyroclastic density currents: A comparison of the Bezymianny 1956, Mount St Helens 1980, and Soufrière Hills, Montserrat 1997 eruptions and deposits. Bull. Volcanol. 2007, 69, 701–740. [Google Scholar] [CrossRef]
  30. Belousov, A.; Voight, B.; Belousova, M.; Petukhin, A. Pyroclastic surges and flows from the 8–10 May 1997 explosive eruption of Bezymianny volcano, Kamchatka, Russia. Bull. Volcanol. 2002, 64, 455–471. [Google Scholar] [CrossRef]
  31. Girina, O.A. Chronology of Bezymianny Volcano activity, 1956–2010. J. Volcanol. Geotherm. Res. 2013, 263, 22–41. [Google Scholar] [CrossRef]
  32. Carter, A.J.; Ramsey, M.S.; Belousov, A.B. Detection of a new summit crater on Bezymianny Volcano lava dome: Satellite and field-based thermal data. Bull. Volcanol. 2007, 69, 811–815. [Google Scholar] [CrossRef]
  33. Dvigalo, V.N.; Svirid, I.Y.; Shevchenko, A.V.; Sokorenko, A.V.; Demyanchuk, Y.V. Active volcanoes of Northern Kamchatka as seen from aerophotogrammetric data in 2010. In Proceedings of regional conference “Volcanism and associated processes”; Institute of Volcanology and Seismology FEB RAS: Petropavlovsk-Kamchatsky: Petropavlovsk-Kamchatsky, Russia, 2011; pp. 26–36. (In Russian) [Google Scholar]
  34. Chebrov, V.N.; Droznin, D.V.; Kugaenko, Y.A.; Levina, V.I.; Senyukov, S.L.; Sergeev, V.A. The system of detailed seismological observations in Kamchatka in 2011. J. Volcanol. Seismol. 2013, 7, 16–36. [Google Scholar] [CrossRef]
  35. Senyukov, S.L. Monitoring and prediction of volcanic activity in Kamchatka from seismological data: 2000–2010. J. Volcanol. Seismol. 2013, 7, 86–97. [Google Scholar] [CrossRef]
  36. West, M.E. Recent eruptions at Bezymianny volcano-A seismological comparison. J. Volcanol. Geotherm. Res. 2013, 263, 42–57. [Google Scholar] [CrossRef]
  37. Ramsey, M.; Dehn, J. Spaceborne observations of the 2000 Bezymianny, Kamchatka eruption: The integration of high-resolution ASTER data into near real-time monitoring using AVHRR. J. Volcanol. Geotherm. Res. 2004, 135, 127–146. [Google Scholar] [CrossRef]
  38. Carter, A.J.; Girina, O.; Ramsey, M.S.; Demyanchuk, Y.V. ASTER and field observations of the 24 December 2006 eruption of Bezymianny Volcano, Russia. Remote Sens. Environ. 2008, 112, 2569–2577. [Google Scholar] [CrossRef]
  39. Van Manen, S.M.; Dehn, J.; Blake, S. Satellite thermal observations of the Bezymianny lava dome 1993–2008: Precursory activity, large explosions, and dome growth. J. Geophys. Res. Solid Earth 2010, 115, 1–20. [Google Scholar] [CrossRef]
  40. Monitoring of Volcanic Activity in Kamchatka. Available online: http://www.emsd.ru/~ssl/monitoring/main.htm (accessed on 30 September 2017).
  41. Johnson, J.B.; Lees, J.M.; Gerst, A.; Sahagian, D.; Varley, N. Long-period earthquakes and co-eruptive dome inflation seen with particle image velocimetry. Nature 2008, 456, 377–381. [Google Scholar] [CrossRef]
  42. Walter, T.R.; Ratdomopurbo, A.; Subandriyo; Aisyah, N.; Brotopuspito, K.S.; Salzer, J.; Lühr, B. Dome growth and coulée spreading controlled by surface morphology, as determined by pixel offsets in photographs of the 2006 Merapi eruption. J. Volcanol. Geotherm. Res. 2013, 261, 121–129. [Google Scholar] [CrossRef]
  43. Chebrov, V.N.; Droznin, D.V.; Zakharchenko, N.Z.; Melnikov, D.V.; Mishatkin, V.N.; Nuzhdina, I.N. The development of the system of integrated instrumental monitoring of volcanoes in the Far East region. Seism. Instrum. 2013, 49, 254–264. [Google Scholar] [CrossRef]
  44. Chaussard, E. A low-cost method applicable worldwide for remotely mapping lava dome growth. J. Volcanol. Geotherm. Res. 2017, 341, 33–41. [Google Scholar] [CrossRef]
  45. Di Traglia, F.; Nolesini, T.; Ciampalini, A.; Solari, L.; Frodella, W.; Bellotti, F. Tracking morphological changes and slope instability using spaceborne and ground-based SAR data. Geomorphology 2018, 300, 95–112. [Google Scholar] [CrossRef]
  46. Arnold, D.W.D.; Biggs, J.; Wadge, G.; Mothes, P. Remote sensing of environment using satellite radar amplitude imaging for monitoring syn-eruptive changes in surface morphology at an ice-capped stratovolcano. Remote Sens. Environ. 2018, 209, 480–488. [Google Scholar] [CrossRef]
  47. Arnold, D.W.D.; Biggs, J.; Dietterich, H.R.; Vargas, S.V.; Wadge, G.; Mothes, P. Lava flow morphology at an erupting andesitic stratovolcano: A satellite perspective on El Reventador, Ecuador. J. Volcanol. Geotherm. Res. 2019, 372, 34–47. [Google Scholar] [CrossRef]
  48. Mittermayer, J.; Wollstadt, S.; Prats-Iraola, P.; Scheiber, R. The TerraSAR-X staring spotlight mode concept. IEEE Trans. Geosci. Remote Sens. 2014, 52, 3695–3706. [Google Scholar] [CrossRef]
  49. Michel, R.; Avouac, J.-P.; Taboury, J. Measuring ground displacements from SAR amplitude images: Application to the Landers earthquake. Geophys. Res. Lett. 1999, 26, 875–878. [Google Scholar] [CrossRef]
  50. Werner, C.; Wegmüller, U.; Strozzi, T.; Wiesmann, A. GAMMA SAR and interferometric processing software. In Proceedings of the ERS-ENVISAT Symposium, Gothenburg, Sweden, 16–20 October 2000. [Google Scholar]
  51. Poland, M.P.; Dzurisin, D.; LaHusen, R.G.; Major, J.J.; Lapcewich, D.; Endo, E.T. Remote camera observations of lava dome growth at Mount St. Helens, Washington, October 2004 to February 2006. US Geol. Surv. Prof. Pap. 2008, 1750, 225–236. [Google Scholar]
  52. Wang, T.; Jonsson, S. Improved SAR amplitude image offset measurements for deriving three-dimensional coseismic displacements. Sel. Top. Appl. Earth Obs. Remote Sens. 2015, 8, 3271–3278. [Google Scholar] [CrossRef]
  53. Zimmer, M.; Walter, T.R.; Kujawa, C.; Gaete, A.; Franco-Marin, L. Thermal and gas dynamic investigations at Lastarria volcano, Northern Chile. The influence of precipitation and atmospheric pressure on the fumarole temperature and the gas velocity. J. Volcanol. Geotherm. Res. 2017, 346, 134–140. [Google Scholar] [CrossRef]
  54. López, T.; Ushakov, S.; Izbekov, P.; Tassi, F.; Cahill, C.; Neill, O.; Werner, C. Constraints on magma processes, subsurface conditions, and total volatile flux at Bezymianny Volcano in 2007–2010 from direct and remote volcanic gas measurements. J. Volcanol. Geotherm. Res. 2013, 263, 92–107. [Google Scholar] [CrossRef]
  55. Casadevall, T.J.; Rose, W.; Gerlach, T.; Greenland, L.P.; Ewert, J.; Wunderman, R.; Symonds, R. Gas emissions and the eruptions of Mount St. Helens through 1982. Science 1983, 221, 1383–1385. [Google Scholar] [CrossRef]
  56. Husain, T.; Elsworth, D.; Voight, B.; Mattioli, G.; Jansma, P. Influence of extrusion rate and magma rheology on the growth of lava domes: Insights from particle-dynamics modeling. J. Volcanol. Geotherm. Res. 2014, 285, 100–117. [Google Scholar] [CrossRef]
  57. Harnett, C.E.; Thomas, M.E.; Purvance, M.D.; Neuberg, J. Using a discrete element approach to model lava dome emplacement and collapse. J. Volcanol. Geotherm. Res. 2018, 359, 68–77. [Google Scholar] [CrossRef]
  58. Farrell, J.; Karson, J.; Soldati, A. Multiple-generation folding and non-coaxial strain of lava crusts. Bull. Volcanol. 2018, 80, 84. [Google Scholar] [CrossRef]
  59. Anderson, S.W.; Stofan, E.R.; Plaut, J.J.; Crown, D.A. Block size distributions on silicic lava flow surfaces: Implications for emplacement conditions. Geol. Soc. Am. Bull. 1998, 110, 1258–1267. [Google Scholar] [CrossRef]
  60. Rincón, M.; Márquez, A.; Herrera, R. Contrasting catastrophic eruptions predicted by different intrusion and collapse scenarios. Sci. Rep. 2018, 8, 6178. [Google Scholar] [CrossRef] [PubMed] [Green Version]
  61. Melnik, O.; Sparks, R.S.J. Nonlinear dynamics of lava dome extrusion. Nature 1999, 402, 37–41. [Google Scholar] [CrossRef]
  62. Matthews, S.J.; Gardeweg, M.C.; Sparks, R.S.J. The 1984 to 1996 cyclic activity of Lascar Volcano, northern Chile: Cycles of dome growth, dome subsidence, degassing and explosive eruptions. Bull. Volcanol. 1997, 59, 72–82. [Google Scholar] [CrossRef]
  63. Varley, N.R.; Arámbula-Mendoza, R.; Reyes-Dávila, G.; Stevenson, J.; Harwood, R. Long-period seismicity during magma movement at Volcán de Colima. Bull. Volcanol. 2010, 72, 1093–1107. [Google Scholar] [CrossRef]
  64. Pinel, V.; Jaupart, C. Magma chamber behavior beneath a volcanic edifice. J. Geophys. Res. 2003, 108, 1–17. [Google Scholar] [CrossRef]
  65. Westaway, R.M.; Lane, S.N.; Hicks, D.M. The development of an automated correction procedure for digital photogrammetry for the study of wide, shallow, gravel-bed rivers. Earth Surf. Process. Landf. 2000, 25, 209–226. [Google Scholar] [CrossRef]
  66. Durand, V.; Mangeney, A.; Haas, F.; Jia, X.; Bonilla, F.; Peltier, A. On the link between external forcings and slope instabilities in the Piton de la Fournaise Summit Crater, Reunion Island. J. Geophys. Res. Earth Surf. 2018, 123, 2422–2442. [Google Scholar] [CrossRef]
  67. Brasington, J.; Rumsby, B.T.; McVey, R.A. Monitoring and modelling morphological change in a braided gravel-bed river using high resolution GPS-based survey. Earth Surf. Process. Landf. 2000, 25, 973–990. [Google Scholar] [CrossRef]
  68. Lane, S.N.; Westaway, R.M.; Hicks, D.M. Estimation of erosion and deposition volumes in a large, gravel-bed, braided river using synoptic remote sensing. Earth Surf. Process. Landf. 2003, 28, 249–271. [Google Scholar] [CrossRef]
  69. Bennett, G.L.; Molnar, P.; Eisenbeiss, H.; Mcardell, B.W. Erosional power in the Swiss Alps: Characterization of slope failure in the Illgraben. Earth Surf. Process. Landf. 2012, 37, 1627–1640. [Google Scholar] [CrossRef]
Figure 1. (a) Shaded relief map (TanDEM digital elevation model from 2014) of Bezymianny and its closest neighbouring volcanoes in Kamchatka, Far East Russia (star in inset map). Location of the time-lapse camera and footprint of the TerraSAR-X (TSX) satellite are indicated by CAM and black box, respectively. Orthogonal arrows show flight and line-of-sight (LOS) directions of the descending (DSC) and ascending (ASC) TSX satellites, respectively. ASC is shown in dashed lines, as this paper focuses on the more regular DSC data. White box denotes area shown in (b). (b) Close-up shaded relief map of Bezymianny showing the 1956 collapse scar (somma), the subsequently evolved central composite dome, and its recent summit crater. Profile A-A’ indicates approximate 1956 collapse plane (dashed line). Small letter profiles a–a’ and b–b’ show landmarks that are used for scale approximation of camera images.
Remotesensing 11 01278 g001
Figure 2. (a) Monitoring camera image of Bezymianny and its neighbouring volcanoes on 7 May 2016. View is to the west. Black box denotes image details shown in: (b) Close-up view of Bezymianny. Pixel and metric distances between a–a’ and b–b’ are derived from a terrain model (cf. Figure 1b). (c) Descending non-geocoded spotlight-mode TSX amplitude image from 23 September 2016 (cf. Figure 1a). Flight direction (azimuth) and line-of-sight (LOS) or range direction of the satellite are indicated. White box shows area used for pixel offset tracking displayed in: (d) Close-up of Bezymianny. Small black boxes mark assumed stable areas (i.e., no deformation) referred to later in displacement analysis. (e) Cumulative number of seismic events in a 6 km radius to the volcano. Available TSX acquisitions with their perpendicular baselines (Baseline) to adjacent acquisitions.
Remotesensing 11 01278 g002
Figure 3. Eruption precursory deformation at Bezymianny between January and November 2017 determined in radar amplitude imagery change difference maps (ad). Close-ups of these maps show the gradual emergence of a rigid body that produces a successively larger radar shadow at the summit crater floor displayed by magenta colours. Contemporaneously, new shadows appear at the northern summit rim. Displayed cumulative range offset maps of consecutive amplitude images (eh) are calculated with a cross-correlation patch of 64 pixels. Red and blue pixel displacements reflect motion away or towards the satellite, respectively. (i) The lower row shows the temporal evolution of ground movement calculated for a 10 × 10 pixels area located within the crater (red box in (h)). Error bars correspond to offset deviations in selected stable regions (cf. Figure S4). See text for details.
Remotesensing 11 01278 g003
Figure 4. Mimatsu diagrams depicting Bezymianny’s summit: (a) before onset of the eruption sequence, (b,c) during the 5 December 2016 and 28 March 2017 eruption, (d,e) after the first (9 March 2017) and second (16 June 2017) explosive eruptions, respectively. Coloured bold lines correspond to the elevation change of the summit with respect to the previous camera image.
Remotesensing 11 01278 g004
Figure 5. Ground motion detected in TSX amplitude images during the 5 December 2016–28 February 2017 effusive eruption. Extent is indicated in Figure 1b. (a1,2), (b1,2), (c1,2), (d1,2) Geocoded TSX amplitude images with indicated changes. Left column are master images, central column are slave images. RB = rigid body. The colour coded outlines show extent of lava flow 1 compared with previous extent. (a3–d3) Azimuth offset maps and 50 m contour lines of Bezymianny. Red and blue colours reflect movement along (approximately southward) or against (approximately northward) the TSX flight direction (LOS). Employed cross-correlation patches are indicated. Arrows in close-up views indicate relative increase of azimuth displacements from the foot to the summit of the dome. Displacement increases towards the summit. Compare Figure S5 for swath profiles A–A’.
Remotesensing 11 01278 g005
Figure 6. Topographic changes at Bezymianny between December 2016 and June 2017. (a,b) show amplitude images of Bezymianny after the 5 December 2016 and 9 March 2017 eruptions, both marked by large lava flows. (c) Amplitude change difference map and (d) aerial image after the 16 June 2017 eruption. White and black arrows (c,d) indicate deposition of pyroclastic deposits and an extrusive body, respectively. Both, the pyroclastic deposits and the extrusive body are indicated by reflectivity increases in (c) (green colouring), whereby the extrusive body is barely perceptible.
Remotesensing 11 01278 g006
Figure 7. Schematic sketch of endogenous and exogenous growth episodes at Bezymianny. (a) Plug extrusion accompanied with degassing through a pre-existing, reactivated fracture network. Circles indicate gas pressurisation, ellipses show shearing at the conduit walls. (b) December 2016 lava flow emplacement and mixing of flow with precursory plug material causing significant compressional folding. The remaining magma batch in the upper conduit starts to solidify. (c) The new plug clogged the vent and (d) deflected the rising magma into distinct parts of the carapace. These mechanisms may account for all detected distension episodes. (e) Gas pressurisation exceeds yield strength of flow 1, and the previously formed new plug extruded. (f) Lava replenishment pushed the new plug and flow 1 westwards, which caused enhanced fracturing of the lava flow.
Remotesensing 11 01278 g007
Table 1. Chronology of volcanic processes at Bezymianny between January 2016 and August 2018. The ra- and az-rates correspond to range and azimuth offset rates, respectively. FOV = field of view.
Observation periodDescription
January–April 2016Discontinuous plug extrusion (ra-rates: 0–0.08 m d−1)
Weak seismicity between (January and March 2016)
May–August 2016Near constant plug extrusion (ra-rate: 0.07–0.13 m d−1)
Brief seismicity in May 2016
Intermittent (apparent) translucent degassing at Bezymianny
Klyuchevskoy active (steaming)
July 2016: onset of tensile crack formation at eastern summit rim
September 2016Faster plug extrusion (ra-rate: 0.15 m d−1)
Klyuchevskoy active (steaming)
Onset of plug disintegration at the western portion
October 2016Onset of eastern summit uplift (9–22 m in Mimatsu diagram)
Increased plug extrusion rates (ra-rate: 0.24 m d−1)
Further widening of tensile cracks
November–beginning of December 2016Accelerated plug extrusion (ra-rate: 0.43–0.63 m d−1)
Onset of continuous seismicity
Substantial widening of summit rim tensile cracks
Strong disintegration of precursory plug
Significant summit uplift (9–37 m in Mimatsu diagram)
December 2016Persistently increasing seismicity
Inelastic bulging of northern composite dome (17 November–20 December 2016; az-rate: 0.05–0.1 m d−1) related to magmatic fluid intrusion
Az-rates of 1st flank bulging increased towards the summit
Bulging occurred likely prior to emplacement of flow 1 (SAR-scene: 20 December 2016)
Flow perpendicular shadow-casting ridge interpreted as compressional fold due to lava-plug mixing
End of December 2016–beginning of February 2017Minor destruction of previously determined summit uplift in Mimatsu diagram
Inferred upper conduit solidification (formation of plug 2) that clogged the vent
Inelastic bulging of northern carapace (31 December 2016–2 February 2017; az-rate: ~0.1–0.6 m d−1) related to magmatic fluid intrusion
Az-rates of 2nd flank bulging increased towards the summit
Substantial increase of seismicity during second half of January 2017
Extrusion of plug 2
Intrusion and plug 2 extrusion possibly related to enhanced seismicity
Mid of February–beginning of March 2017Repeated inelastic bulging of northern carapace (2–13 February 2017; az-rate: ~0.1–0.3 m d−1) related to magmatic fluid intrusion
Lava replenishment at summit that pushed plug 2 westwards
Repeated inelastic bulging of northern carapace (24 February–7 March 2017; az-rate: ~0.1–0.4 m d−1) related to magmatic fluid intrusion
Az-rates of the 3rd and 4th bulging events increased towards the summit
Strongly enhanced seismic activity
Inferred upper conduit crystallisation by end of February and beginning of March 2017
March 2017Significant increase in seismic activity
Explosive eruption on 9 March 2017
Emplacement of flow 2 (SAR-scene: 18 March 2017)
Smooth reflectivity characteristics of flow 2 due to thorough degassing in reservoir
June 2017Strongest explosive eruption on 16 June 2017 depicted by solely deposition of pyroclastic deposits
Summit bulge significantly destroyed, appearance of new extrusive body at southern summit
Southern summit crater extrusion (up to 30 m in Mimatsu diagram) not clearly resolved in SAR data