Author Contributions
Conceptualization, W.L. and X.Y.; Formal analysis, J.J.; Investigation, Y.T. and Y.W.; Writing—original draft, W.L., J.J., T.G., M.Z. and X.Y.; Writing—review and editing, Y.Z. (Yu Zhang), T.C., Y.Z. (Yan Zhu) and W.C.
Funding
This work was supported by grants from the National Key Research and Development Program of China (2016YFD0200700), National Natural Science Foundation of China (31671582), Jiangsu Qinglan Project, the Fundamental Research Funds for the Central Universities (SYSB201801), the Postgraduate Research and Practice Innovation Program of Jiangsu Province (KYCX18_0659), Jiangsu Collaborative Innovation Center for Modern Crop Production(JCICMCP), the Priority Academic Program Development of Jiangsu Higher Education Institutions (PAPD), the Jiangsu Province Key Technologies R&D Program (BE2016375), the 111 project (B16026), and Qinghai Project of Transformation of Scientific and Technological Achievements (2018-NK-126), Xinjiang Corps Great Science and Technology Projects (2018AA00403).
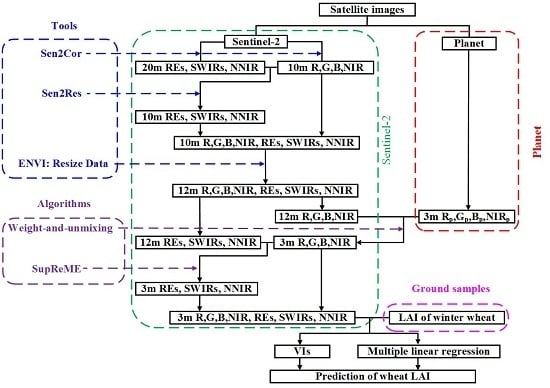
Figure 1.
The distribution of sample fields in Xinghua city, Jiangsu Province, China.
Figure 1.
The distribution of sample fields in Xinghua city, Jiangsu Province, China.
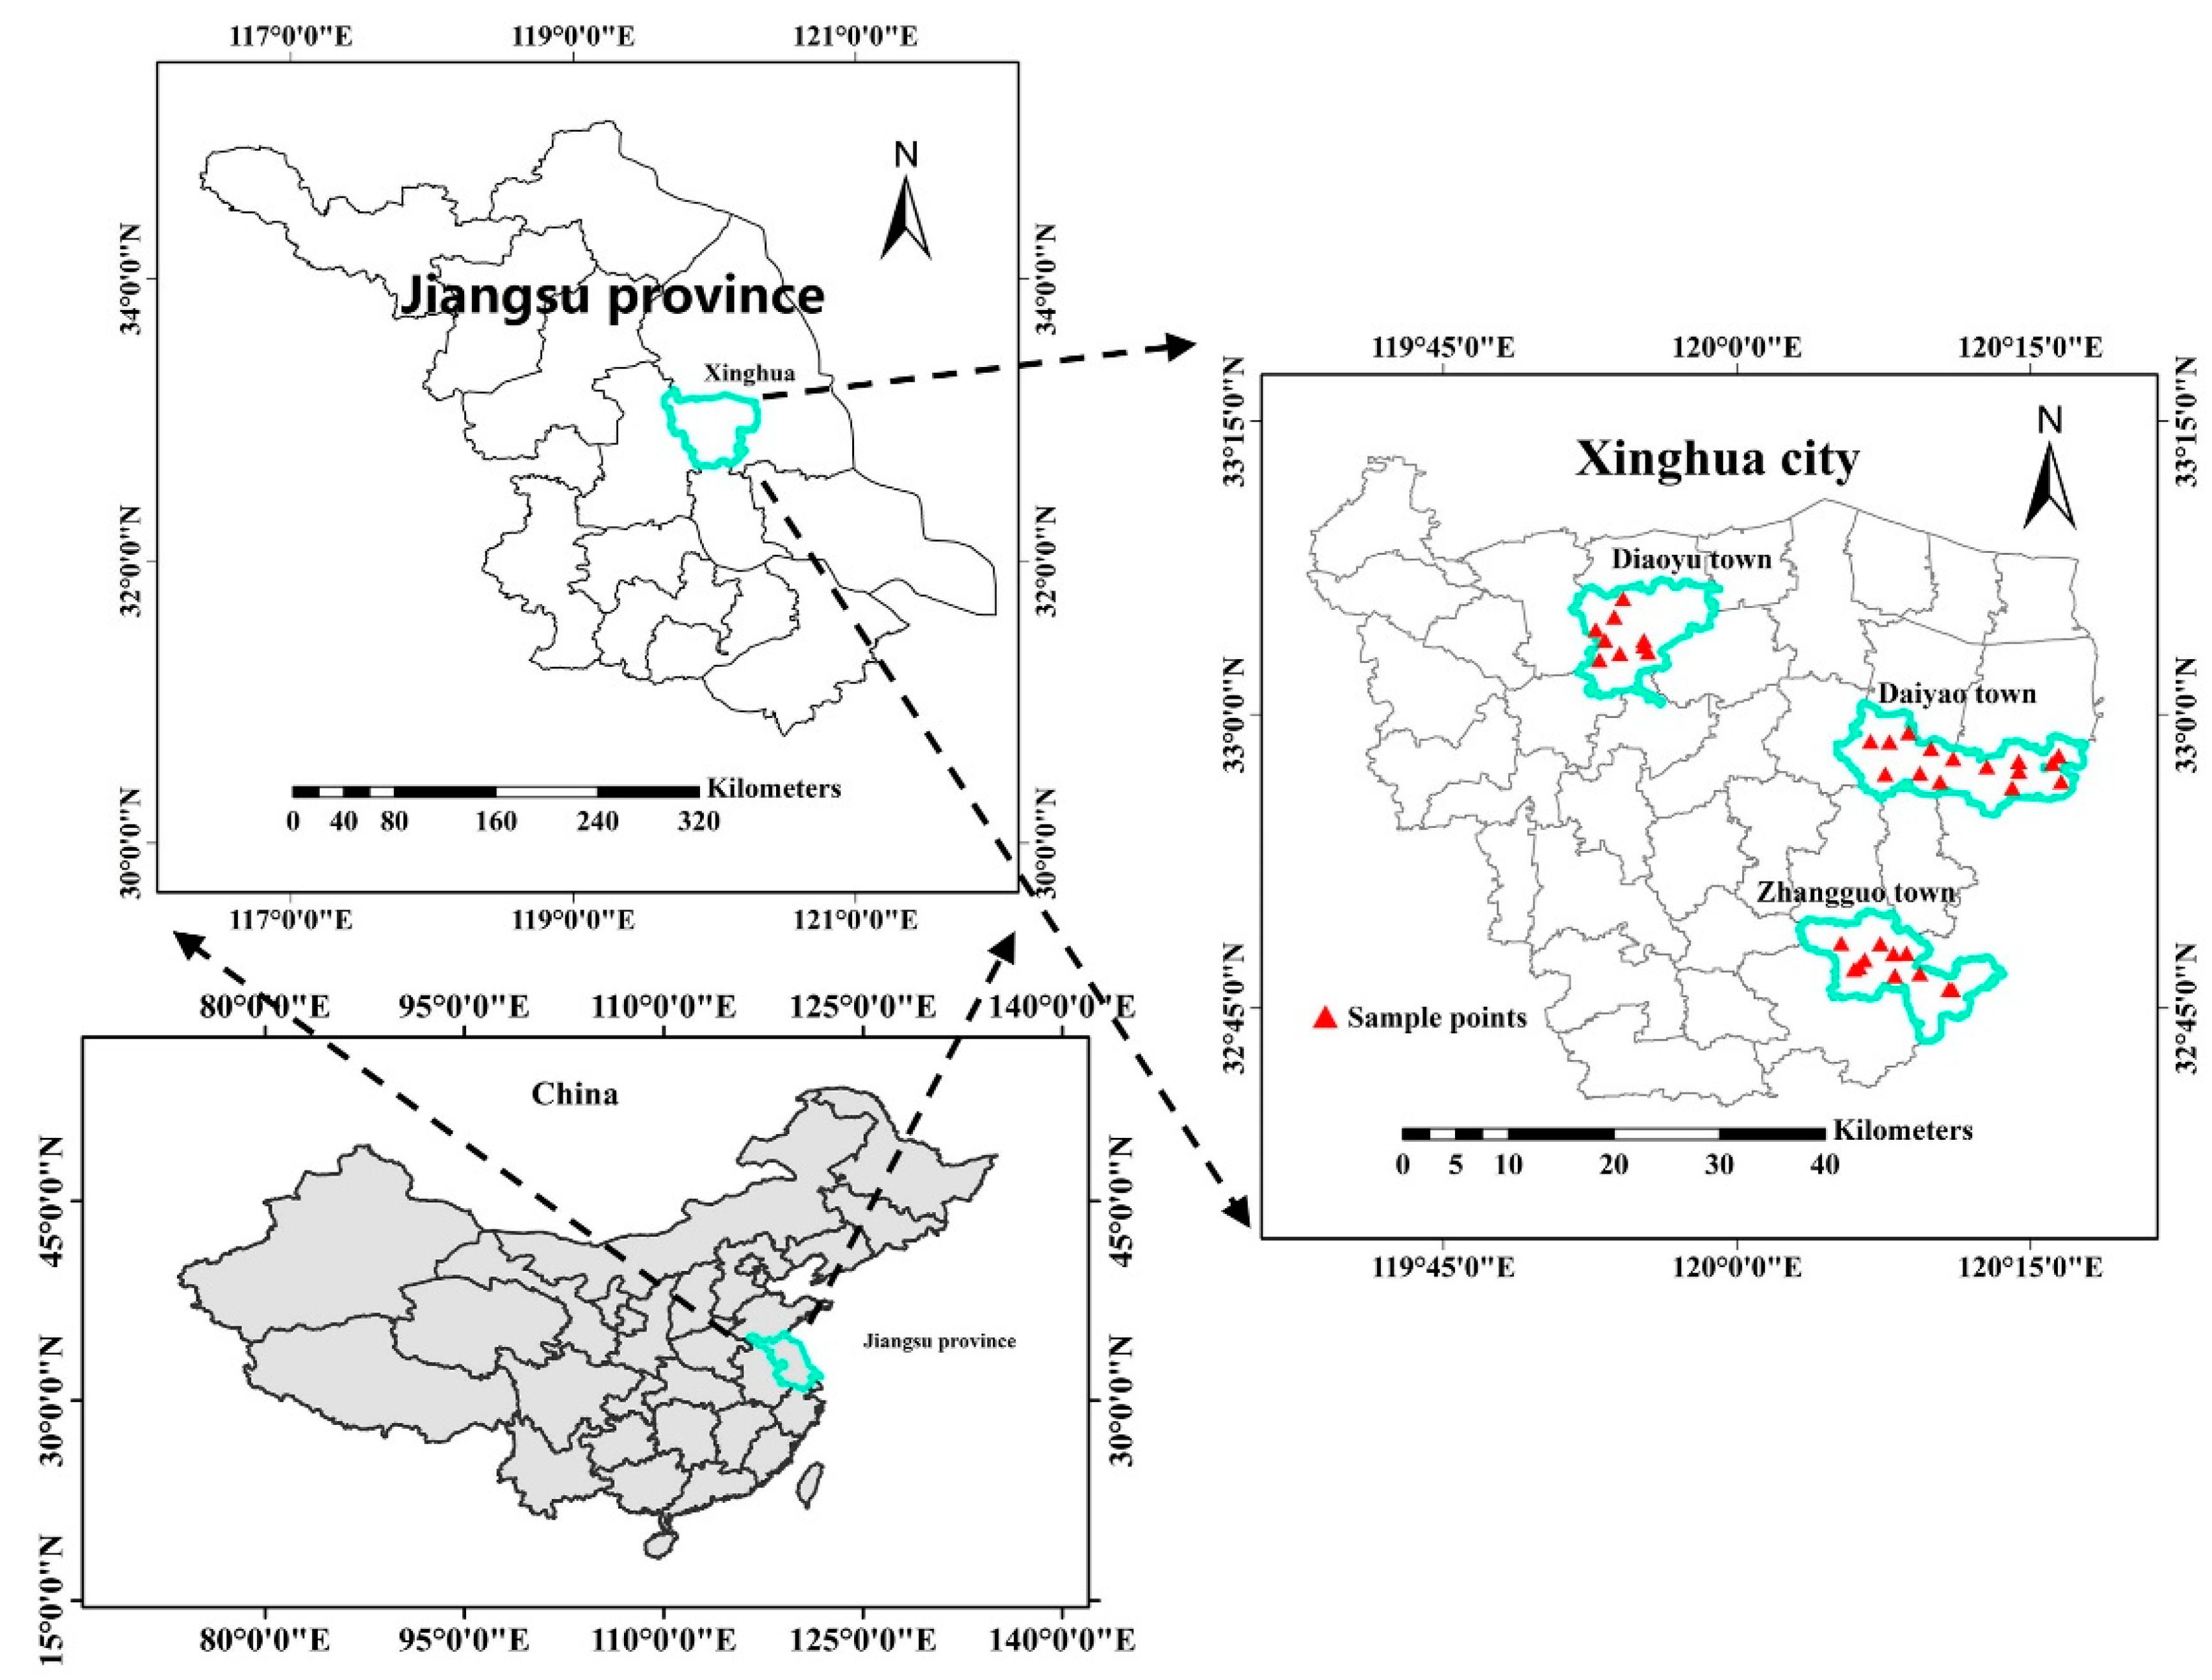
Figure 2.
Flowchart of fused image processing and wheat LAI prediction.
Figure 2.
Flowchart of fused image processing and wheat LAI prediction.
Figure 3.
Weight-and-unmixing processing approach: (a) represents the reflectance of Planet VNIR; (b) represents the weight ensured by (a), and; (c) represents Sentinel-2 12 m resolution pixels containing 16 pixels of 3 m resolution Sentinel-2.
Figure 3.
Weight-and-unmixing processing approach: (a) represents the reflectance of Planet VNIR; (b) represents the weight ensured by (a), and; (c) represents Sentinel-2 12 m resolution pixels containing 16 pixels of 3 m resolution Sentinel-2.
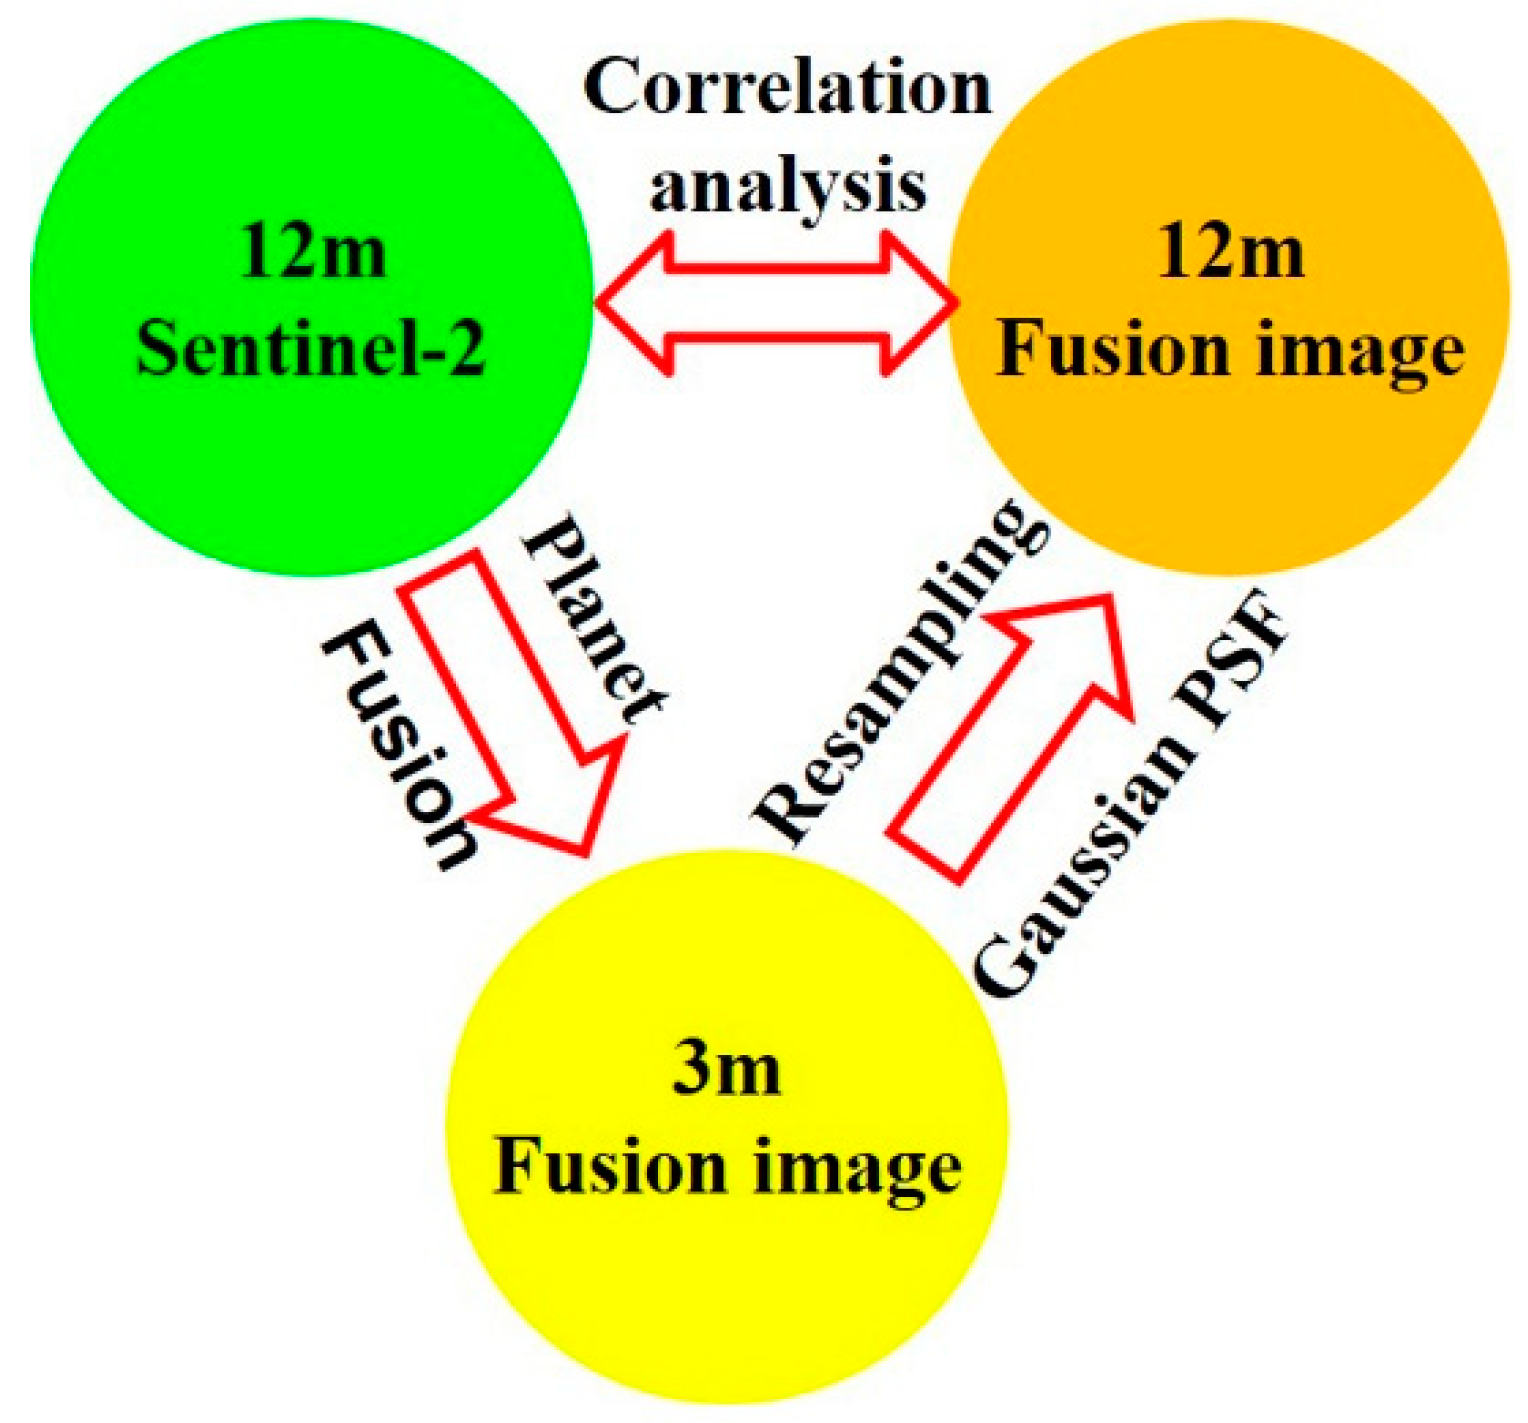
Figure 4.
Image assessment via correlation analysis.
Figure 4.
Image assessment via correlation analysis.
Figure 5.
Comparison of true (R,G,B) and false (NIR,R,G) color of 10 m Sentinel-2 (a), 12 m Sentinel-2 (b), 3 m Planet (c), and 3 m fused images (d).
Figure 5.
Comparison of true (R,G,B) and false (NIR,R,G) color of 10 m Sentinel-2 (a), 12 m Sentinel-2 (b), 3 m Planet (c), and 3 m fused images (d).
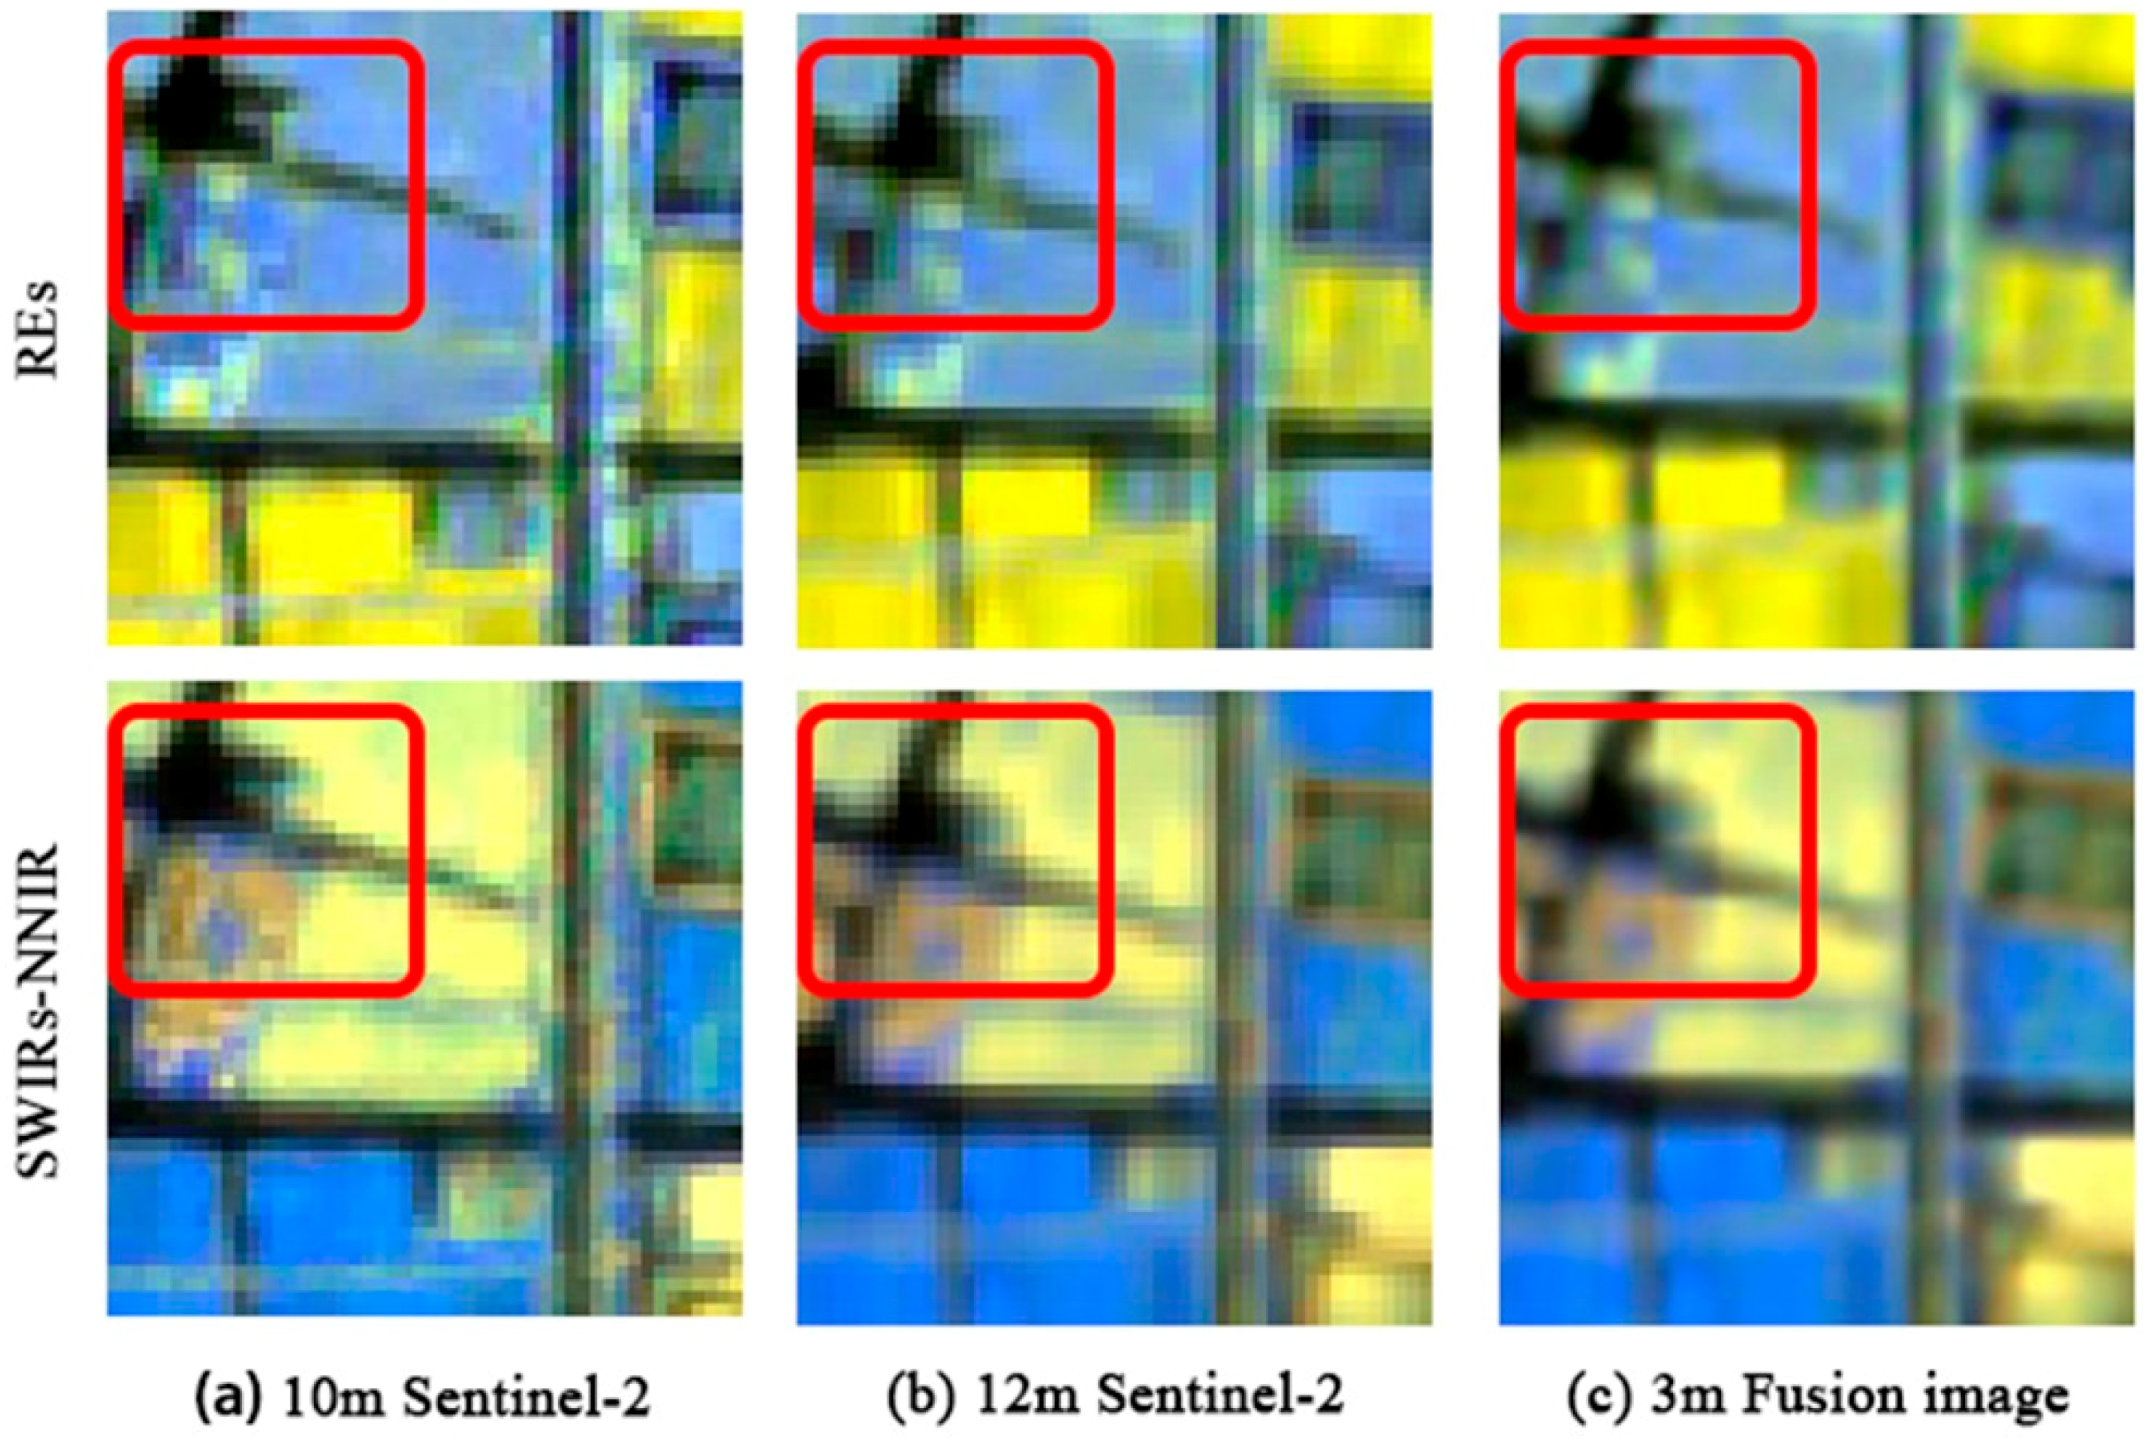
Figure 6.
Comparison of REs (RE-3, RE-2,RE-1) and SWIRs-NNIR (SWIR-2, SWIR-1, Narrow NIR) 10 m Sentinel-2 (a), 12 m Sentinel-2 (b), and 3 m fused images (c).
Figure 6.
Comparison of REs (RE-3, RE-2,RE-1) and SWIRs-NNIR (SWIR-2, SWIR-1, Narrow NIR) 10 m Sentinel-2 (a), 12 m Sentinel-2 (b), and 3 m fused images (c).
Figure 7.
Comparison of blue (a), green (b), red (c) and NIR (d) bands at 12 m resolution from fused and Sentinel-2 images.
Figure 7.
Comparison of blue (a), green (b), red (c) and NIR (d) bands at 12 m resolution from fused and Sentinel-2 images.
Figure 8.
Comparison of RE-1 (a), RE-2 (b), RE-3 (c), NNIR (d), SWIR-1 (e), and SWIR-2 (f) bands at 12 m resolution from fused and Sentinel-2 images.
Figure 8.
Comparison of RE-1 (a), RE-2 (b), RE-3 (c), NNIR (d), SWIR-1 (e), and SWIR-2 (f) bands at 12 m resolution from fused and Sentinel-2 images.
Figure 9.
The distribution of LAI at three stages within the three towns studied here based on the fused image generated in this analysis.
Figure 9.
The distribution of LAI at three stages within the three towns studied here based on the fused image generated in this analysis.
Figure 10.
Comparison of blue (a), green (b), red (c) and NIR (d) bands at 12 m resolution from Planet and Sentinel-2 sources.
Figure 10.
Comparison of blue (a), green (b), red (c) and NIR (d) bands at 12 m resolution from Planet and Sentinel-2 sources.
Table 1.
Multi-Spectral Instrument (MSI) data from Sentinel-2.
Table 1.
Multi-Spectral Instrument (MSI) data from Sentinel-2.
| Bands | Central Wavelength (nm) | Bandwidth (nm) | Spatial Resolution (m) |
|---|
| B1-Coastal aerosol | 443 | 20 | 60 |
| B2-Blue | 490 | 65 | 10 |
| B3-Green | 560 | 35 | 10 |
| B4-Red | 665 | 30 | 10 |
| B5-red-edge (RE-1) | 705 | 15 | 20 |
| B6-red-edge (RE-2) | 740 | 15 | 20 |
| B7-red-edge (RE-3) | 783 | 20 | 20 |
| B8-NIR | 842 | 115 | 10 |
| B8a-Narrow NIR (NNIR) | 865 | 20 | 20 |
| B9-water vapor | 945 | 20 | 60 |
| B10-SWIR-Cirrus | 1380 | 30 | 60 |
| B11-SWIR-1 | 1610 | 90 | 20 |
| B12-SWIR-2 | 2190 | 180 | 20 |
Table 2.
PlanetScope band information.
Table 2.
PlanetScope band information.
| Bands | Central Wavelength (nm) | Bandwidth (nm) | Spatial Resolution (m) |
|---|
| B1-Blue | 480 | 60 | 3 |
| B2-Green | 540 | 90 | 3 |
| B3-Red | 610 | 80 | 3 |
| B4-NIR | 780 | 80 | 3 |
Table 3.
Acquisition times for wheat samples as well as Planet and Sentinel-2 images at different crop growth stages.
Table 3.
Acquisition times for wheat samples as well as Planet and Sentinel-2 images at different crop growth stages.
| Stages | Ground Sampling Date | Study Areas | Planet Image Acquisition Time | Sentinel-2 Image Acquisition Date |
|---|
| Tillering | 8 March 2018–10 March 2018 | Diaoyu | 13 March 2018 2:33:36 A.M. UTC | 10 March |
| Daiyao | 9 March 2018 2:33:17 and 2:06:55 A.M. UTC |
| Zhangguo | 9 March 2018 2:06:55 and 2:05:38 A.M. UTC |
| Jointing | 22 March 2018–24 March 2018 | Diaoyu | 27 March 2018 2:07:49 A.M. UTC | 25 March |
| Daiyao | 27 March 2018 2:30:35 A.M. UTC |
| Zhangguo | 27 March 2018 2:07:06 A.M. UTC |
| Booting | 9 April 2018–11 April 2018 | Diaoyu | 9 April 2018 2:08:50 A.M. UTC | 9 April |
| Daiyao | 9 April 2018 2:07:23 A.M. UTC |
| Zhangguo | 9 April 2018 2:29:25 A.M. UTC |
Table 4.
Algorithms and references for VIs for the agriculture application of fused, Planet, and Sentinel-2 images.
Table 4.
Algorithms and references for VIs for the agriculture application of fused, Planet, and Sentinel-2 images.
| Index | Formulation | Reference |
|---|
| Normalized difference vegetation index (NDVI) | (NIR − Red)/(NIR + Red) | [28] |
| Enhanced vegetation index (EVI) | 2.5 × (NIR − Red)/(NIR + 6 × Red − 7.5 × Green + 1) | [29] |
| Soil-adjusted vegetation index (SAVI) | (NIR − Red)/(NIR + Red + 0.25) + 0.25 | [30] |
| Ratio vegetation index (RVI) | NIR/Red | [31] |
| Difference vegetation index (DVI) | NIR − Red | [32] |
| Green chlorophyll index (CI green) | NIR/Green − 1 | [33] |
| Normalized difference red-edge index (NDRE) | (NIR − RE)/(NIR + RE) | [34] |
| Modified enhanced vegetation index (MEVI) | 2.5 × (NIR − RE)/(NIR+6 × RE-7.5 × Green + 1) | [35] |
| Soil-adjusted red-edge index (SARE) | (NIR − RE)/(NIR + RE + 0.25) + 0.25 | [7] |
| Red-edge ratio vegetation index (RERVI) | NIR/RE | [36] |
| Red-edge difference vegetation index (REDVI) | NIR − RE | [28] |
| Chlorophyll index (CI red-edge) | NIR/RE − 1 | [12] |
| Red-edge inflection point (REIP) | 705 + 35 × ((Red+RE3)/2 − RE1)/(RE2 − RE1) | [8] |
Table 5.
Comparison of and values between none-RE-VIs and LAI estimates derived from Planet, Sentinel-2, and fused images.
Table 5.
Comparison of and values between none-RE-VIs and LAI estimates derived from Planet, Sentinel-2, and fused images.
| Source | 3 m Planet | 10 m Sentinel-2 | 3 m Fusion |
|---|
| VIs | | | | | | |
|---|
| NDVI | 0.28 | 39.46% | 0.54 | 28.35% | 0.56 | 27.71% |
| EVI | 0.27 | 38.68% | 0.63 | 25.45% | 0.66 | 24.56% |
| SAVI | 0.37 | 37.14% | 0.62 | 25.58% | 0.64 | 24.81% |
| RVI | 0.28 | 40.12% | 0.59 | 26.62% | 0.62 | 25.50% |
| DVI | 0.42 | 35.60% | 0.67 | 24.08% | 0.70 | 22.84% |
| CIgreen | 0.41 | 37.23% | 0.62 | 25.86% | 0.65 | 24.78% |
Table 6.
Comparison of and values between RE-VIs and LAI estimates derived from Planet, Sentinel-2, and fused image.
Table 6.
Comparison of and values between RE-VIs and LAI estimates derived from Planet, Sentinel-2, and fused image.
| Source | 10 m Sentinel-2 | 3 m Fusion | Source | 10 m Sentinel-2 | 3 m Fusion |
|---|
| VIs | | | | | VIs | | | | |
|---|
| NDRE 1 | 0.62 | 25.37% | 0.64 | 24.60% | RERVI 2 | 0.69 | 22.94% | 0.76 | 20.41% |
| NDRE 2 | 0.69 | 23.02% | 0.76 | 20.70% | RERVI 3 | 0.27 | 35.33% | 0.39 | 32.77% |
| NDRE 3 | 0.27 | 35.49% | 0.39 | 32.89% | REDVI 1 | 0.69 | 23.11% | 0.72 | 22.26% |
| MEVI 1 | 0.68 | 23.67% | 0.70 | 22.67% | REDVI 2 | 0.71 | 22.06% | 0.76 | 20.45% |
| MEVI 2 | 0.72 | 22.17% | 0.78 | 19.97% | REDVI 3 | 0.41 | 31.94% | 0.51 | 29.10% |
| MEVI 3 | 0.27 | 35.75% | 0.38 | 32.75% | CI red-edge 1 | 0.64 | 24.94% | 0.67 | 23.72% |
| SARE 1 | 0.66 | 24.42% | 0.69 | 23.13% | CI red-edge 2 | 0.69 | 22.90% | 0.76 | 20.78% |
| SARE 2 | 0.71 | 22.38% | 0.77 | 20.14% | CI red-edge 3 | 0.27 | 35.09% | 0.39 | 33.27% |
| SARE 3 | 0.31 | 34.49% | 0.43 | 31.65% | REIP | 0.63 | 25.35% | 0.66 | 24.46% |
| RERVI 1 | 0.64 | 24.83% | 0.67 | 23.69% | | | | | |
Table 7.
Values for and from the different images used to assess wheat LAI via MLR.
Table 7.
Values for and from the different images used to assess wheat LAI via MLR.
| | Planet | Sentinel-2 | Fusion |
|---|
| 0.63 | 0.76 | 0.81 |
| 42.36% | 33.58% | 33.40% |


 ,
, 


