Article

The Messapic Site of Muro Leccese: New Results from Integrated Geophysical and Archaeological Surveys

1
Department of Cultural Heritage—University of Salento, via Birago, 73100 Lecce, Italy
2
Institute for Archaeogical and Monumental Heritage—National Research Council, Prov.le Lecce-Monteroni, 73100 Lecce, Italy
3
International Telematic University Uninettuno, Corso Vittorio Emanuele II, 39, 00100 Roma, Italy
*
Author to whom correspondence should be addressed.
Remote Sens. 2019, 11(12), 1478; https://doi.org/10.3390/rs11121478
Submission received: 7 May 2019 / Revised: 10 June 2019 / Accepted: 18 June 2019 / Published: 21 June 2019
(This article belongs to the Special Issue Recent Progress in Ground Penetrating Radar Remote Sensing)

Abstract

:
The regular application of geophysical survey techniques to evaluate archaeological sites is well established as a method for locating, defining, and mapping buried archaeological materials. However, it is not always feasible to apply a range of different methods over a particular site or landscape due to constraints in time or funding. This paper addresses the integrated application of three geophysical survey methods over an important archaeological site located in south Italy. In particular, it is focused on the results achieved from a past geophysical survey and the ongoing excavations performed by archaeologists in the site of Muro Leccese. Muro Leccese (Lecce) is one of the most important Messapian archaeological sites in southern Italy. The archaeological interest of the site was generated since the discovery of the remains of Messapian walls (late 4th–3rd centuries BC). With the aim of widening the archaeological knowledge of the Messapian settlement, several integrated methods, including magnetometry, ground-penetrating radar, and electrical resistivity tomography were used on site to fulfill a number of different research objectives. Since the most important targets were expected to be located at shallow soil depth, a three-dimensional (3D) ground-penetrating radar (GPR) survey was carried out in two zones, which were labeled respectively as zone 1 and zone 2, and were both quite close to the archaeological excavations. The GPR investigations were integrated with a 3D electrical resistivity tomography (ERT) survey in zone 1 and with a magnetometric, in gradiometry configuration survey in zone 2. The integration of several techniques allowed mapping the structural remains of this area and leading the excavation project. The geophysical results show a good correspondence with the archaeological features that were found after the excavation. Current work on the geophysical survey data using different codes for the processing of the data and merging different datasets using a Geographic Information System allowed achieving a user-friendly visualization that was presented to the archaeologists.

1. Introduction

Geoscience methods are widely used for the detection and investigation of shallow targets. They have been applied with success in several geological [1,2,3], hydrogeological [4,5,6,7], environmental [8,9,10], and engineering [11,12,13,14] problems.
They are being increasingly utilized and reported upon by archaeological research teams for the detection and location of buried structures in terrestrial environments. In particular, several authors have provided reviews of archaeological geophysical investigations in different geological conditions [12,15,16,17,18,19,20,21]. Geophysical campaigns with methods such as ground-penetrating radar (GPR), electrical resistivity tomography (ERT), and magnetometric have been reported [16,19,20,22,23,24,25]. The success of any method meaningfully depends on the difference between the measurable physical parameters (such as resistivity, relative dielectric constant, susceptivity) of the potential archaeological targets (walls, roads, buildings, tombs, caves, etc.) and the surrounding environment. In particular, magnetometry allows, in favorable conditions, reducing the time of data acquisition and interpretation [26,27], whereas GPR allows obtaining a high resolution and depth of penetration [19,20,27,28,29]. The ERT method is used mainly as a complementary tool to enhance the information gained from other geophysical methods [19,20]. However, over the past decade, significant advancements have been achieved in the development of ERT field equipment and inversion programs, so that three-dimensional (3D) ERT surveys have become progressively more frequent. Notwithstanding, due to their simplicity in terms of field implementation, 3D ERT surveys using sets of non-conventional two-dimensional (2D) profiles are still used in most investigations [5,20,30].
In the archaeological investigations context, burials structures are generally placed within the first 10 m below ground level (bgl), and usually they are much shallower [19,20]. In some rare cases, such as for example in the archaeological areas of Pompeii and Ercolano, in southern Italy, the buried structures are even at the depth of 30 m from the current planking level [20].
Recent approaches to classical archaeological sites, and in particular urban centers, have demonstrated the benefits of geophysical surveys applied over a broad area in order to establish the nature and extent of archaeological features [23,26,27,28,31,32]. When making use of a single geophysical technique, the results can be affected by the examination of a single physical quantity, which perhaps is not clearly retrievable in those circumstances, whereas a plurality of techniques can exploit complementary data, and allow funding the interpretation of the measurement of several physical quantities [20,25,29,31,32].
The map derived from an integrated geophysical survey can allow achieving an accurate and high-resolution representation of archaeological features, and through an interpretation with the archaeologists, it can be possible to understand the nature and development of a particular site or landscape [19,20,26,27]. In the last 10 years, archaeogeophysics has achieved important advances in terms of techniques, application, and interpretation [19,20]. It is important to underline that there are in general several issues that need to be addressed before undertaking archaeogeophysical research. The first issue regards the main archaeological questions related to the archaeological site at hand: it is important to know what the archaeologists are looking for. In the case at hand, we know that the archaeologists were trying to achieve insight about the development an ancient Messapic settlement and of the necropolis, and we knew that in that context, such possible remains were expected to lay in the first 1–1.5 m. Moreover, the area was not very urbanized, and the topography of the soil was flat and smooth. So, the case study was presumably suitable for magnetometry and GPR at radiofrequency. Moreover, some cavity could be expected (as the tombs can be sometimes, even if in many cases archaeologists found them filled up with loose materials), and this made it worth trying ERT measurements also, which perceive the “nature” of the cavities as strongly resistive anomalies.
A second point is related to a limited awareness, in some cases, amongst some archaeologists, with regard to the appropriate scale of the geophysical survey to be undertaken. So, a preliminary discussion and possibly a survey on the site are important in order to establish the needed time and possible costs.
The interpretation of anomalies is of course the most important issue. Geophysicists are often brought to label as “buried structures” the anomalies seen from their measurements and data processing, but what these structures are (walls, tombs, or other) is not at all times easy to say. Therefore, it is important to discuss with the archaeologists and reach, together with them, a reasonable interpretation. We have followed this work flux in the present paper.
In particular, we have performed geophysical investigations in two zones labeled zone 1 and zone 2. The interpretation of GPR data were enhanced thanks to the ERT data in zone 1 and magnetic data in zone 2. The integrated results enabled us to provide a reasonable interpretation of the GPR data, which was also subsequently confirmed by some excavations, as it will be shown.

2. Site Description

The settlement of Muro Leccese, which is today a town of about 5000 inhabitants, is located in the Salento peninsula in the southern part of the Puglia Region, about 40 km southeast of Lecce (Figure 1). Similar to other towns in this geographical area, its history began in the Iron Age (8th century BC), and has continued almost uninterrupted up to the present (Figure 1). The archaeological research conducted in Muro by the University of the Salento every year since 2000 has addressed several areas, albeit at different levels of detail, and the results now allow us to draw a preliminary profile of the ancient inhabited area as a whole [33].
Muro’s long history can be divided into three phases characterized by differing kinds of settlement:
During the Iron Age, from the 8th to the mid-6th centuries BC, the settlement was organized into clusters of huts distributed over an area of about 70 hectares. Inhabited by groups of interrelated families, the clusters were separated from each other by open spaces [34].
In the course of the 6th century BC (Archaic period), the town underwent profound transformations in terms of layout, architecture, and social structure, which were influenced by the nearby Greek colonies of southern Italy: the huts were abandoned in favor of houses made of stone and bricks, the banquet was adopted as a ceremonial practice reserved for the aristocracy, funerary rituals envisaged the burial of the corpse, and the Greek alphabet was used for inscriptions in the Messapian language [35,36,37].
At the end of the 4th century BC, the landscape was marked by the construction of an imposing circuit of walls built with large squared blocks. Almost 4 km long and 3 m thick, the walls enclosed an area of more than 100 hectares [38]. The archaeological investigation revealed how its construction changed the shape of the ancient settlement, the walls resetting the boundaries of the town. Some of the clusters of dwellings dating from the Archaic period lay outside the circuit and were abandoned [35,37,38].
However, the new walled settlement did not endure for a long time, and the town was almost certainly conquered and destroyed by the Romans following a siege. There are evidences of fires and collapses, followed by the rapid and definitive abandonment of the houses [39].
From a geological point of view, the Salento peninsula including the investigated archaeological area is the southernmost emerged part of Adria Plate, which constitutes the foreland of both Apenninic and Dinaric origins. It comprises a Variscan basement covered by a 3–5-km thick Mesozoic carbonate sequence (the “Calcari delle Murge” unit) overlain by thin Tertiary and Quaternary deposits. The most ancient rocks of this coverage were produced by transgressions after the definitive emersion of the Apulian carbonate platform, which occurred between the end of the Cretaceous and the beginning of Paleogene periods. In some cases, bauxitic deposits can be found between Mesozoic limestones and Paleogene units [19]. Four sedimentary cycles have been recognized from Neogene to Lower Pleistocene periods [3,19]. The first cycle comprises the formation of the “Pietra Leccese” and the overlying Calcarenite di Andrano Formation.
The Miocene sedimentary cycle was interrupted because of the emersion of Salento, which prevented the formation of Messinian evaporites. The total thickness of Miocene formations is greater than 150 m on the eastern side of the peninsula. The second cycle is represented by breccias and conglomerates of the Leuca Formation, which were deposited during the Lower Pliocene, reaching a maximum thickness of 30 m. The third sedimentary cycle is represented by the Upper Pliocene “Uggiano la Chiesa” Formation, which is composed of well-stratified and fossiliferous biodetritical limestones and yellowish calcareous sands with a maximum thickness of about 80 m. The fourth sedimentary cycle promoted the deposition in the Lower Pleistocene of the Calcareniti del Salento Formation, which is a very fossiliferous biodetritical calcareous sediment marked by the occurrence of Arctica islandica Linneo. Its maximum thickness is about 60 m. Finally, a number of Middle-Upper Pleistocene deposits related to eustatic sea level change can be found too on the Salento peninsula [3,19]. Three main tectonic events affected the Salento Peninsula during the Eo–Oligocene, the Middle Pliocene, and the Middle Pleistocene periods. In particular, the most recent tectonic phase was responsible for the final uplift of the Apulia foreland after the general subsidence took place in the early Miocene period; uplift ended at marine isotope stages (MIS) 9.3, about 330 ka BP. The Salento peninsula is a low-elevated landscape composed of a number of Pleistocene plains placed at different altitudes between sea level and 160 m of elevation. They are bordered by geomorphically degraded fault scarps, which were mostly elongated in the NW−SE and NNW−SSE directions, by differential erosion scarps, and by relict cliffs. Along the coast of the Salento peninsula, a number of marine terraces produced by the superimposition of regional uplift and glacio-eustatic sea level changes that occurred since the Middle Pleistocene period, can be recognized. In particular, the inner and western parts of the Salento Peninsula show a landscape produced by contact karst processes made of wide karstic surfaces, remnants of a Middle Pleistocene sedimentary cover, and morphostructural ridges. The karstic surfaces belong to a re-exhumed landscape shaped between the Lower and the Middle Pleistocene, whereas the morphostructural ridges are made of Mesozoic dolomitic-carbonatic units and show a polycyclic landscape. However, sinkholes are the main karstic landforms in many sectors of Salento, affecting all the outcropping carbonate rocks, including the Cretaceous limestone, the Oligocene, Miocene, and Plio-Pleistocene calcarenites, and the Middle and Upper Pleistocene terraced marine deposits. They are widespread, especially along the low elevated rocky platforms occurring on both the Adriatic and Ionian coasts, and display different typologies and states of activity. Locally, in the site at hand, data from archaeological excavations and geological observations (box core samples) made it possible to reconstruct the stratigraphy of the first 10 m of sediments. On the surface, there is a layer that is about 0.3 m thick constituted by covering materials (such as agricultural terrain). Beneath this layer, an organogenic calcarenites, compact detrital limestones layer is present, reaching up to 5 m in depth. In some places, this calcarenite is covered by up to three meters of alternating sands, silty sands, and marly limestone deposits (Figure 2 and Figure 3) [32].
As can be seen from Figure 2, Muro Leccese is just on the boundary between two different geological formations, which made it difficult to predict a priori the possible characteristics of the soil.
On the other hand, there was abundant archaeological information, as said previously. In particular, in 2002, the use of geophysical methods in the close Masseria Cunella district led to the detection of a possible grave burial. The following excavation campaign of 2003, conducted by Liliana Gardino et al., discovered a funerary area with two semi-chamber tombs that form a single complex used by the same family from the late 6th to the mid-3rd century B.C., with the deposition of 27 individuals. The grave goods highlight the occupants’ high economic level, which in particular was witnessed by a late-Archaic Attic krater from the workshop of the Painter of Antimenes that was found in Tomb 2 [40,41,42].
Following such an extraordinary result, other areas were investigated through geophysical methods before the archaeological excavation, namely Proprietà Natali (zone 1) and Palombara district (zone 2).

3. Materials and Methods

3.1. Zone 1

Zone 1 was divided in five areas labeled respectively A, B, C, D, and E (Figure 4a). GPR propsecting was performed in all the areas, while ERT measurements were performed only in area C.
A GPR survey was performed using a pulsed RIS Hi Mod GPR system manufactured by the IDS-Corporation. The system is equipped with a dual-band antenna with central frequencies at 200 and 600 MHz, although only the results from the high-resolution 600 MHz survey are presented here. The archaeological targets looked for were expected to have a size between 0.5–2 m, and their depth was expected to range from tens of centimeters to a few meters.
The survey was carried out in two zones (1 and 2 in Figure 4), which were both placed on the east side of the excavation. The GPR data were collected along parallel profiles spaced 0.5 m from each other. The GPR data were subsequently processed using standard two-dimensional processing techniques by means of the GPR-Slice Version 7.0 software [43]. The processing flow chart consisted of the following steps: (1) header editing for inserting the geometrical information; (2) frequency filtering; (3) manual gain to adjust the acquisition gain function and enhance the visibility of deeper anomalies; (4) customized background removal to attenuate the horizontal banding in the deeper part of the sections (ringing), performed by subtracting in different time ranges a local average trace estimated from suitably selected time–distance windows with low signal content (this local subtraction procedure was necessary to avoid artefacts created by the classic subtraction of the global average trace estimated from the entire section, due to the presence of zones with a very strong signal); (5) estimation of the average electromagnetic wave velocity by hyperbola fitting; and (6) Kirchhoff migration.
In Zone 1 area C, GPR measurements were integrated with ERT measurements. In particular, a special ERT arrays was used, with the electrodes distributed along a path surrounding area C [15,30,44] along an L-shaped line. Moreover, a dipole–dipole equatorial-parallel array was used, too. Initially, a 2D survey was conducted along each perpendicular line or transect, and subsequently, the current electrodes remained at the end of one line, while the potential electrodes were moved along the line. Then, the current electrodes were moved with a spatial step equal to the distance between two adjacent electrodes, and the potential electrodes were again moved, as previously described. The process was repeated until the current and potential electrodes covered the L geometry. This sequence of observations produced a series of apparent resistivity observations toward and beneath the central portion of the array. The process is discussed in detail in [30].
The resistivity data were collected using a Syscal kid swich device (IRIS Instruments, France) supporting 24 electrodes. The electrode separation was 1 m. A penetration depth of 3.6 m was obtained. After the data acquisition, processing was performed, and the apparent resistivity data were analyzed to identify abnormal measurements with a high standard deviation.
The investigated volume was computed using the software ErtLab (http://www.geostudiastier.it), which makes use of finite element method (FEM). Several horizontal depth slices were analyzed to observe the extension versus depth of the resistivity features.

3.2. Zone 2

In the Zone 2, GPR and magnetic gradiometry data were acquired. GPR data were acquired and processed in the same way as described above for Zone 1. Magnetic gradiometry allows achieving a rapid mapping of magnetized archaeological objects, buried structures, and features [17]. Generally speaking, it highlights buried structures that show an appreciable magnetic susceptibility and therefore high contrast with the magnetic susceptibility of the embedding soils and sediments. Standard gradiometers measure the vertical gradient of the local magnetic field. The values of the vertical gradient are influenced by shallow magnetic subsurface archaeological features. The depth of investigation using the gradiometry technique depends on the nature of possible subsurface targets and can extend up to 2 m.
The objective of the gradiometric survey is to detect, by means of surface measurements, variations in the magnetic properties, or magnetization, of the subsurface. These variations in subsurface magnetization can be related to archaeological remains (walls, tombs, floors, etc.) as well as geological structures such as a pegmatite vein or basaltic dike in granite, a fault in bedrock, or hydrothermal alterations. They can also be related to the human disturbance of soil through the presence of magnetic objects in the subsurface. The anomalous anomalies define the spatial variations in the field that can be measured on the surface. Mapping magnetic anomalies on the surface allows inferring the presence or absence of magnetic material in the subsurface. The magnetic gradient allows differentiation between deeply buried objects and shallower ones [17]. Typically, a gradiometer uses two sensors to measure the gradient in the magnetic field. In the case history at hand, the data were acquired using a Bartington model 601 gradiometer along parallel lines spaced 1 m apart. Data were acquired in continuous mode with a sampling interval of 0.2 s. The sensors were oriented vertically. A data logger and a control console, which was mounted in front of the driver, were used to control the data collection. Data were recorded with an accuracy of 0.002 nano-Teslas (nT). All the acquired magnetic data were preprocessed with the use of bandpass amplitude filters with values between −30nT/m+30nT/m, which represents the range wherein the values associated to archaeologically significant magnetic alignments usually fall. In this phase, in addition, it was necessary to eliminate events, which are referred to as spikes, and were attributable to the presence of alignments due to anthropogenic settlement. In the next step, all the data were interpolated through a grid of data scaled between −20 nT/m and +20 nT/m.

4. Results

4.1. ZONE 1

4.1.1. Zone 1, Area A

Area A was a rectangle sized 18 × 6 m. A general characteristic of the surveyed area is a low penetration of the electromagnetic energy (about 25 ns); this is due to the physical characteristics of the subsurface material, which severely dissipates the electromagnetic energy, as also expected from the geological characteristics of the area. Most of the observed anomalies are confined within the first 18 ns in all the profiles acquired in the area (Figure 5).
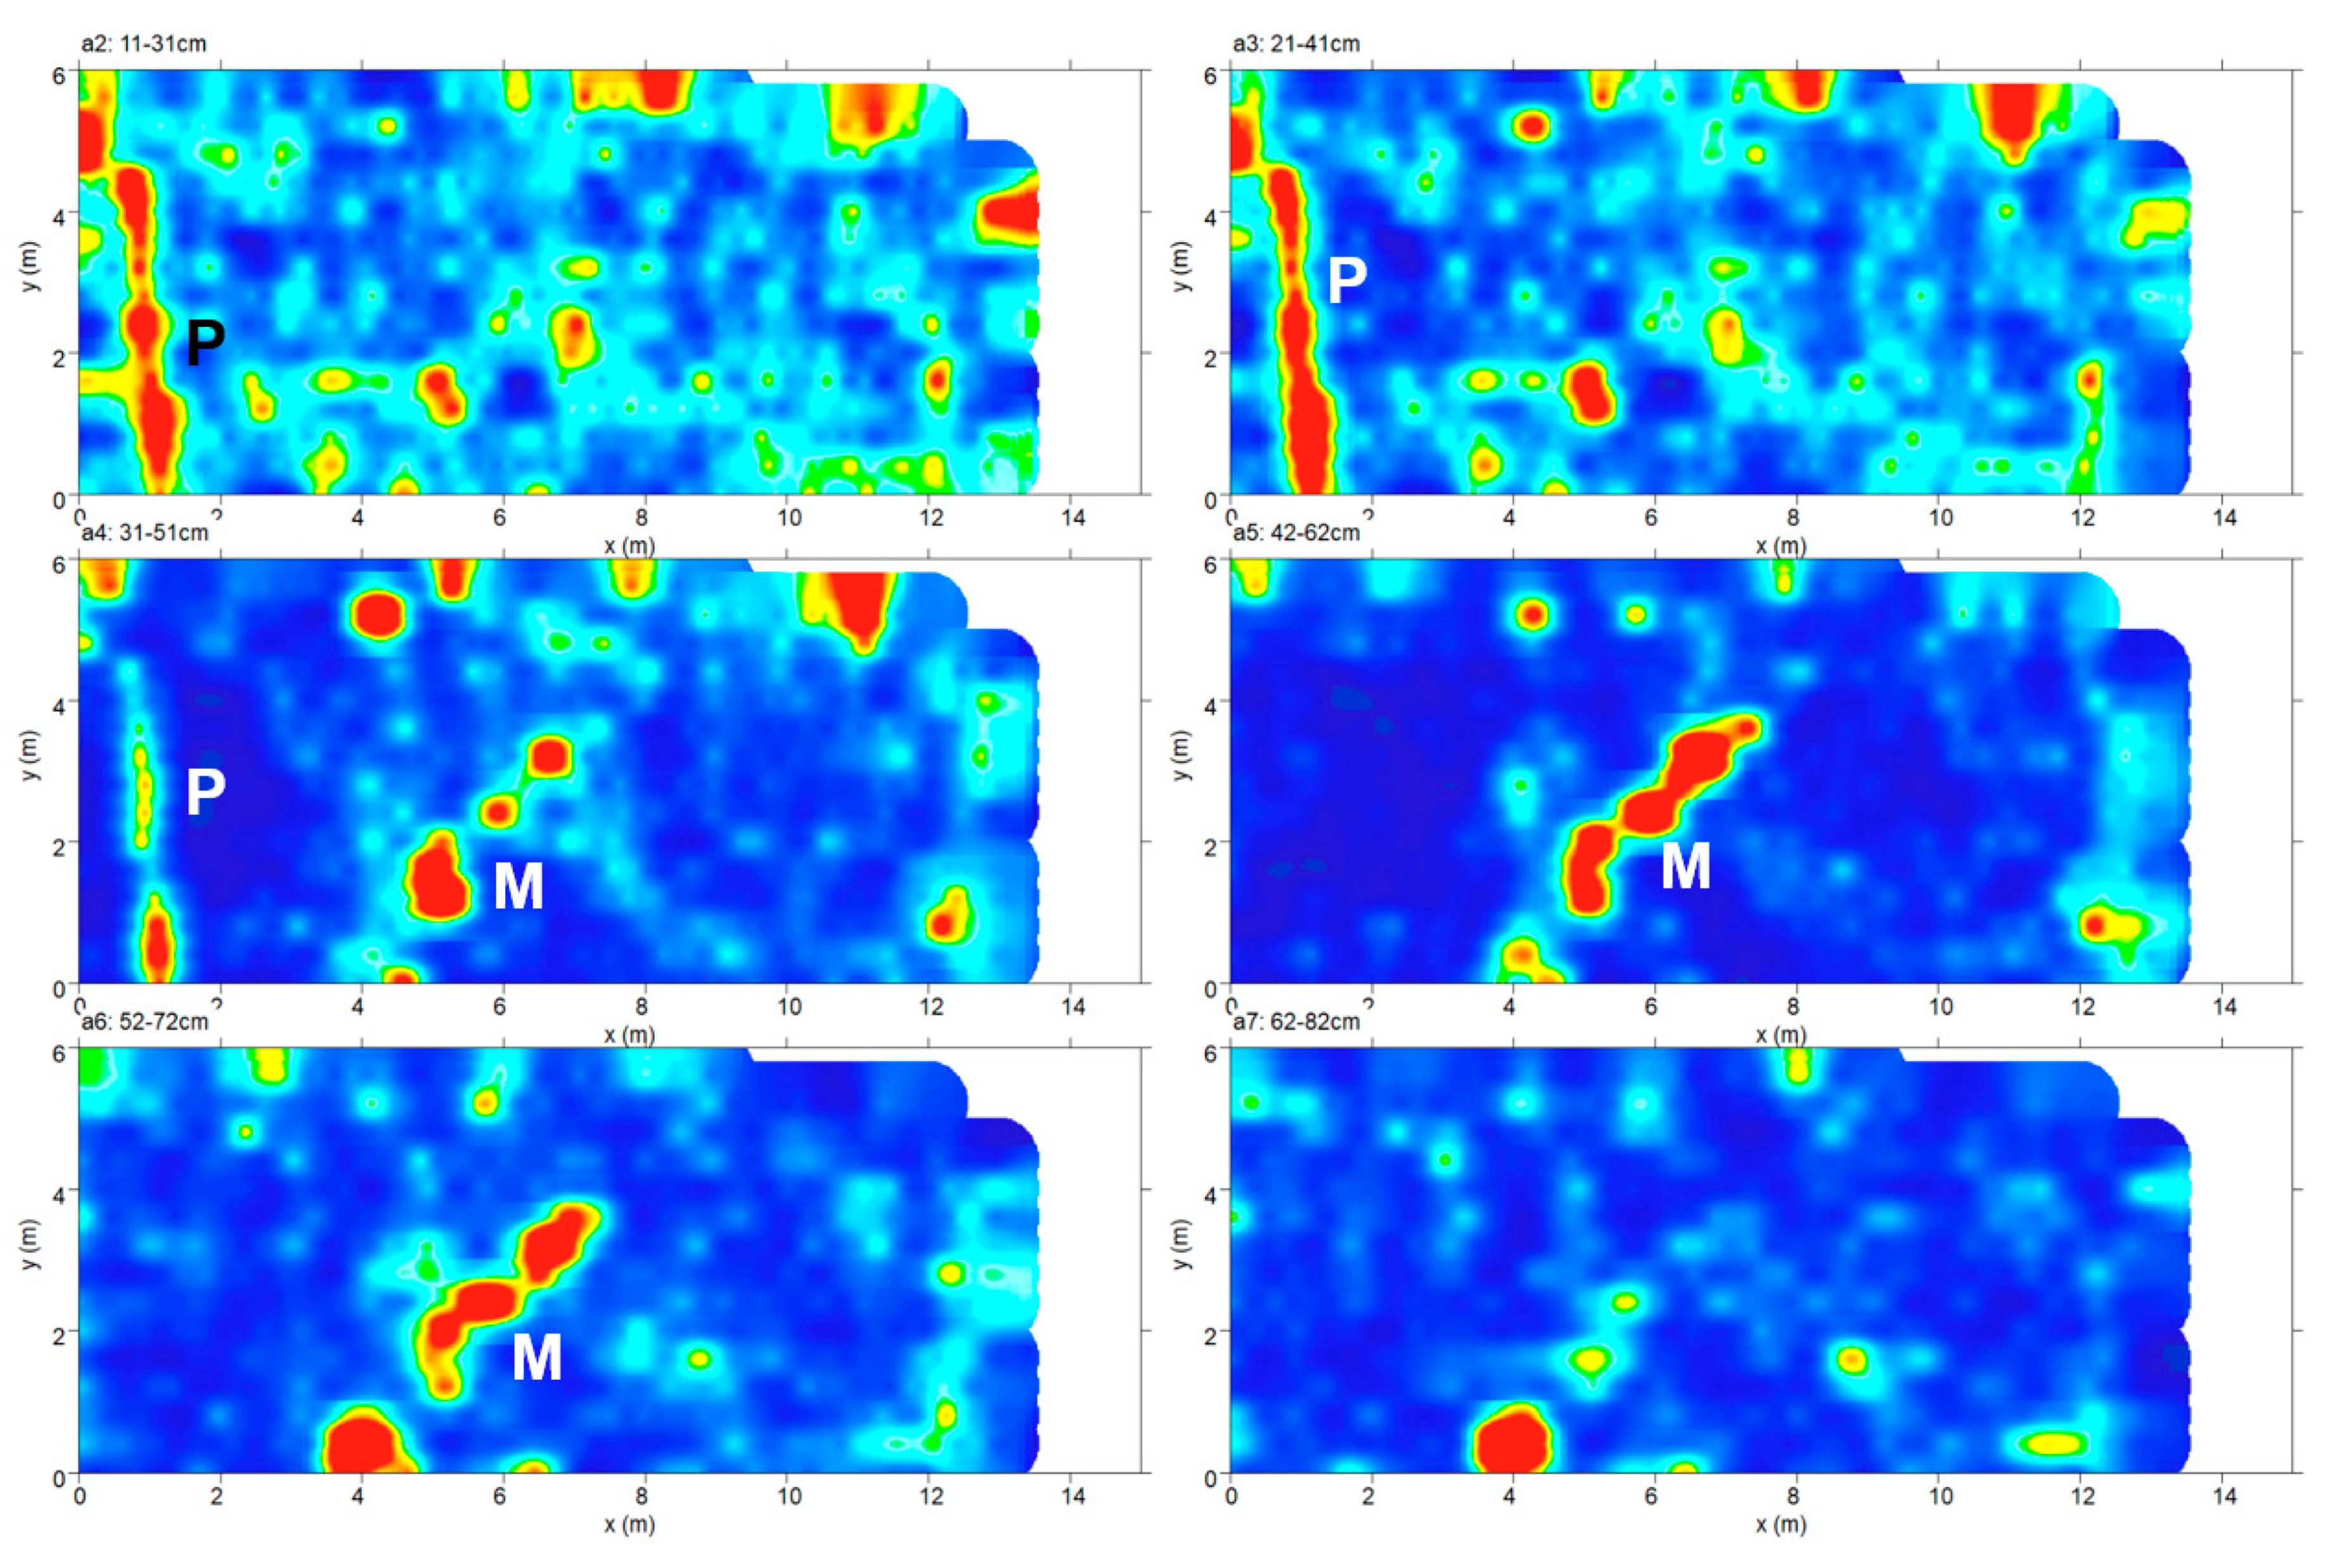
Some strong reflection events (labeled M) have been interpreted as due to walls, while other reflection events (labeled P) have been interpreted as due to pipes (Figure 5).
The processed GPR data were subsequently merged together into three-dimensional volumes and visualized in various ways in order to enhance the spatial correlations among the anomalies of interest. A way to obtain useful maps for understanding the plan distribution of reflection amplitudes within specific time intervals is the creation of horizontal time slices. These are maps on which the reflection amplitudes are projected at a specified time (or depth), averaged within a selected time interval [31]. In a graphic method developed by [45] termed ‘‘overlay analysis’’, the strongest and weakest reflectors within each slice are enhanced with specific colors. This technique allows the linkage of structures buried at different depths. This represents an improvement in imaging, because subtle features that are indistinguishable in the radargrams in this way can be more easily seen and interpreted. In the present work, the time-slice technique has been used to display the amplitude variations within consecutive time windows of width Δt = 5 ns. Strong reflection events (labeled P and M) are clearly visible (Figure 6).
A further approach for visualizing 3D images is the use of surface rendering, assembled from all the processed radargrams [18,20,27].
In Figure 7, the same GPR data set is displayed with isoamplitude surfaces using a threshold value of 70% for the maximum complex trace amplitude. Whilst lowering the threshold value increases the visibility of the main anomaly and smaller objects, it also increases the undesired effects due to the present heterogeneities. Relatively strong continuous reflection events are visible on the thresholded volumes (P and M). This visualization technique provides strong evidence for the anomaly related to the pipe (P) and wall (M).

4.1.2. Zone 1, Area B

Similar to Area A, Area B was also a rectangle sized 18 × 6 m. This area also showed a low penetration of the electromagnetic energy (about 25 ns). Most of the observed anomalies are confined within the first 20 ns, as in all the other profiles acquired in the area (Figure 8). In Figure 8a–c some strong reflection events (labeled M) have been interpreted as due to walls, while other reflection events (labeled A) have been interpreted as due to different structures of probable archaeological interest (maybe a road).
The reflection event shown in Figure 8b appears to be of particular interest. In fact, there is an evident polarity inversion of the reflected electromagnetic wave. This event (T) could be related to a strong contrast of electromagnetic characteristic due for example to a presence of a void room [20,21,28]. Therefore, this event was interpreted as due to the probable presence of a tomb.
The time-slice technique allowed visualizing the extension of the reflected events labeled A, M, and T, respectively, in Figure 9.
The isoamplitude 3D reconstruction achieved using a threshold value of 70% for the maximum complex trace amplitude is shown in Figure 10. A relatively strong continuous reflection event is visible on the thresholded volumes (see anomalies A, M, and T).

4.1.3. Zone 1, Area C

Area C was a rectangle sized 12 × 8 m and partially covered with a roof, as shown in Figure 4a. In this area, an increased penetration depth of the electromagnetic energy was registered (about 45 ns). The hyperbola analysis showed also an increasing of the electromagnetic wave propagation velocity from 0.08 m/ns (esteemed in the areas A and B) to 0.112 m/ns. In this area, a particular interest seems to have the reflection event shown in Figure 11a,b. A polarity inversion of the reflected electromagnetic wave is also evident in this area, which is in relationship with the event labeled A (Figure 11).
This event (A) was interpreted as due to a probable presence of large tomb (about 4 × 2.5 m2).
The time-slice technique allows visualizing the extension of the reflected event labeled as A in Figure 12. The isoamplitude 3D perspective reconstruction using a threshold value 70% for the maximum complex trace amplitude that is shown in Figure 13 puts into evidence the dimension of the event labeled A.
In order to properly understand the nature of the anomaly labeled “A” in the GPR results, ERT measurements were also performed in area C. Figure 14 shows ERT slices from 0.5 to 3.0 m in depth.
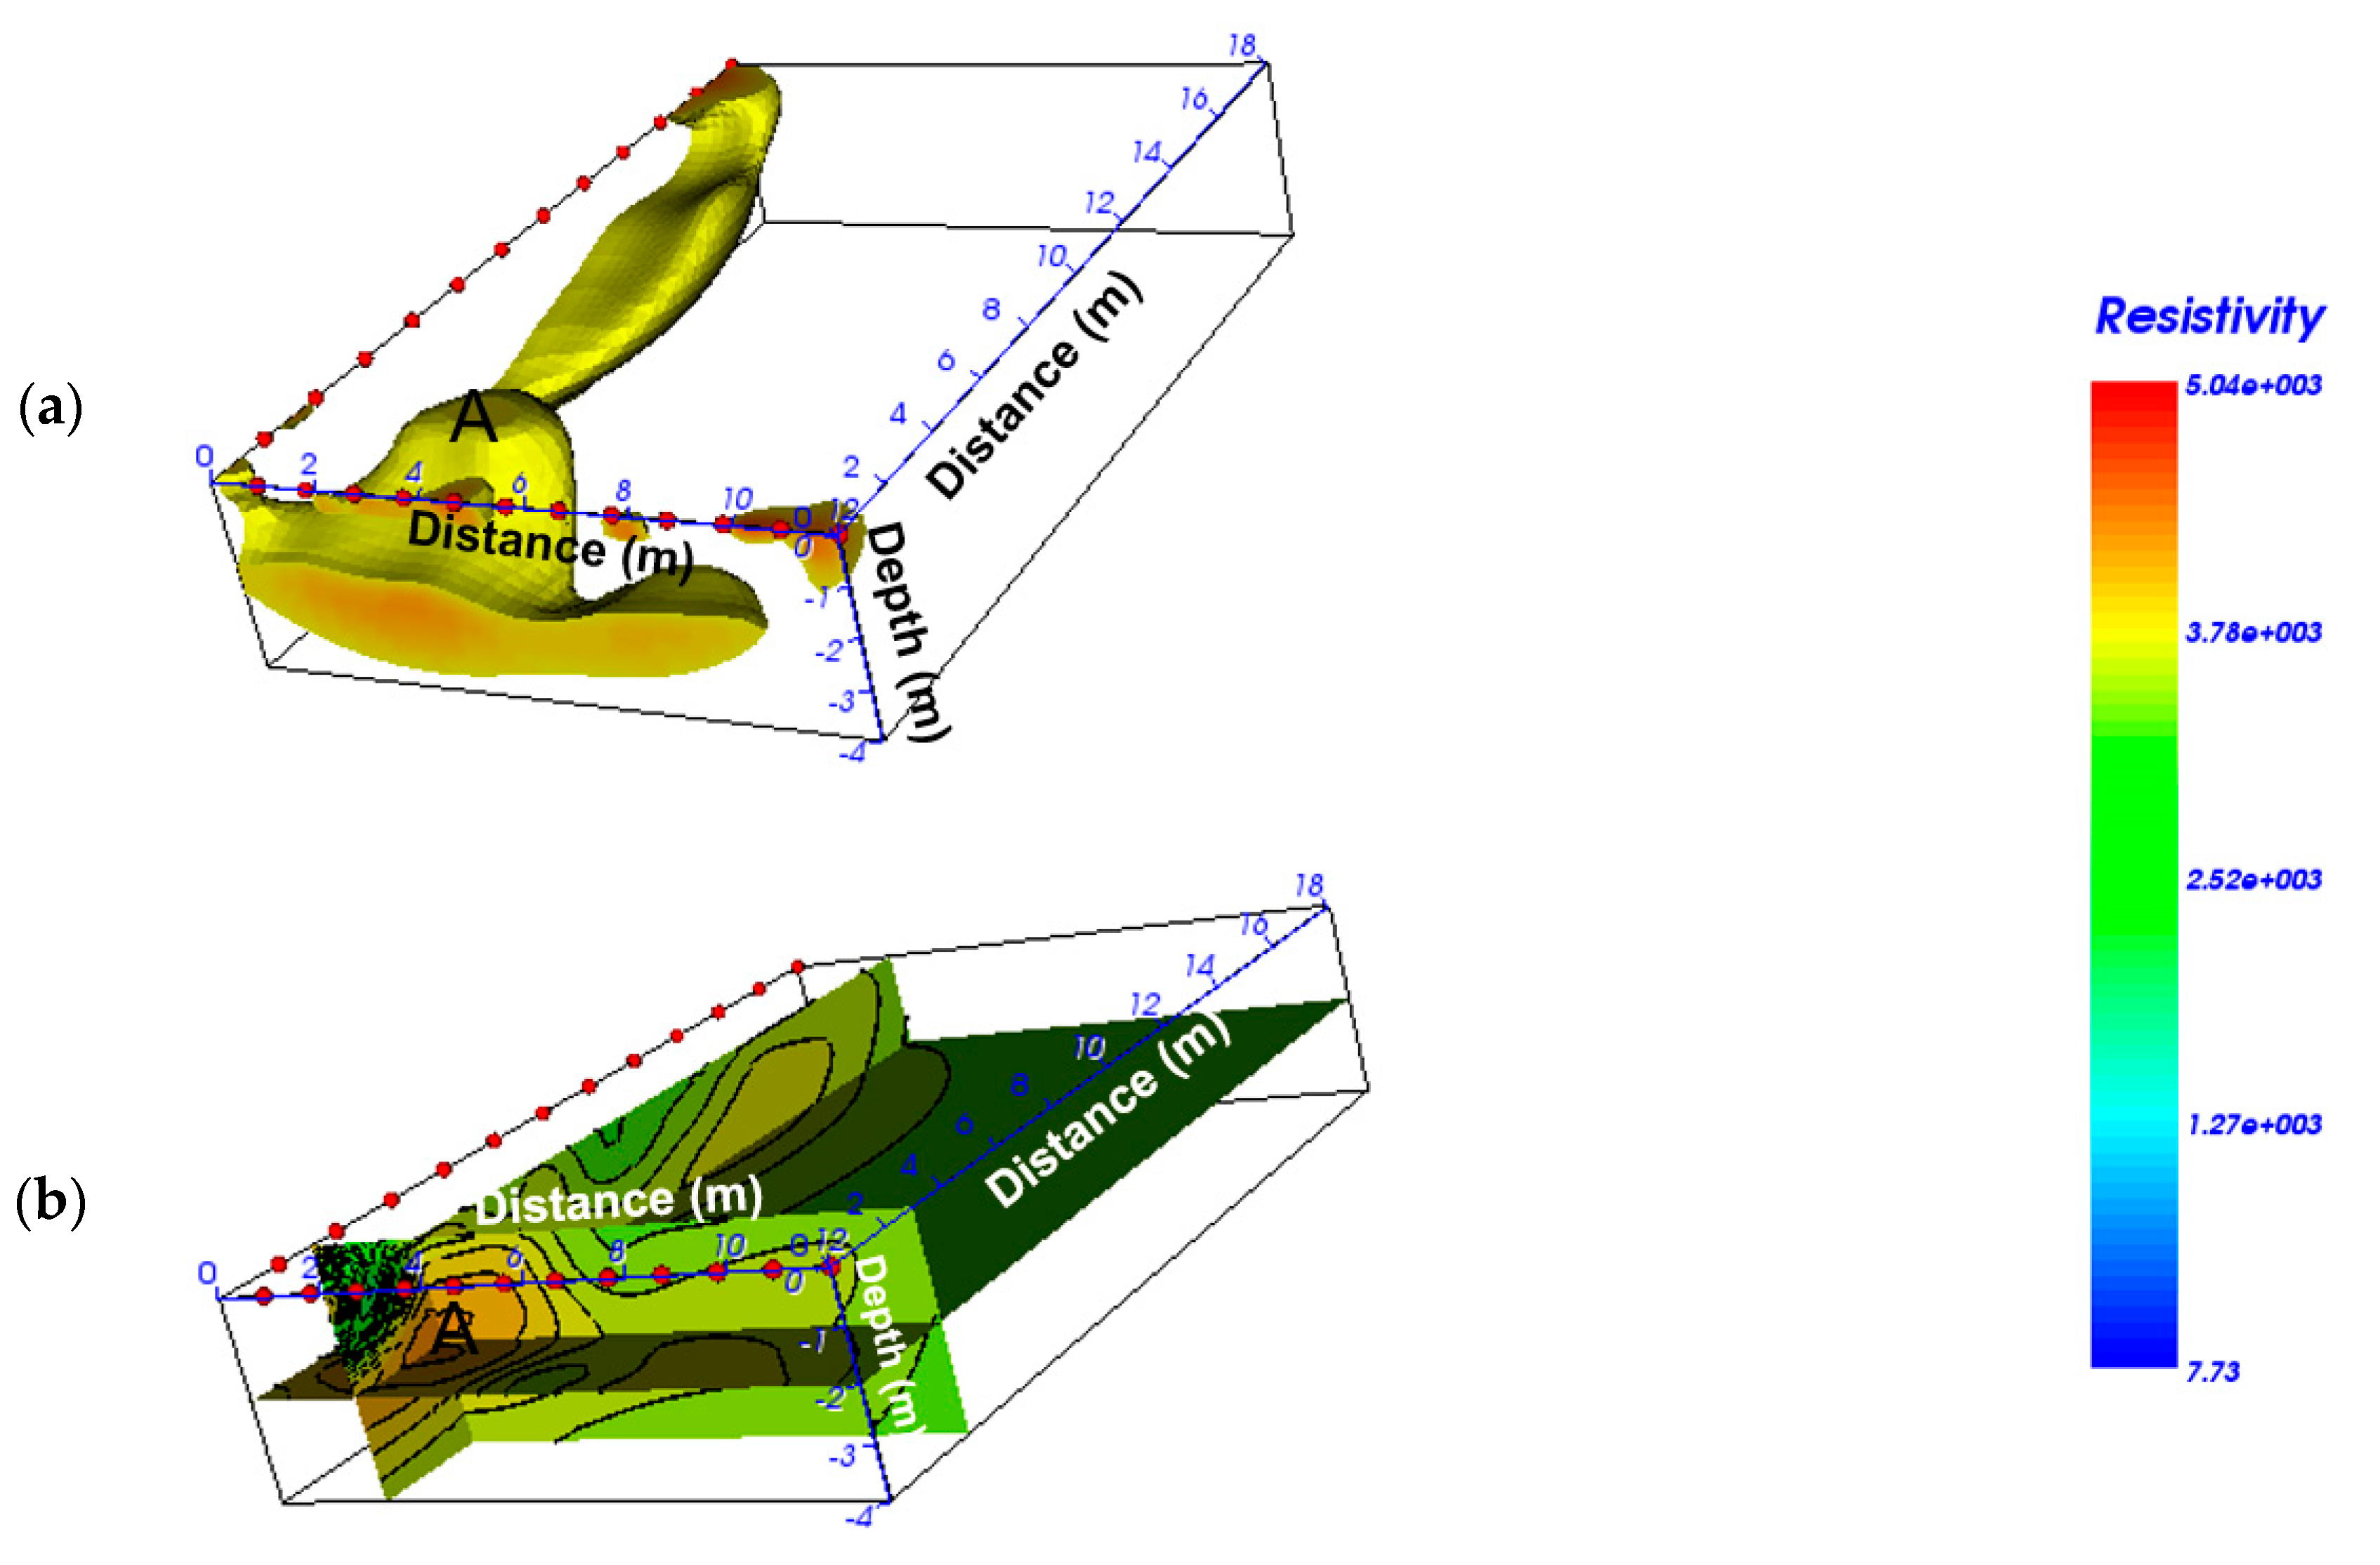
It is possible to note the presence of a heterogeneous subsurface with resistivity values ranging from 2000 to 4000 Ω m−1. Then, it is also possible to note the presence of the area indicated with ‘‘A’’, with resistivity values between 3500–4000 Ω m−1; these values indicate the probable presence of a void.
Figure 15 shows the 3D contouring of isoresistivity surfaces. In this representation, the transparency function is defined by two threshold values for the resistivity ρ1 and ρ2 (ρ1 < ρ2). In the intervals ρ < ρ1 and ρ > ρ2, the data is made transparent; therefore, only the data in the interval ρ1 < ρ < ρ2 are visualized. The threshold calibration is a very delicate task. In fact, by lowering the threshold value, not only is the visibility of the main anomaly raised, but that of the smaller objects and noise also increases. In Figure 15, the resistivity data set is displayed with isoresistivity surfaces using a threshold value ranging from 3000 to 4000 Ω m. In Figure 15b, the resistivity data set is displayed using the horizontal and vertical slices. The lowest resistivity anomalies were removed, and therefore, the cavity (A) spaces are well visible.

4.1.4. Zone 1, Area D

Area D was a rectangle sized about 10 × 30 m. In this area, a good penetration depth of the GPR signal was registered (about 45 ns). The hyperbola analysis drove an evaluation of the propagation velocity of the electromagnetic wave propagation velocity equal to 0.094 m/ns. In this area, several reflection events are visible in a two-way time window between 0–40 ns (see Figure 16).
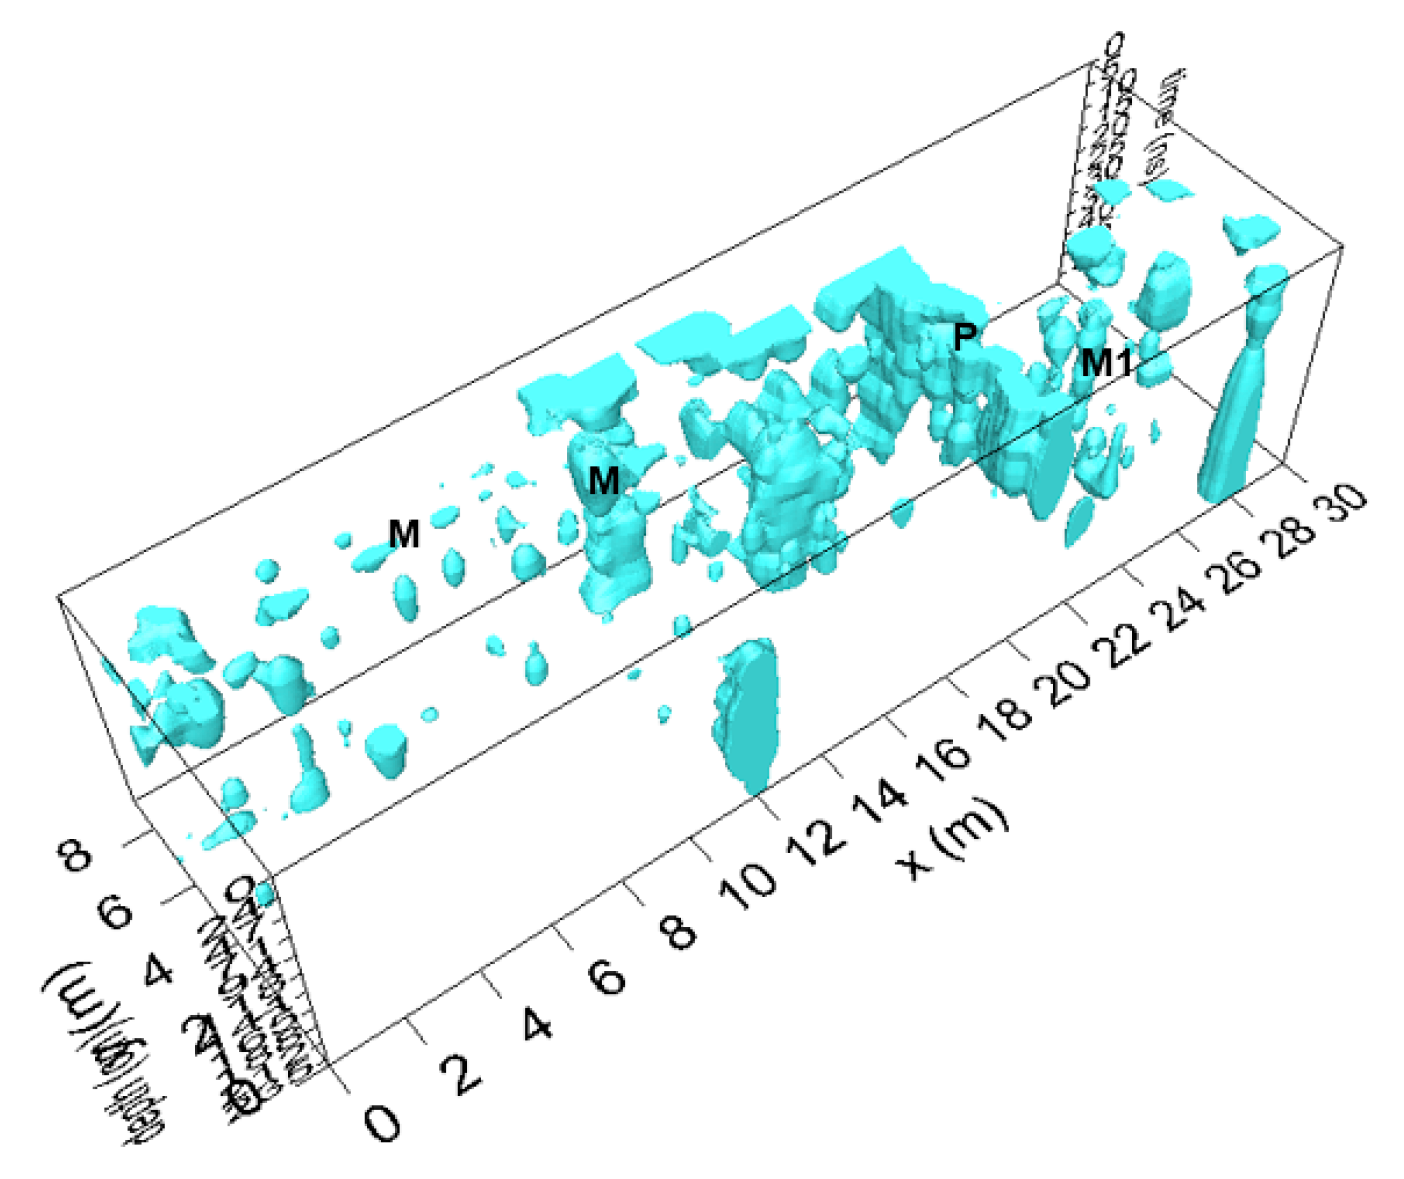
It is evident that a classical metal reflection labeled “P” related to a pipe. The reflection events (M) were interpreted as due to the probable presence of walls. In particular, the reflection event M1 seem to be due to pebbles put together to form a wall. The time-slice technique allows visualizing the extension of the reflected events labeled P, M, and M1 (Figure 17).
The isoamplitude surfaces using the threshold value of 67% for the maximum complex trace amplitude shown in Figure 18 puts into evidence the dimensions of the events labeled P, M, and M1.

4.1.5. Zone 1, Area E

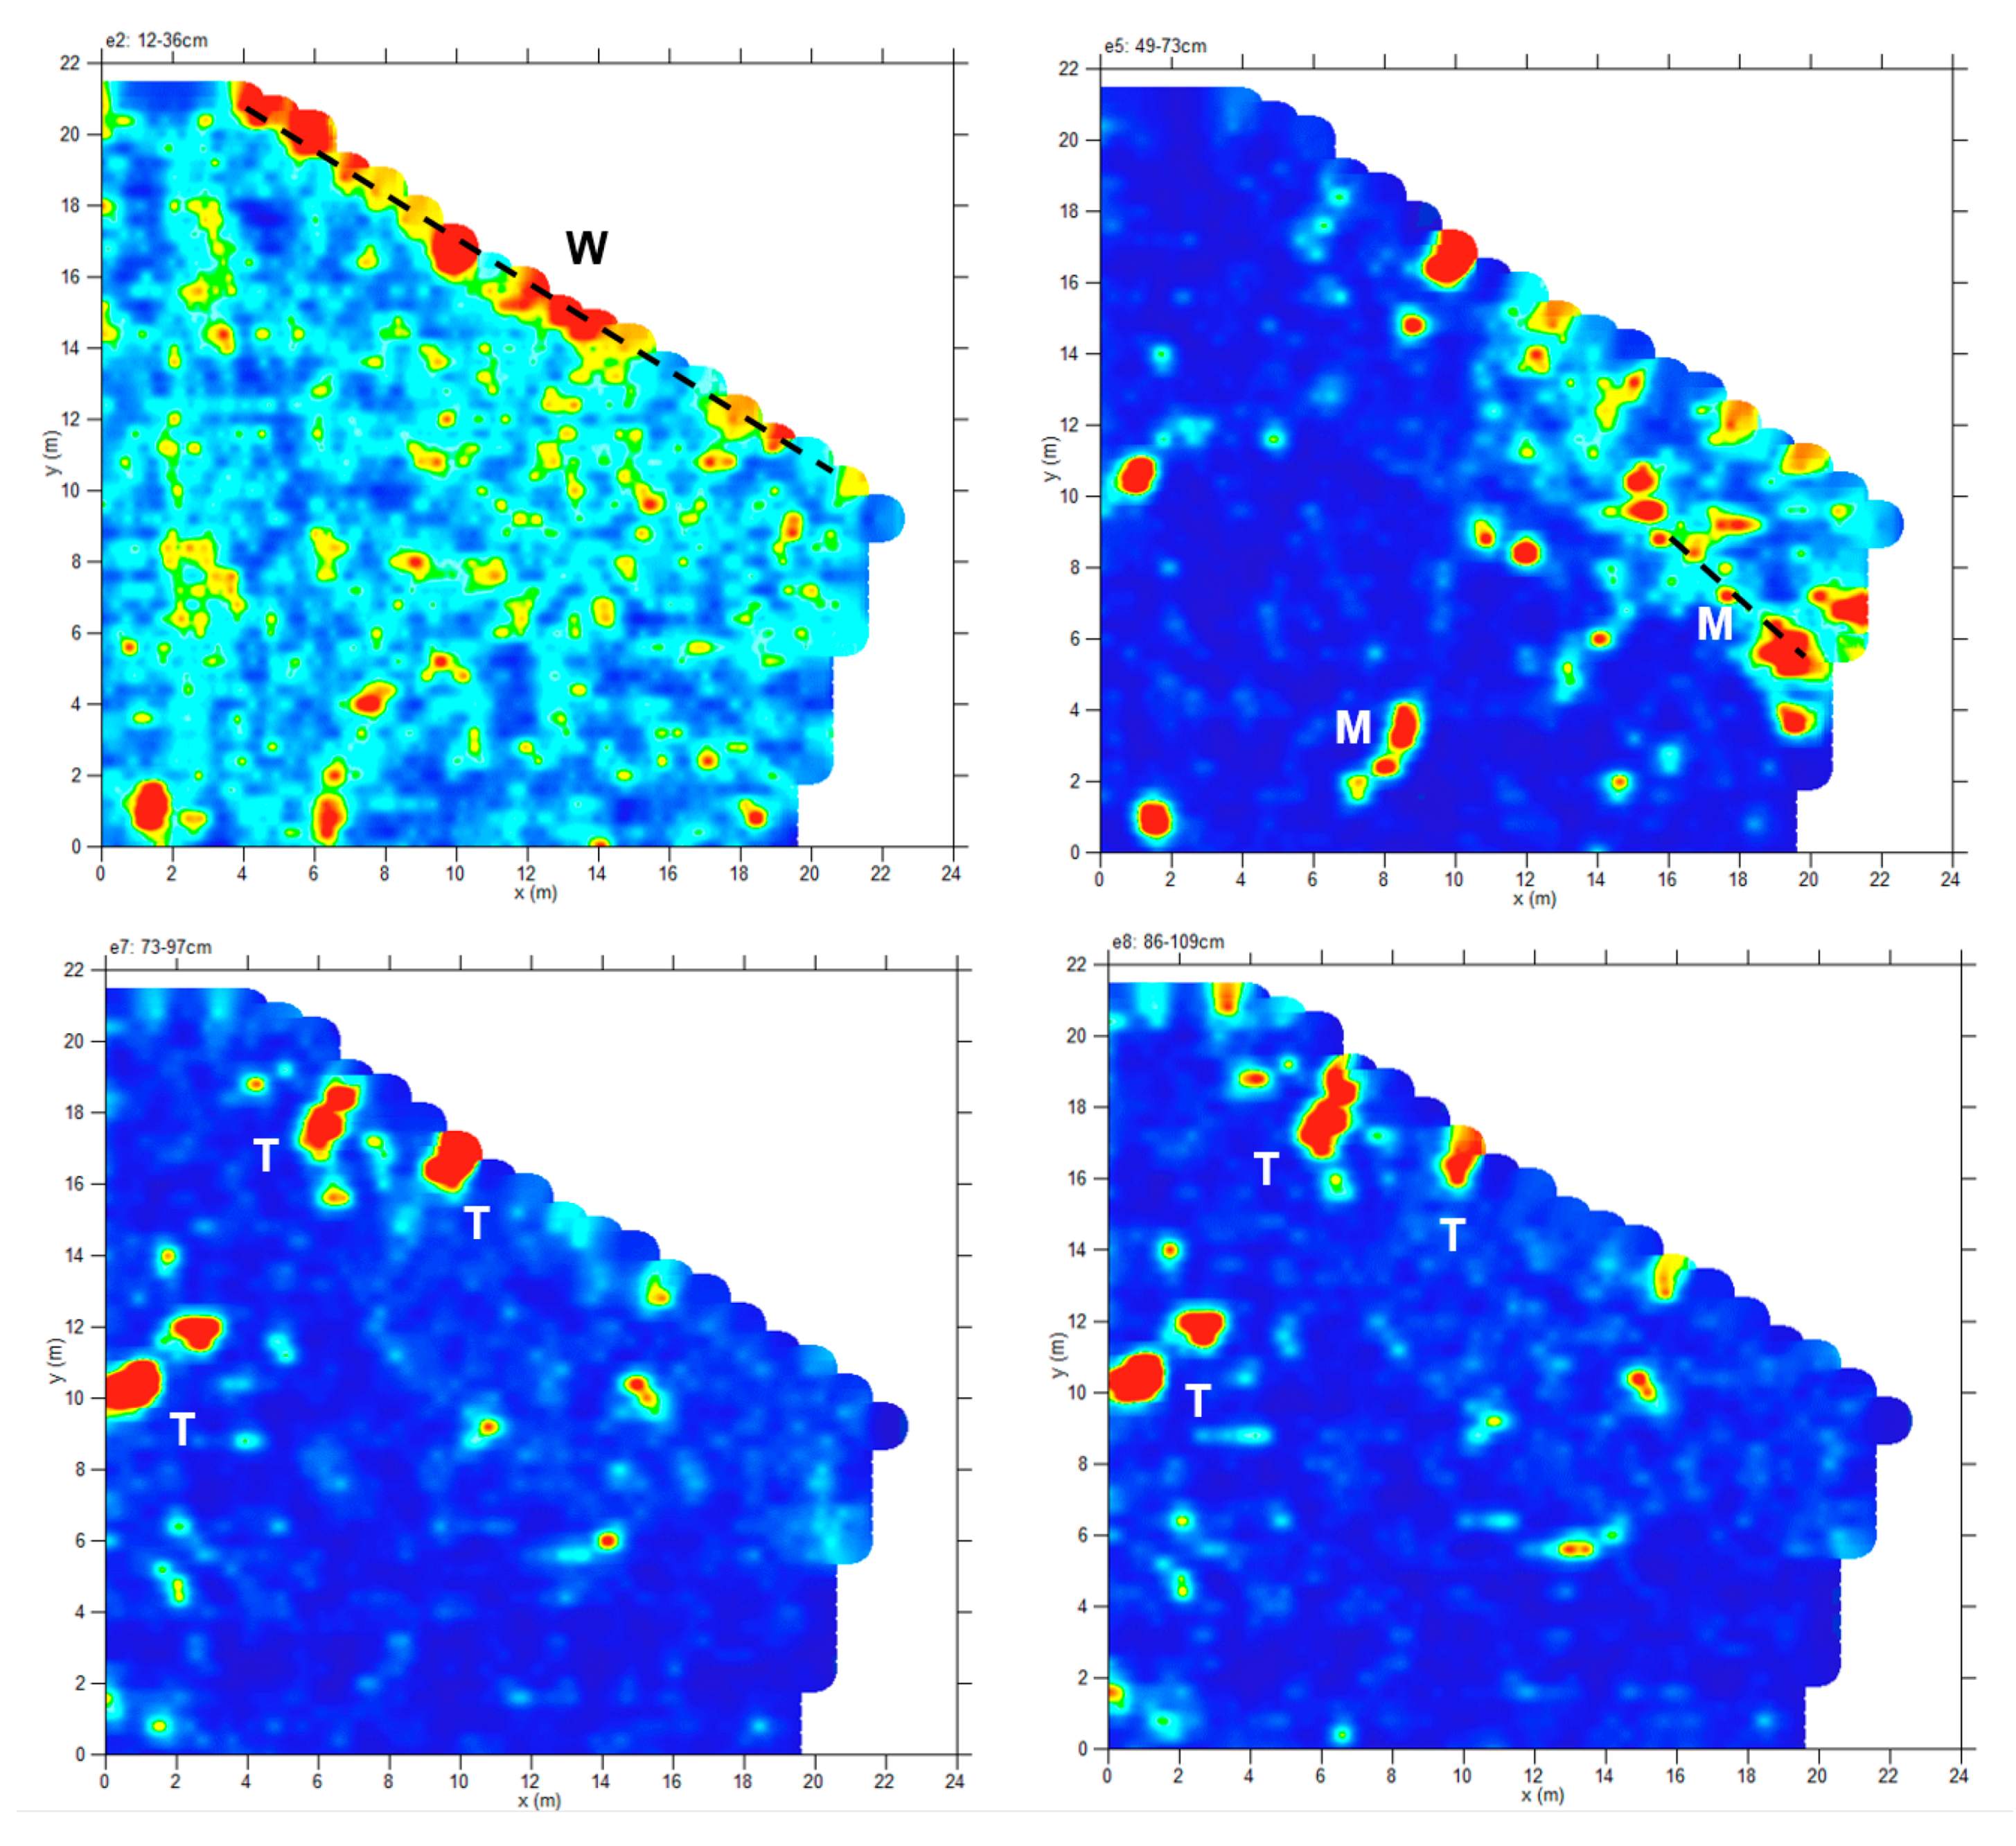
Area E was sized about 20 × 22 m. The hyperbola analysis showed an electromagnetic wave propagation velocity of 0.094 m/ns. In this area, several reflection events are visible (Figure 19a,b). It is evident that a “cave-like” reflection labeled “T” related to a possible tomb. The reflection events (M) were interpreted as due to a probable presence of walls. The time-slice technique allows visualizing the extension of the reflected events labeled T and M (Figure 20). The reflection event “W” was interpreted as wall foundations.
The isoamplitude surface 3D reconstruction using the threshold value of 65% for the maximum complex trace amplitude shown in Figure 21 puts into evidence the dimensions of the events labeled W, M, and T.

4.2. Zone 2

Zone 2 was a square sized 40 × 40 m and was divided in four square areas, each of which were sized 20 × 20 m, and were respectively labeled F, G, H, and I (Figure 4). Ground-penetrating radar (GPR) and magnetometric geophysical measurements in gradiometry configuration were used. In Zone 2, the gradiometry magnetic method was used almost everywhere, while the GPR method was used only in area F.

4.2.1. Zone 2: Magnetic Data Analysis

Figure 22 shows the magnetic results that overlapped the map of zone 2. The results show weak anomalies (dashed yellow line) related to the presence of buried structures, which are probably ascribable to walls.

4.2.2. Zone 2: Area F, GPR Data Analysis

As said, area F was sized 20 × 20 m2. A Ris Hi-mod georadar system with a dual band 600 MHz-200 MHz antennas was used. The GPR data were acquired with a transect of 0.5 m between any two adjacent measurement lines, and the data were processed by making use of the GPRSlice code. In particular, here, we focus on the results obtained with the 600-MHz antenna. With reference to Figure 23, the analysis of the GPR data pointed out the presence of several anomalies (“M”) that represent walls; Anomaly C, instead, indicates the probable presence of a tomb.
Slices analysis (Figure 24) show the distribution of anomalies “M” and “C”.
The 3D isosurfaces amplitude representation, with a threshold of 70% (Figure 25a,b), show the 3D distribution of the “M” and “C” anomalies.
It might have to be noted at this point that the threshold for the isosurface representation was not the same throughout the paper. Indeed, an optimal value cannot be established a priori in general, and the choice is necessarily case-dependent. It is a good role of thumb to check that the main anomalies visible in the isosurface representation are robust with respect to the choice of the threshold [46]. We have done it, even if for sake of brevity we have avoided presenting all of the synopses here.

5. Archaeological Excavations

5.1. Archaeological Excavations in Zone 1

In July 2012, two archaeological excavations were made in the Natali estate, within zone 1 (Figure 1 and Figure 2): the first one was in Area B, and the second one was in Area E. Since this is a private property, these excavations were conducted in the areas of the field not cultivated or built up: in area C, instead, the presence of a base of cement made by the owner did not allow digging and verifying the results of the geophysical survey.

5.1.1. Excavation in Area B

The 5 × 3 m archaeological excavation in this area (Figure 26) has revealed the presence, in its eastern part, of the foundation of a wall made up of roughly squared sandstone blocks of considerable size, oriented NE–SW. The blocks have evident mole plough traces on their upper face. The type of stone and the workmanship [47], as well as the retrieved archaeological materials, allow us dating it to the Hellenistic period, in the second half of the 4th century BC.
Immediately to the west of this structure, there is a thick pavement of compacted limestone dust that overlaps a previous cobblestone. The materials found in the layer between the two floors enable us to date the cobblestone to the Iron Age and relate it to the presence of a hut. To the east of the wall, instead, a layer of a reddish brown soil is present with materials dating back to the Iron Age (preliminary data about the Iron age pottery and structures are in [38].
Almost behind the wall, the Hellenistic floor has been cut by a semi-circular hole due to a tree, which was removed by the owner a few years before the excavation.
Collecting these data, it is possible to affirm that the excavation has enabled highlighting a room of a Hellenistic house (second half of the 4th–3rd century BC), below which there was another dwelling, dating back to the Iron Age (8th-half of the 6th century BC).

5.1.2. Excavation in Area E

A surface of 7.50 × 4 m was excavated in this area (Figure 27a,b). Below the top layer of agricultural soil, which was on average 40–45 cm deep, the western edge of a road, made of small stones compacted with limestone dust, emerged in the eastern part of the excavation.
To the west of the road edge, a ramp-sidewalk about 2.5 m wide in well-purified white compacted limestone dust that links the road with a long wall structure has been brought to light. It was probably part of a dwelling, and in particular, the eastern portion of two rooms.
Between the edge of the road and the edge of the ramp, there is a water channel that is approximately 25 cm wide for draining rainwater. Even in the ramp itself, there is a long transverse cut, which was probably linked to another channel for the drainage of water from the building toward the road.
The two rooms of the probable dwelling have been excavated only in their northern edge. The type of stone of the blocks and the construction technique allow us to date the structure to the Hellenistic period. Under a thin slab of limestone dust floor, in a poor state of preservation, a level with material dating back from the Iron Age to the archaic period was found. A layer of natural soil or the non-regular bedrock lies under it, depending on the points.
The wall structures discovered during the excavation of areas B and E and the possible wall identified by the geophysical investigations in area A (Figure 5 and Figure 7) are perpendicular and parallel to each other. It suggests that they can belong to a large residential dwelling, which was most probably similar to those found in the Cunella [33,39,41,47,48,49] and Palombara [38] districts, with the front of the building aligned along the road that led toward the north gate of the surrounding walls.

5.2. Archaeological Excavation in Zone 2

During the excavation periods of July and September 2016 in the Palombara district (zone 2), a surface of 3 × 5 m was excavated in area F to verify an anomaly discovered during the geophysical analyses and interpreted as a possible burial. The excavation was carried out in parallel with the excavation of the so-called inner city walls, which allowed highlighting the important remains of a late-Archaic and Classical age residential building aligned to a road five meters wide [36,38,50].
The removal of the top soil layer (Figure 28a,b), which was only a few centimeters deep, highlighted the bedrock, which was not revealed only in the area where the anomaly had been identified with the geophysical survey.
A deep investigation at that point made it possible to verify that, beneath the top soil, there was an area of a whitish natural clay. Its excavation in depth showed the total absence of anthropic elements, and therefore the excavation was stopped at a depth of 2.6 m below the bedrock level.

6. Discussion and Conclusions

The research approach described and explained in this paper demonstrate how traditional archaeological studies can be enhanced through the application of multidisciplinary investigations.
The combination of GPR, ERT, and magnetic data allow a comprehensive interpretation of the subsurface structures present in the investigated site. The GPR was efficient within the upper 2 m to identify the different near-surface structures. In cases where the bedrock is at shallow depth, it is possible to distinguish it from unconsolidated materials on the GPR profiles.
The GPR investigations are based on the emission of electromagnetic waves, which propagate inside the ground and are scattered in all directions, including that coming back from the GPR when they meet changes in the dielectric properties of the materials constituting the subsoil. Generally, in archaeological applications, GPR methodology performs quite satisfyingly when highly resistive materials occur [20]. In fine-grained soils such as the investigated site, the presence of conductive materials is one of the most important factors determining GPR results. In fact, these materials impose a strong reduction of EM wave penetration inside the medium.
The ERT was suitable to achieve information about deeper buried structures. ERT is a geophysical technique for searching and imaging subsurface structures based on electrical resistivity measurements made at the surface using sets of metal electrodes.
The electrical properties of the subsurface vary with the ground material, the presence and saturation level of fluids, and the presence of buried objects. Electrical techniques retrieve the distribution of these properties as a function of depth and the horizontal distance [20]. Also for ERT, the presence of conductive materials is one of the most important factors determining the results. In fact, the conductive materials favor the passage of electric current and allow obtaining more detailed information about the buried structures.
The magnetic method in a gradiometer configuration offers a high degree of immunity from diurnal and minor magnetic storm activity in the ambient magnetic field; they can enhance near-surface, small, or weakly magnetic anomalies. They can also provide improvements in spatial resolution over the total field measurement alone [19]. It allows locating small, near surface anomalies, and is therefore very useful in archeological mapping. It can be used in order to investigate wide areas when the expected results are the buried tombs (especially if they contain metal materials as e.g., swords, shell helmets, or also terra cotta materials or kilns).
For all of the GPR data collected in this study, those made with the 600-MHz antenna offered the best resolution, although attenuation caused lower penetration. On these profiles, it was possible to clearly identify the buried infrastructures in the area. In particular, in zone 1, a series of structures were evidenced in the first meter of depth. Deeper attention was given to the anomaly indicated with “A” in zone 1, area C. The electromagnetic wave reflected event, due to its shape and size, was interpreted as a cut in the rocky basement linked to the probable presence of a chamber tomb. However, it could be a simple cut in the rock. These difficulties in interpreting the GPR data have led to performing a geoelectrical survey in the same area. Therefore, the ERT results were introduced as a complement of GPR results. An area of high resistivity (>4500 Ω.m) was found to correspond to the anomaly labeled “A” in the GPR results. The resistivity survey was useful to determine the nature of the anomaly and confirmed the probable presence of the chamber tomb.
In zone 2, a magnetic survey was conducted in a gradiometric configuration. The magnetic gradiometry survey results were relatively good, evidencing some buried alignments. Some problems in the data interpretation were related to the depth of the buried structures. Only GPR data could definitively determine the depth of buried structures below ground level.
Finally, an upgrading and increment of the knowledge of the Messapian settlement of Muro Leccese has been obtained by the acquisition of new archaeological and geophysical data, which have been integrated in a new digital archaeological map (Figure 29 and Figure 30). The research and the following excavations have documented the extension of the inhabited area, have attested the presence of a new residential building, and have increased the knowledge of the road map of the town. With regard to the necropoleis, the contribution of geophysical data has been very important, as it showed the possible presence of grave tombs, which will be investigated in the next few years.
All this work has been conducted in the framework of a proficuous interdisciplinary interaction between geophysical and archaeological competences, conducted before the prospecting, because the archaeologists have the sensibility about the questions that need to be addressed in the archaeological site, after which the geophysicists conducted the prospecting together with the archaeologists. Afterwards, the interpretations were discussed together, and the archaeological excavation performed and that still scheduled for the future have been planned to account for the results of the geophysical prospecting.

Author Contributions

C.B. conceived the results related to the archaeological excavation in zone 2. F.M. conceived the site description and the results related to the archaeological excavation in zone 1. M.T.G. conceived the archaeological interpretation. L.D.G. acquired, processed, and interpreted the magnetic gradiometric data. G.L. and R.P. acquired, processed, and interpreted the GPR data. G.L. edited the manuscript.

Funding

This research received no external funding

Conflicts of Interest

The authors declare no conflict of interest

References

  1. De Giorgi, L.; Leucci, G. Study of Shallow Low-Enthalpy Geothermal Resources Using Integrated Geophysical Methods. Acta Geophys. 2015, 63, 125–153. [Google Scholar] [CrossRef] [Green Version]
  2. Leucci, G.; De Giorgi, L. Microgravimetric and ground penetrating radar geophysical methods to map the shallow karstic cavities network in a coastal area (Marina di Capilungo, Lecce—Italy). Explor. Geophys. 2010, 41, 178–188. [Google Scholar] [CrossRef]
  3. Leucci, G. Ground Penetrating Radar a Useful Tool for Shallow Subsurface Stratigraphy Characterization; Intech: Rijeka, Croatia, 2012; ISBN 979-953-307-339-1. [Google Scholar]
  4. Furman, A.; Ferré, T.P.A.; Warrick, A.W. Optimization of ERT surveys for monitoring transient hydrological events using perturbation sensitivity and genetic algorithms. Vadose Zone J. 2004, 3, 1230–1239. [Google Scholar] [CrossRef]
  5. Leucci, G.; De Giorgi, L.; Gizzi, F.T.; Persico, R. Integrated geo-scientific surveys in the historical centre of Mesagne (Brindisi, Southern Italy). Nat. Hazards 2017, 86, 363–383. [Google Scholar] [CrossRef]
  6. Slater, L.; Binley, A.; Reeve, A. Solute transport processes in peat inferred from electrical imaging. In Proceedings of the Symposium on the Application of Geophysics to Environmental & Engineering Problems (SAGEEP 2003), San Antonio, TX, USA, 6–10 April 2003; pp. 676–686. [Google Scholar]
  7. Slater, L.; Glaser, D.; Utne, J.I.; Binley, A. Electrical imaging of permeable reactive barrier integrity. In Proceedings of the Symposium on the Application of Geophysics to Environmental & Engineering Problems (SAGEEP), Las Vegas, NE, USA, 10–14 February 2002. 10p. [Google Scholar]
  8. Dahlin, T.; Bernstone, C.; Loke, M.H. A 3-D resistivity investigation of a contaminated site at Lernacken, Sweden. Geophysics 2002, 67, 1692–1700. [Google Scholar] [CrossRef]
  9. Nowroozi, A.A.; Horrocks, S.B.; Henderson, B. Saltwater intrusion into the freshwater aquifer in the eastern shore of Virginia: A reconnaissance electrical resistivity survey. J. Appl. Geophys. 1999, 42, 1–22. [Google Scholar] [CrossRef]
  10. Van Schoor, A. Detection of sinkholes using 2D electrical resistivity imaging. J. Appl. Geophys. 2002, 50, 393–399. [Google Scholar] [CrossRef] [Green Version]
  11. Brunner, I.; Friedel, S.; Jacobs, F.; Danckwardt, E. Investigation of a Tertiary maar structure using three-dimensional resistivity imaging. Geophys. J. Int. 1999, 136, 771–780. [Google Scholar] [CrossRef] [Green Version]
  12. Giannino, F.; Leucci, G.; Teramo, A.; De Domenico, D. Geophysical Surveys to Improve the Knowledge on the S. Salvatore Fortress Structure (Messina, Italy); Atti del 24° Convegno Nazionale del GNGTS: Rome, Italy, 2005. [Google Scholar]
  13. Godio, A.; Strobbia, C.; De Bacco, G. Geophysical characterisation of a rockslide in an alpine region. Eng. Geol. 2006, 83, 273–286. [Google Scholar] [CrossRef]
  14. Leucci, G. The use of GPR to estimate volumetric water content and reinforced bar diameter in Concrete Structures. J. Adv. Concr. Technol. 2012, 10, 411–422. [Google Scholar] [CrossRef]
  15. Argote-Espino, D.; Tejero-Andrade, A.; Cifuentes-Nava, G.; Iriarte, L.; Farıas, S.; Chavez, R.E.; Lopez, F. 3D electrical prospection in the archaeological site El Pahnu, Hidalgo State, Central Mexico. J. Archaeol. Sci. 2013, 40, 1213–1223. [Google Scholar] [CrossRef]
  16. Aspinall, A.; Gaffney, C.F. The Schlumberger array-potential and pitfalls in archaeological prospection. Archaeol. Prospect. 2001, 8, 199–209. [Google Scholar] [CrossRef]
  17. Aspinall, A.; Gaffney, C.; Schmidt, A. Magnetometry for Archaeologists; Altamira Press: New York, NY, USA, 2009; p. 208. [Google Scholar]
  18. Goodman, D.; Piro, S. GPR Remote Sensing in Archaeology; Geotechnologies and the Environment Series; Springer-Verlag: Berlin, Germany, 2013; Volume 9, p. 233. [Google Scholar]
  19. Leucci, G. Geofisica Applicata All’archeologia e ai Beni Monumentali; Dario Faccovio Editore: Palermo, Italy, 2015; p. 368. [Google Scholar]
  20. Leucci, G. Nondestructive Testing for Archaeology and Cultural Heritage: A Practical Guide and New Perspective; Springer Nature Switzerland: Basel, Switzerland, 2019; p. 217. ISBN 978-3-030-01898-6. [Google Scholar]
  21. Leucci, G.; Parise, M.; Sammarco, M.; Scardozzi, G. The use of Geophysical prospections to map ancient hydraulic works: The Triglio underground aqueduct (Apulia, southern Italy). Archaeol. Prospect. 2016, 23, 195–211. [Google Scholar] [CrossRef]
  22. De Domenico, D.; Giannino, F.; Leucci, G.; Bottari, C. Integrated geophysical surveys at the archaeological site of Tindari (Sicily, Italy). J. Archaeol. Sci. 2006, 33, 961–970. [Google Scholar] [CrossRef]
  23. Gabellone, F.; Leucci, G.; Masini, N.; Persico, R.; Quarta, G.; Grasso, F. Nondestructive Prospecting and virtual reconstruction of the chapel of the Holy Spirit in Lecce, Italy. Near Surf. Geophys. 2013, 11, 231–238. [Google Scholar]
  24. Osella, A.; de la Vega, M.; Lascano, E. 3D electrical imaging of an archaeological site using electrical and electromagnetic methods. Geophysics 2005, 4, 101–107. [Google Scholar] [CrossRef]
  25. Persico, R.; Ciminale, M.; Matera, L. A new reconfigurable stepped frequency GPR system, possibilities and issues; applications to two different Cultural Heritage Resources. Near Surf. Geophys. 2014, 12, 793–801. [Google Scholar] [CrossRef]
  26. Conyers, L.B.; Goodman, D. Ground-Penetrating Radar—An Introduction for Archaeologists; AltaMira Press: New York, NY, USA, 1997; p. 232. [Google Scholar]
  27. Conyers, L.B. Ground-Penetrating Radar for Archaeology; Altamira Press: Walnut Creek, CA, USA, 2004; p. 224. [Google Scholar]
  28. Conyers, L.B. Ground-Penetrating Radar for Archaeology, 3rd ed.; Alta Mira Press: Walnut Creek, CA, USA, 2013; p. 258. [Google Scholar]
  29. Persico, R. An Introduction to Ground Penetrating Radar: Inverse Scattering and Data Processing; Wiley: Hoboken, NJ, USA, 2014; p. 368. [Google Scholar]
  30. Tejero-Andrade, A.; Cifuentes, G.; Chavez, R.E.; Lopez Gonzalez, A.; Delgado-Solorzano, C. “L” and ‘‘Corner’’ arrays for 3D electrical resistivity tomography: An alternative for urban zones. Near Surf. Geophys. 2015, 13, 1–13. [Google Scholar] [CrossRef]
  31. Conyers, L.B. Innovative ground-penetrating radar methods for archaeological mapping. Archaeol. Prospect. 2006, 13, 139–141. [Google Scholar] [CrossRef]
  32. Negri, S.; Leucci, G.; Mazzone, F. High resolution 3d ert to help gpr data interpretation for researching archaeological items in a geologically complex subsurface. J. Appl. Geophys. 2008, 65, 111–120. [Google Scholar] [CrossRef]
  33. Giardino, L.; Meo, F. Muro Leccese. I Segreti di una Città Messapica; Edizioni Grifo: Lecce, Italy, 2016. [Google Scholar]
  34. Meo, F. Muro Leccese nell’età del Ferro. Forma e organizzazione insediativa di un abitato indigeno della Puglia meridionale. MEFRA 2019, in press. [Google Scholar]
  35. Giardino, L. I gruppi gentilizi. In Muro Leccese. I Segreti di una Città MESSAPICA; Giardino, L., Meo, F., Eds.; Edizioni Grifo: Lecce, Italy, 2016; pp. 69–76. [Google Scholar]
  36. Giardino, L.; Meo, F. The Messapian Settlement of Muro Leccese in the Archaic period. Transformations and continuities. In Archaic Settlements in Southern Italy and Sicily, Proceedings of the International Conference Cavallino, Cavallino, Italy, 26–27 March 2015; Edipuglia: Bari, Italy, in press.
  37. Meo, F. La vita quotidiana nella città messapica. In Muro Leccese. I Segreti di una Città Messapica; Edizioni Grifo: Lecce, Italy, 2016; pp. 61–68. [Google Scholar]
  38. Bianco, C. La cinta muraria. In Muro Leccese. I Segreti di una Città Messapica; Edizioni Grifo: Lecce, Italy, 2016; pp. 101–108. [Google Scholar]
  39. Giardino, L.; Meo, F. L’area archeologica in località Cunella. In Muro Leccese. I Segreti di una Città Messapica; Edizioni Grifo: Lecce, Italy, 2016; pp. 109–115. [Google Scholar]
  40. Calvaruso, T.O. Le sepolture di età messapica: La documentazione archeologica. In Muro Leccese. I segreti di una città messapica; Edizioni Grifo: Lecce, Italy, 2016; pp. 83–90. [Google Scholar]
  41. Giardino, L. Cratere a volute attico a figure nere dal centro messapico di Muro Leccese (Puglia, Italia). In Le Cratère à Volutes. Destination d’un Vase de Prestige Entre Grecs et Non-Grecs; Cahiers du CVA 2; Académie des Inscriptions et Belles-Lettres: Paris, France, 2014; pp. 215–223. [Google Scholar]
  42. Lonoce, N. Le sepolture di età messapica: La documentazione antropologica. In Muro Leccese. I segreti di una città messapica; Edizioni Grifo: Lecce, Italy, 2016; pp. 91–97. [Google Scholar]
  43. Goodman, D. GPR Sim Manual. Available online: http://www.gprsurvey.com (accessed on 7 May 2019).
  44. Chavez, G.; Tejero, A.; Alcantara, M.A.; Chavez, R.E. The ‘L-Array’, a tool to characterize a fracture pattern in an urban zone: In expanded abstracts: Near surface. Eur. Assoc. Geosci. Eng. 2011, 1, 114–155. [Google Scholar]
  45. Goodman, D.; Steinberg, J.; Damiata, B.; Nishimure, Y.; Schneider, K.; Hiromichi, H.; Hisashi, N. GPR overlay analysis for archaeological prospection. In Proceedings of the 11th International Conference on Ground Penetrating Radar, Columbus, OH, USA, 19–22 June 2006. [Google Scholar]
  46. Leucci, G.; Masini, N.; Persico, R.; Soldovieri, F. GPR and sonic tomography for structural restoration: The case of the Cathedral of Tricarico. J. Geophys. Eng. 2011, 8, S76–S92. [Google Scholar] [CrossRef]
  47. Giardino, L.; Meo, F. Attestazioni di pratiche rituali di età arcaica nell’abitato messapico di Muro Leccese (Le). In Archeologia dei Luoghi e Delle Pratiche di Culto. Atti del Convegno (Cavallino, 26–27 Gennaio 2012); Edipuglia: Bari, Italy, 2013; pp. 165–203. [Google Scholar]
  48. Giardino, L. Muro Leccese. La città messapica senza nome. In Libro di Pasquale Maggiulli 1992 al Parco Archeologico Del 2000; Edizioni Goffreda: Maglie (Lecce), Italy, 2002. [Google Scholar]
  49. Giardino, L.; Meo, F. Un decennio di indagini archeologiche a Muro Leccese. Il villaggio dell’età del Ferro e l’abitato arcaico. In Vetustis Novitatem Dare. Temi di Antichità e Archeologia in Ricordo di Grazia Angela Maruggi; Scorpione Editrice: Taranto, Italy, 2013; pp. 299–319. [Google Scholar]
  50. Meo, F. Birth and Transformation of a Messapian Settlement from the Iron Age to the Classical Period. The Example of Muro Leccese. In Making Cities, Economies of Production and Urbanisation in Mediterranean Europe 1000-500 BCE, Proceedings of the International Symposium, Cambridge, UK, 18–19 May 2017; Cambridge University Press: Cambridge, UK, 2019; in press. [Google Scholar]
Figure 1. The surveyed zones (Google Earth imaging).
Remotesensing 11 01478 g001
Figure 2. The geological map of the Muro Leccese.
Remotesensing 11 01478 g002
Figure 3. (a) Photo of the alternation of simply folded marne and calcarenite in the substrate, which outcrops in where the road runs past the surveyed area; (b) 200-MHz antenna processed radar section acquired on the geological evidence.
Remotesensing 11 01478 g003
Figure 4. The surveyed zones: (a) Zone 1; (b) Zone 2.
Remotesensing 11 01478 g004
Figure 5. Zone 1, area A: processed radar section.
Remotesensing 11 01478 g005
Figure 6. Zone 1, area A: depth slices.
Remotesensing 11 01478 g006
Figure 7. Zone 1, area A: isosurface amplitude map.
Remotesensing 11 01478 g007
Figure 8. Zone 1, area B: three processed radar sections. It is possible to see (a) M wall; (b) T tomb (c) “A” archaeological structures.
Remotesensing 11 01478 g008
Figure 9. Zone 1, area B: depth slices.
Remotesensing 11 01478 g009
Figure 10. Zone 1, area B: isosurfaces amplitude.
Remotesensing 11 01478 g010
Figure 11. Zone 1, area C: an example of the two processed radar sections (a,b). It is possible to see “A” large tomb
Remotesensing 11 01478 g011
Figure 12. Zone 1, area C: depth slices.
Remotesensing 11 01478 g012
Figure 13. Zone 1, area C: isosurface amplitude.
Remotesensing 11 01478 g013
Figure 14. Zone 1, area C: electrical resistivity tomography (ERT) depth slices.
Remotesensing 11 01478 g014
Figure 15. Zone 1, area C: (a) 3d visualization by isosurface resistivity; (b) 3D visualization by vertical and horizontal resistivity sections.
Remotesensing 11 01478 g015
Figure 16. Zone 1, area D: example of two processed radar sections (a,b). Is possible to see P pipe, M1 and M walls.
Remotesensing 11 01478 g016
Figure 17. Zone 1, area D: depth slices.
Remotesensing 11 01478 g017
Figure 18. Zone 1, area D: isosurfaces amplitude.
Remotesensing 11 01478 g018
Figure 19. Zone 1, area E: processed radar sections is possible to see (a)M wall, (b)T tomb.
Remotesensing 11 01478 g019
Figure 20. Zone 1, area E: depth slices.
Remotesensing 11 01478 g020
Figure 21. Zone 1, area E: isosurfaces amplitude.
Remotesensing 11 01478 g021
Figure 22. Zone 2: gradiometric map.
Remotesensing 11 01478 g022
Figure 23. Zone 2, area F: processed radar sections.
Remotesensing 11 01478 g023
Figure 24. Zone 2, area F: depth slices.
Remotesensing 11 01478 g024
Figure 25. Zone 2, area F: 3D visualization by isosurfaces amplitude: (a) the superficial anomalies; (b) the deeper anomalies.
Remotesensing 11 01478 g025
Figure 26. Zone 1: structures discovered within the excavation in area B.
Remotesensing 11 01478 g026
Figure 27. Zone 1: (a) and (b) structures discovered with the excavation in area E.
Remotesensing 11 01478 g027
Figure 28. Zone 2 (Palombara district): area F (a) during the excavation; (b) at the end of the excavation.
Remotesensing 11 01478 g028
Figure 29. Zone 1: depth slices overlapped to the planimetry: (a) ground-penetrating radar (GPR) depth slice; (b) ERT depth slice.
Remotesensing 11 01478 g029
Figure 30. Zone 2: depth slices overlapped to the planimetry: (a) gradiometric map; (b) GPR depth slice.
Remotesensing 11 01478 g030