Two sets of data, defined as Data set I and Data set II, were selected in the Guangdong Province of China, as shown in
Figure 2. The data were collected from 00:00:00 to 23:59:59 (UTC, Universal Time Coordinated) on day of year 77, 2019 (18 March 2019), and from 00:00:00 to 23:59:59 (UTC) on day of year 112, 2019 (22 April 2019), respectively. The sampling interval was set as 1 s, and the cut-off angle was set at 10°. In Data set I, the stations LVTI, HELI and SSGT were chosen as the reference stations to form a triangle network, and the other four stations were selected as the user stations. The stations SHAT and SHJU are located inside the network, while the stations HUAD and HMSC are outside. In Data set II, the stations HJGT, HZDY and YXGT were chosen as the reference stations, and the other three stations ZQGT, GMGT and JMGT were selected as the user stations. The GAMIT/GLOBK 10.6 software developed by Massachusetts Institute of Technology, Cambridge, MA, USA. [
39,
40], was used to obtain precise coordinates for all stations as the reference true values.
The network real-time differential positioning results were used to evaluate the performance of different position estimation methods. The traditional algorithm in the range domain and the improved algorithm in the position domain were denoted as RD and PD, respectively. The performances of GPS + BDS and GPS-only solutions were compared as well. The position errors between the network real-time differential positioning results and the true values were calculated. The root mean square (RMS) errors, the standard deviation (STD) values and the percentages of the position errors falling within predefined thresholds of ±0.25 m, ±0.5 m and ±1 m were discussed.
3.1.1. Data Set I
Figure 3 shows the position errors of the network real-time differential positioning and the number of observed satellites for station SHAT. The position errors of position domain (PD) fluctuate smaller than those of range domain (RD), even in the periods when observed satellites changed frequently. The variable number of observed satellites affects the smoothing window of RD and leads to many re-initializations, while PD performs successively with a sufficient number of observed satellites.
For both PD and RD, most of the position errors of GPS-only solution fluctuate from –1 m to 1 m in the N and E components, and from −2 m to 2 m in the U component. Obviously smaller position errors can be found in GPS + BDS solution, since the number of satellites in GPS + BDS solution are significantly larger than those in GPS-only solution.
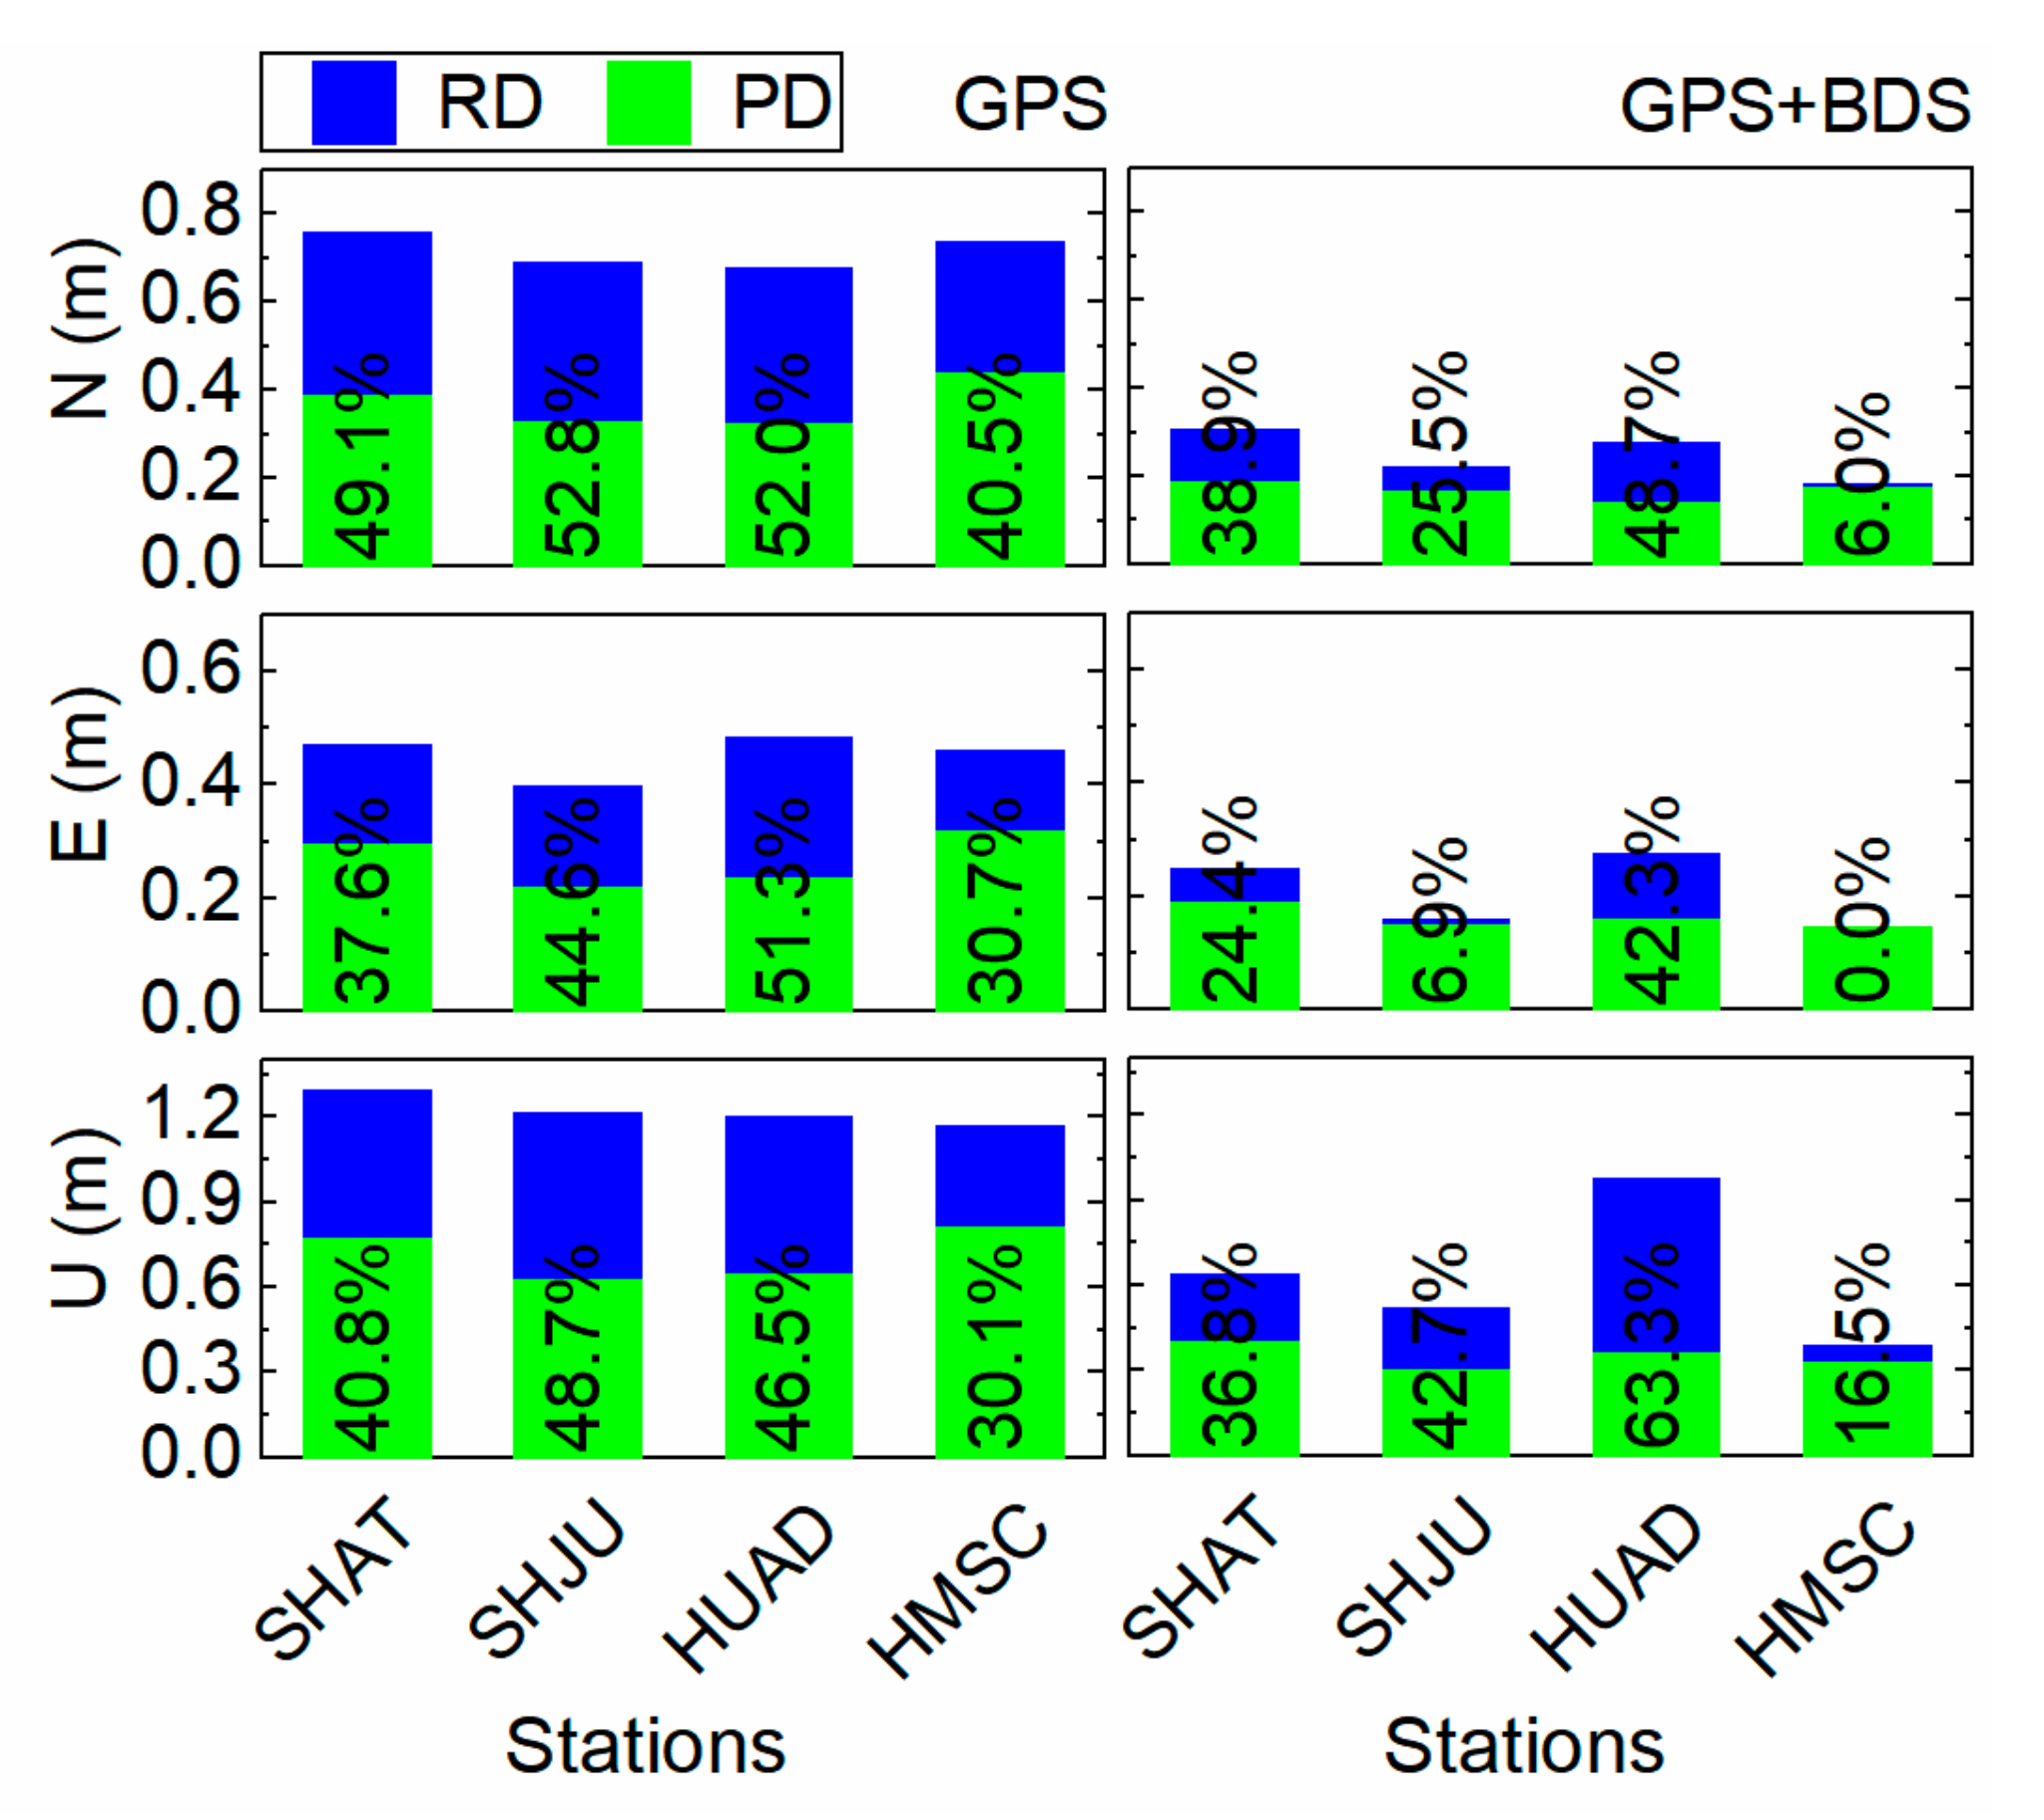
The RMS errors of the network real-time differential positioning for each user station are illustrated in
Figure 4. Recall that the first two stations are inside the network. Generally speaking, the RMS errors of PD are smaller than those of RD, in other words, better positioning accuracy can be achieved using PD. Further, for both PD and RD, the RMS errors of GPS + BDS solution are smaller than those of GPS-only solution. The RMS errors of GPS + BDS solution are usually smaller than 0.3 m, 0.3 m and 0.9 m in the N, E and U components, respectively.
Specifically, in GPS-only solution, the maximum improvement of RMS errors can be found in the N component for station SHJU, with a value of 52.8%, when replacing RD with PD. The corresponding value in GPS + BDS solution is 64.3% in the U component for station HUAD.
In addition, the RMS errors of the stations outside and inside the network have little difference, whether in GPS-only or GPS + BDS solution. This may be attributed to the short distances between the outside user stations and their neighboring reference stations.
Table 1 shows the RMS errors according to the types of user stations. Remarkable improvements can be found for PD compared with RD. The overall improvements are about 37.4%, 30.9% and 37.3% in the N, E and U components, respectively. For both PD and RD, the RMS errors of GPS + BDS solution are significantly smaller than those of GPS-only solution. The RMS errors of GPS + BDS solution are 0.269 m, 0.251 m and 0.753 m for RD in the N, E and U components, and 0.190 m, 0.191 m and 0.487 m for PD.
The improvements of GPS + BDS solution with respect to GPS-only solution using PD are about 24%–50%, and the corresponding improvements using RD are about 30%–60%. This, in turn, implies that less accuracy decrease can be found using PD when replacing GPS + BDS solution with GPS-only solution. In particular, the improvements of RMS errors when replacing RD with PD are 13.7%–38.1% in GPS + BDS solution, while the corresponding improvements in GPS-only solution increase. It is also indicated that PD is less affected by the satellite constellation.
The RMS errors for the inside and outside user stations have little difference. Since the outside user stations HUAD and HMSC are very close to the reference stations SSGT and HELI, respectively, their correction accuracy is comparable to that of the inside user stations.
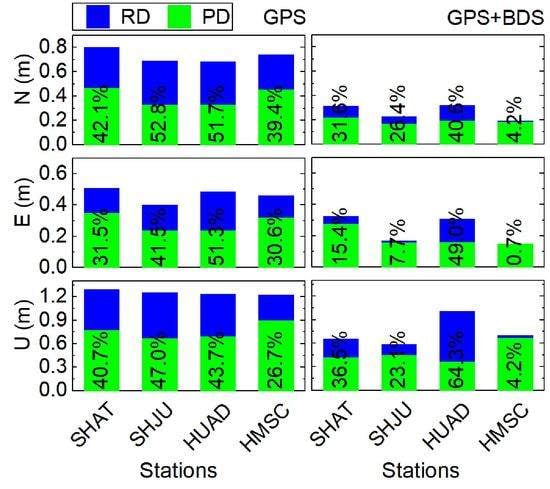
The STD values of the network real-time differential positioning for each user station are shown in
Figure 5. An obvious decrease of STD values occurred when replacing RD with PD. The maximum improvement of PD with respect to RD can reach up to 63.3%. Similar to
Figure 4, for both PD and RD, remarkable improvements can also be found when using GPS + BDS solution instead of GPS-only solution. The STD values of GPS + BDS solution are smaller than 0.3 m, 0.3 m and 0.9 m in the N, E and U components, respectively.
Table 2 gives the STD values for the inside, the outside and all user stations. The STD values of PD are much smaller than those of RD. For all user stations, the improvements are about 37.7%, 30.9% and 40.9% in the N, E and U components, respectively. For both PD and RD, a significant decrease can be found when replacing GPS-only solution with GPS + BDS solution. The STD values of GPS + BDS solution are 0.265 m, 0.242 m and 0.745 m for RD in the N, E and U components, and 0.188 m, 0.187 m and 0.437 m for PD.
Improvements of GPS + BDS solution with respect to GPS-only solution are about 20%–50% for PD, and about 30%–66% for RD. Specifically, the improvements of PD over RD are 39.1%–48.6% in GPS-only solution, which are larger than those in GPS + BDS solution. This is consistent with the results in
Table 1, and further shows that PD is less affected by the satellite constellation.
In addition, the STD values for the outside user stations are similar with those for the inside ones, which also attributes to the close position relation between the outside user station and network.
The percentages of the position errors falling within predefined thresholds are given in
Table 3 according to the types of user stations. From the table, one can see that the percentages of the position errors of PD are larger than those of RD in almost all thresholds.
For both PD and RD, the percentage of position errors in each threshold has a higher value when using GPS + BDS solution instead of GPS-only solution. In GPS + BDS solution, the percentages of the position errors falling within ±1 m in the N, E and U components are 96.4%, 99.4% and 89.4% for RD, and 99.4%, 100.0% and 96.7% for PD.
3.1.2. Data Set II
Figure 6 shows the position errors of the network real-time differential positioning and the number of observed satellites for station ZQGT. The position errors of PD fluctuate less than those of RD. For both PD and RD, the position errors of GPS + BDS solution are smaller than those of GPS-only solution. This is consistent with the results in
Figure 3.
The position errors of GPS-only solution in this figure are significantly smaller than those in
Figure 3, for both PD and RD. This is attributed to the more stable and larger number of observed GPS satellites in Data set II. In GPS + BDS solution, the difference of position error fluctuation between
Figure 6 and
Figure 3 is small for PD, but large for RD. Since the sufficient number of satellites guarantees the performance of PD for both two figures, the varying number of satellites in
Figure 3 restricts the performance of RD.
The RMS errors of the network real-time differential positioning for each user station in Data set II are illustrated in
Figure 7. Similar to
Figure 4, the RMS errors of PD are smaller than those of RD, and the RMS errors of GPS + BDS solution are smaller than those of GPS-only solution. The RMS errors of GPS + BDS solution are usually smaller than 0.3 m, 0.25 m and 0.4 m in the N, E and U components, respectively.
In GPS-only solution, the maximum improvement of RMS errors can be found in the E component for station ZQGT, with a value of 33.7%, when replacing RD with PD. The corresponding value in GPS + BDS solution is 14.2% in the E component for station ZQGT. The improvements of PD over RD in GPS-only solution are larger than those in GPS + BDS solution. Further, the improvements of PD over RD in
Figure 7 are smaller than those in
Figure 4, whether in GPS-only or GPS + BDS solution. This is because the varying observed satellites have a greater impact on RD.
The STD values of the network real-time differential positioning for each user station in Data set II are shown in
Figure 8. The STD values of PD are smaller than those of RD, and the STD values of GPS + BDS solution are smaller than those of GPS-only solution. Remarkable improvements of PD over RD can be found when using GPS-only solution. Moreover, the improvements of PD with respect to RD in
Figure 8 are smaller than those in
Figure 5.
Table 4 gives the RMS errors and STD values for all user stations in Data set II. The positioning accuracy and precision of PD are better than those of RD. The overall improvements when replacing RD with PD are about 9.5%, 18.3% and 14.8% in the N, E and U components, respectively, which are smaller than those in
Table 1 and
Table 2. Further, for both PD and RD, the values in GPS + BDS solution are smaller than those in GPS-only solution. The RMS errors of GPS + BDS solution for PD are 0.217 m, 0.159 m and 0.330 m in the N, E and U components, respectively, and the corresponding STD values are 0.173 m, 0.155 m and 0.319 m.
The improvements of GPS + BDS solution over GPS-only solution are about 20%–30% for PD, and about 35%–43% for RD. Moreover, the improvements of PD over RD in GPS + BDS solution are smaller than those in GPS-only solution. It is also indicated that PD is less affected by the satellite constellation.
The percentages of the position errors falling within predefined thresholds are given in
Table 5 for all user stations in Data set II. It can be seen that the percentages of the position errors of PD are larger than those of RD in almost all thresholds. For both PD and RD, the percentage of the position errors of GPS + BDS solution is larger than that of GPS-only solution in each threshold.


