A Survey of Mobile Laser Scanning Applications and Key Techniques over Urban Areas


Abstract
:
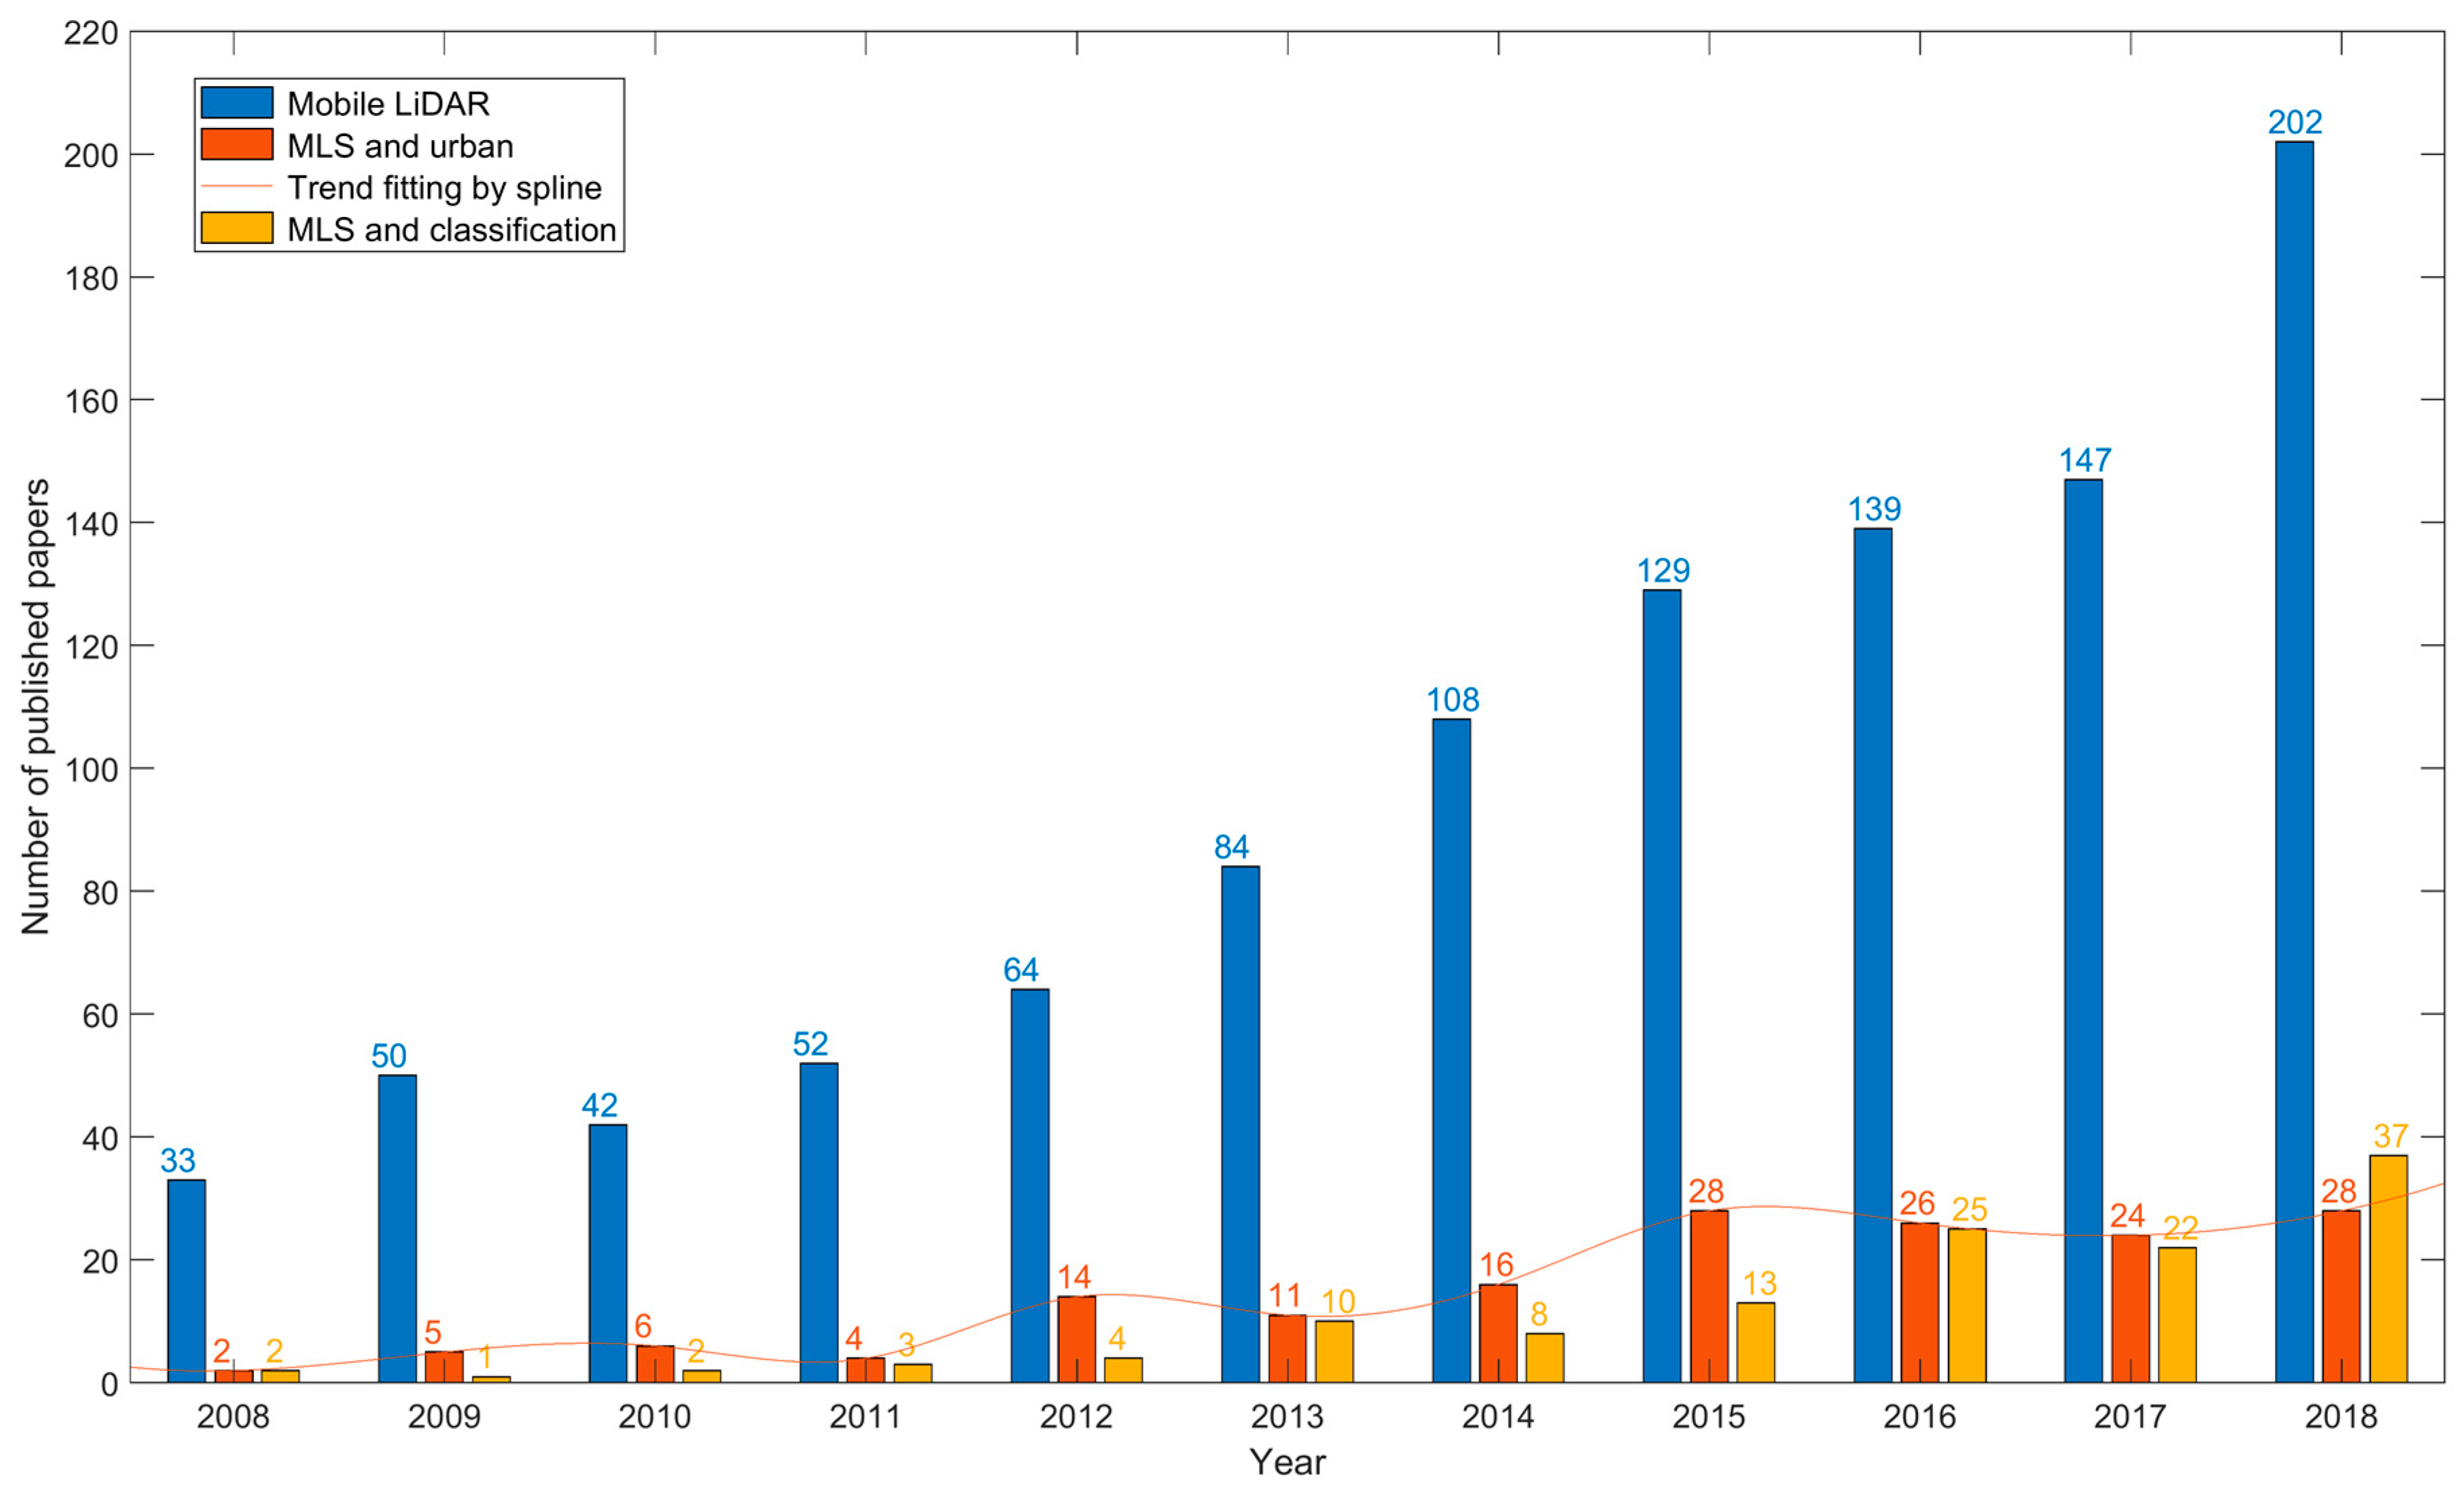
1. Introduction
2. Characteristics of MLS Systems and Data
2.1. Mobile Laser Scanning Systems
2.2. Characteristics of MLS Point Clouds
3. MLS Applications over Urban Areas
3.1. Transportation Infrastructure Mapping
3.2. Building Information Modeling
3.3. Utility Surveying and Mapping
3.4. Vegetation Mapping and Inventory
3.5. Autonomous Vehicle Driving
4. Key Issues for MLS Application and Technology
4.1. Classification Methods
4.2. Object Recognition
4.3. Data Registration
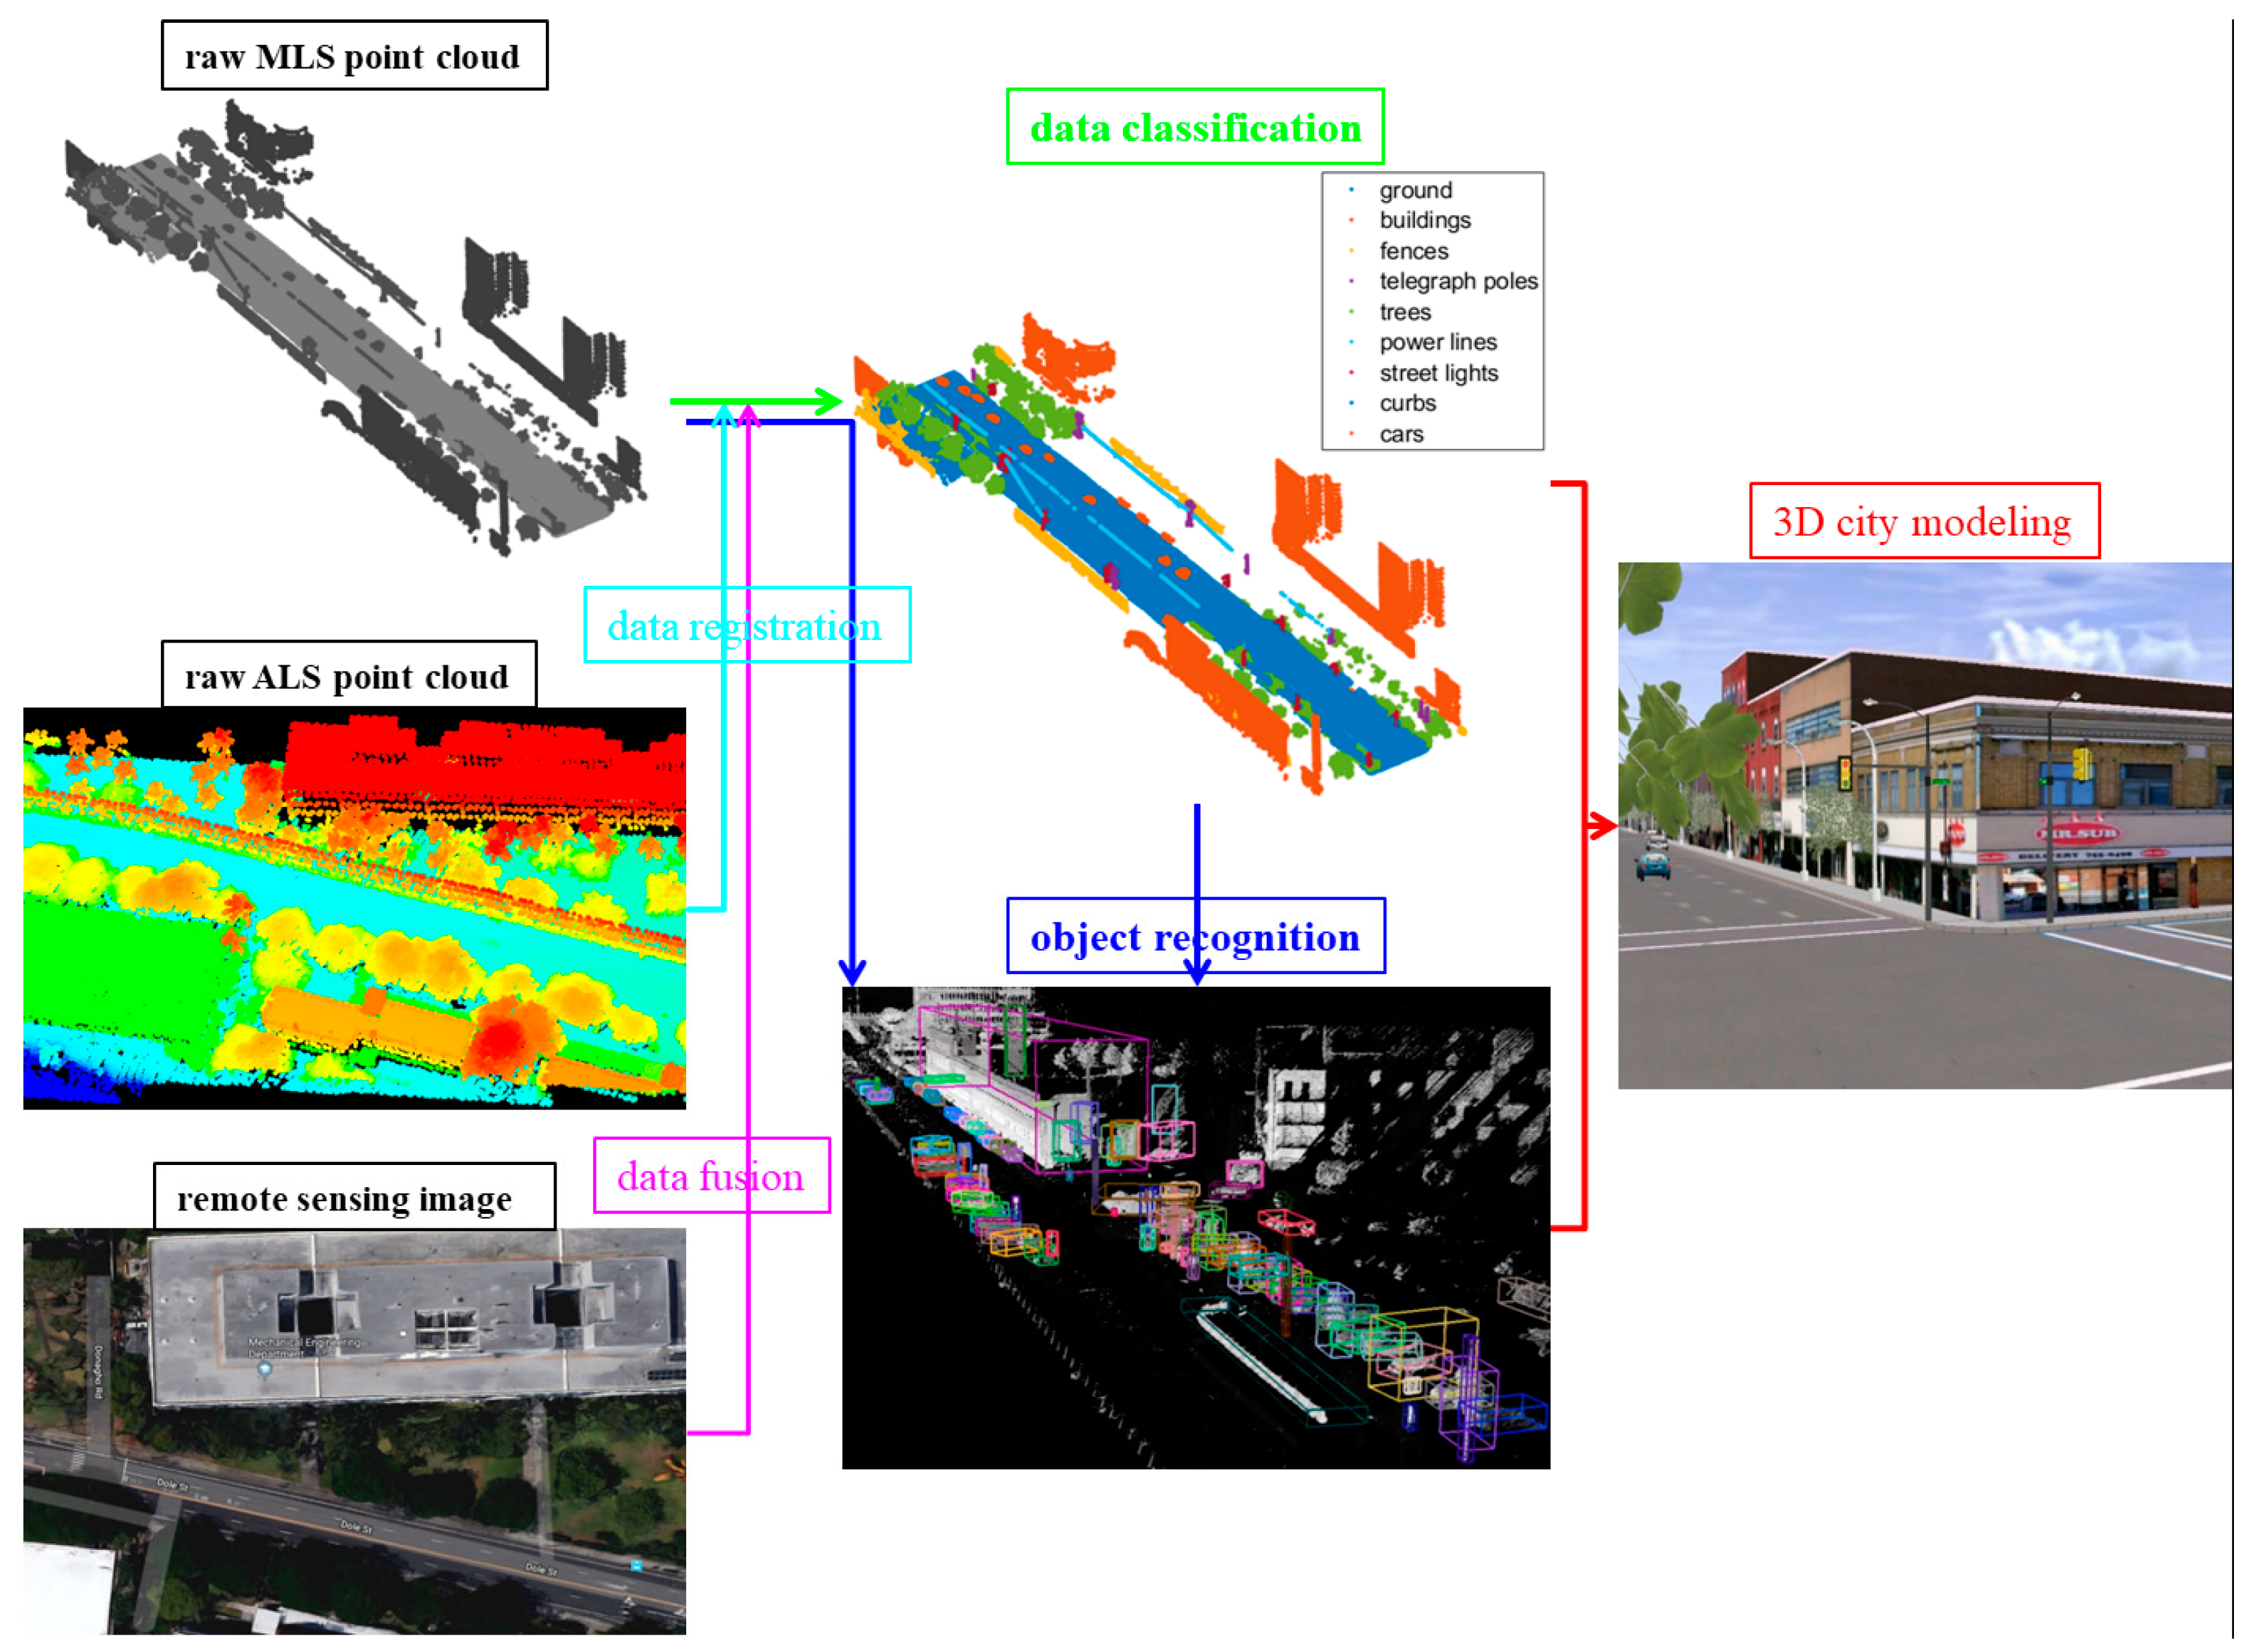
4.4. Data Integration
4.5. 3D City Modeling
5. Future Developments of MLS
5.1. Emerging of New MLS Systems and Applications
5.2. Data Processing Framework Tailored to MLS
5.3. Machine Learning Based Classification Methods
6. Conclusions
Author Contributions
Funding
Acknowledgments
Conflicts of Interest
References
- Wang, R.; Peethambaran, J.; Chen, D. Lidar point clouds to 3-d urban models: A review. IEEE J. Sel. Top. Appl. Earth Obs. Remote Sens. 2018, 11, 606–627. [Google Scholar] [CrossRef]
- Kukko, A.; Kaartinen, H.; Hyyppä, J.; Chen, Y. Multiplatform mobile laser scanning: Usability and performance. Sensors 2012, 12, 11712–11733. [Google Scholar] [CrossRef]
- Puente, I.; González-Jorge, H.; Martínez-Sánchez, J.; Arias, P. Review of mobile mapping and surveying technologies. Measurement 2013, 46, 2127–2145. [Google Scholar] [CrossRef]
- Rodríguez-Gonzálvez, P.; Jiménez Fernández-Palacios, B.; Muñoz-Nieto, Á.L.; Arias-Sanchez, P.; Gonzalez-Aguilera, D. Mobile lidar system: New possibilities for the documentation and dissemination of large cultural heritage sites. Remote Sens. 2017, 9, 189. [Google Scholar] [CrossRef]
- Sairam, N.; Nagarajan, S.; Ornitz, S. Development of mobile mapping system for 3d road asset inventory. Sensors 2016, 16, 367. [Google Scholar] [CrossRef] [PubMed]
- Hartfield, K.A.; Landau, K.I.; van Leeuwen, W.J.D. Fusion of high resolution aerial multispectral and lidar data: Land cover in the context of urban mosquito habitat. Remote Sens. 2011, 3, 2364–2383. [Google Scholar] [CrossRef]
- Yan, W.Y.; Shaker, A.; El-Ashmawy, N. Urban land cover classification using airborne lidar data: A review. Remote Sens. Environ. 2015, 158, 295–310. [Google Scholar] [CrossRef]
- Zou, X.; Zhao, G.; Li, J.; Yang, Y.; Fang, Y. Object based image analysis combining high spatial resolution imagery and laser point clouds for urban land cover. Int. Arch. Photogramm. Remote Sens. Spat. Inf. Sci. 2016, 41, 733–739. [Google Scholar] [CrossRef]
- Matikainen, L.; Karila, K.; Hyyppä, J.; Litkey, P.; Puttonen, E.; Ahokas, E. Object-based analysis of multispectral airborne laser scanner data for land cover classification and map updating. ISPRS J. Photogramm. Remote Sens. 2017, 128, 298–313. [Google Scholar] [CrossRef]
- Guo, L.; Chehata, N.; Mallet, C.; Boukir, S. Relevance of airborne lidar and multispectral image data for urban scene classification using random forests. ISPRS J. Photogramm. Remote Sens. 2011, 66, 56–66. [Google Scholar] [CrossRef]
- Chen, G.; Weng, Q.; Hay, G.J.; He, Y. Geographic object-based image analysis (geobia): Emerging trends and future opportunities. Gisci. Remote Sens. 2018, 55, 159–182. [Google Scholar] [CrossRef]
- Rusu, R.B.; Marton, Z.C.; Blodow, N.; Dolha, M.; Beetz, M. Towards 3d point cloud based object maps for household environments. Robot. Auton. Syst. 2008, 56, 927–941. [Google Scholar] [CrossRef]
- Boyko, A.; Funkhouser, T. Extracting roads from dense point clouds in large scale urban environment. Isprs J. Photogramm. Remote Sens. 2011, 66, S2–S12. [Google Scholar] [CrossRef] [Green Version]
- Yadav, M.; Singh, A.K.; Lohani, B. Extraction of road surface from mobile lidar data of complex road environment. Int. J. Remote Sens. 2017, 38, 4655–4682. [Google Scholar] [CrossRef]
- Jeong, J.; Yoon, T.S.; Park, J.B. Multimodal sensor-based semantic 3d mapping for a large-scale environment. Expert Syst. Appl. 2018, 105, 1–10. [Google Scholar] [CrossRef]
- Soilan, M.; Riveiro, B.; Sanchez-Rodriguez, A.; Arias, P. Safety assessment on pedestrian crossing environments using mls data. Accid. Anal. Prev. 2018, 111, 328–337. [Google Scholar] [CrossRef] [PubMed]
- Shi, W.; Alawieh, M.B.; Li, X.; Yu, H. Algorithm and hardware implementation for visual perception system in autonomous vehicle: A survey. Integr. VLSI J. 2017, 59, 148–156. [Google Scholar] [CrossRef]
- Wang, H.; Wang, B.; Liu, B.; Meng, X.; Yang, G. Pedestrian recognition and tracking using 3d lidar for autonomous vehicle. Robot. Auton. Syst. 2017, 88, 71–78. [Google Scholar] [CrossRef]
- Gao, H.; Cheng, B.; Wang, J.; Li, K.; Zhao, J.; Li, D. Object classification using cnn-based fusion of vision and lidar in autonomous vehicle environment. IEEE Trans. Ind. Inform. 2018, 14, 4224–4231. [Google Scholar] [CrossRef]
- Maxwell, A.E.; Warner, T.A.; Fang, F. Implementation of machine-learning classification in remote sensing: An applied review. Int. J. Remote Sens. 2018, 39, 2784–2817. [Google Scholar] [CrossRef]
- Zhu, X.X.; Tuia, D.; Mou, L.; Xia, G.-S.; Zhang, L.; Xu, F.; Fraundorfer, F. Deep learning in remote sensing: A review. arXiv 2017, arXiv:1710.03959. [Google Scholar]
- Meng, X.; Currit, N.; Zhao, K. Ground filtering algorithms for airborne lidar data: A review of critical issues. Remote Sens. 2010, 2, 833–860. [Google Scholar] [CrossRef]
- Han, X.-F.; Jin, J.S.; Wang, M.-J.; Jiang, W.; Gao, L.; Xiao, L. A review of algorithms for filtering the 3d point cloud. Signal Process. Image Commun. 2017, 57, 103–112. [Google Scholar] [CrossRef]
- Grilli, E.; Menna, F.; Remondino, F. A review of point clouds segmentation and classification algorithms. ISPRS Int. Arch. Photogramm. Remote Sens. Spat. Inf. Sci. 2017, 42, 339–344. [Google Scholar] [CrossRef]
- Zhang, J.; Lin, X. Advances in fusion of optical imagery and lidar point cloud applied to photogrammetry and remote sensing. Int. J. Image Data Fusion 2016, 8, 1–31. [Google Scholar] [CrossRef]
- Guan, H.; Li, J.; Cao, S.; Yu, Y. Use of mobile lidar in road information inventory: A review. Int. J. Image Data Fusion 2016, 7, 219–242. [Google Scholar] [CrossRef]
- Brédif, M.; Vallet, B.; Ferrand, B. Distributed dimensonality-based rendering of lidar point clouds. Int. Arch. Photogramm. Remote Sens. Spat. Inf. Sci. 2015, 40, 559–564. [Google Scholar] [CrossRef]
- Rau, J.-Y.; Jhan, J.-P.; Hsu, Y.-C. Analysis of oblique aerial images for land cover and point cloud classification in an urban environment. IEEE Trans. Geosci. Remote Sens. 2014, 53, 1304–1319. [Google Scholar] [CrossRef]
- Beger, R.; Gedrange, C.; Hecht, R.; Neubert, M. Data fusion of extremely high resolution aerial imagery and lidar data for automated railroad centre line reconstruction. ISPRS J. Photogramm. Remote Sens. 2011, 66, S40–S51. [Google Scholar] [CrossRef]
- Xiang, B.; Yao, J.; Lu, X.; Li, L.; Xie, R.; Li, J. Segmentation-based classification for 3d point clouds in the road environment. Int. J. Remote Sens. 2018, 39, 6182–6212. [Google Scholar] [CrossRef]
- Olofsson, K.; Holmgren, J.; Olsson, H. Tree stem and height measurements using terrestrial laser scanning and the ransac algorithm. Remote Sens. 2014, 6, 4323–4344. [Google Scholar] [CrossRef]
- Qin, R.; Gruen, A. 3d change detection at street level using mobile laser scanning point clouds and terrestrial images. ISPRS J. Photogramm. Remote Sens. 2014, 90, 23–35. [Google Scholar] [CrossRef]
- Cabo, C.; Ordoñez, C.; García-Cortés, S.; Martínez, J. An algorithm for automatic detection of pole-like street furniture objects from mobile laser scanner point clouds. ISPRS J. Photogramm. Remote Sens. 2014, 87, 47–56. [Google Scholar] [CrossRef]
- De Conto, T.; Olofsson, K.; Görgens, E.B.; Rodriguez, L.C.E.; Almeida, G. Performance of stem denoising and stem modelling algorithms on single tree point clouds from terrestrial laser scanning. Comput. Electron. Agric. 2017, 143, 165–176. [Google Scholar] [CrossRef]
- Chen, D.; Zhang, L.; Mathiopoulos, P.T.; Huang, X. A methodology for automated segmentation and reconstruction of urban 3-d buildings from als point clouds. IEEE J. Sel. Top. Appl. Earth Obs. Remote Sens. 2014, 7, 4199–4217. [Google Scholar] [CrossRef]
- Dairi, A.; Harrou, F.; Senouci, M.; Sun, Y. Unsupervised obstacle detection in driving environments using deep-learning-based stereovision. Robot. Auton. Syst. 2018, 100, 287–301. [Google Scholar] [CrossRef] [Green Version]
- Zhi, S.; Liu, Y.; Li, X.; Guo, Y. Toward real-time 3d object recognition: A lightweight volumetric cnn framework using multitask learning. Comput. Graph. 2018, 71, 199–207. [Google Scholar] [CrossRef]
- Yu, Y.; Guan, H.; Ji, Z. Automated detection of urban road manhole covers using mobile laser scanning data. IEEE Trans. Intell. Transp. Syst. 2015, 16, 3258–3269. [Google Scholar] [CrossRef]
- Yang, B.; Fang, L.; Li, J. Semi-automated extraction and delineation of 3d roads of street scene from mobile laser scanning point clouds. ISPRS J. Photogramm. Remote Sens. 2013, 79, 80–93. [Google Scholar] [CrossRef]
- Yu, Y.; Li, J.; Guan, H.; Jia, F.; Wang, C. Learning hierarchical features for automated extraction of road markings from 3-d mobile lidar point clouds. IEEE J. Sel. Top. Appl. Earth Obs. Remote Sens. 2015, 8, 709–726. [Google Scholar] [CrossRef]
- Gargoum, S.A.; El-Basyouny, K.; Froese, K.; Gadowski, A. A fully automated approach to extract and assess road cross sections from mobile lidar data. IEEE Trans. Intell. Transp. Syst. 2018, 19, 3507–3516. [Google Scholar] [CrossRef]
- Kumar, P.; McElhinney, C.P.; Lewis, P.; McCarthy, T. An automated algorithm for extracting road edges from terrestrial mobile lidar data. ISPRS J. Photogramm. Remote Sens. 2013, 85, 44–55. [Google Scholar] [CrossRef]
- Rodríguez-Cuenca, B.; García-Cortés, S.; Ordóñez, C.; Alonso, M.C. An approach to detect and delineate street curbs from mls 3d point cloud data. Autom. Constr. 2015, 51, 103–112. [Google Scholar] [CrossRef]
- Hervieu, A.; Soheilian, B. Road side detection and reconstruction using lidar sensor. In Proceedings of the 2013 IEEE Intelligent Vehicles Symposium (IV), Gold Coast, Australia, 23–26 June 2013; pp. 1247–1252. [Google Scholar]
- Hervieu, A.; Soheilian, B.; Brédif, M. Road marking extraction using a model&data-driven rj-mcmc. ISPRS Ann. Photogramm. Remote Sens. Spat. Inf. Sci. 2015, 2, 47–54. [Google Scholar]
- Iman Zolanvari, S.M.; Laefer, D.F. Slicing method for curved façade and window extraction from point clouds. ISPRS J. Photogramm. Remote Sens. 2016, 119, 334–346. [Google Scholar] [CrossRef]
- Yu, Y.; Li, J.; Guan, H.; Wang, C. Automated detection of three-dimensional cars in mobile laser scanning point clouds using dbm-hough-forests. IEEE Trans. Geosci. Remote Sens. 2016, 54, 4130–4142. [Google Scholar] [CrossRef]
- Soilán, M.; Riveiro, B.; Martínez-Sánchez, J.; Arias, P. Traffic sign detection in mls acquired point clouds for geometric and image-based semantic inventory. ISPRS J. Photogramm. Remote Sens. 2016, 114, 92–101. [Google Scholar] [CrossRef]
- Arcos-García, Á.; Soilán, M.; Álvarez-García, J.A.; Riveiro, B. Exploiting synergies of mobile mapping sensors and deep learning for traffic sign recognition systems. Expert Syst. Appl. 2017, 89, 286–295. [Google Scholar] [CrossRef]
- Jaakkola, A.; Hyyppä, J.; Hyyppä, H.; Kukko, A. Retrieval algorithms for road surface modelling using laser-based mobile mapping. Sensors 2008, 8, 5238–5249. [Google Scholar] [CrossRef]
- Guan, H.; Li, J.; Yu, Y.; Ji, Z.; Wang, C. Using mobile lidar data for rapidly updating road markings. IEEE Trans. Intell. Transp. Syst. 2015, 16, 2457–2466. [Google Scholar] [CrossRef]
- Yang, B.; Fang, L.; Li, Q.; Li, J. Automated extraction of road markings from mobile lidar point clouds. Photogramm. Eng. Remote Sens. 2012, 78, 331–338. [Google Scholar] [CrossRef]
- Yang, B.; Wei, Z.; Li, Q.; Li, J. Automated extraction of street-scene objects from mobile lidar point clouds. Int. J. Remote Sens. 2012, 33, 5839–5861. [Google Scholar] [CrossRef]
- Yang, B.; Dong, Z.; Liu, Y.; Liang, F.; Wang, Y. Computing multiple aggregation levels and contextual features for road facilities recognition using mobile laser scanning data. ISPRS J. Photogramm. Remote Sens. 2017, 126, 180–194. [Google Scholar] [CrossRef]
- Yang, B.; Liu, Y.; Dong, Z.; Liang, F.; Li, B.; Peng, X. 3d local feature bkd to extract road information from mobile laser scanning point clouds. ISPRS J. Photogramm. Remote Sens. 2017, 130, 329–343. [Google Scholar] [CrossRef]
- Holgado-Barco, A.; Gonzalez-Aguilera, D.; Arias-Sanchez, P.; Martinez-Sanchez, J. An automated approach to vertical road characterisation using mobile lidar systems: Longitudinal profiles and cross-sections. ISPRS J. Photogramm. Remote Sens. 2014, 96, 28–37. [Google Scholar] [CrossRef]
- Guo, J.; Tsai, M.-J.; Han, J.-Y. Automatic reconstruction of road surface features by using terrestrial mobile lidar. Autom. Constr. 2015, 58, 165–175. [Google Scholar] [CrossRef]
- Wang, Y.; Cheng, L.; Chen, Y.; Wu, Y.; Li, M. Building point detection from vehicle-borne lidar data based on voxel group and horizontal hollow analysis. Remote Sens. 2016, 8, 419. [Google Scholar] [CrossRef]
- Du, S.; Zhang, Y.; Qin, R.; Yang, Z.; Zou, Z.; Tang, Y.; Fan, C. Building change detection using old aerial images and new lidar data. Remote Sens. 2016, 8, 1030. [Google Scholar] [CrossRef]
- Sohn, G.; Dowman, I. Data fusion of high-resolution satellite imagery and lidar data for automatic building extraction. ISPRS J. Photogramm. Remote Sens. 2007, 62, 43–63. [Google Scholar] [CrossRef]
- Hussain, E.; Ural, S.; Kim, K.; Fu, C.S.; Shan, J. Building extraction and rubble mapping for city port-au-prince post-2010 earthquake with geoeye-1 imagery and lidar data. Photogramm. Eng. Remote Sens. 2011, 77, 1011–1023. [Google Scholar]
- Chen, K.; Lu, W.; Xue, F.; Tang, P.; Li, L.H. Automatic building information model reconstruction in high-density urban areas: Augmenting multi-source data with architectural knowledge. Autom. Constr. 2018, 93, 22–34. [Google Scholar] [CrossRef]
- Gong, F.-Y.; Zeng, Z.-C.; Zhang, F.; Li, X.; Ng, E.; Norford, L.K. Mapping sky, tree, and building view factors of street canyons in a high-density urban environment. Build. Environ. 2018, 134, 155–167. [Google Scholar] [CrossRef]
- Oesau, S.; Lafarge, F.; Alliez, P. Indoor scene reconstruction using feature sensitive primitive extraction and graph-cut. ISPRS J. Photogramm. Remote Sens. 2014, 90, 68–82. [Google Scholar] [CrossRef] [Green Version]
- Laefer, D.F.; Truong-Hong, L. Toward automatic generation of 3d steel structures for building information modelling. Autom. Constr. 2017, 74, 66–77. [Google Scholar] [CrossRef]
- Li, Y.; Hu, Q.; Wu, M.; Liu, J.; Wu, X. Extraction and simplification of building façade pieces from mobile laser scanner point clouds for 3d street view services. ISPRS Int. J. Geo-Inf. 2016, 5, 231. [Google Scholar] [CrossRef]
- Qin, R.; Tian, J.; Reinartz, P. 3d change detection—Approaches and applications. ISPRS J. Photogramm. Remote Sens. 2016, 122, 41–56. [Google Scholar] [CrossRef]
- Nguyen, L.V.; La, H.M.; Sanchez, J.; Vu, T. A smart shoe for building a real-time 3d map. Autom. Constr. 2016, 71, 2–12. [Google Scholar] [CrossRef]
- Thomson, C.; Boehm, J. Automatic geometry generation from point clouds for bim. Remote Sens. 2015, 7, 11753–11775. [Google Scholar] [CrossRef]
- Krajník, T.; Cristóforis, P.; Kusumam, K.; Neubert, P.; Duckett, T. Image features for visual teach-and-repeat navigation in changing environments. Robot. Auton. Syst. 2017, 88, 127–141. [Google Scholar] [CrossRef] [Green Version]
- Kim, P.; Chen, J.; Cho, Y.K. Slam-driven robotic mapping and registration of 3d point clouds. Autom. Constr. 2018, 89, 38–48. [Google Scholar] [CrossRef]
- Chen, C.; Zou, X.; Tian, M.; Li, J.; Wu, W.; Song, Y.; Dai, W.; Yang, B. Low cost multi-sensor robot laser scanning system and its accuracy investigations for indoor mapping application. ISPRS Int. Arch. Photogramm. Remote Sens. Spat. Inf. Sci. 2017, 42, 83–85. [Google Scholar] [CrossRef]
- Bartkevicius, S.; Fiodorova, O.; Knys, A.; Derviniene, A.; Dervinis, G.; Raudonis, V.; Lipnickas, A.; Baranauskas, V.; Sarkauskas, K.; Balasevicius, L. Mobile robots navigation modeling in known 2d environment based on petri nets. Intell. Autom. Soft Comput. 2017. [Google Scholar] [CrossRef]
- Macher, H.; Landes, T.; Grussenmeyer, P. From point clouds to building information models: 3d semi-automatic reconstruction of indoors of existing buildings. Appl. Sci. 2017, 7, 1030. [Google Scholar] [CrossRef]
- Hong, S.; Jung, J.; Kim, S.; Cho, H.; Lee, J.; Heo, J. Semi-automated approach to indoor mapping for 3d as-built building information modeling. Comput. Environ. Urban Syst. 2015, 51, 34–46. [Google Scholar] [CrossRef]
- Zhu, L.L.; Hyyppa, J.; Kukko, A.; Kaartinen, H.; Chen, R.Z. Photorealistic building reconstruction from mobile laser scanning data. Remote Sens. 2011, 3, 1406–1426. [Google Scholar] [CrossRef]
- Yang, B.; Wei, Z.; Li, Q.; Li, J. Semiautomated building facade footprint extraction from mobile lidar point clouds. IEEE Geosci. Remote Sens. Lett. 2013, 10, 766–770. [Google Scholar] [CrossRef]
- Du, S.J.; Zhang, Y.S.; Zou, Z.R.; Xu, S.H.; He, X.; Chen, S.Y. Automatic building extraction from lidar data fusion of point and grid-based features. ISPRS J. Photogramm. Remote Sens. 2017, 130, 294–307. [Google Scholar] [CrossRef]
- Xu, J.; Hou, W.; Sun, Y.; Lee, Y.-S. Plsp based layered contour generation from point cloud for additive manufacturing. Robot. Comput. Integr. Manuf. 2018, 49, 1–12. [Google Scholar] [CrossRef]
- Balado, J.; Díaz-Vilariño, L.; Arias, P.; Soilán, M. Automatic building accessibility diagnosis from point clouds. Autom. Constr. 2017, 82, 103–111. [Google Scholar] [CrossRef] [Green Version]
- Huang, J.; You, S. Pole-like object detection and classification from urban point clouds. In Proceedings of the 2015 IEEE International Conference on Robotics and Automation, ICRA 2015, Seattle, WA, USA, 26–30 May 2015; pp. 3032–3038. [Google Scholar]
- Xiao, W.; Vallet, B.; Schindler, K.; Paparoditis, N. Street-side vehicle detection, classification and change detection using mobile laser scanning data. ISPRS J. Photogramm. Remote Sens. 2016, 114, 166–178. [Google Scholar] [CrossRef]
- Rodriguez-Cuenca, B.; Garcia-Cortes, S.; Ordonez, C.; Alonso, M.C. Automatic detection and classification of pole-like objects in urban point cloud data using an anomaly detection algorithm. Remote Sens. 2015, 7, 12680–12703. [Google Scholar] [CrossRef]
- Yadav, M.; Lohani, B.; Singh, A.K.; Husain, A. Identification of pole-like structures from mobile lidar data of complex road environment. Int. J. Remote Sens. 2016, 37, 4748–4777. [Google Scholar] [CrossRef]
- Li, F.; Oude Elberink, S.; Vosselman, G. Pole-like road furniture detection and decomposition in mobile laser scanning data based on spatial relations. Remote Sens. 2018, 10, 531. [Google Scholar]
- Ordonez, C.; Cabo, C.; Sanz-Ablanedo, E. Automatic detection and classification of pole-like objects for urban cartography using mobile laser scanning data. Sensors 2017, 17, 10. [Google Scholar] [CrossRef] [PubMed]
- Yan, L.; Li, Z.; Liu, H.; Tan, J.; Zhao, S.; Chen, C. Detection and classification of pole-like road objects from mobile lidar data in motorway environment. Opt. Laser Technol. 2017, 97, 272–283. [Google Scholar] [CrossRef]
- Puttonen, E.; Jaakkola, A.; Litkey, P.; Hyyppa, J. Tree classification with fused mobile laser scanning and hyperspectral data. Sensors 2011, 11, 5158–5182. [Google Scholar] [CrossRef] [PubMed]
- Guan, H.; Yu, Y.; Ji, Z.; Li, J.; Zhang, Q. Deep learning-based tree classification using mobile lidar data. Remote Sens. Lett. 2015, 6, 864–873. [Google Scholar] [CrossRef]
- Zou, X.; Cheng, M.; Wang, C.; Xia, Y.; Li, J. Tree classification in complex forest point clouds based on deep learning. IEEE Geosci. Remote Sens. Lett. 2017, 14, 2360–2364. [Google Scholar] [CrossRef]
- Varela-González, M.; González-Jorge, H.; Riveiro, B.; Arias, P. Automatic filtering of vehicles from mobile lidar datasets. Measurement 2014, 53, 215–223. [Google Scholar] [CrossRef]
- Borcs, A.; Nagy, B.; Benedek, C. Instant object detection in lidar point clouds. IEEE Geosci. Remote Sens. Lett. 2017, 14, 992–996. [Google Scholar] [CrossRef]
- Chen, Y.; Zhao, D.; Lv, L.; Zhang, Q. Multi-task learning for dangerous object detection in autonomous driving. Inf. Sci. 2018, 432, 559–571. [Google Scholar] [CrossRef]
- Stiller, C.; Hipp, J.; Rössig, C.; Ewald, A. Multisensor obstacle detection and tracking. Image Vis. Comput. 2000, 18, 389–396. [Google Scholar] [CrossRef]
- Asvadi, A.; Premebida, C.; Peixoto, P.; Nunes, U. 3d lidar-based static and moving obstacle detection in driving environments: An approach based on voxels and multi-region ground planes. Robot. Auton. Syst. 2016, 83, 299–311. [Google Scholar] [CrossRef]
- Zhang, L.; Li, Q.; Li, M.; Mao, Q.; Nüchter, A. Multiple vehicle-like target tracking based on the velodyne lidar. Proc. IFAC Intell. Auton. Veh. 2013, 46, 126–131. [Google Scholar] [CrossRef]
- Zhao, G.; Xiao, X.; Yuan, J.; Ng, G.W. Fusion of 3d-lidar and camera data for scene parsing. J. Vis. Commun. Image Represent. 2014, 25, 165–183. [Google Scholar] [CrossRef]
- Mancini, A.; Frontoni, E.; Zingaretti, P. Embedded multisensor system for safe point-to-point navigation of impaired users. IEEE Trans. Intell. Transp. Syst. 2015, 16, 3543–3555. [Google Scholar] [CrossRef]
- Gruyer, D.; Magnier, V.; Hamdi, K.; Claussmann, L.; Orfila, O.; Rakotonirainy, A. Perception, information processing and modeling: Critical stages for autonomous driving applications. Annu. Rev. Control 2017, 44, 323–341. [Google Scholar] [CrossRef]
- Jende, P.; Nex, F.; Gerke, M.; Vosselman, G. A fully automatic approach to register mobile mapping and airborne imagery to support the correction of platform trajectories in gnss-denied urban areas. ISPRS J. Photogramm. Remote Sens. 2018, 141, 86–99. [Google Scholar] [CrossRef]
- Einhorn, E.; Schröter, C.; Gross, H.M. Attention-driven monocular scene reconstruction for obstacle detection, robot navigation and map building. Robot. Auton. Syst. 2011, 59, 296–309. [Google Scholar] [CrossRef]
- Cheng, L.; Tong, L.; Wang, Y.; Li, M. Extraction of urban power lines from vehicle-borne lidar data. Remote Sens. 2014, 6, 3302–3320. [Google Scholar] [CrossRef]
- Liu, W.; Zhang, Z.; Li, S.; Tao, D. Road detection by using a generalized hough transform. Remote Sens. 2017, 9, 590. [Google Scholar] [CrossRef]
- Li, L.; Yang, F.; Zhu, H.; Li, D.; Li, Y.; Tang, L. An improved ransac for 3d point cloud plane segmentation based on normal distribution transformation cells. Remote Sens. 2017, 9, 433. [Google Scholar] [CrossRef]
- Barnea, S.; Filin, S. Segmentation of terrestrial laser scanning data using geometry and image information. ISPRS J. Photogramm. Remote Sens. 2013, 76, 33–48. [Google Scholar] [CrossRef]
- Awrangjeb, M.; Zhang, C.; Fraser, C.S. Automatic extraction of building roofs using lidar data and multispectral imagery. ISPRS J. Photogramm. Remote Sens. 2013, 83, 1–18. [Google Scholar] [CrossRef]
- Li, M.; Ma, L.; Blaschke, T.; Cheng, L.; Tiede, D. A systematic comparison of different object-based classification techniques using high spatial resolution imagery in agricultural environments. Int. J. Appl. Earth Obs. Geoinf. 2016, 49, 87–98. [Google Scholar] [CrossRef]
- Zhao, W.; Du, S.; Wang, Q.; Emery, W.J. Contextually guided very-high-resolution imagery classification with semantic segments. ISPRS J. Photogramm. Remote Sens. 2017, 132, 48–60. [Google Scholar] [CrossRef]
- Weinmann, M.; Schmidt, A.; Mallet, C.; Hinz, S.; Rottensteiner, F.; Jutzi, B. Contextual classification of point cloud data by exploiting individual 3d neigbourhoods. ISPRS Ann. Photogramm. Remote Sens. Spat. Inf. Sci. 2015, 2, 271–278. [Google Scholar] [CrossRef]
- Dittrich, A.; Weinmann, M.; Hinz, S. Analytical and numerical investigations on the accuracy and robustness of geometric features extracted from 3d point cloud data. ISPRS J. Photogramm. Remote Sens. 2017, 126, 195–208. [Google Scholar] [CrossRef]
- Weinmann, M.; Urban, S.; Hinz, S.; Jutzi, B.; Mallet, C. Distinctive 2d and 3d features for automated large-scale scene analysis in urban areas. Comput. Graph. 2015, 49, 47–57. [Google Scholar] [CrossRef]
- Weinmann, M.; Jutzi, B.; Hinz, S.; Mallet, C. Semantic point cloud interpretation based on optimal neighborhoods, relevant features and efficient classifiers. ISPRS J. Photogramm. Remote Sens. 2015, 105, 286–304. [Google Scholar] [CrossRef]
- Yu, Y.; Li, J.; Guan, H.; Wang, C.; Yu, J. Semiautomated extraction of street light poles from mobile lidar point-clouds. IEEE Trans. Geosci. Remote Sens. 2015, 53, 1374–1386. [Google Scholar] [CrossRef]
- Yang, J.; Cao, Z.; Zhang, Q. A fast and robust local descriptor for 3d point cloud registration. Inf. Sci. 2016, 346–347, 163–179. [Google Scholar] [CrossRef]
- Fehr, D.; Beksi, W.J.; Zermas, D.; Papanikolopoulos, N. Covariance based point cloud descriptors for object detection and recognition. Comput. Vis. Image Underst. 2016, 142, 80–93. [Google Scholar] [CrossRef] [Green Version]
- Beserra Gomes, R.; Ferreira da Silva, B.M.; Rocha, L.K.D.M.; Aroca, R.V.; Velho, L.C.P.R.; Gonçalves, L.M.G. Efficient 3d object recognition using foveated point clouds. Comput. Graph. 2013, 37, 496–508. [Google Scholar] [CrossRef]
- Riveiro, B.; González-Jorge, H.; Martínez-Sánchez, J.; Díaz-Vilariño, L.; Arias, P. Automatic detection of zebra crossings from mobile lidar data. Opt. Laser Technol. 2015, 70, 63–70. [Google Scholar] [CrossRef]
- Puente, I.; González-Jorge, H.; Martínez-Sánchez, J.; Arias, P. Automatic detection of road tunnel luminaires using a mobile lidar system. Measurement 2014, 47, 569–575. [Google Scholar] [CrossRef]
- Eo, Y.D.; Pyeon, M.W.; Kim, S.W.; Kim, J.R.; Han, D.Y. Coregistration of terrestrial lidar points by adaptive scale-invariant feature transformation with constrained geometry. Autom. Constr. 2012, 25, 49–58. [Google Scholar] [CrossRef]
- Gressin, A.; Mallet, C.; Demantké, J.; David, N. Towards 3d lidar point cloud registration improvement using optimal neighborhood knowledge. ISPRS J. Photogramm. Remote Sens. 2013, 79, 240–251. [Google Scholar] [CrossRef]
- Weber, T.; Hänsch, R.; Hellwich, O. Automatic registration of unordered point clouds acquired by kinect sensors using an overlap heuristic. ISPRS J. Photogramm. Remote Sens. 2015, 102, 96–109. [Google Scholar] [CrossRef]
- Cheng, L.; Wu, Y.; Tong, L.; Chen, Y.; Li, M. Hierarchical registration method for airborne and vehicle lidar point cloud. Remote Sens. 2015, 7, 13921–13944. [Google Scholar] [CrossRef]
- Cheng, L.; Chen, S.; Liu, X.; Xu, H.; Wu, Y.; Li, M.; Chen, Y. Registration of laser scanning point clouds: A review. Sensors 2018, 18, 1641. [Google Scholar] [CrossRef] [PubMed]
- Yun, D.; Kim, S.; Heo, H.; Ko, K.H. Automated registration of multi-view point clouds using sphere targets. Adv. Eng. Inform. 2015, 29, 930–939. [Google Scholar] [CrossRef]
- Yan, L.; Tan, J.X.; Liu, H.; Xie, H.; Chen, C.J. Automatic non-rigid registration of multi-strip point clouds from mobile laser scanning systems. Int. J. Remote Sens. 2018, 39, 1713–1728. [Google Scholar] [CrossRef]
- Bueno, M.; González-Jorge, H.; Martínez-Sánchez, J.; Lorenzo, H. Automatic point cloud coarse registration using geometric keypoint descriptors for indoor scenes. Autom. Constr. 2017, 81, 134–148. [Google Scholar] [CrossRef]
- Li, J.; Yang, B.; Chen, C.; Huang, R.; Dong, Z.; Xiao, W. Automatic registration of panoramic image sequence and mobile laser scanning data using semantic features. ISPRS J. Photogramm. Remote Sens. 2018, 136, 41–57. [Google Scholar] [CrossRef] [Green Version]
- Guislain, M.; Digne, J.; Chaine, R.; Monnier, G. Fine scale image registration in large-scale urban lidar point sets. Comput. Vis. Image Underst. 2017, 157, 90–102. [Google Scholar] [CrossRef]
- Yao, L.; Wu, H.; Li, Y.; Meng, B.; Qian, J.; Liu, C.; Fan, H. Registration of vehicle-borne point clouds and panoramic images based on sensor constellations. Sensors 2017, 17, 837. [Google Scholar] [CrossRef] [PubMed]
- Man, Q.; Dong, P.; Guo, H. Pixel- and feature-level fusion of hyperspectral and lidar data for urban land-use classification. Int. J. Remote Sens. 2015, 36, 1618–1644. [Google Scholar] [CrossRef]
- Parent, J.R.; Volin, J.C.; Civco, D.L. A fully-automated approach to land cover mapping with airborne lidar and high resolution multispectral imagery in a forested suburban landscape. ISPRS J. Photogramm. Remote Sens. 2015, 104, 18–29. [Google Scholar] [CrossRef]
- Huang, H.; Chen, Y.; Clinton, N.; Wang, J.; Wang, X.; Liu, C.; Gong, P.; Yang, J.; Bai, Y.; Zheng, Y.; et al. Mapping major land cover dynamics in beijing using all landsat images in google earth engine. Remote Sens. Environ. 2017, 202, 166–176. [Google Scholar] [CrossRef]
- Zhang, W.; Li, W.; Zhang, C.; Hanink, D.M.; Li, X.; Wang, W. Parcel-based urban land use classification in megacity using airborne lidar, high resolution orthoimagery, and google street view. Comput. Environ. Urban Syst. 2017, 64, 215–228. [Google Scholar] [CrossRef]
- Wang, H.; Glennie, C. Fusion of waveform lidar data and hyperspectral imagery for land cover classification. ISPRS J. Photogramm. Remote Sens. 2015, 108, 1–11. [Google Scholar] [CrossRef]
- Singh, K.K.; Vogler, J.B.; Shoemaker, D.A.; Meentemeyer, R.K. Lidar-landsat data fusion for large-area assessment of urban land cover: Balancing spatial resolution, data volume and mapping accuracy. ISPRS J. Photogramm. Remote Sens. 2012, 74, 110–121. [Google Scholar] [CrossRef]
- Zhou, G.; Zhou, X. Seamless fusion of lidar and aerial imagery for building extraction. IEEE Trans. Geosci. Remote Sens. 2014, 52, 7393–7407. [Google Scholar] [CrossRef]
- Li, J.; Yang, B.; Wu, W.; Dai, W.; Chen, C.; Zou, X.; Tian, M. 3D mobile mapping with a low cost uav system. ISPRS Int. Arch. Photogramm. Remote Sens. Spat. Inf. Sci. 2017, 42, 127–132. [Google Scholar] [CrossRef]
- Qin, Y.C.; Li, S.H.; Vu, T.T.; Niu, Z.; Ban, Y.F. Synergistic application of geometric and radiometric features of lidar data for urban land cover mapping. Opt. Express 2015, 23, 13761–13775. [Google Scholar] [CrossRef]
- Zhu, L.; Hyyppa, J. The use of airborne and mobile laser scanning for modeling railway environments in 3d. Remote Sens. 2014, 6, 3075–3100. [Google Scholar] [CrossRef]
- Zhang, R.; Li, G.; Li, M.; Wang, L. Fusion of images and point clouds for the semantic segmentation of large-scale 3d scenes based on deep learning. ISPRS J. Photogramm. Remote Sens. 2018, 143, 85–96. [Google Scholar] [CrossRef]
- Budzan, S.; Kasprzyk, J. Fusion of 3d laser scanner and depth images for obstacle recognition in mobile applications. Opt. Lasers Eng. 2016, 77, 230–240. [Google Scholar] [CrossRef]
- Xiao, L.; Wang, R.; Dai, B.; Fang, Y.; Liu, D.; Wu, T. Hybrid conditional random field based camera-lidar fusion for road detection. Inf. Sci. 2018, 432, 543–558. [Google Scholar] [CrossRef]
- Boussaha, M.; Fernandez-Moral, E.; Vallet, B.; Rives, P. On the production of semantic and textured 3d meshes of large scale urban environments from mobile mapping images and lidar scans. In Proceedings of the Reconnaissance des Formes, Image, Apprentissage et Perception (RFIAP), Marne-la-Vallée, France, 26–28 June 2018. [Google Scholar]
- Babahajiani, P.; Fan, L.X.; Kamarainen, J.K.; Gabbouj, M. Urban 3d segmentation and modelling from street view images and lidar point clouds. Mach. Vis. Appl. 2017, 28, 679–694. [Google Scholar] [CrossRef]
- Biljecki, F.; Stoter, J.; Ledoux, H.; Zlatanova, S.; Çöltekin, A. Applications of 3d city models: State of the art review. ISPRS Int. J. Geo-Inf. 2015, 4, 2842–2889. [Google Scholar] [CrossRef]
- Heo, J.; Jeong, S.; Park, H.-K.; Jung, J.; Han, S.; Hong, S.; Sohn, H.-G. Productive high-complexity 3d city modeling with point clouds collected from terrestrial lidar. Comput. Environ. Urban Syst. 2013, 41, 26–38. [Google Scholar] [CrossRef]
- Wang, J.; Xu, K. Shape detection from raw lidar data with subspace modeling. IEEE Trans. Vis. Comput. Graph. 2017, 23, 2137–2150. [Google Scholar] [CrossRef] [PubMed]
- Kurazume, R.; Oshima, S.; Nagakura, S.; Jeong, Y.; Iwashita, Y. Automatic large-scale three dimensional modeling using cooperative multiple robots. Comput. Vis. Image Underst. 2017, 157, 25–42. [Google Scholar] [CrossRef] [Green Version]
- Zhao, Y.; Chai, X.; Gao, F.; Qi, C. Obstacle avoidance and motion planning scheme for a hexapod robot octopus-III. Robot. Auton. Syst. 2018, 103, 199–212. [Google Scholar] [CrossRef]
- Yan, L.; Liu, H.; Tan, J.; Li, Z.; Chen, C. A multi-constraint combined method for ground surface point filtering from mobile lidar point clouds. Remote Sens. 2017, 9, 958. [Google Scholar] [CrossRef]
- Wang, Y.; Chen, Q.; Liu, L.; Li, X.; Sangaiah, A.K.; Li, K. Systematic comparison of power line classification methods from als and mls point cloud data. Remote Sens. 2018, 10, 1222. [Google Scholar] [CrossRef]
- Yadav, M.; Chousalkar, C.G. Extraction of power lines using mobile lidar data of roadway environment. Remote Sens. Appl. Soc. Environ. 2017, 8, 258–265. [Google Scholar] [CrossRef]
- Lin, Y.; Hyyppä, J. Geometrically modeling 2d scattered points: A review of the potential for methodologically improving mobile laser scanning in data processing. Int. J. Digit. Earth 2014, 7, 432–449. [Google Scholar] [CrossRef]
- Wang, Z.; Zhang, L.; Zhang, L.; Li, R.; Zheng, Y.; Zhu, Z. A deep neural network with spatial pooling (dnnsp) for 3-d point cloud classification. IEEE Trans. Geosci. Remote Sens. 2018, 56, 4594–4604. [Google Scholar] [CrossRef]
- Zhao, R.; Pang, M.; Wang, J. Classifying airborne lidar point clouds via deep features learned by a multi-scale convolutional neural network. Int. J. Geogr. Inf. Sci. 2018, 32, 960–979. [Google Scholar] [CrossRef]
- Zhang, L.; Zhang, L. Deep learning-based classification and reconstruction of residential scenes from large-scale point clouds. IEEE Trans. Geosci. Remote Sens. 2017, 56, 1887–1897. [Google Scholar] [CrossRef]
- Qi, C.R.; Su, H.; Mo, K.; Guibas, L.J. Pointnet: Deep learning on point sets for 3d classification and segmentation. In Proceedings of the 2017 IEEE Conference on Computer Vision and Pattern Recognition (CVPR), Honolulu, HI, USA, 21–26 July 2017. [Google Scholar]
- Hu, X.; Yuan, Y. Deep-learning-based classification for dtm extraction from als point cloud. Remote Sens. 2016, 8, 730. [Google Scholar] [CrossRef]
- Li, W.; Fu, H.; Yu, L.; Cracknell, A. Deep learning based oil palm tree detection and counting for high-resolution remote sensing images. Remote Sens. 2016, 9, 22. [Google Scholar] [CrossRef]
- Zhao, W.; Du, S. Learning multiscale and deep representations for classifying remotely sensed imagery. ISPRS J. Photogramm. Remote Sens. 2016, 113, 155–165. [Google Scholar] [CrossRef]
- Li, Y.; Xie, W.; Li, H. Hyperspectral image reconstruction by deep convolutional neural network for classification. Pattern Recognit. 2017, 63, 371–383. [Google Scholar] [CrossRef]
- Paoletti, M.E.; Haut, J.M.; Plaza, J.; Plaza, A. A new deep convolutional neural network for fast hyperspectral image classification. ISPRS J. Photogramm. Remote Sens. 2018, 145, 120–147. [Google Scholar] [CrossRef]
- Huang, B.; Zhao, B.; Song, Y. Urban land-use mapping using a deep convolutional neural network with high spatial resolution multispectral remote sensing imagery. Remote Sens. Environ. 2018, 214, 73–86. [Google Scholar] [CrossRef]
- Liu, X.; Jiao, L.; Zhao, J.; Zhao, J.; Zhang, D.; Liu, F.; Yang, S.; Tang, X. Deep multiple instance learning-based spatial–spectral classification for pan and ms imagery. IEEE Trans. Geosci. Remote Sens. 2018, 56, 461–473. [Google Scholar] [CrossRef]
- Lao, Y. Topology Based Classification of Mobile Laser Data with Conditional Random Fields. Master’s Thesis, University of Twente, Enschede, The Netherlands, 2016. [Google Scholar]
- Kang, Z.; Yang, J. A probabilistic graphical model for the classification of mobile lidar point clouds. ISPRS J. Photogramm. Remote Sens. 2018, 143, 108–123. [Google Scholar] [CrossRef]
- Diaz-Vilarino, L.; Gonzalez-Jorge, H.; Bueno, M.; Arias, P.; Puente, I. Automatic classification of urban pavements using mobile lidar data and roughness descriptors. Constr. Build. Mater. 2016, 102, 208–215. [Google Scholar] [CrossRef]
- Pu, S.; Zhan, Q. Classification of mobile terrestrial laser point clouds using semantic constraints. In Proceedings of the Videometrics, Range Imaging, and Applications X, San Diego, CA, USA, 2–3 August 2009; p. 74470D. [Google Scholar]


| Company | Product | Characteristics 1 | Application |
|---|---|---|---|
| SITECO | Road-Scanner 4 | Modular and scalable design: can integrate (1) up to three Faro Focus (range up to 350 m range at 90% reflectivity, measurement rate up to 976,000 points per second) laser-scanners, or two Z+F/RIEGL/ OPTECH laser scanners; (2) up to eight high resolution cameras or a spherical LadyBug5 camera; and (3) a wide range of GNSS-inertial systems. | Surveying and mapping for urban road inventories, infrastructure monitoring, and pavement management. |
| Pave-Scanner | Millimeter resolution pavement inspection | Inspect road cracks, lane markings, potholes, etc. | |
| TOPCON | IP-S3 | Includes (1) a single Velodyne HDL-32E (measurement rate of 700,000 points per second with a range of 100 m and 5–20 Hz frame rate) laser scanner, (2) a LadyBug5 spherical camera, and (3) a GNSS-inertial system consisting of a dual-frequency GNSS receiver, an IMU, and an vehicle wheel encoder. | Roadway surface condition assessments, pipelines, and utilities mapping, construction progress monitoring and risk management. |
| TRIMBLE | MX9 | Includes (1) one or two RIEGL VUX-1HA (measurement rate up to 1 million pulses per second, maximum range of 120 m at 10% reflectivity and 420 m at 80% reflectivity, scan speed of 10-250 lines per second) laser scanners, (2) one spherical camera, two side looking cameras, and one backward/downward looking camera, and (3) a Trimble AP60 or AP40 GNSS-Inertial system. Sensors weigh 31 kg (single scanner) to 37 kg (two scanners). | Surveying and mapping for road assets, cross sections, 3D models, and volumetric analysis. |
| 3D LASER MAPPING Ltd. | ROBIN | Can be switched among walk, drive, and fly modes and used across multiple platforms (backpack, vehicle, or aircraft). The basic system includes (1) a RIEGL VUX-1HA laser scanner, (2) a FLIR Grasshooper3 camera (12 MP), (3) dual GNSS receivers and a MEMS (Mico Electro-Mechanical System) IMU. For the drive mode, it can be extended with a LadyBug5 spherical camera, a FOG (fiber optical) IMU, and an optical odometer. | Walk & drive modes are applied for asset, heritage, and highway mapping, geohazard monitoring, urban asset management, and rail infrastructure mapping. |
| StreetMapperIV | Includes (1) one or two RIEGL VUX-1HA laser scanners, (2) a MEMS or FOG IMU, (3) a LadyBug spherical camera. | Asset mapping, city surveying, monitoring and change, detection, tunnel mapping, civil engineering, and surface maintenance. | |
| RIEGL | VMX-2HA | Includes (1) two RIEGL VUX-1HA laser sensors, (2) a modular camera system connecting up to nine cameras (either RIEGL, LadyBug 5+, or DSLR camera), (3) a high grade GNSS/IMU. | Transportation infrastructure and rail mapping, road surface measurements, city modeling, and as-built surveying. |
| Renishaw | Dynascan S250 | Includes (1) one or two patented laser scanners (maximum range 250 m, field of view 360°, range resolution 1 cm, scan rate up to 30 Hz, measurement rate 36,000 pulses/second per scanner), (2) up to 10 cameras (10 frame per second (fps) at 5MP or 30 fps at 1080p HD resolution), (3) an IMU and dual GNSS receivers. No need to use PC or external computer to operate due to its on-board Linux operation system. | Urban surveying and construction industry applications, such as utilities, transport / highway infrastructure surveys, urban brownfield updates and revamps. |
| OPTECH | Lynx HS600 | Includes (1) one or two OPTECH LiDAR sensors (up to 1.6 million pulses/second, 4 returns, and 600 lines per second per sensor, maximum range 250 m at 10% reflectivity), (2) a LadyBug5 spherical camera, (3) a GNSS/IMU system. | Urban asset, transportation, and utilities management, rail / civil engineering, urban mapping and modeling. |
| Hexagon / Leica | Leica Pegasus: Two Ultimate | Includes (1) a laser scanner of either Z+F 9012 PROFILER (Range 119 m, > 1 million pulses per second, 200 lines per second) or Leica ScanStation, (2) one spherical camera (24 MP with two fish-eye camera), four built-in frame cameras, and one or two optional external frame cameras, (3) a triple-band GNSS with single or dual antenna support, and a FOG IMU. | Improved smart city applications, survey-grade accurate reality capture, pavement assessment, underground assets detection with sensors (pavement camera and ground penetrating radar, etc.) |
| Integration level | Description | Advantage/Limitation | References |
|---|---|---|---|
| Low | First, processing MLS point clouds and other data sources, independently. Then, merging their respective intermediate information to obtain the final results. | The processing procedures are simple and easy. However, it should develop independent methods for different data sources. The accuracy of results is usually not very high. | [32,76,88,97,139,141,143] |
| Medium | First, processing one data source to obtain useful features or background knowledge. Then, based on this computed information, analyzing the other data to classify or extract final results. | The referenced information improves the accuracy of results. It is difficult to design and execute the serial procedures. It also needs the procedures to be much related. | [5,29,48,127,129,140,144] |
| High | First, computing and extracting features from MLS point clouds and other data sources, directly. Then, analyzing and classifying based on the concentrated features as one type of data source. | The processing could utilize adequately all the data sources and obtain high accuracy. It needs complex methods and professional knowledge. | [19,49,128,142] |
© 2019 by the authors. Licensee MDPI, Basel, Switzerland. This article is an open access article distributed under the terms and conditions of the Creative Commons Attribution (CC BY) license (http://creativecommons.org/licenses/by/4.0/).
Share and Cite
Wang, Y.; Chen, Q.; Zhu, Q.; Liu, L.; Li, C.; Zheng, D. A Survey of Mobile Laser Scanning Applications and Key Techniques over Urban Areas. Remote Sens. 2019, 11, 1540. https://doi.org/10.3390/rs11131540
Wang Y, Chen Q, Zhu Q, Liu L, Li C, Zheng D. A Survey of Mobile Laser Scanning Applications and Key Techniques over Urban Areas. Remote Sensing. 2019; 11(13):1540. https://doi.org/10.3390/rs11131540
Chicago/Turabian StyleWang, Yanjun, Qi Chen, Qing Zhu, Lin Liu, Chaokui Li, and Dunyong Zheng. 2019. "A Survey of Mobile Laser Scanning Applications and Key Techniques over Urban Areas" Remote Sensing 11, no. 13: 1540. https://doi.org/10.3390/rs11131540
APA StyleWang, Y., Chen, Q., Zhu, Q., Liu, L., Li, C., & Zheng, D. (2019). A Survey of Mobile Laser Scanning Applications and Key Techniques over Urban Areas. Remote Sensing, 11(13), 1540. https://doi.org/10.3390/rs11131540