Figure 1.
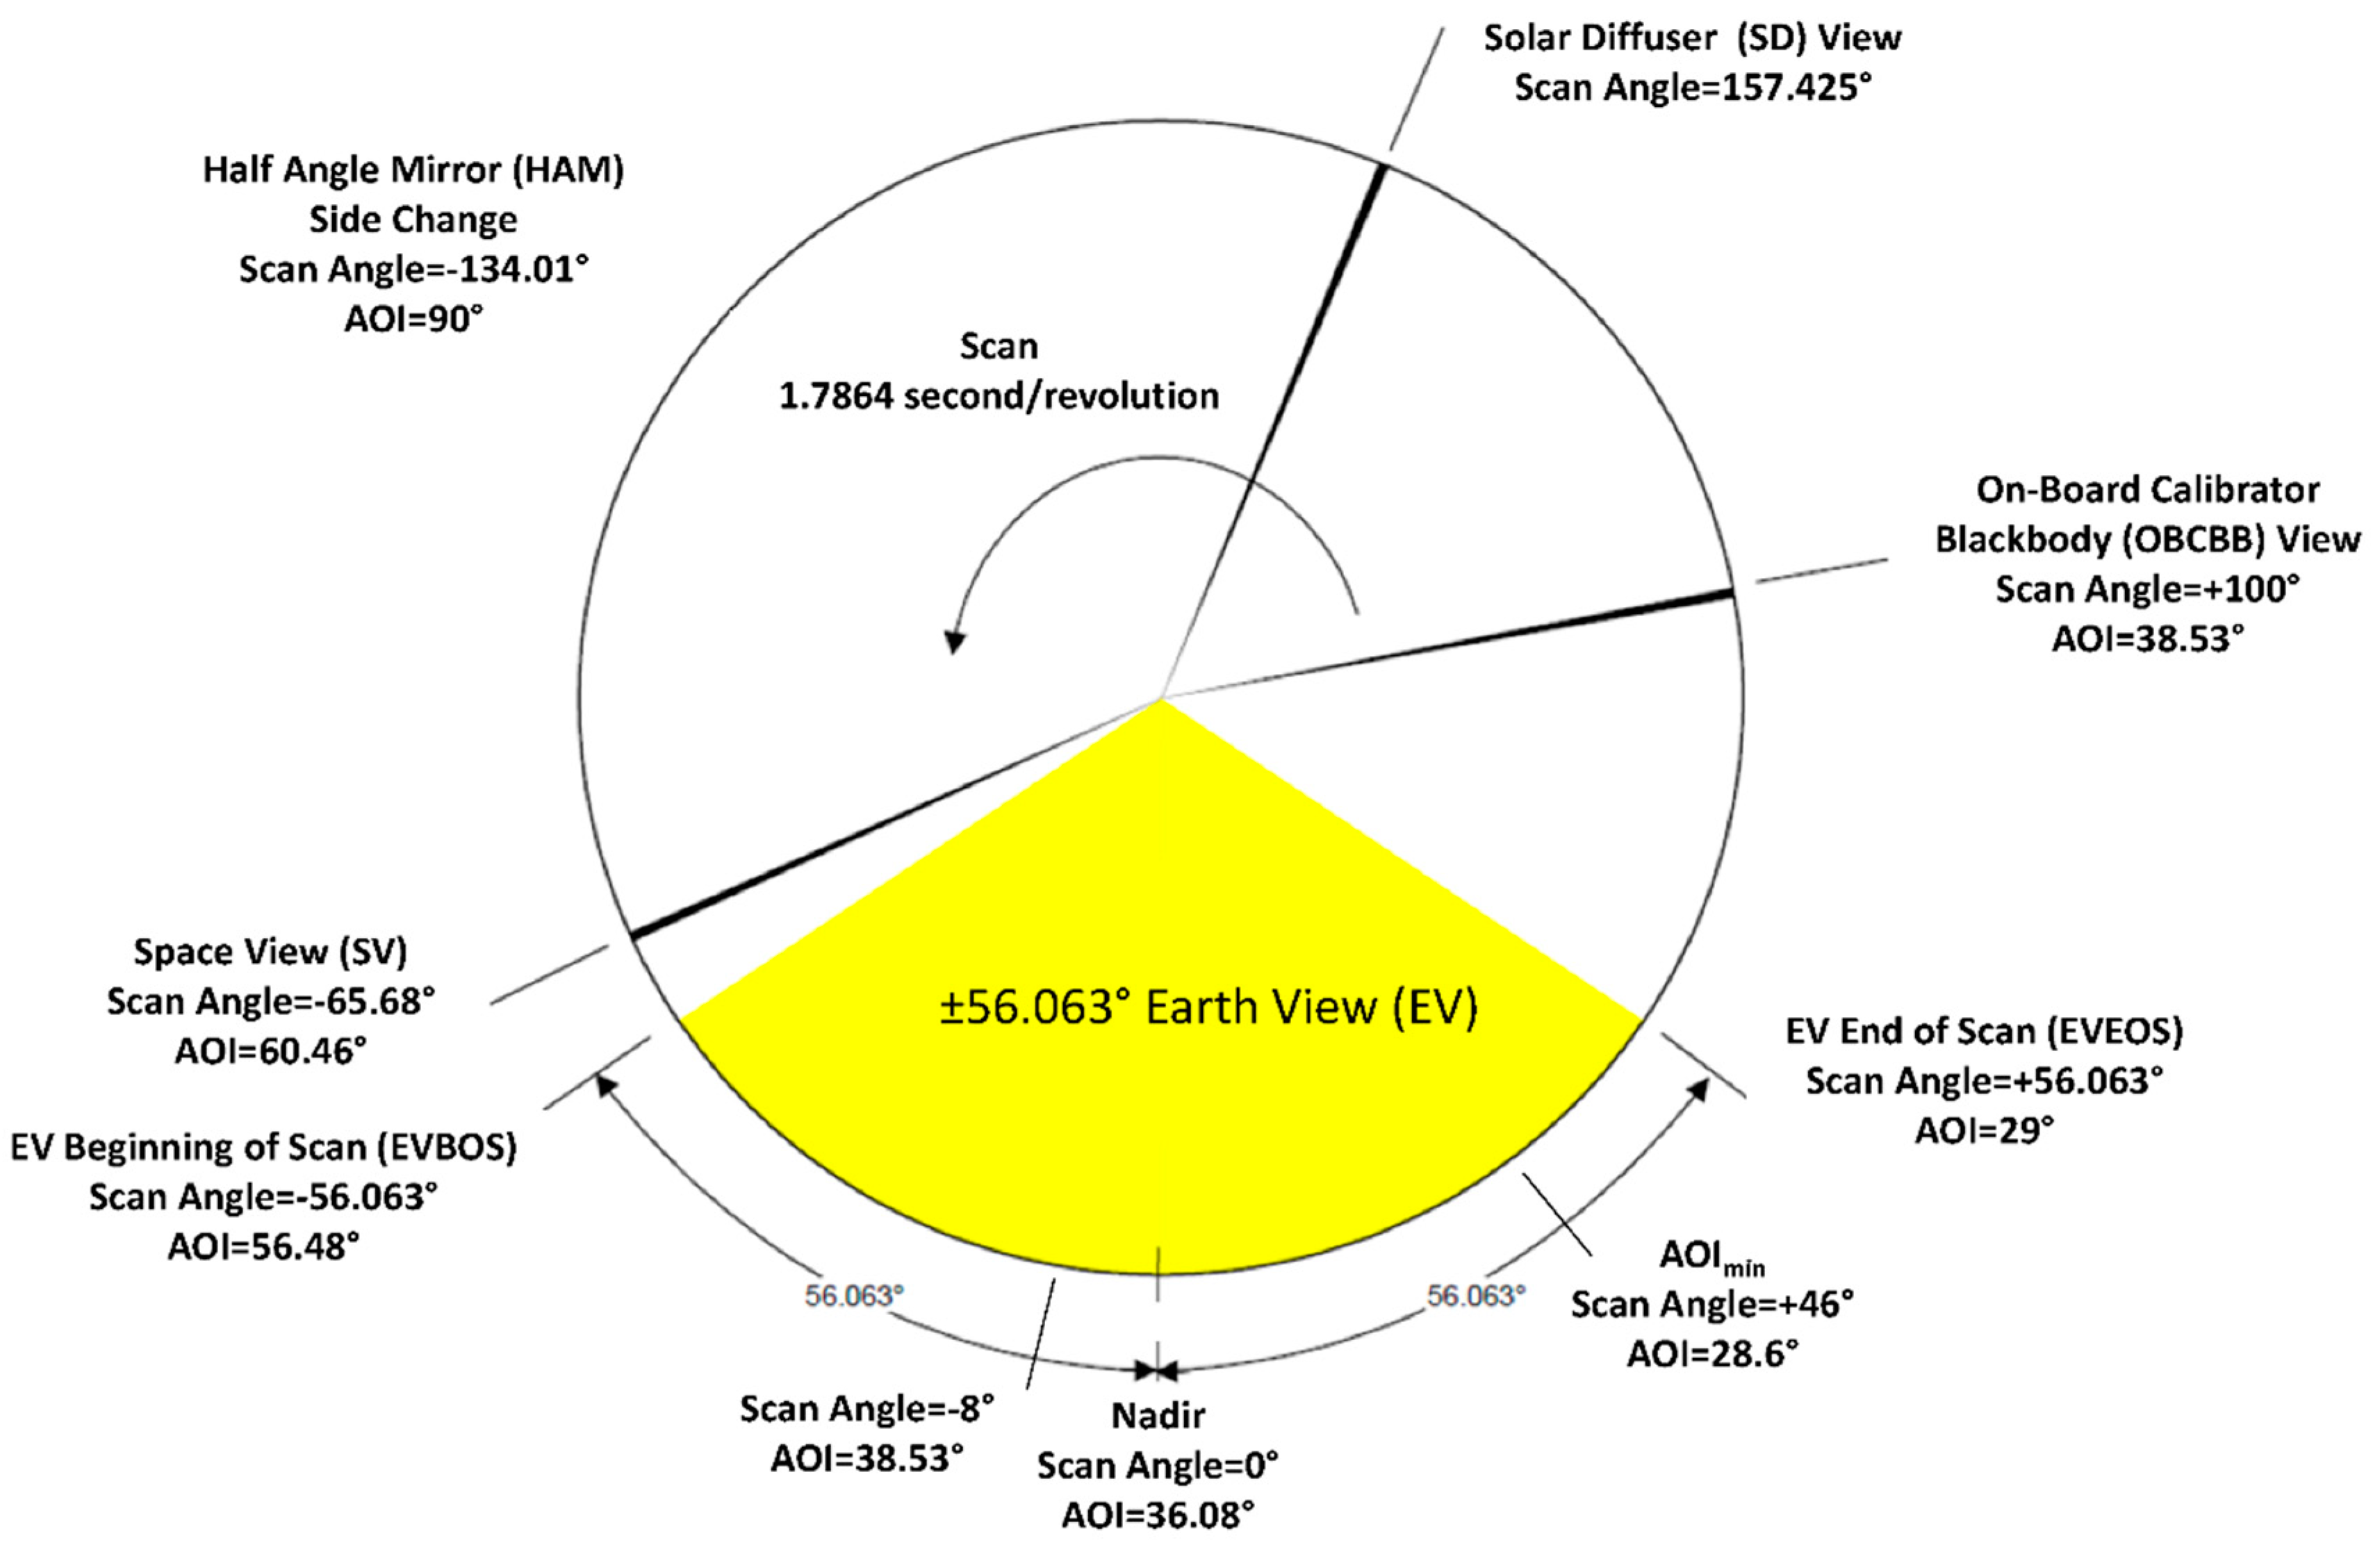
Diagram of Visible Infrared Imaging Radiometer Suite (VIIRS) scan pattern. Scan angles and angle of incidences (AOIs) at space view (SV), blackbody (OBCBB), the beginning of Earth View (EV) scan (EVBOS), nadir, the end of EV scan (EVEOS), and AOImin are also given.
Figure 1.
Diagram of Visible Infrared Imaging Radiometer Suite (VIIRS) scan pattern. Scan angles and angle of incidences (AOIs) at space view (SV), blackbody (OBCBB), the beginning of Earth View (EV) scan (EVBOS), nadir, the end of EV scan (EVEOS), and AOImin are also given.
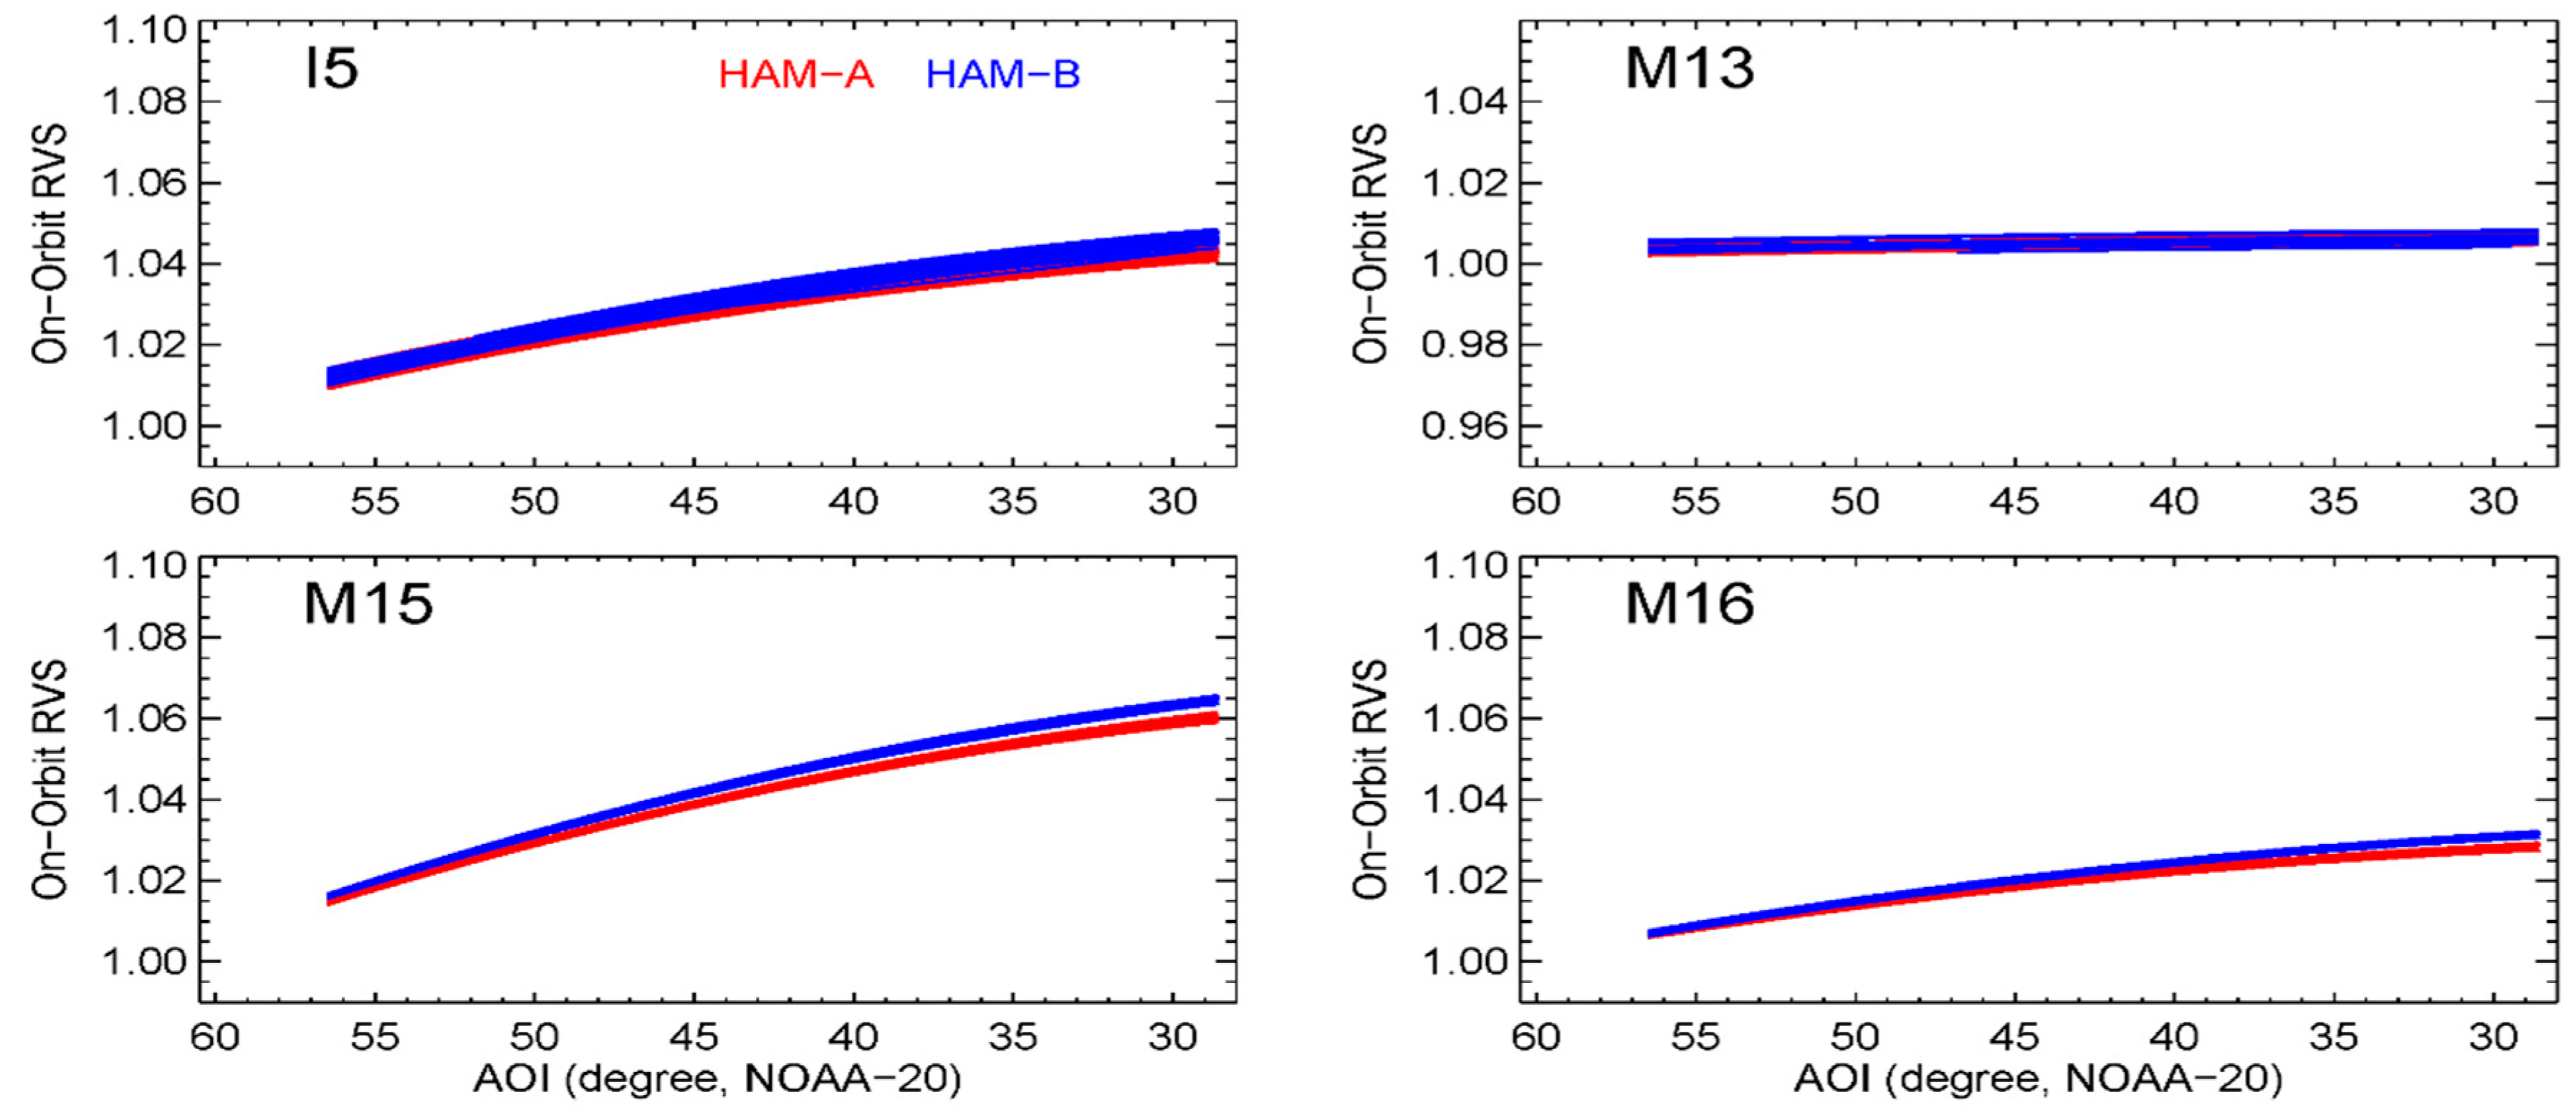
Figure 2.
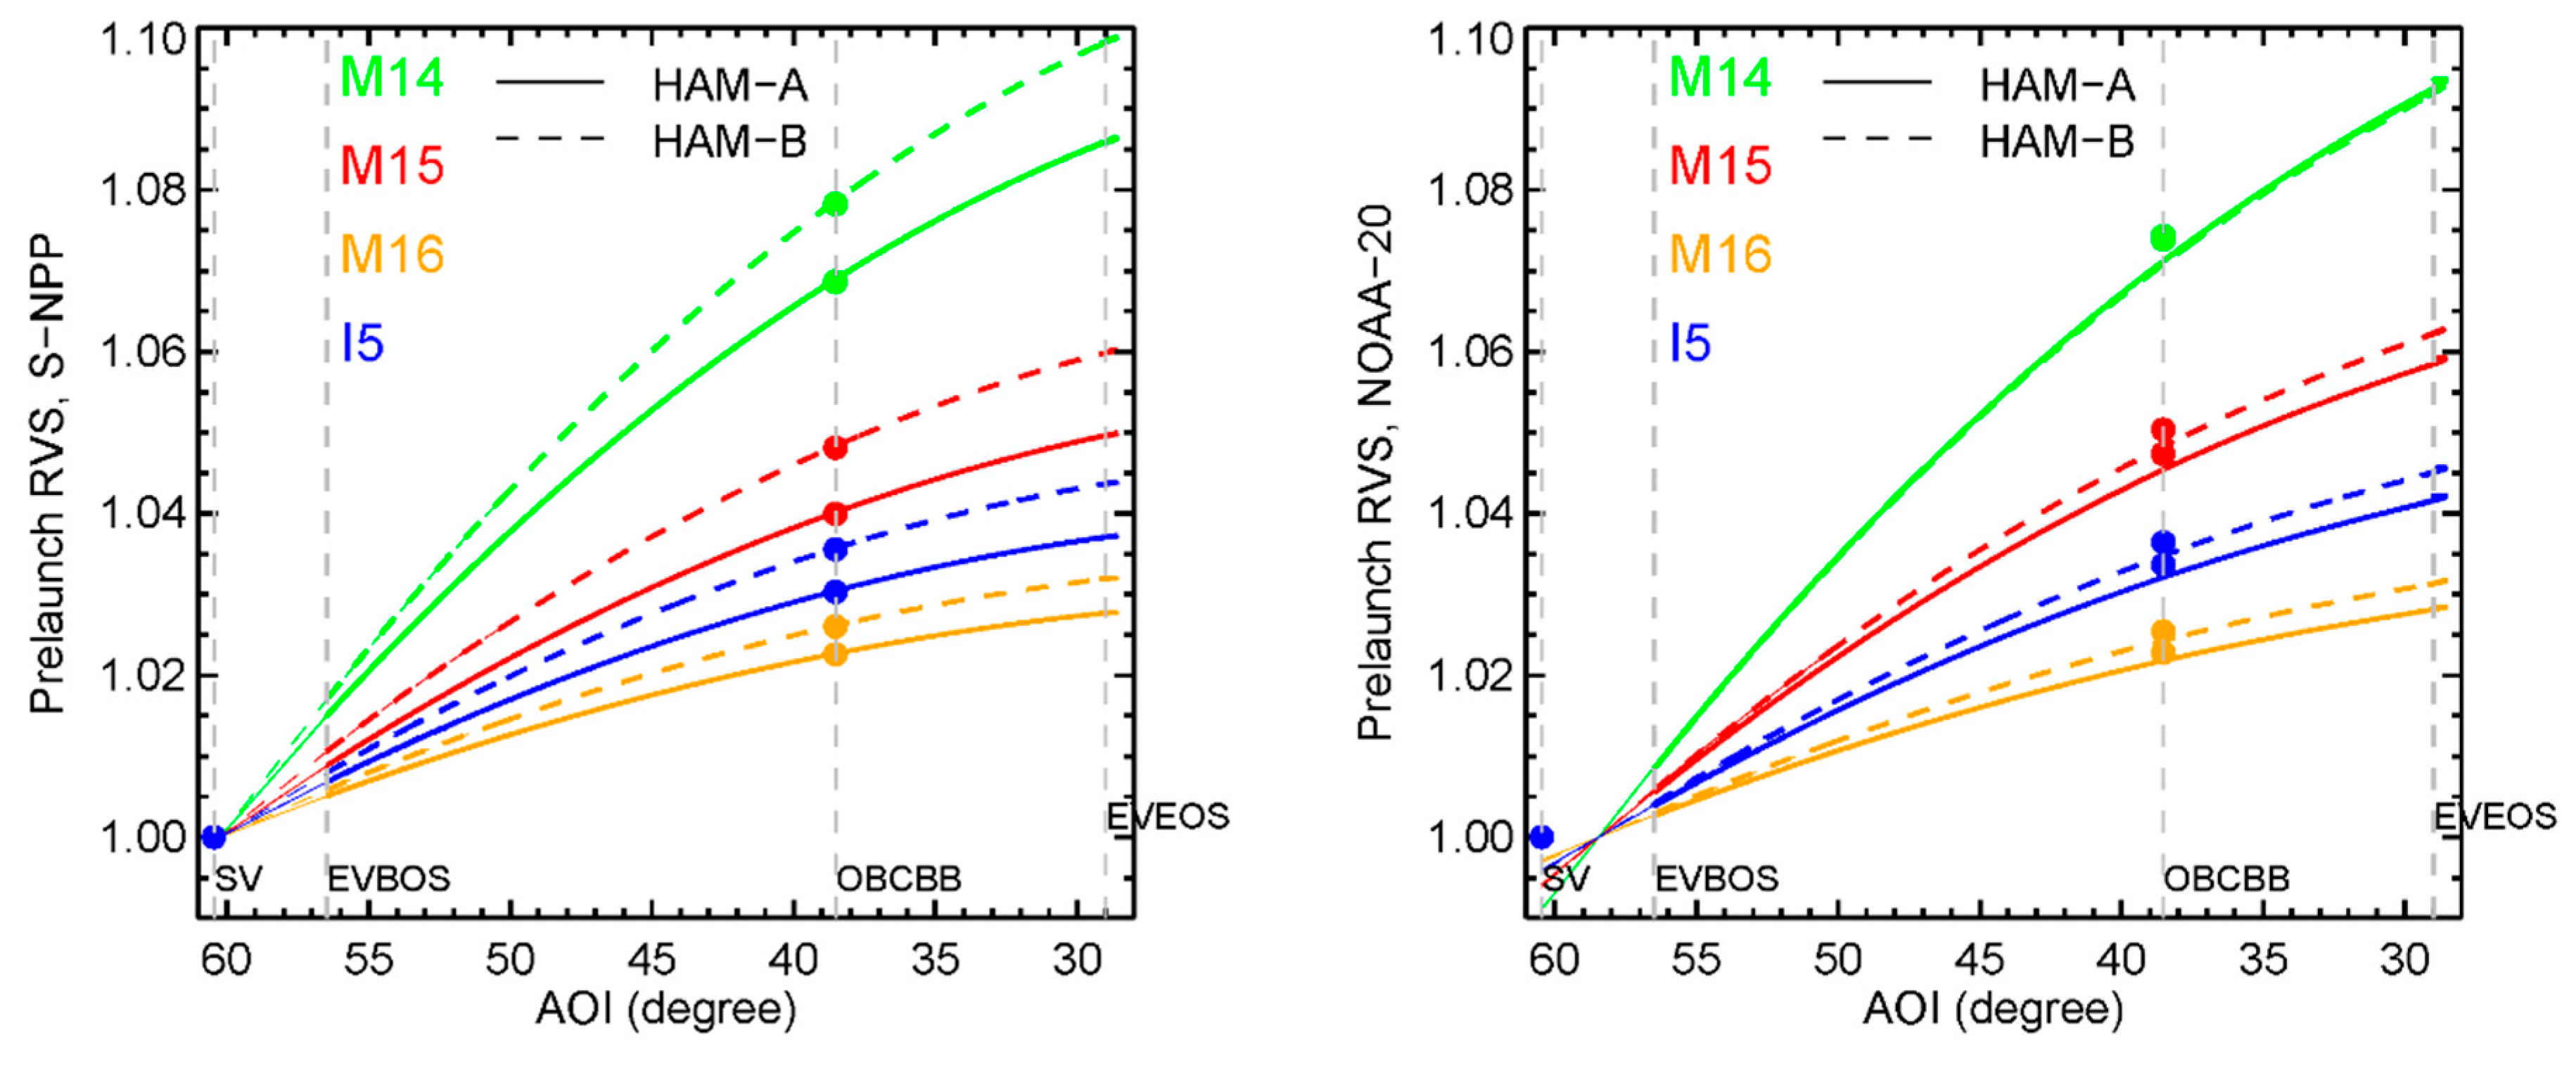
S-NPP and NOAA-20 band averaged Response Versus Scan (RVS) as functions of AOI for half angle mirror (HAM)-A (solid lines) and HAM-B (dash lines). The SV, EVBOS, EVEOS, and OBCBB AOIs are also marked.
Figure 2.
S-NPP and NOAA-20 band averaged Response Versus Scan (RVS) as functions of AOI for half angle mirror (HAM)-A (solid lines) and HAM-B (dash lines). The SV, EVBOS, EVEOS, and OBCBB AOIs are also marked.
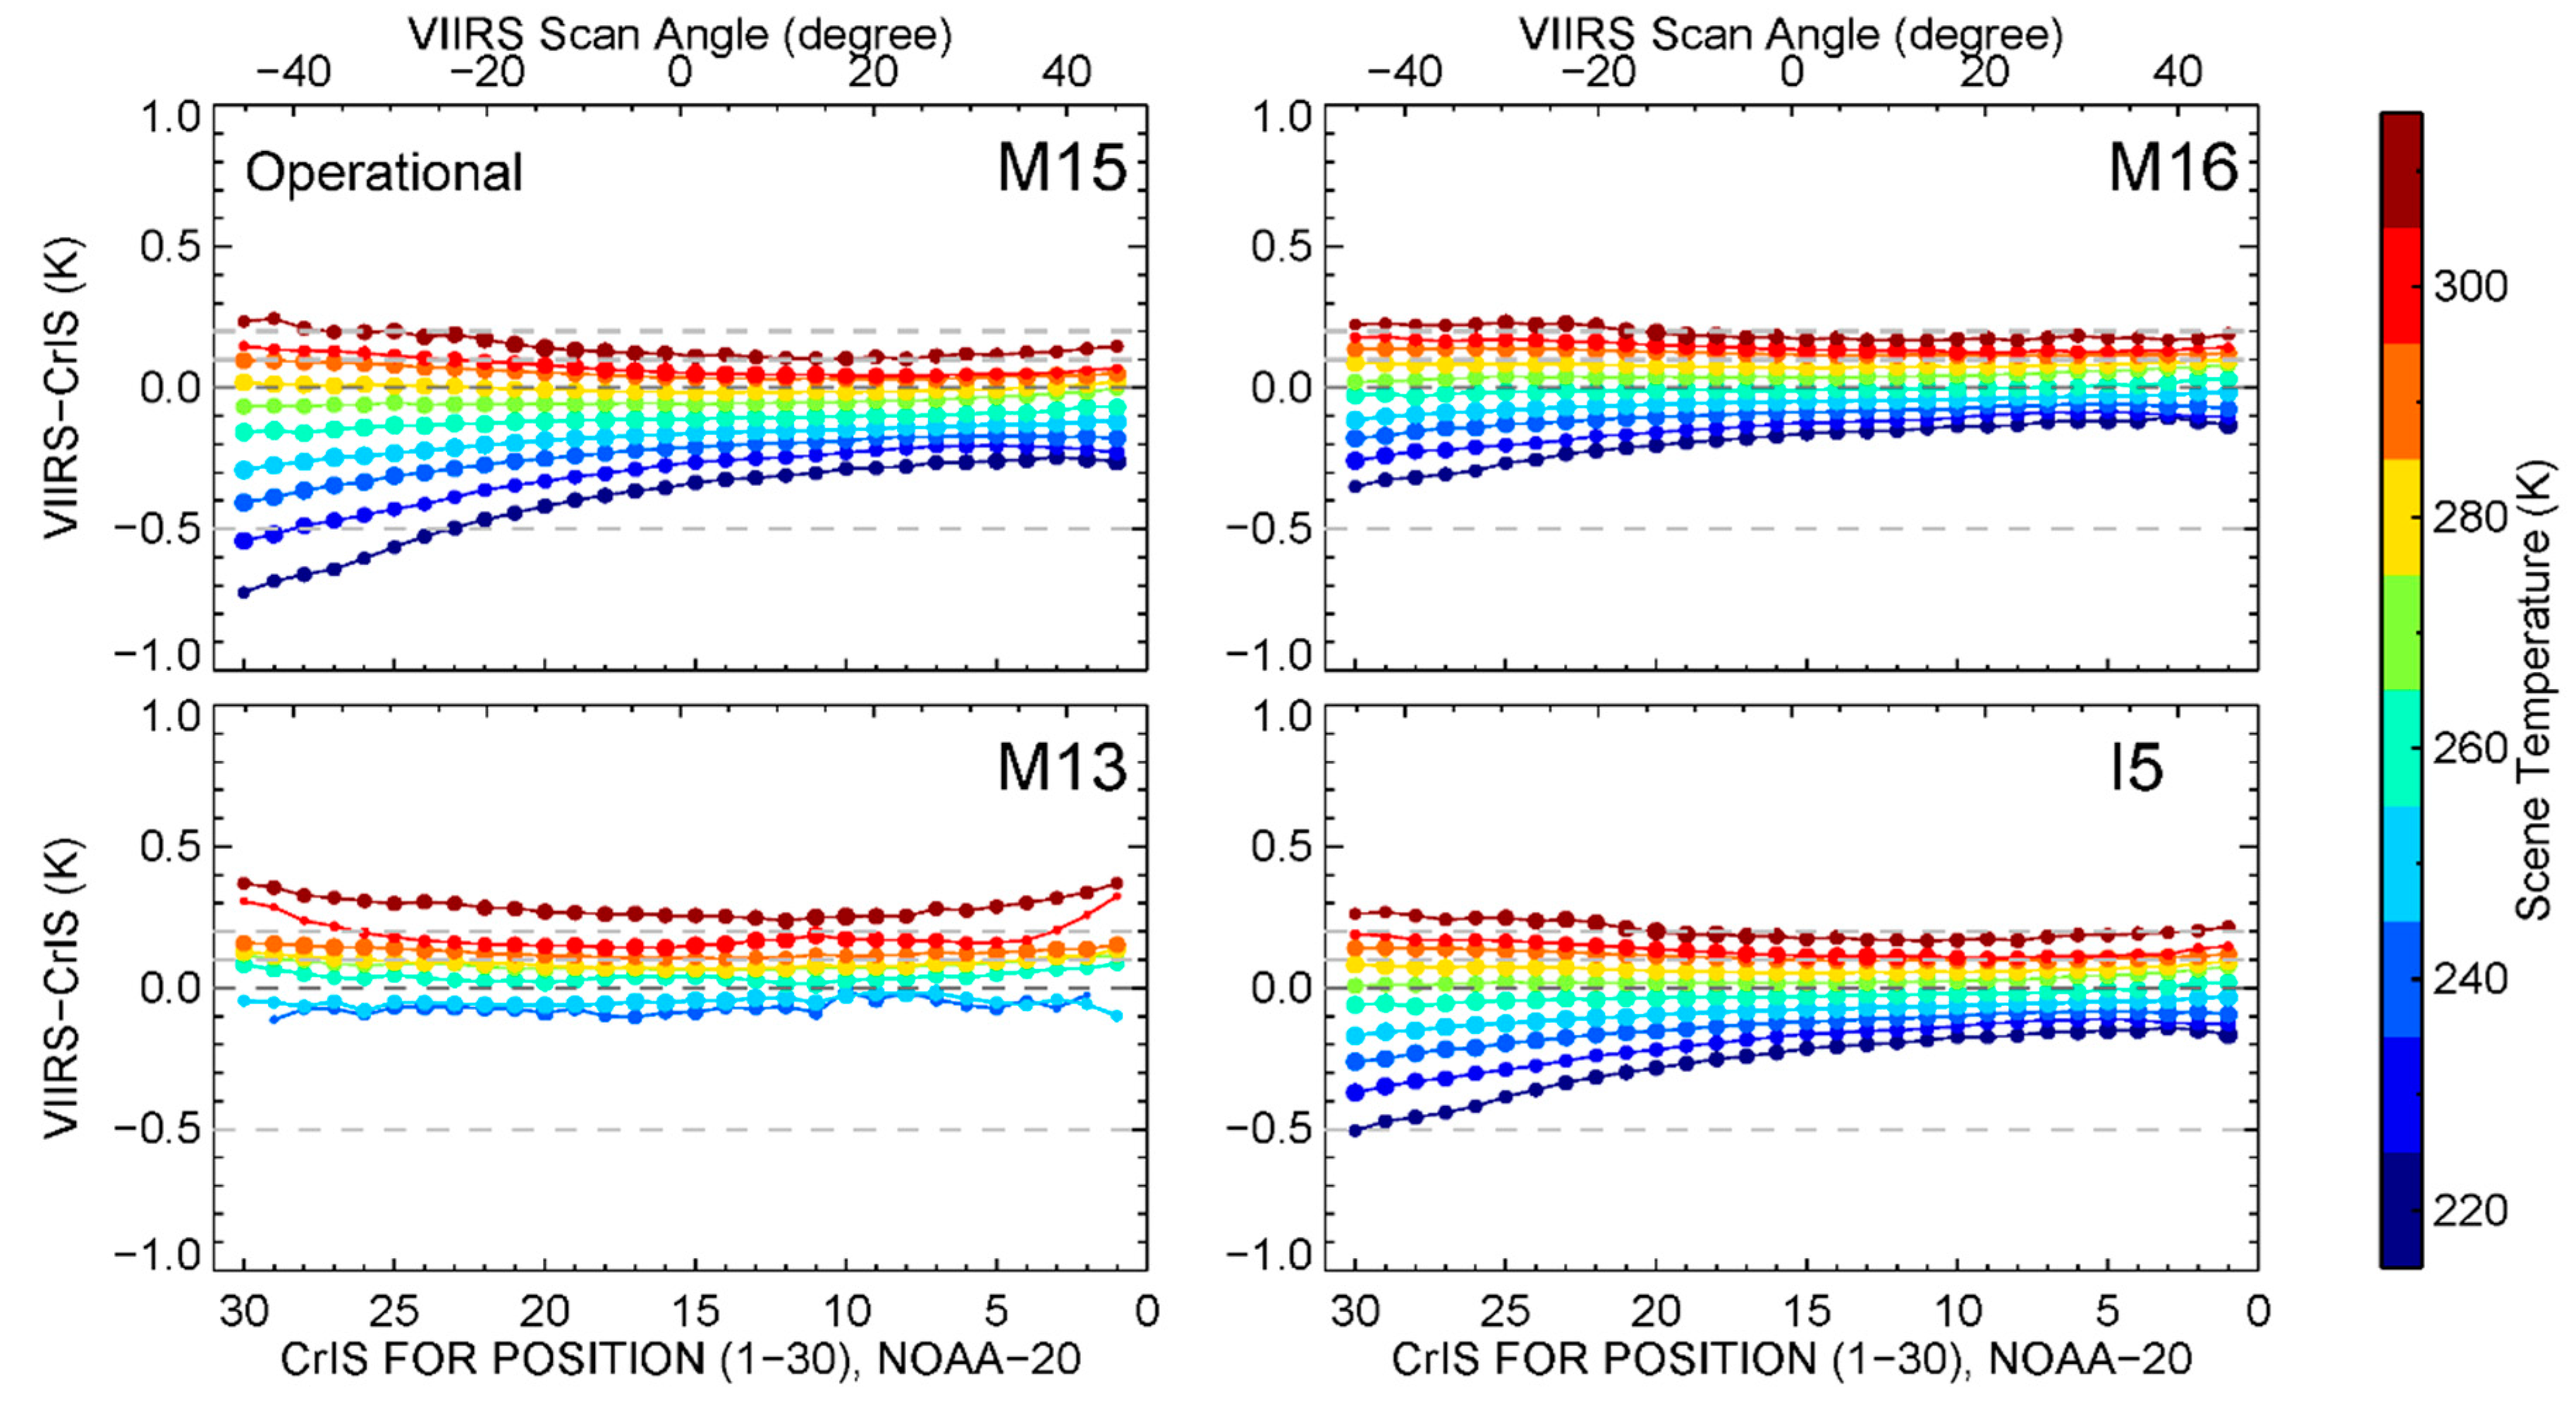
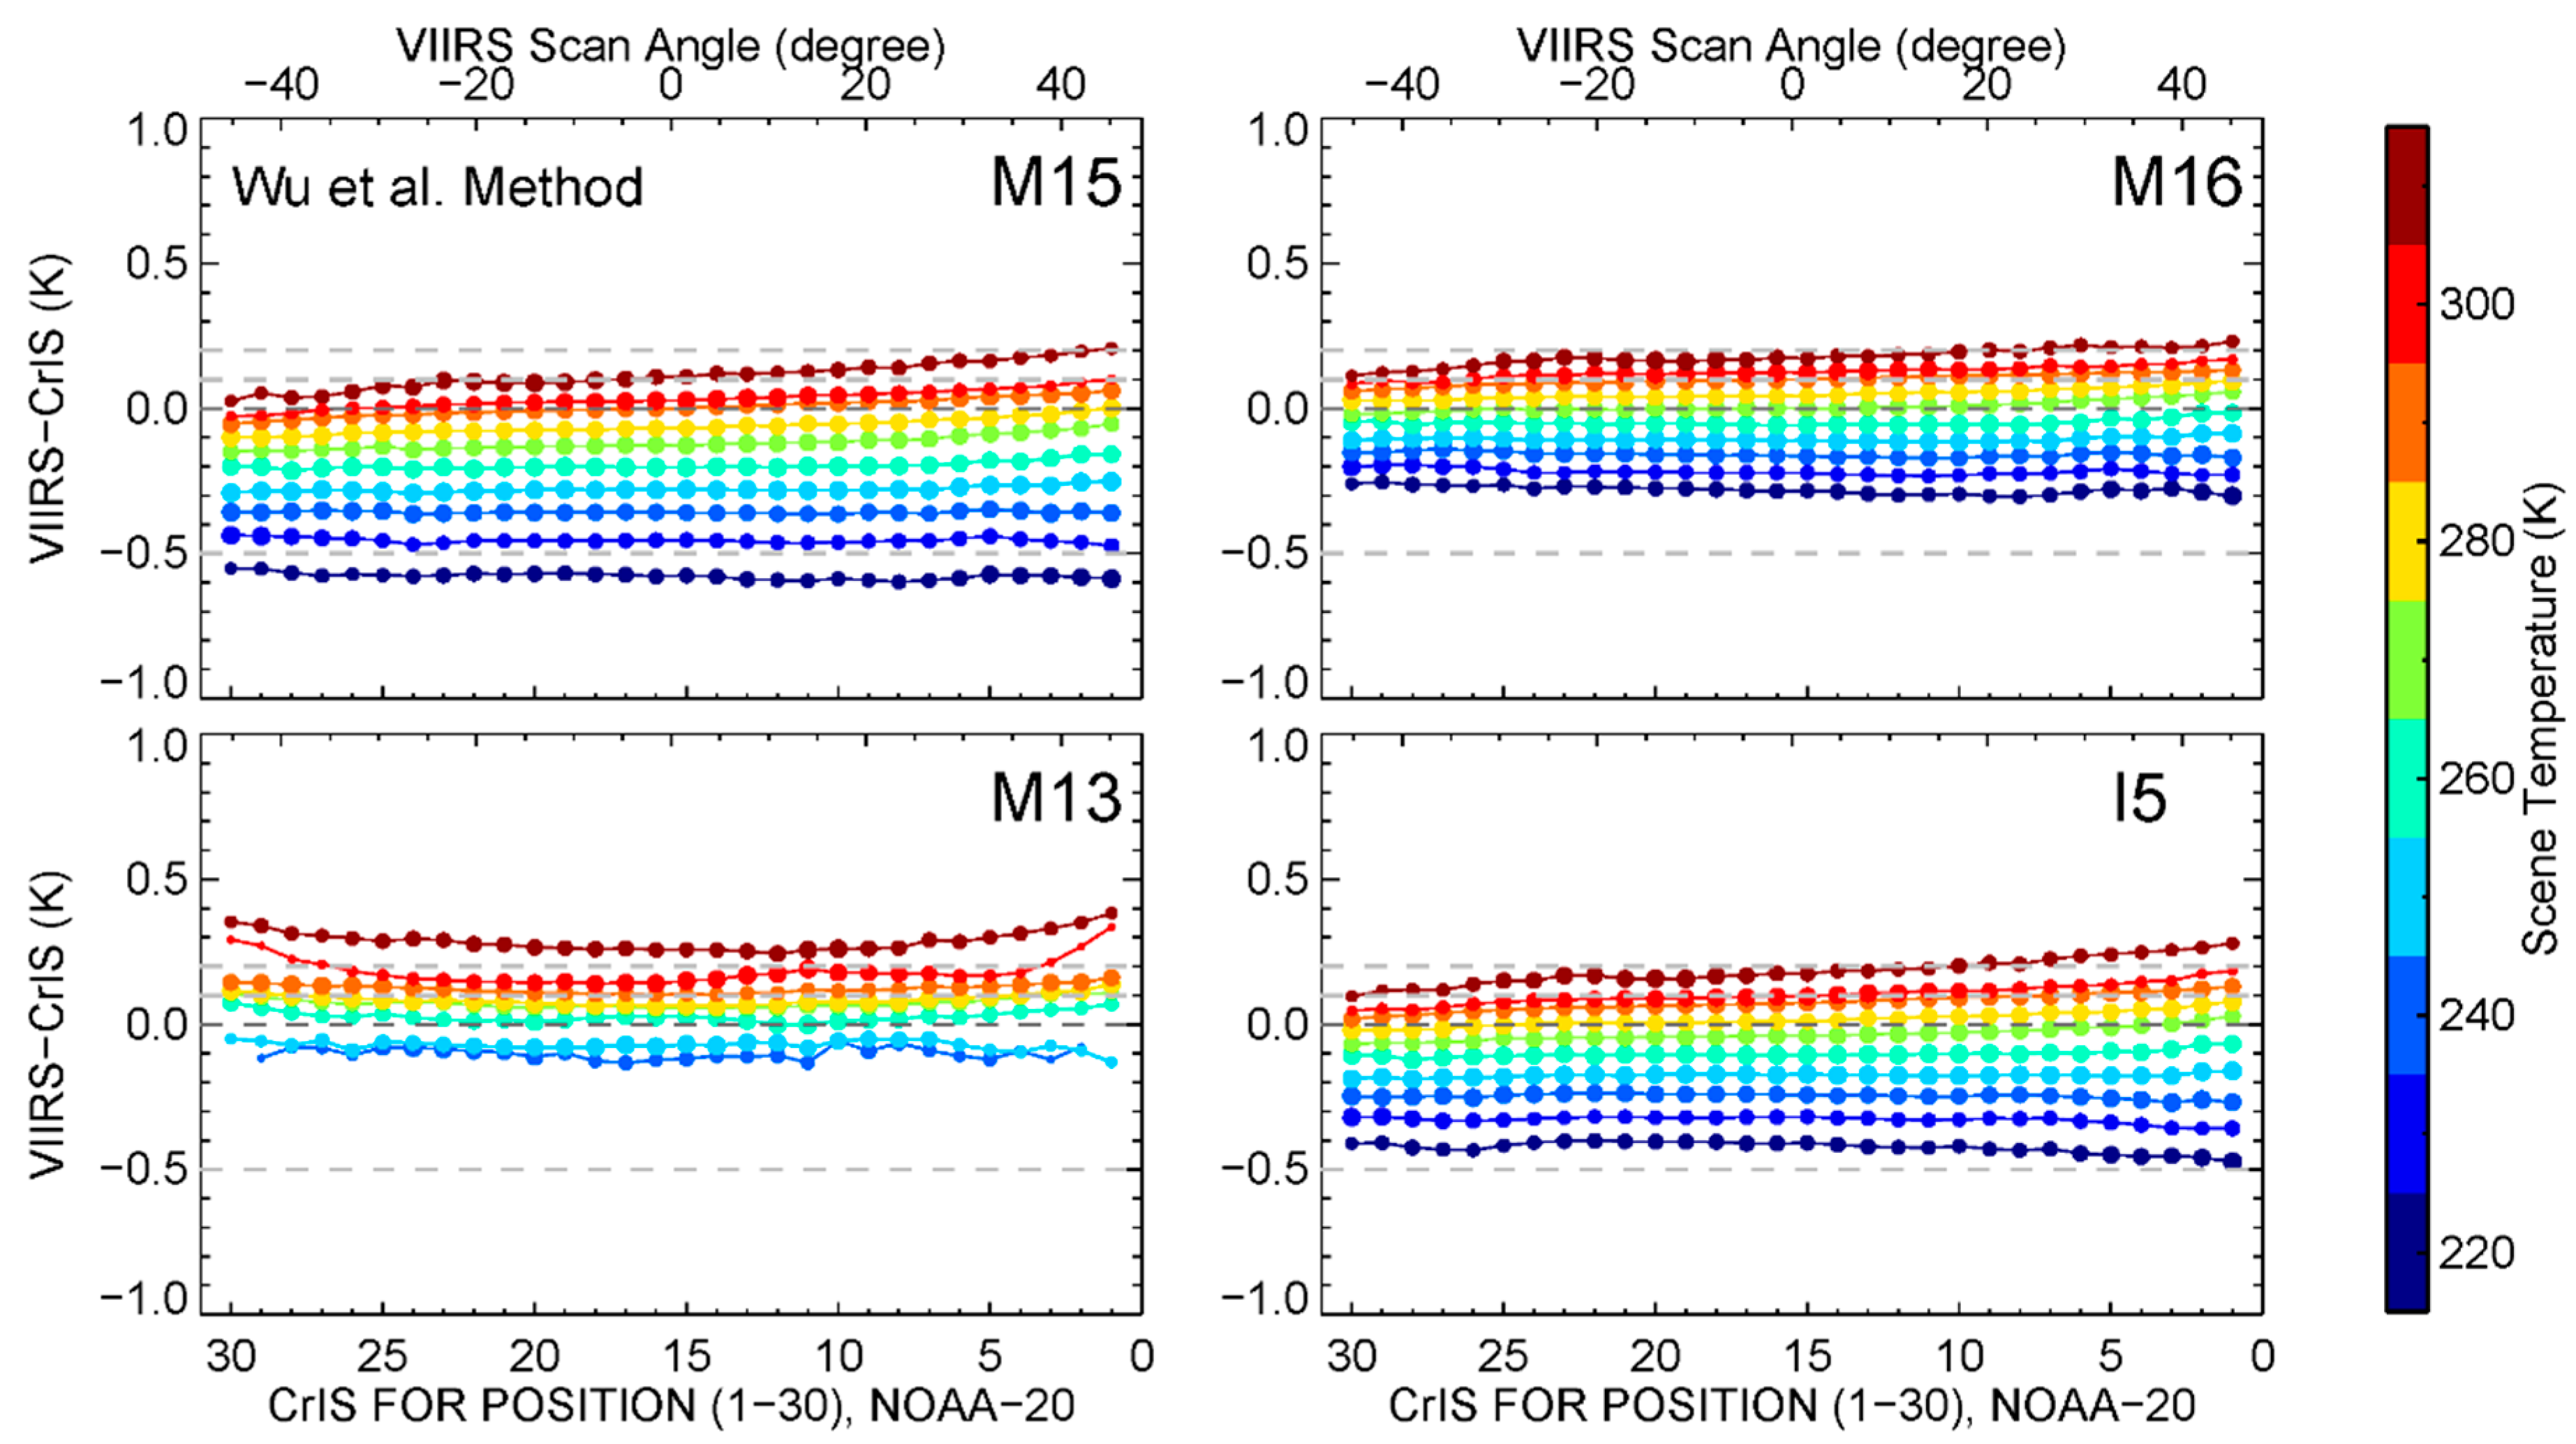
Figure 3.
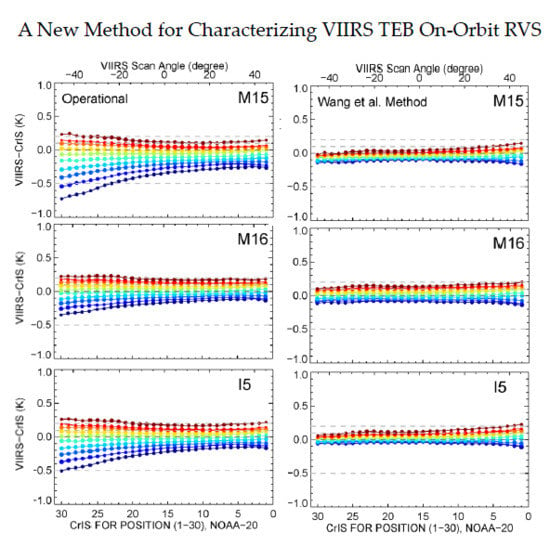
NOAA-20 VIIRS–CrIS BT differences at 10 scene temperatures and as function of CrIS FOR position and VIIRS scan angle. Under each scene temperature, the sizes of the filled circles are proportional to the number of data samples used.
Figure 3.
NOAA-20 VIIRS–CrIS BT differences at 10 scene temperatures and as function of CrIS FOR position and VIIRS scan angle. Under each scene temperature, the sizes of the filled circles are proportional to the number of data samples used.
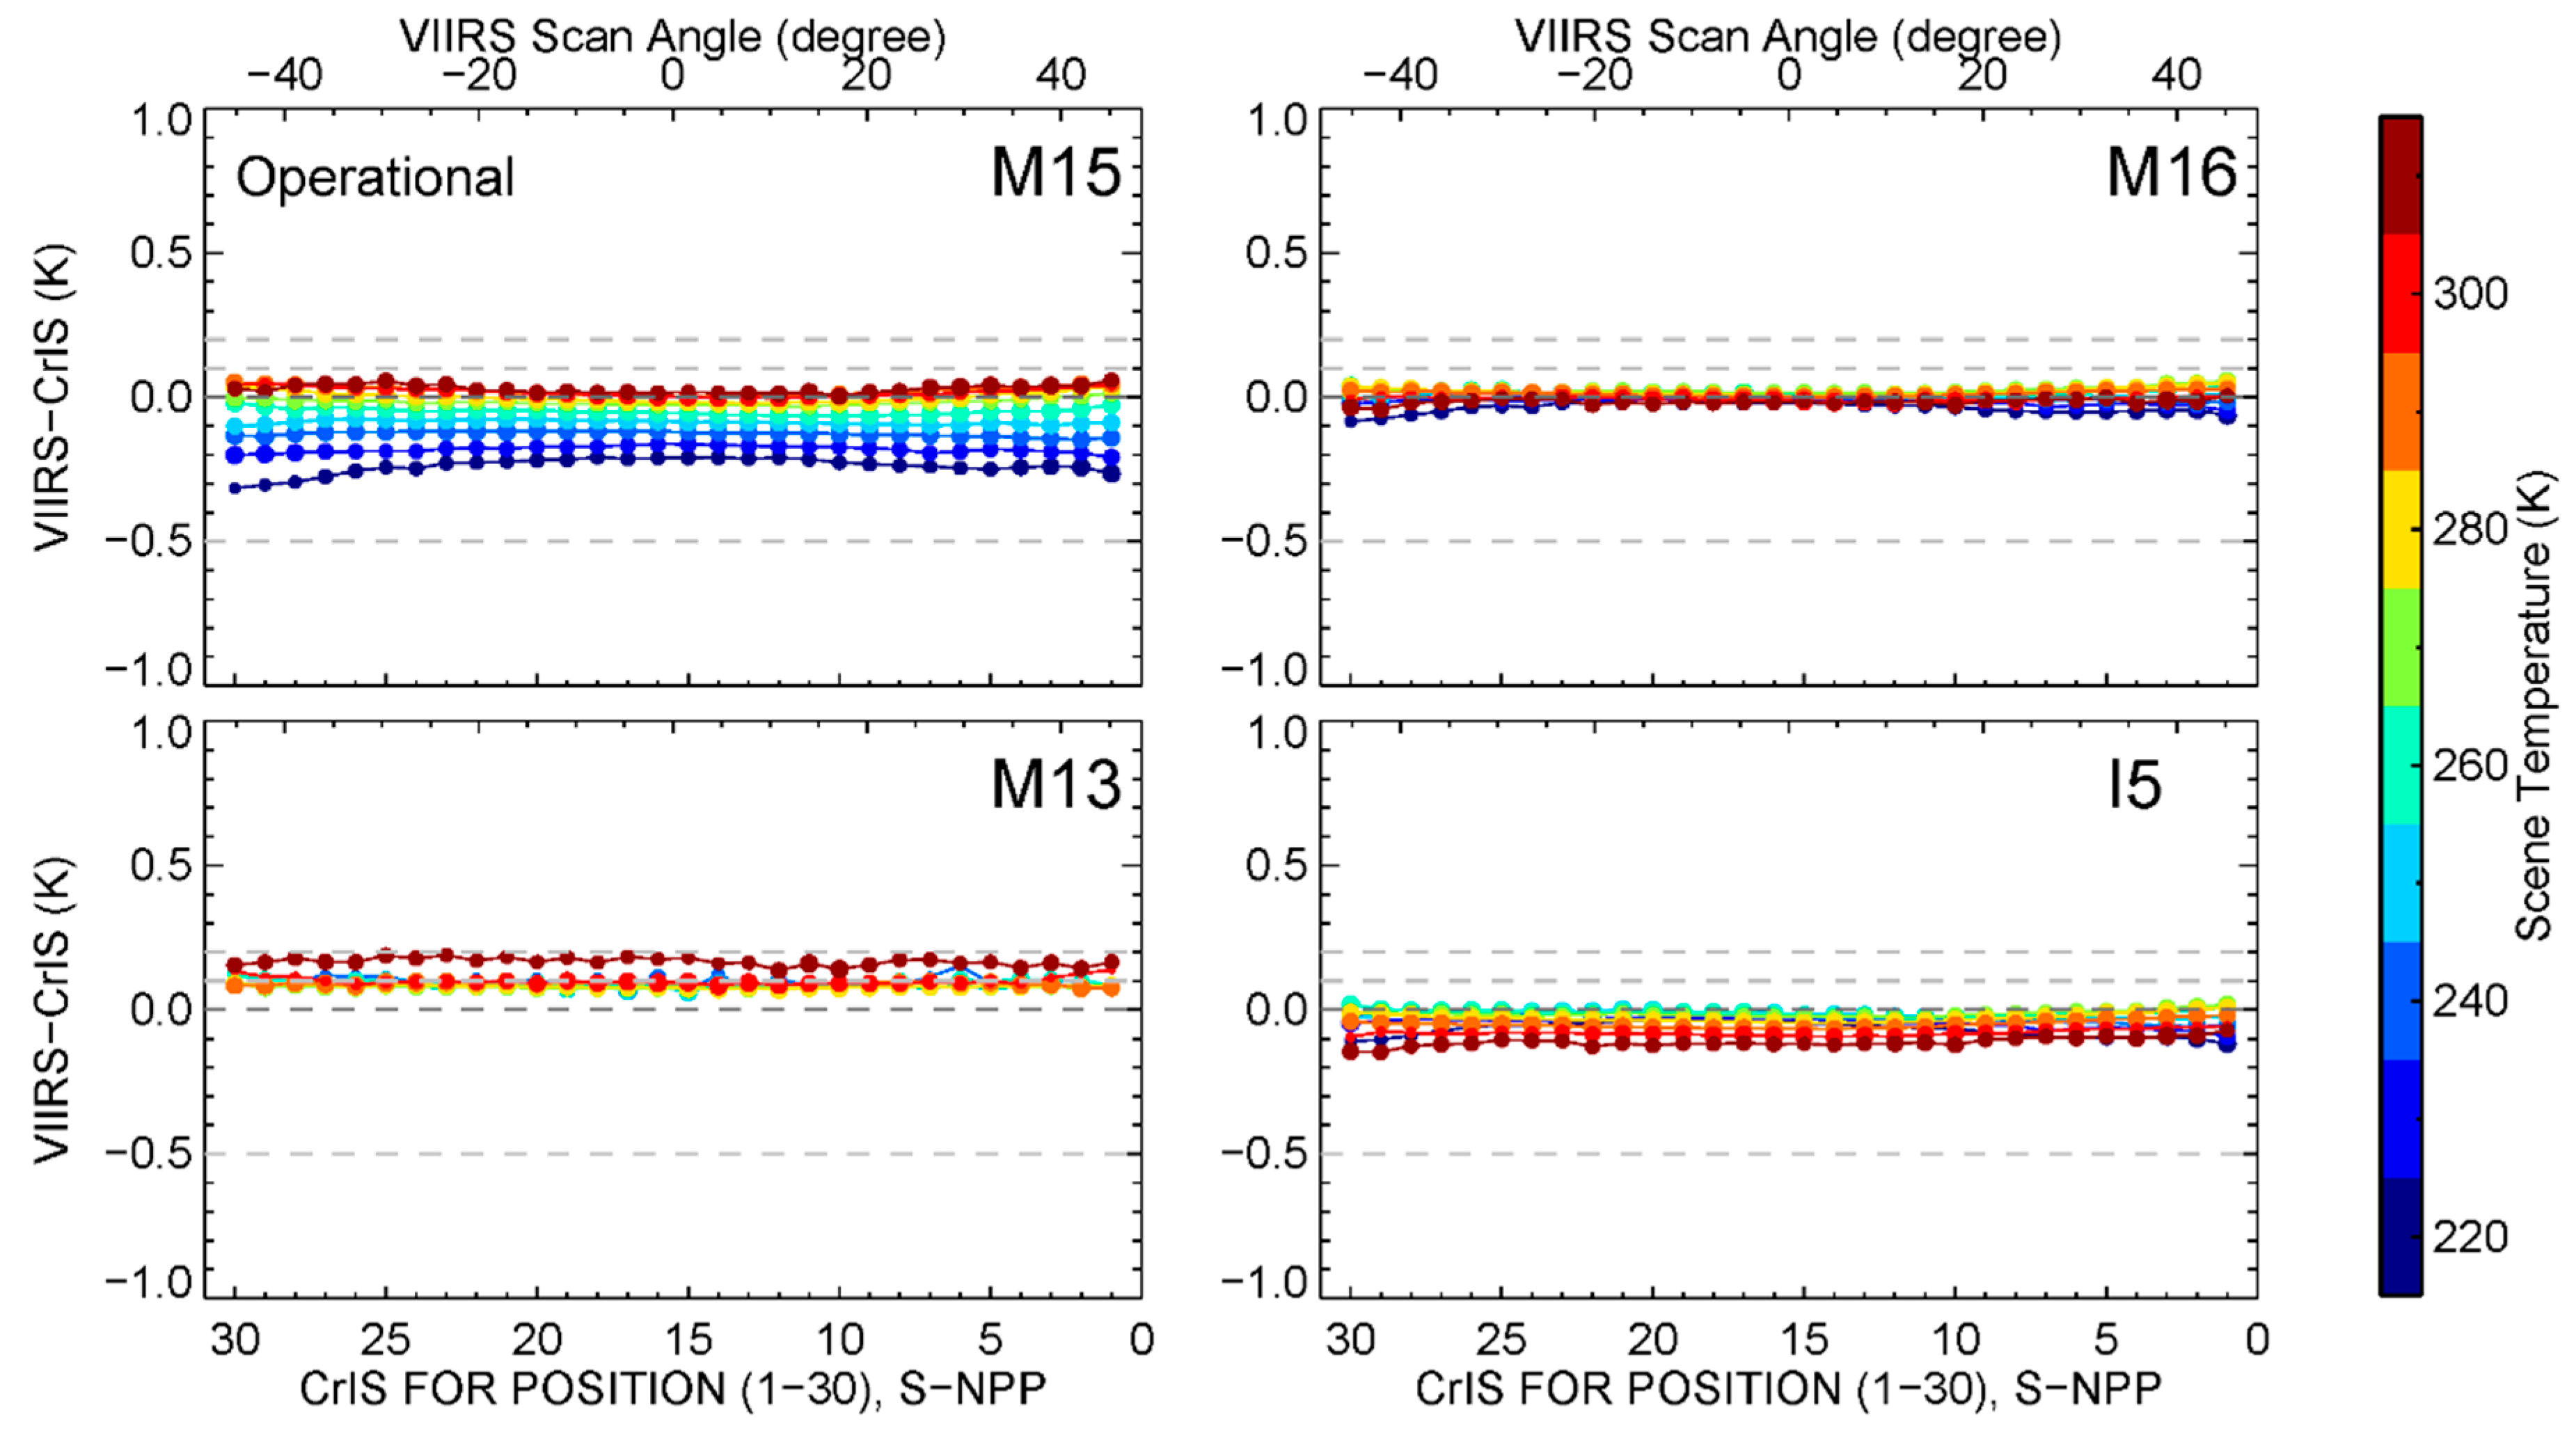
Figure 4.
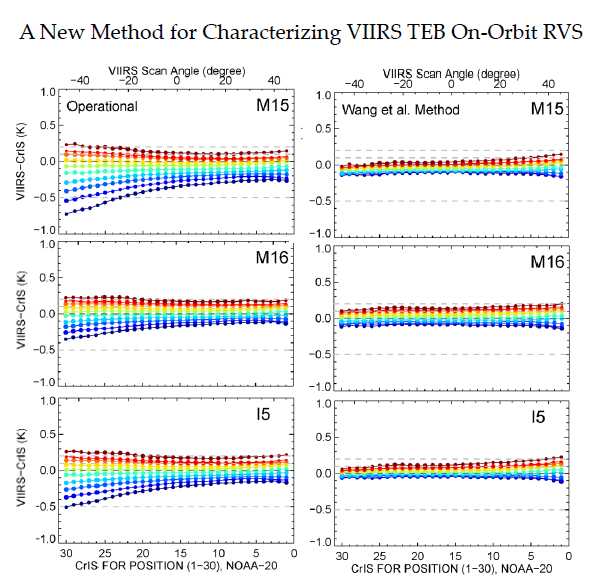
S-NPP VIIRS–CrIS BT differences at 10 scene temperatures and as function of CrIS FOR position and VIIRS scan angle. Under each scene temperature, the sizes of the filled circles are proportional to the number of data samples used.
Figure 4.
S-NPP VIIRS–CrIS BT differences at 10 scene temperatures and as function of CrIS FOR position and VIIRS scan angle. Under each scene temperature, the sizes of the filled circles are proportional to the number of data samples used.
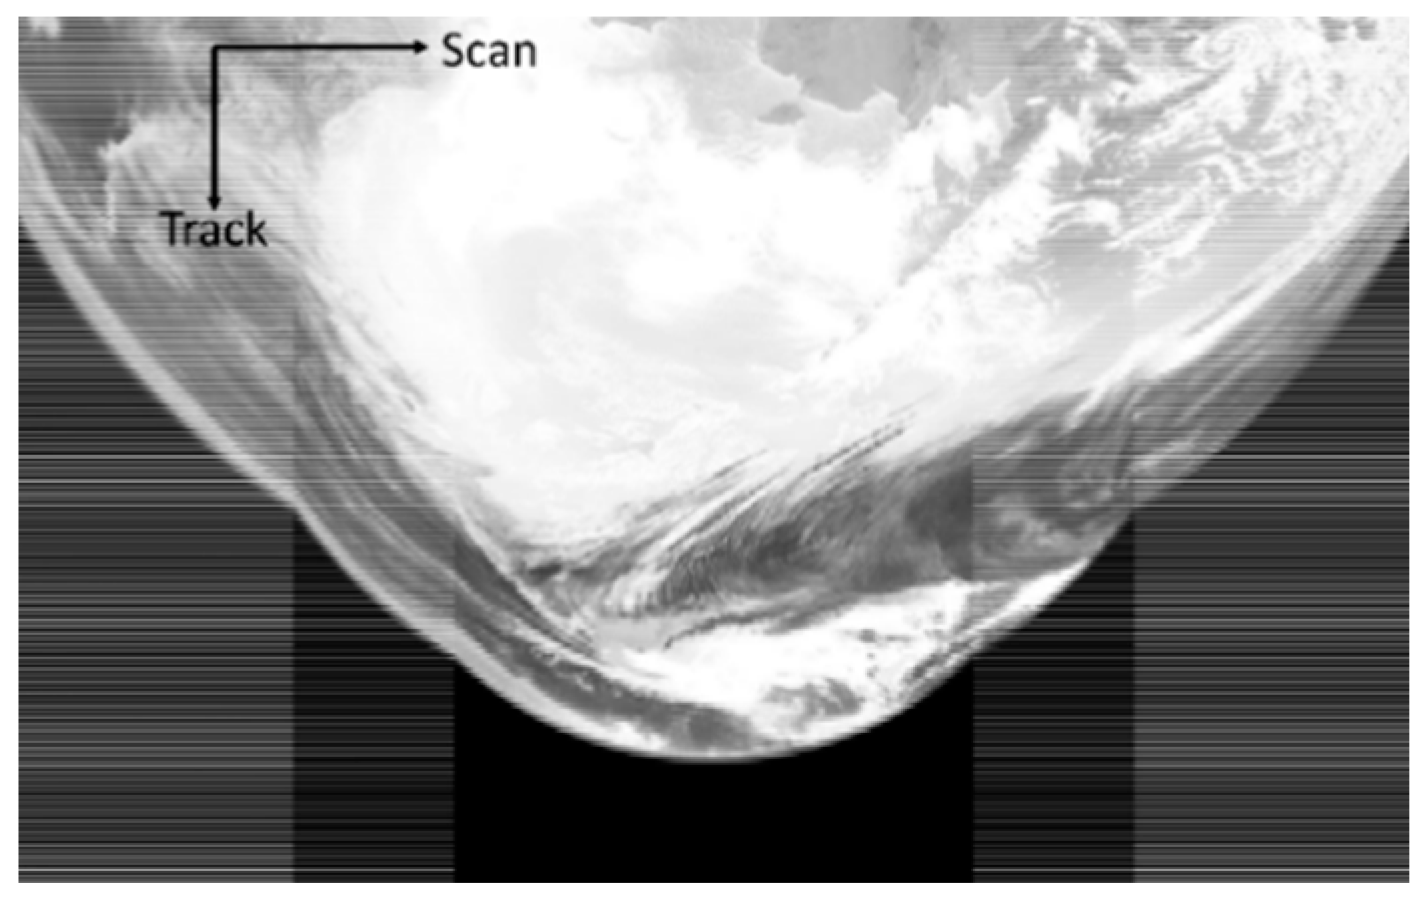
Figure 5.
An image of NOAA-20 M15 EV counts during the beginning of pitch maneuverer (January 31, 2018, 13:42:23–13:48:04 UTC). The bright feature that occupies most of the image is the Earth. The dark portion of the image in the bottom shows the deep space data for on-orbit RVS characterization. The striping at the beginning and the end of scan are fill values due to bowtie deletion.
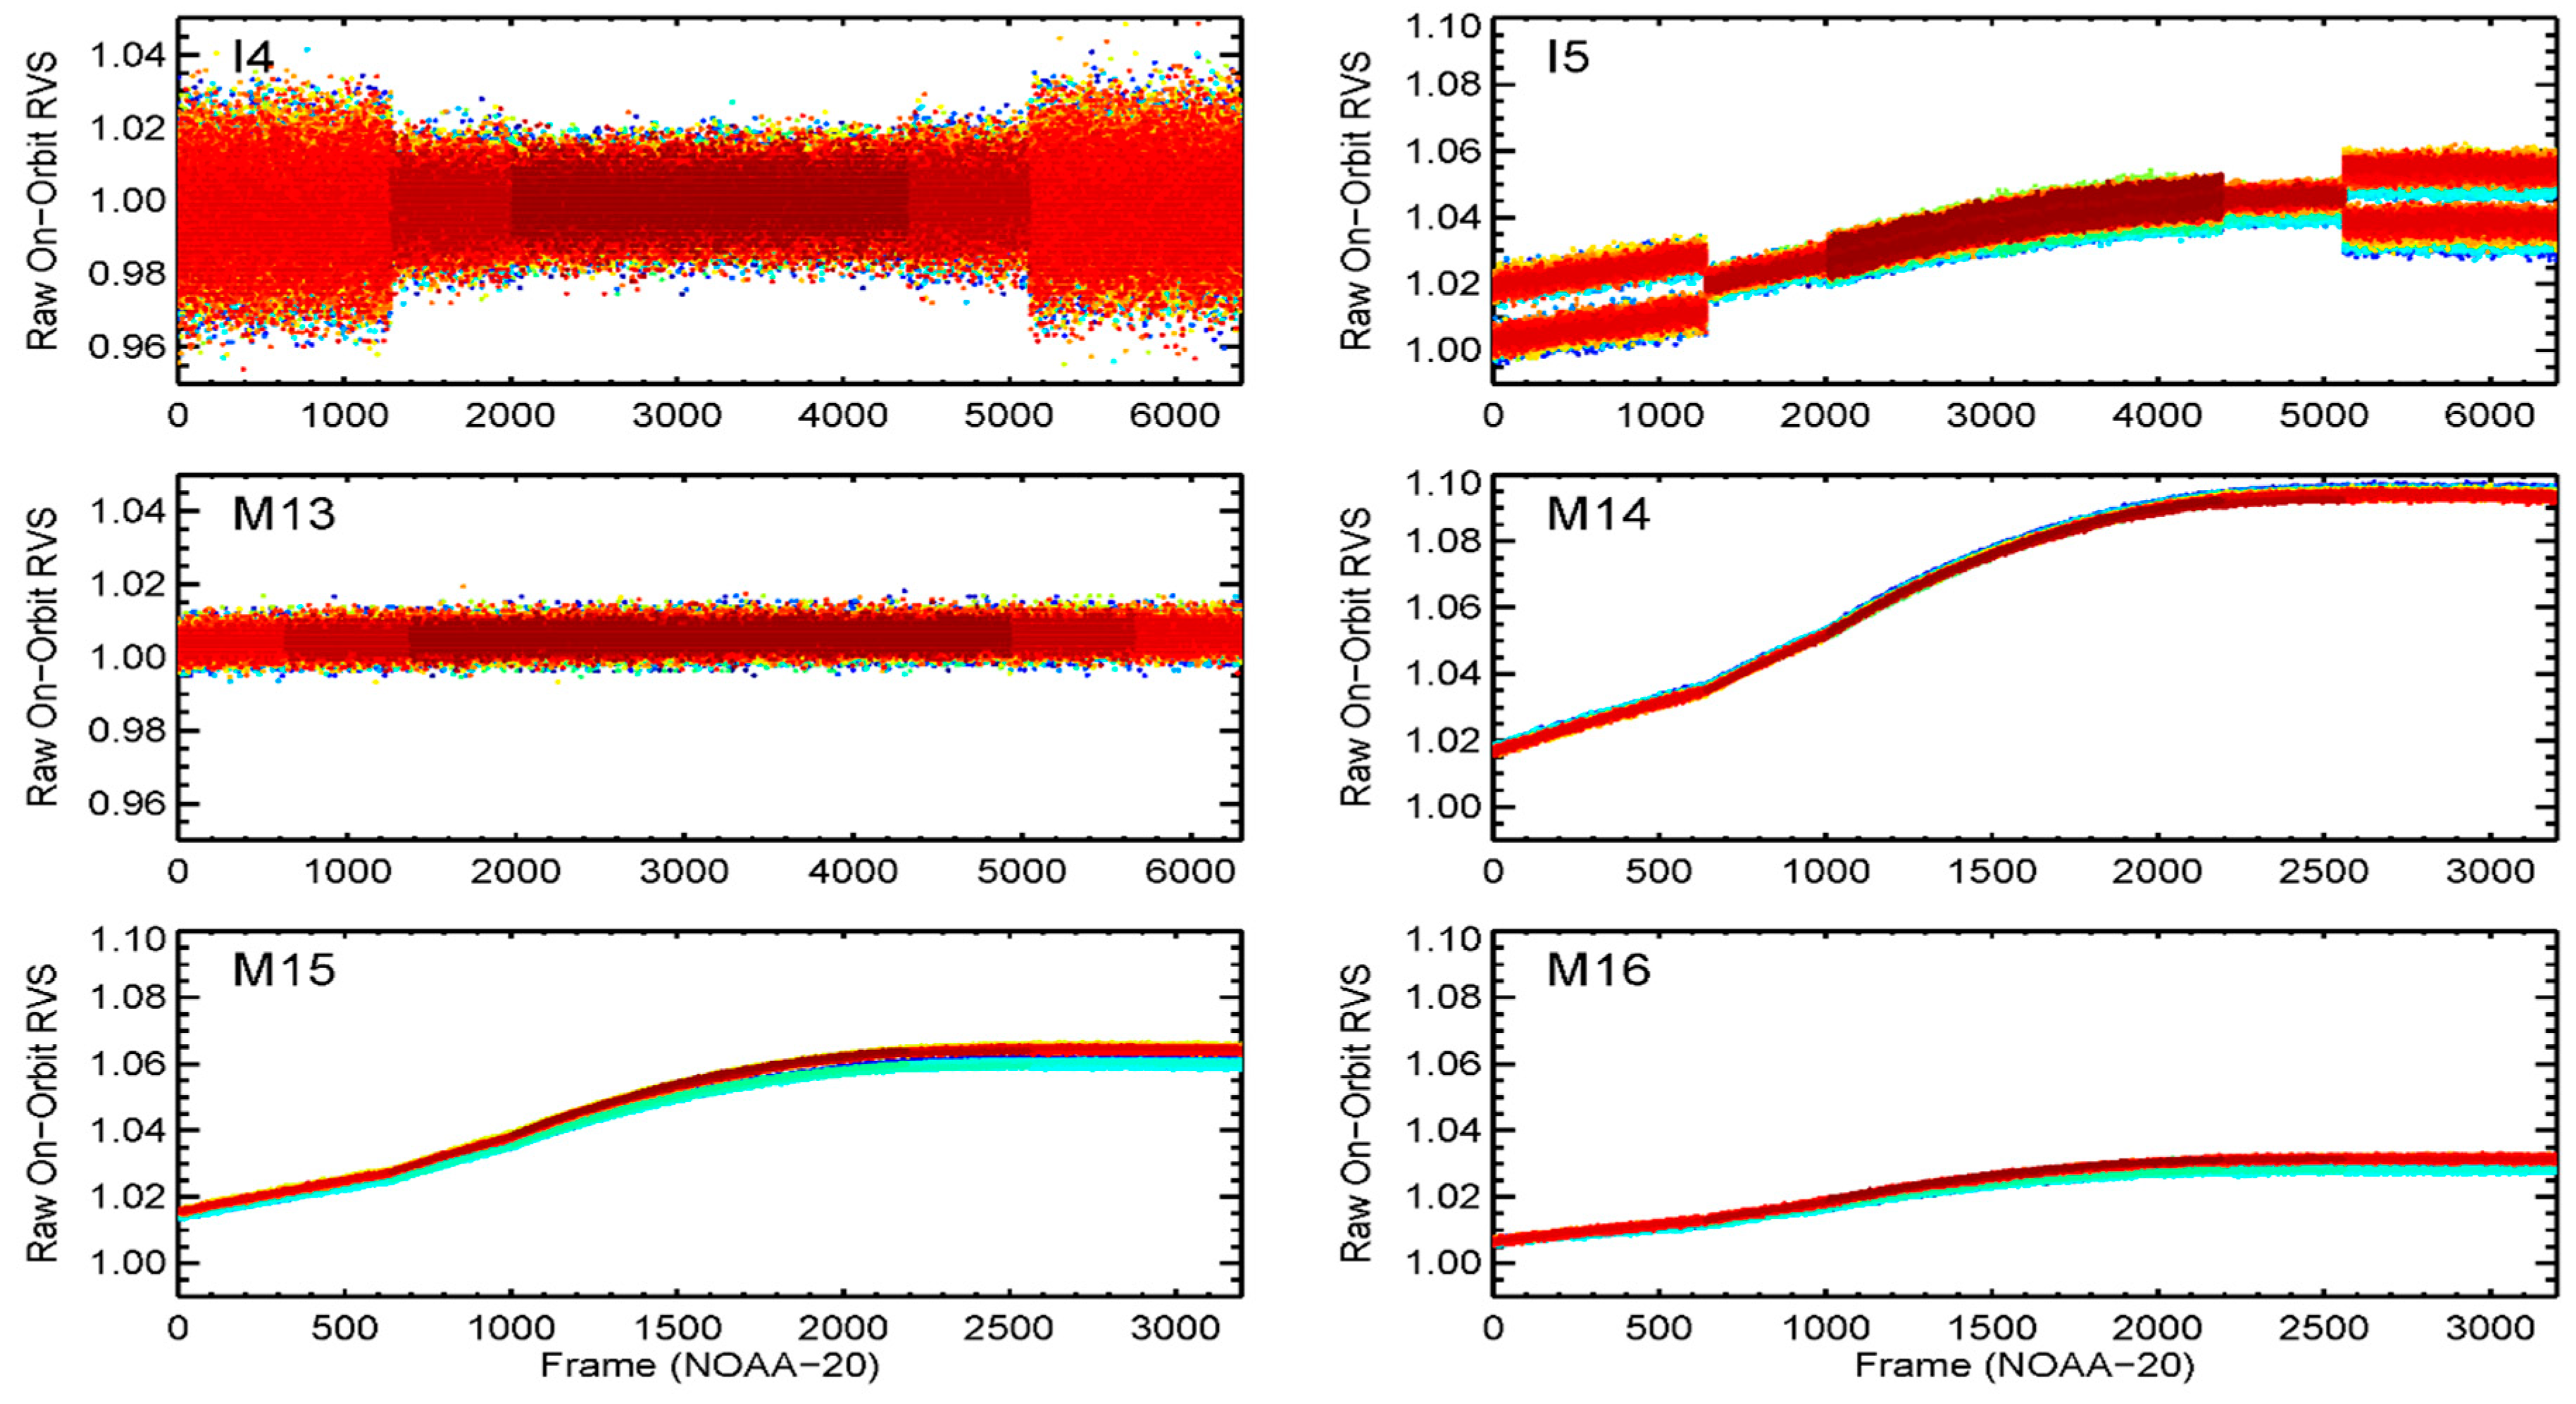
Figure 6.
The Wang et al. method derived NOAA-20 raw (pixel level) on-orbit RVS data as function of frame. For each band, detector level raw RVS are illustrated by different colors ranging from blue (HAM-A, first detector) to dark red (HAM-B, last detector).
Figure 6.
The Wang et al. method derived NOAA-20 raw (pixel level) on-orbit RVS data as function of frame. For each band, detector level raw RVS are illustrated by different colors ranging from blue (HAM-A, first detector) to dark red (HAM-B, last detector).
Figure 7.
NOAA-20 bands I5, M13, and M15–M16 detector level on-orbit RVS derived using the Wang et al. method, after smoothed using 2nd order polynomials.
Figure 7.
NOAA-20 bands I5, M13, and M15–M16 detector level on-orbit RVS derived using the Wang et al. method, after smoothed using 2nd order polynomials.
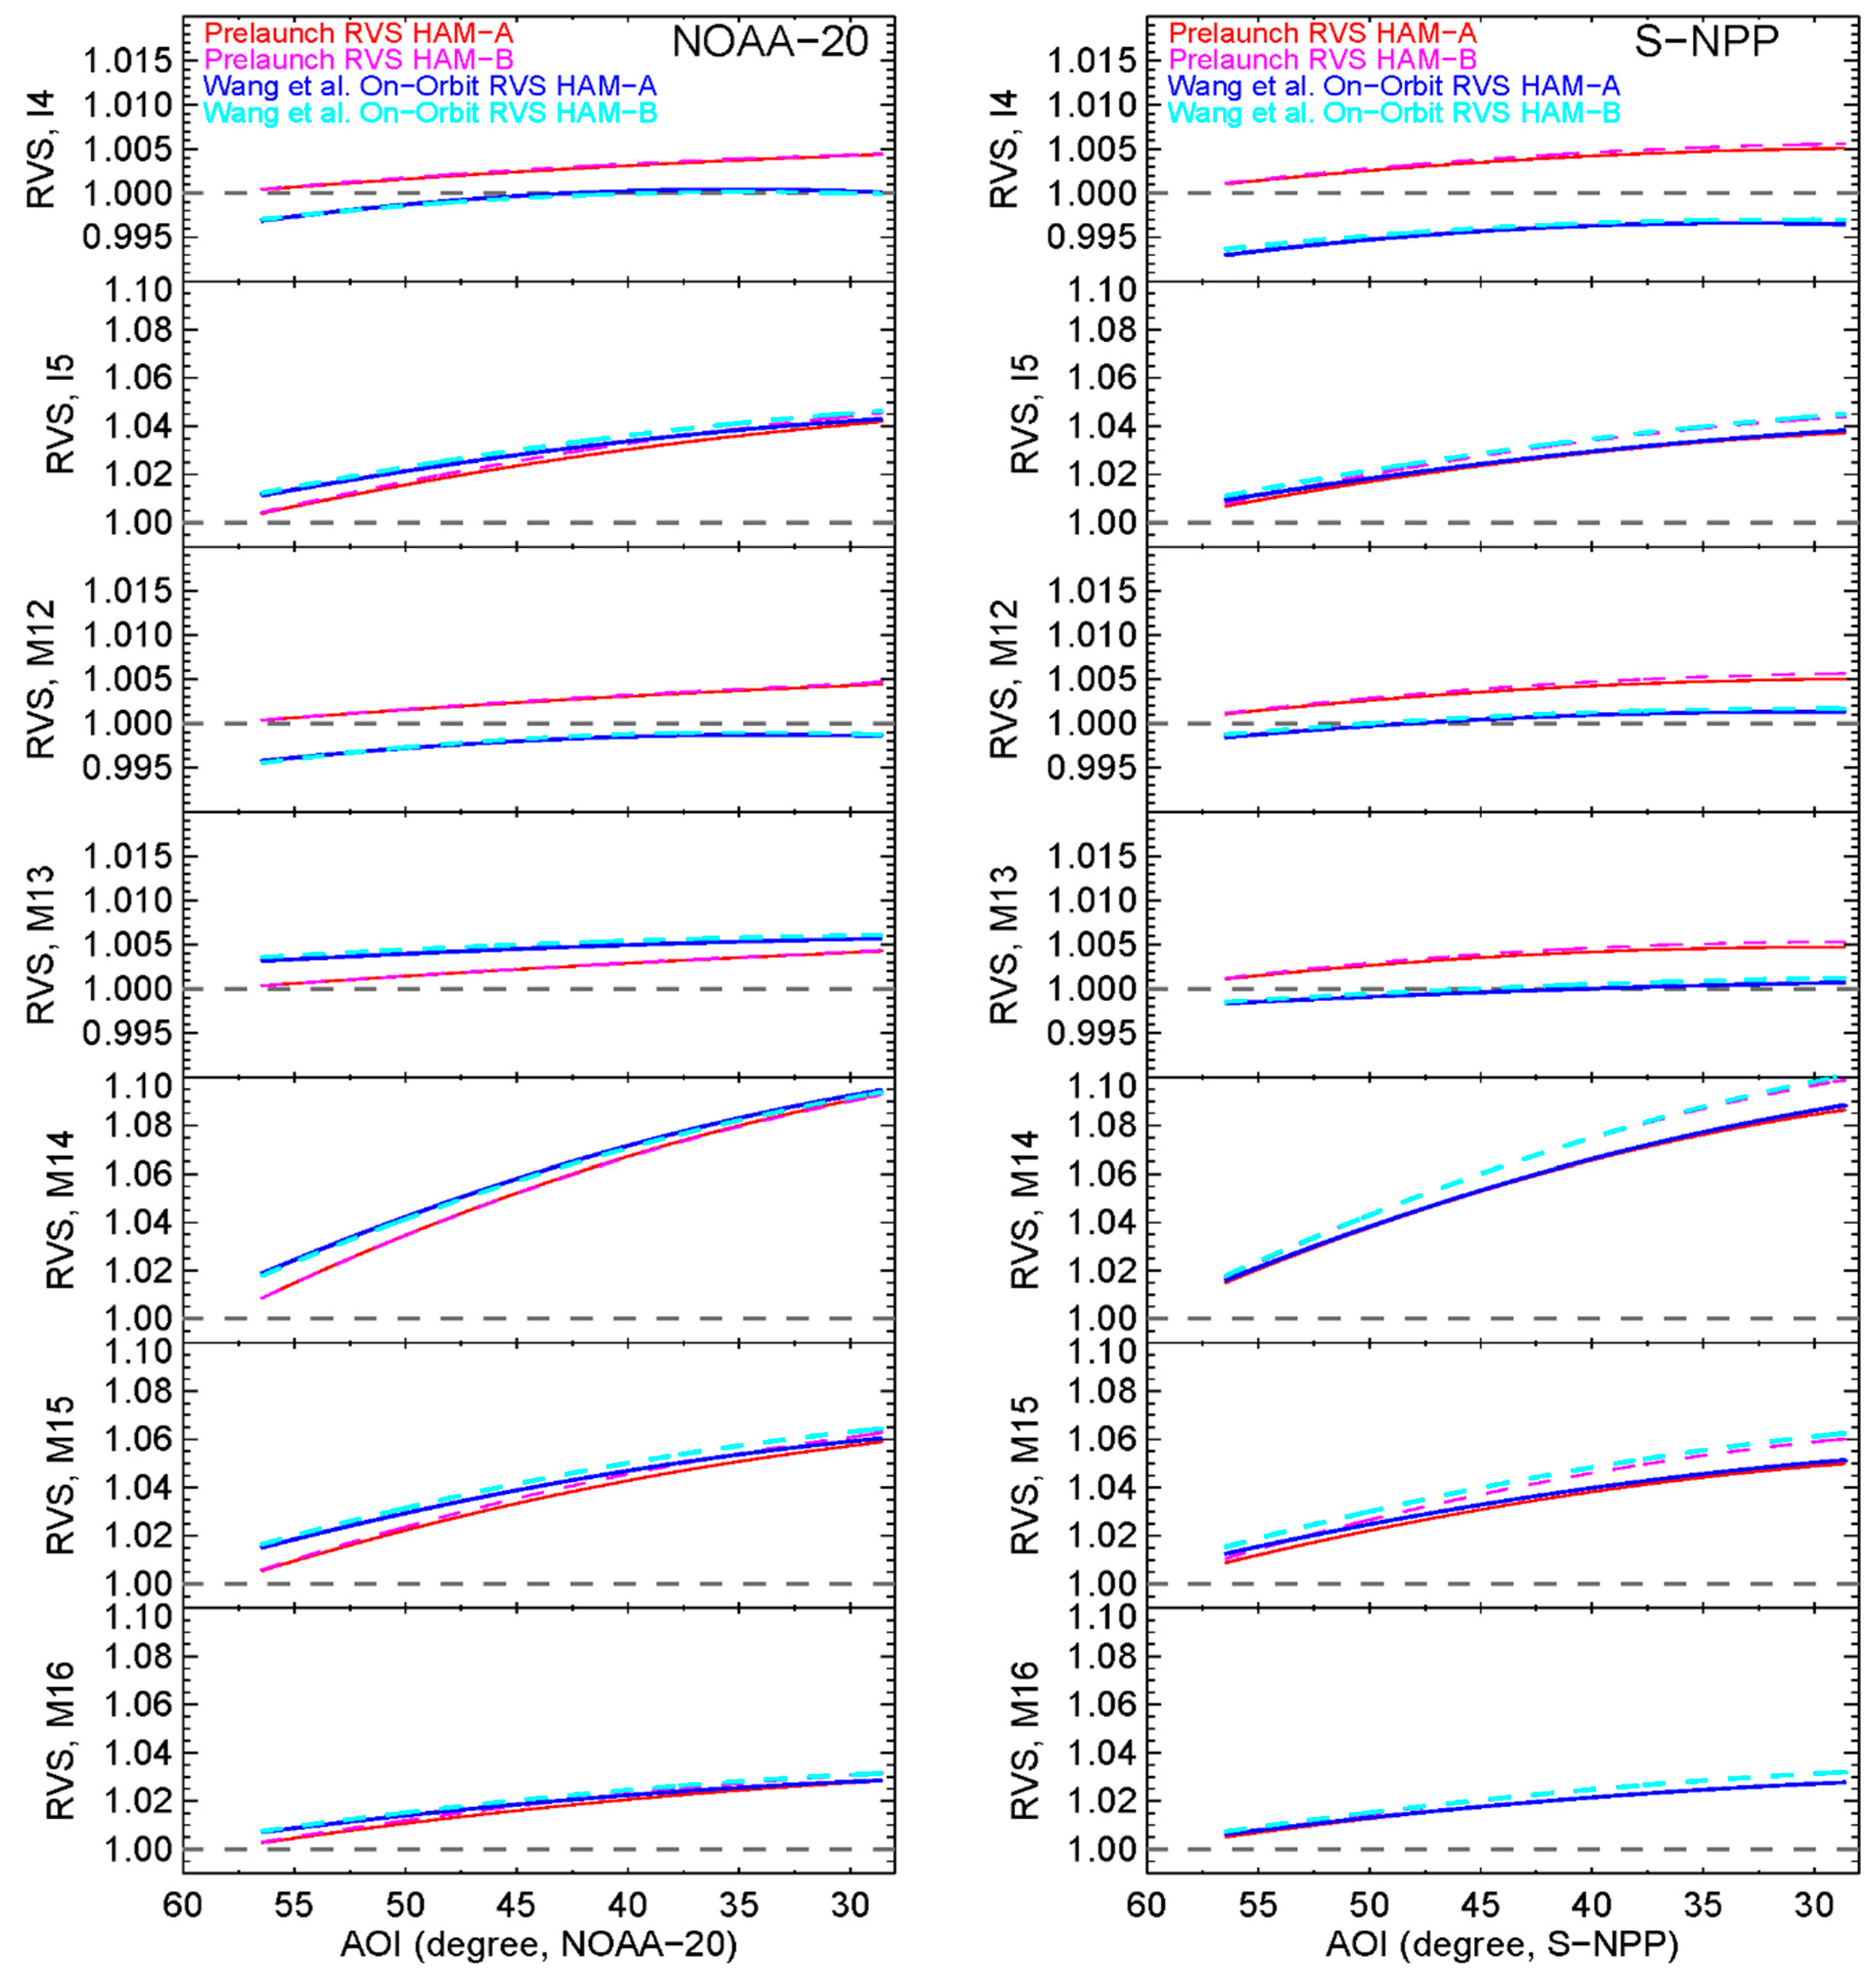
Figure 8.
Comparison of band-averaged NOAA-20 (left panel) and S-NPP (right panel) prelaunch and the Wang et al. method derived on-orbit RVS for HAM-A (solid lines) and HAM-B (dash lines).
Figure 8.
Comparison of band-averaged NOAA-20 (left panel) and S-NPP (right panel) prelaunch and the Wang et al. method derived on-orbit RVS for HAM-A (solid lines) and HAM-B (dash lines).
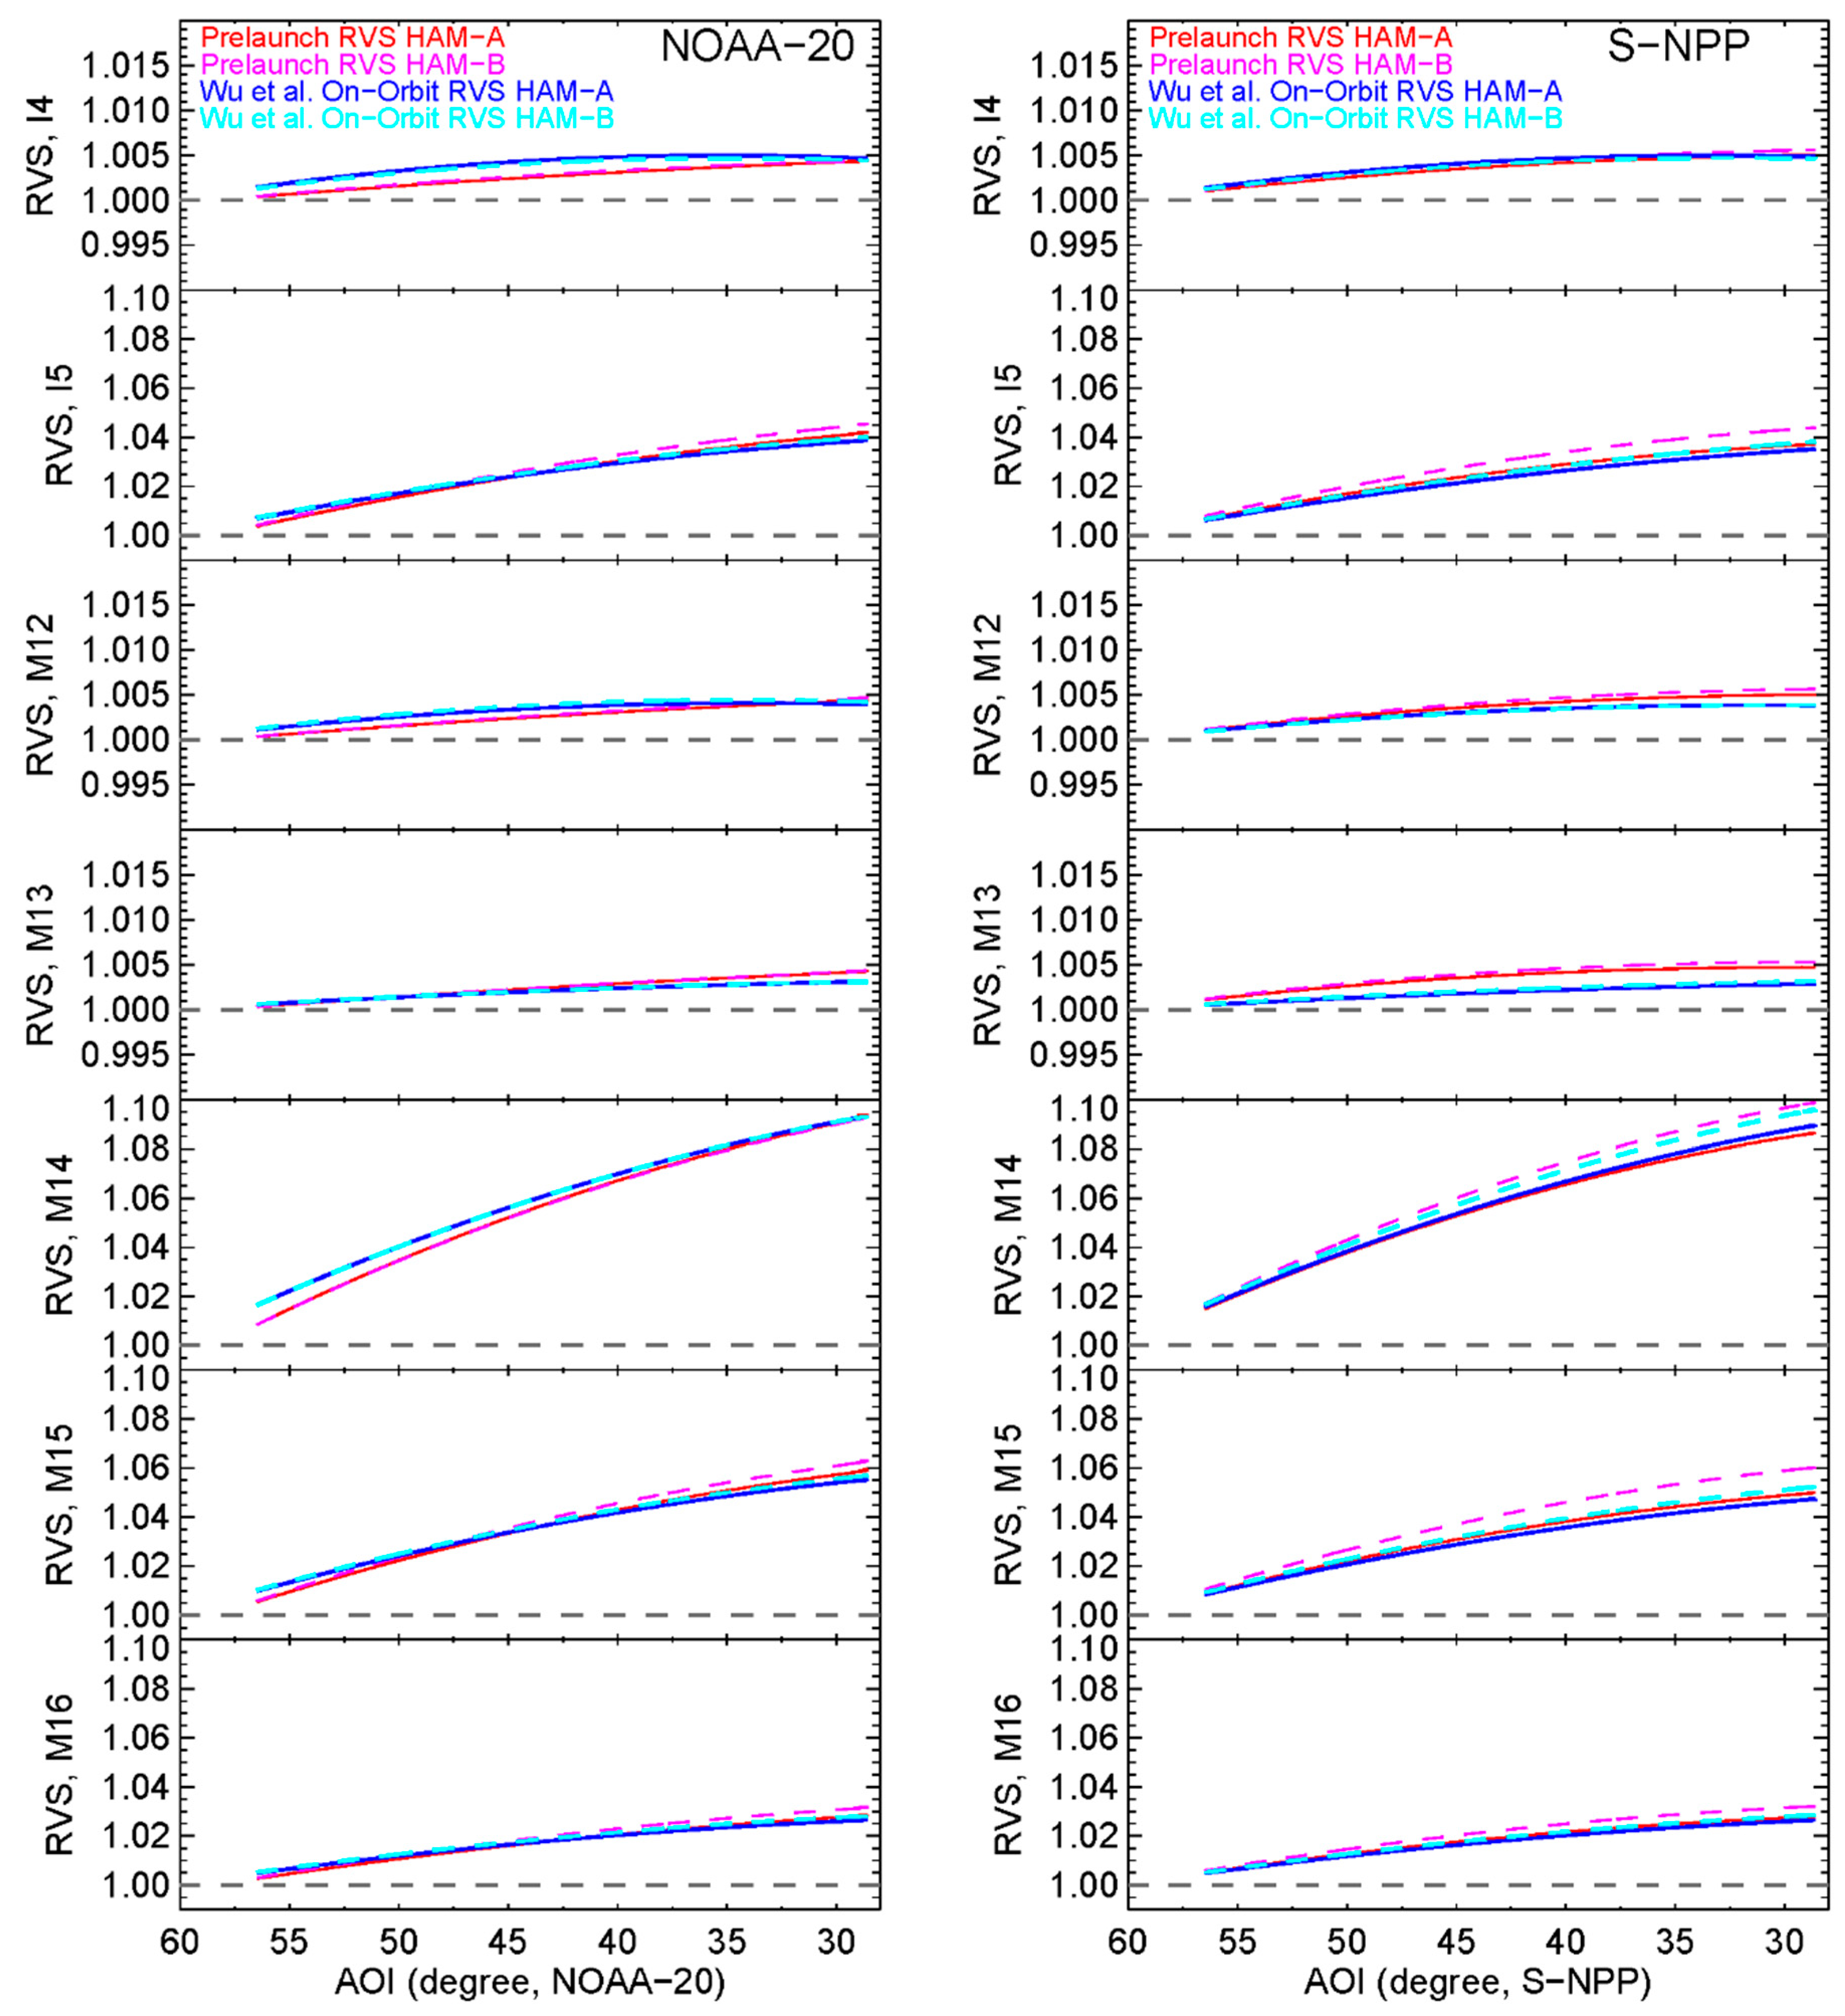
Figure 9.
Comparison of band-averaged NOAA-20 (left panel) and S-NPP (right panel) prelaunch and the Wu et al. method derived on-orbit RVS for HAM-A (solid lines) and HAM-B (dash lines). .
Figure 9.
Comparison of band-averaged NOAA-20 (left panel) and S-NPP (right panel) prelaunch and the Wu et al. method derived on-orbit RVS for HAM-A (solid lines) and HAM-B (dash lines). .
Figure 10.
NOAA-20 VIIRS–CrIS BT differences at 10 scene temperatures and as functions of CrIS FOR position and VIIRS scan angle. VIIRS M15–M16, M13, and I5 SDRs from March 18, 2019 were reprocessed using the Wu et al. method derived on-orbit RVS. Under each scene temperature, the sizes of the filled circles are proportional to the number of data samples used.
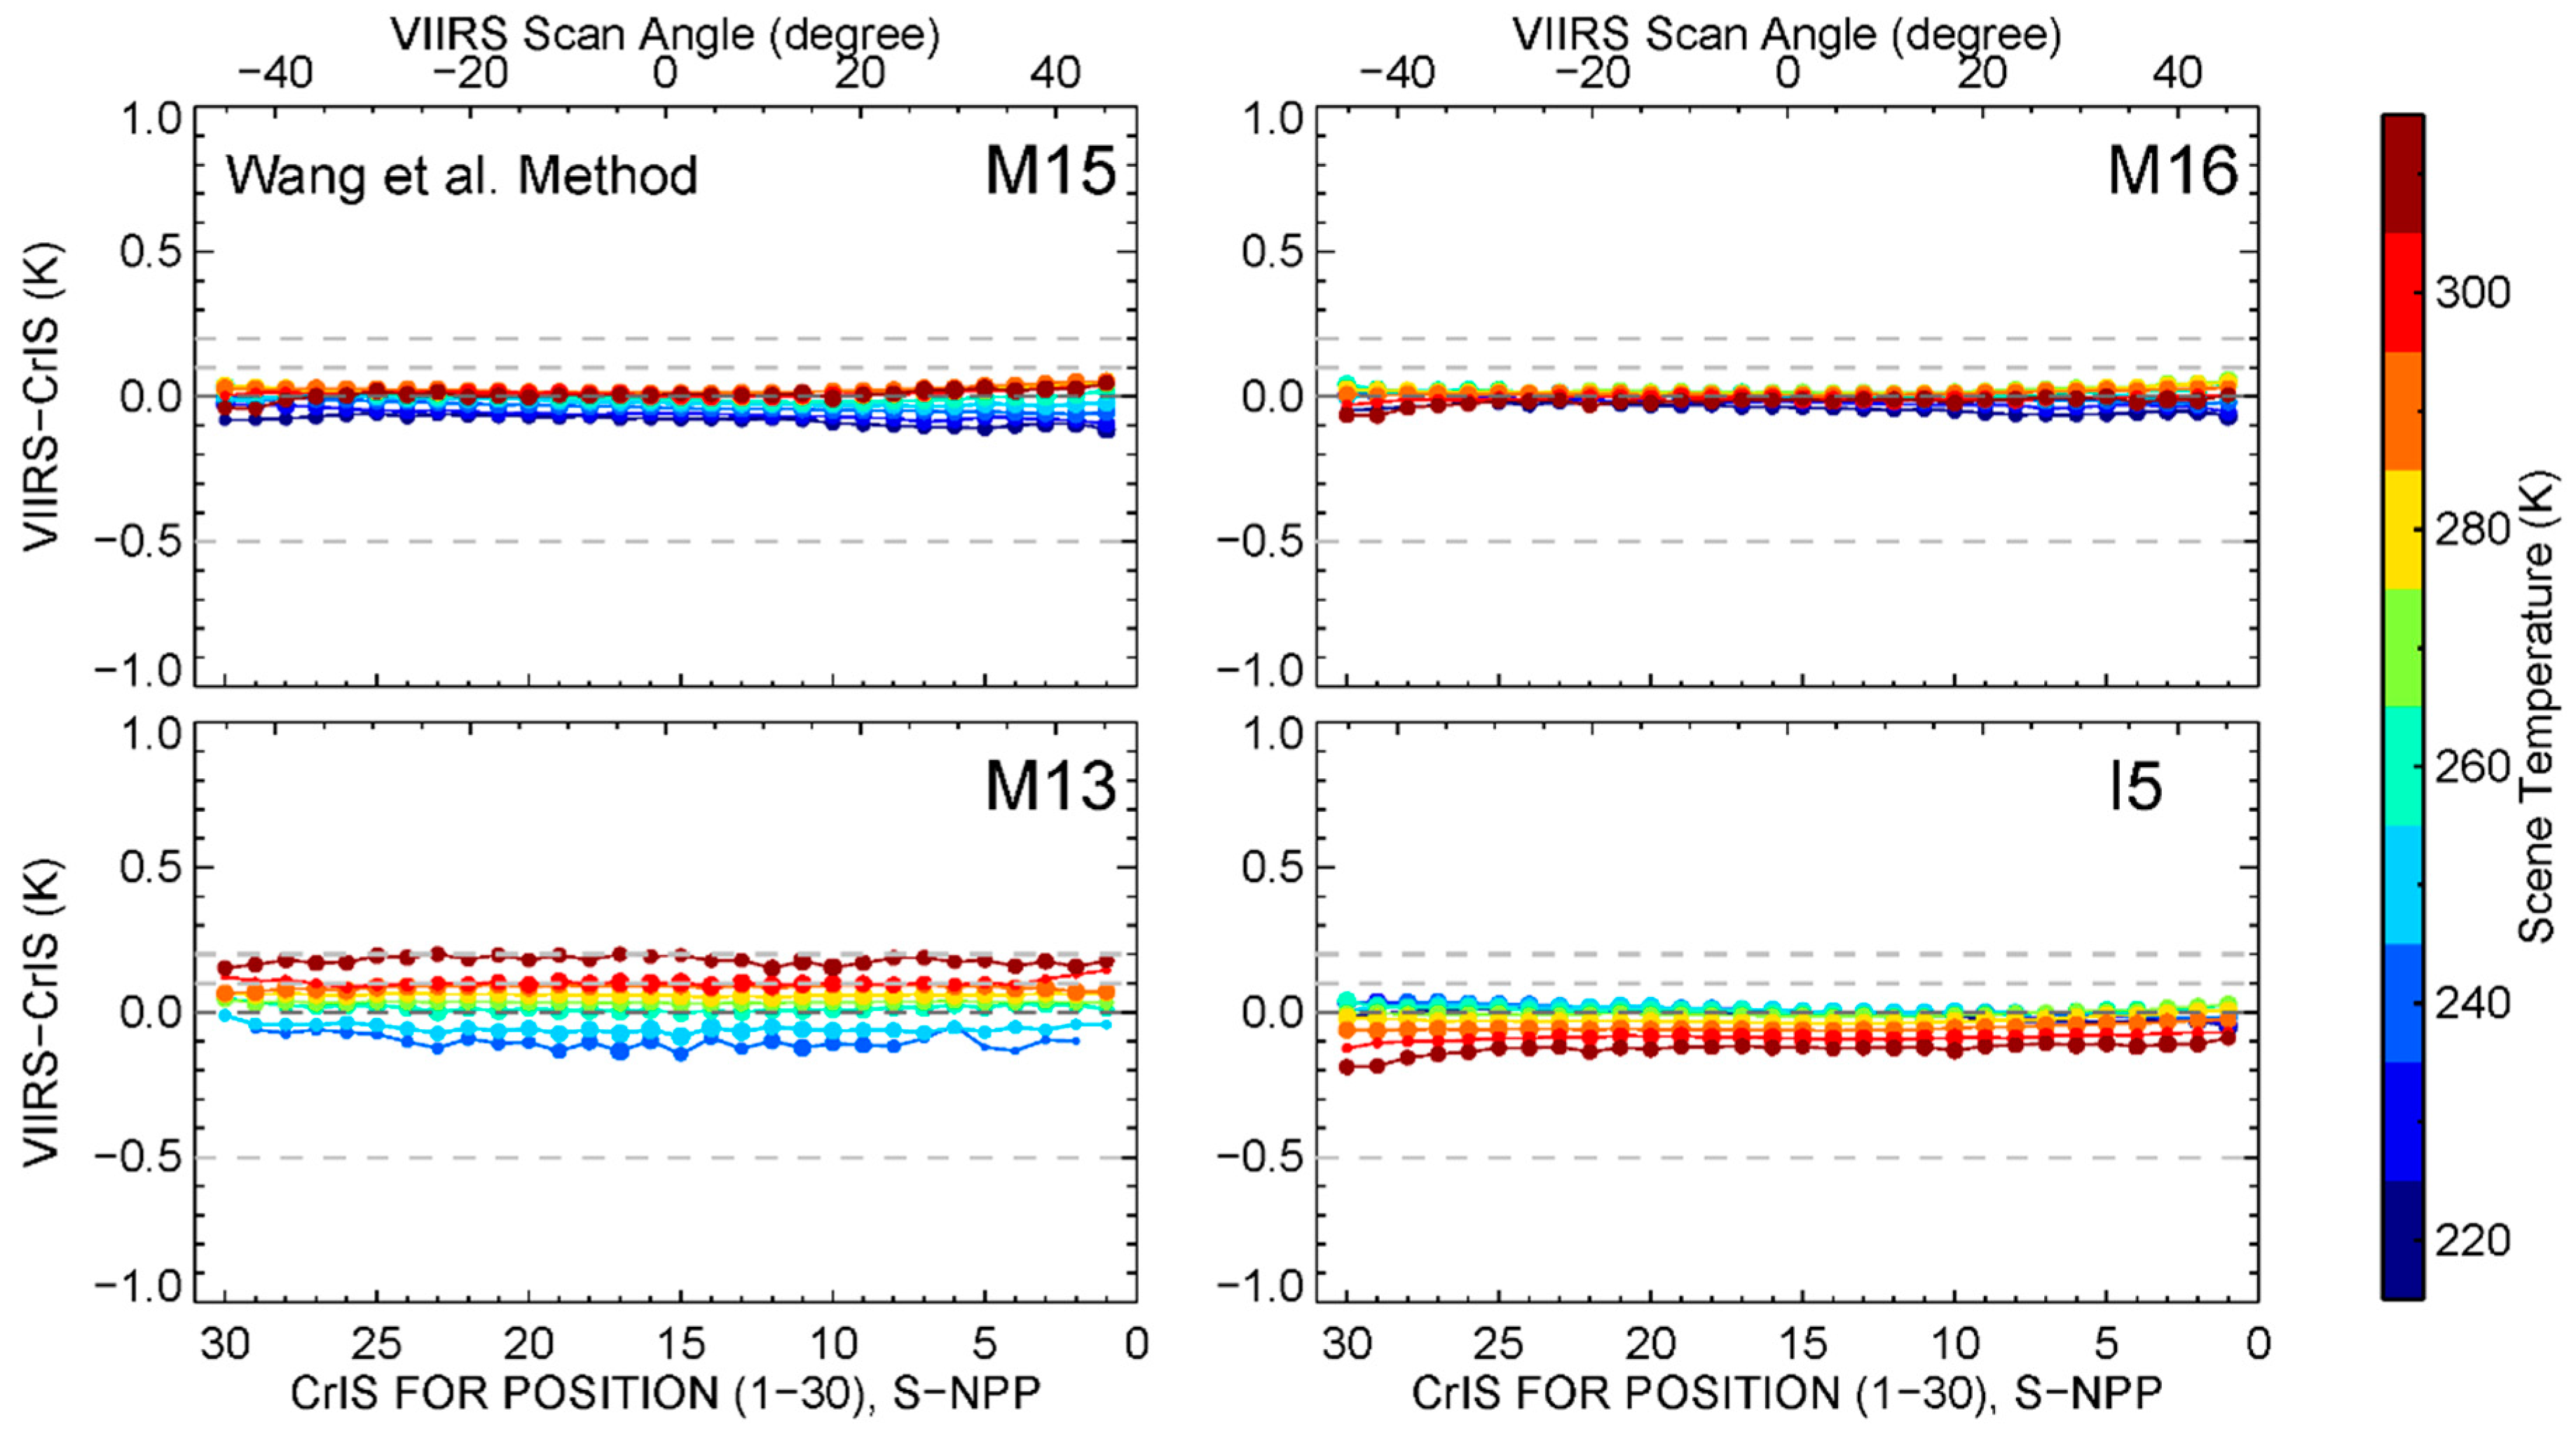
Figure 11.
NOAA-20 VIIRS–CrIS BT differences at 10 scene temperatures and as function of CrIS FOR position and VIIRS scan angle. VIIRS M15–M16, M13, and I5 SDRs from March 18, 2019 were reprocessed using the Wang et al. method derived on-orbit RVS. Under each scene temperature, the sizes of the filled circles are proportional to the number of data samples used.
Figure 12.
S-NPP VIIRS–CrIS BT differences at 10 scene temperatures and as function of CrIS FOR position and VIIRS scan angle. VIIRS M15–M16, M13, and I5 SDRs from March 18, 2019 were reprocessed using the Wang et al. method derived on-orbit RVS. Under each scene temperature, the sizes of the filled circles are proportional to the number of data samples used.
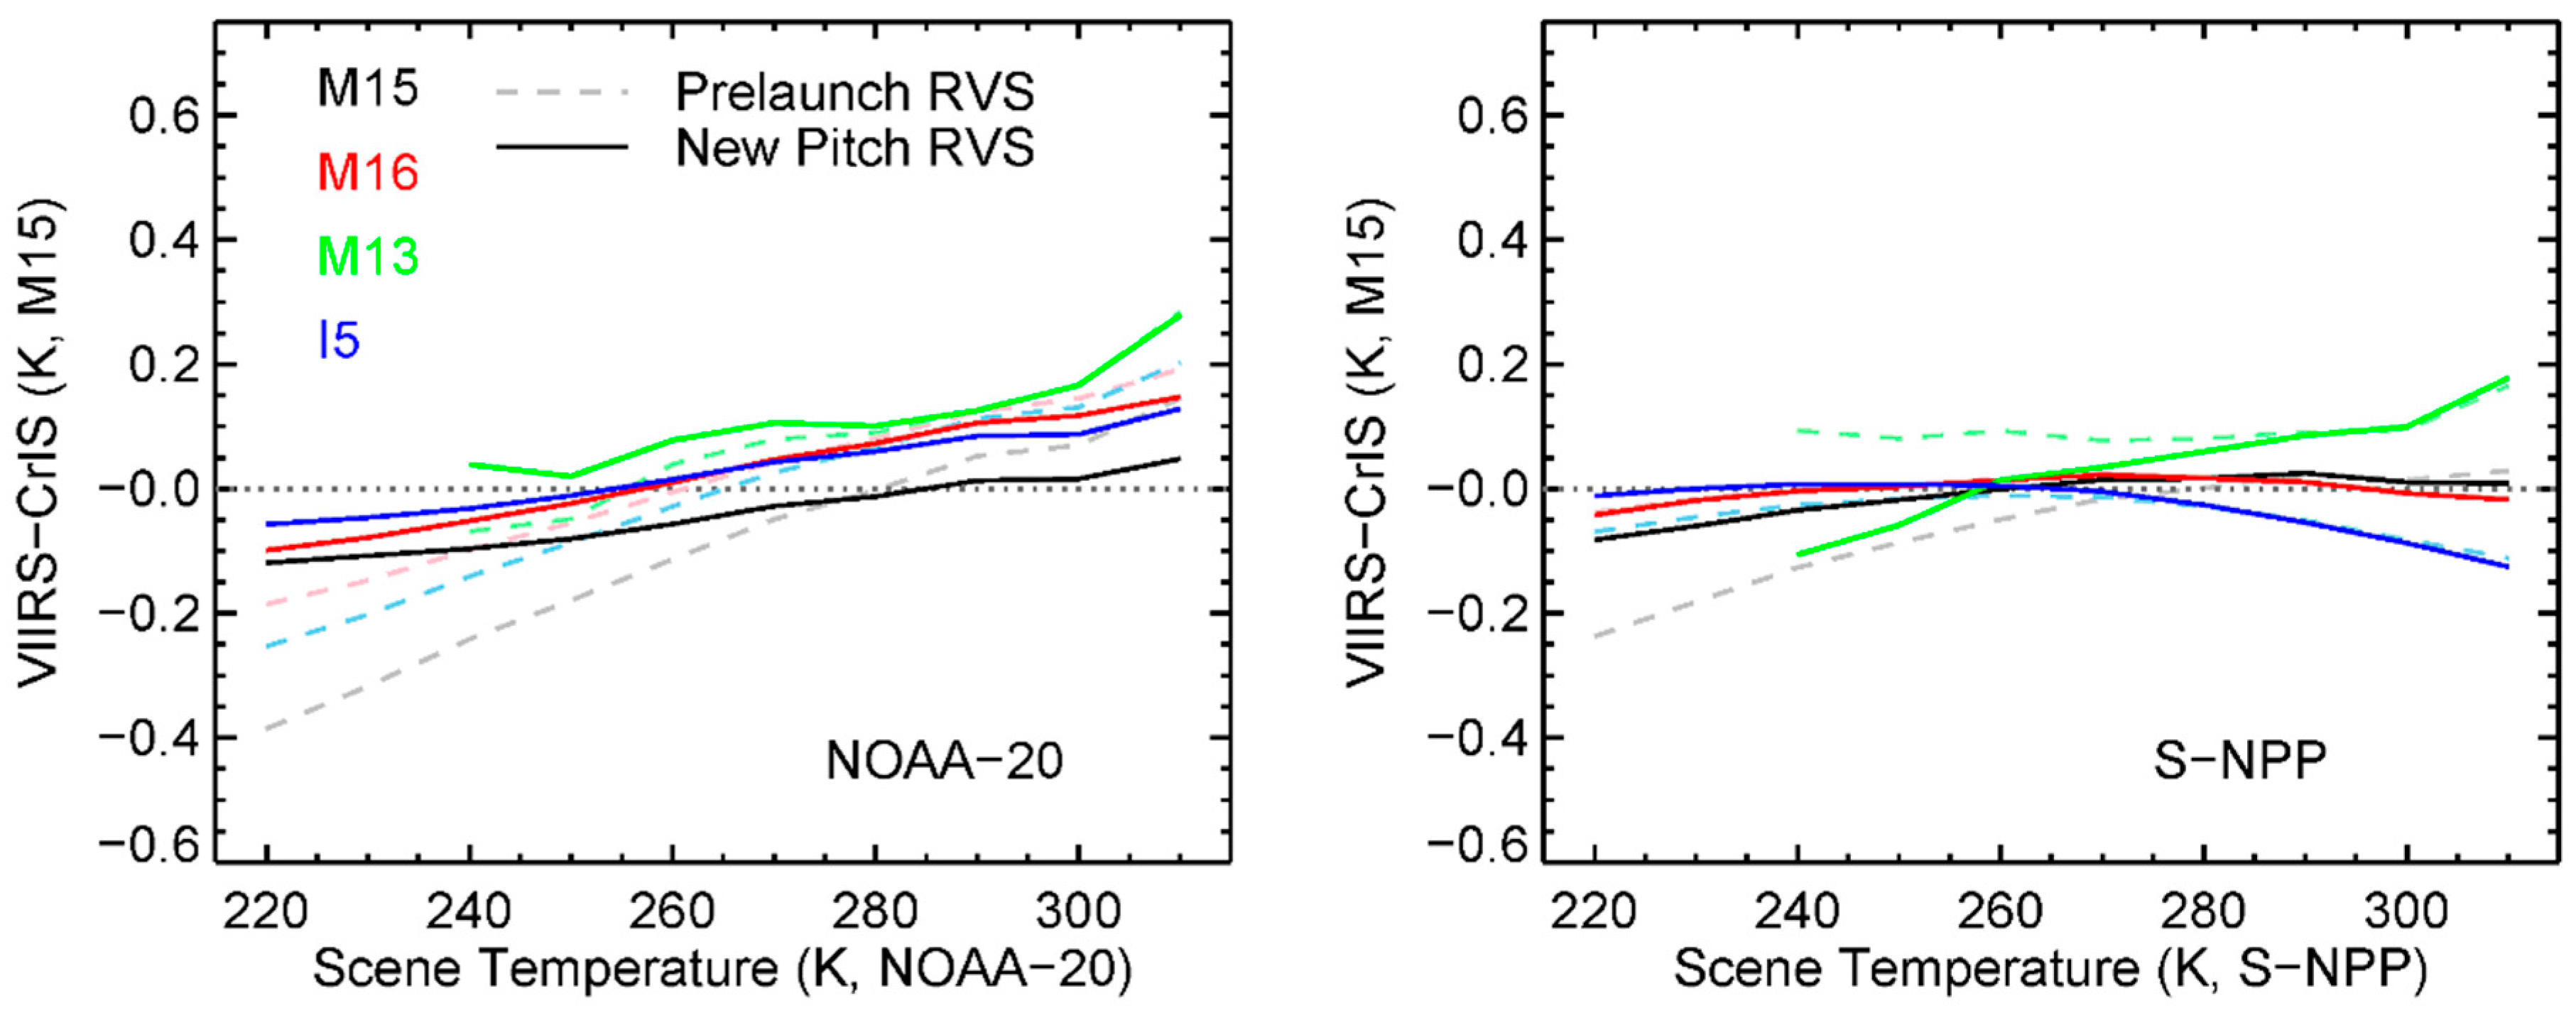
Figure 13.
NOAA-20 VIIRS–CrIS BT differences as function of CrIS scene temperature. Scene temperature dependent biases for the reprocessed VIIRS SDRs (the Wang et al. method derived on-orbit RVS) were plotted in the foreground in solid lines; biases for the NOAA operational processing (prelaunch RVS) were plotted in the background using dash lines and pale colors.
Table 1.
Spectral, spatial, and radiometric characteristics of NOAA-20 and S-NPP VIIRS TEBs. I4-I5, M12, M14-M16 are single gain (S) bands. M13 is a dual gain band (H: high gain; L: low gain). Ttyp stands for typical scene temperature; NEdT stands for noise equivalent differential temperature.
Table 1.
Spectral, spatial, and radiometric characteristics of NOAA-20 and S-NPP VIIRS TEBs. I4-I5, M12, M14-M16 are single gain (S) bands. M13 is a dual gain band (H: high gain; L: low gain). Ttyp stands for typical scene temperature; NEdT stands for noise equivalent differential temperature.
| VIIRS TEBs | Spatial Resolution (m) | Center Wavelength (µm) | Gain | Ttyp (K) | NEdT Spec (K) | NEdT On-Orbit (K) |
|---|
| NOAA-20 | S-NPP | NOAA-20 | S-NPP |
|---|
| MWIR | M12 | 750 | 3.700 | 3.697 | S | 270 | 0.396 | 0.12 | 0.12 |
| I4 | 375 | 3.753 | 3.753 | S | 270 | 2.5 | 0.42 | 0.40 |
| M13 | 750 | 4.070 | 4.067 | H | 300 | 0.107 | 0.04 | 0.04 |
| L | 380 | 0.423 |
| - | - |
| LWIR | M14 | 750 | 8.583 | 8.578 | S | 270 | 0.091 | 0.05 | 0.06 |
| M15 | 750 | 10.703 | 10.729 | S | 300 | 0.07 | 0.02 | 0.03 |
| I5 | 375 | 11.450 | 11.469 | S | 210 | 1.5 | 0.42 | 0.40 |
| M16 | 750 | 11.869 | 11.845 | S | 300 | 0.072 | 0.03 | 0.03 |
Table 2.
NOAA-20 and S-NPP pitch maneuver data used for on-orbit Response Versus Scan (RVS) characterization.
Table 2.
NOAA-20 and S-NPP pitch maneuver data used for on-orbit Response Versus Scan (RVS) characterization.
| NOAA-20 | S-NPP |
|---|
| Granule Used | January 31, 2018 | February 20, 2012 |
| 13:46:40–13:48:04 UTC | 18:26:29–18:27:44 UTC |
| Start Scan Number | 11 | 1 |
| Number of scans used | 10 (5 scans for each HAM-side) | 10 (5 scans for each HAM-side) |
| S/MWIR FPA Temp. | 80.29K | 79.86K |
| LWIR FPA Temp. | 80.48K | 79.95K |
Table 3.
NOAA-20 and S-NPP band-averaged differences between the Wang et al. method derived on-orbit RVS and prelaunch RVS over scan angles at −56.063° (EVBOS), −8° (OBCBB AOI), +41°, +56.063° (EVEOS), and averaged over the entire EV scan angles (Scan Avg.), for HAM-A and HAM-B. Cases with differences exceeding ±0.3% are highlighted.
| Unit: % | On-Orbit RVS (the Wang et al. Method)—Prelaunch RVS |
|---|
| −56.063° | −8° | +41° | +56.063° | Scan Avg. |
|---|
| NOAA-20 | I4 | −0.35/−0.34 | −0.30/−0.34 | −0.43/−0.45 | −0.43/−0.45 | −0.35/−0.38 |
| I5 | 0.73/0.80 | 0.30/0.29 | 0.10/0.08 | 0.07/0.04 | 0.32/0.32 |
| M12 | −0.46/−0.48 | −0.47/−0.45 | −0.58/−0.59 | −0.59/−0.59 | −0.51/−0.51 |
| M13 | 0.28/0.32 | 0.20/0.24 | 0.14/0.17 | 0.14/0.17 | 0.19/0.23 |
| M14 | 1.01/0.93 | 0.37/0.33 | 0.12/0.08 | 0.04/0.01 | 0.41/0.36 |
| M15 | 0.95/1.05 | 0.35/0.40 | 0.13/0.16 | 0.09/0.11 | 0.40/0.45 |
| M16 | 0.44/0.45 | 0.16/0.13 | 0.02/-0.01 | 0.00/-0.03 | 0.17/0.15 |
| S-NPP | I4 | −0.80/−0.75 | −0.79/−0.80 | −0.85/−0.86 | −0.85/−0.86 | −0.81/−0.81 |
| I5 | 0.25/0.31 | 0.04/0.05 | 0.09/0.10 | 0.09/0.10 | 0.11/0.13 |
| M12 | −0.26/−0.24 | −0.33/−0.35 | −0.37/−0.39 | −0.37/−0.39 | −0.33/−0.34 |
| M13 | −0.28/−0.27 | −0.42/−0.41 | −0.39/−0.40 | −0.40/−0.41 | −0.39/−0.39 |
| M14 | 0.09/0.07 | 0.06/0.03 | 0.18/0.17 | 0.18/0.17 | 0.11/0.09 |
| M15 | 0.37/0.47 | 0.15/0.22 | 0.15/0.22 | 0.15/0.22 | 0.19/0.27 |
| M16 | 0.11/0.14 | −0.02/−0.02 | −0.01/−0.01 | −0.01/−0.01 | 0.01/0.02 |
Table 4.
NOAA-20 and S-NPP band-averaged differences between the Wu et al. method derived on-orbit RVS and prelaunch RVS over scan angles at −56.063° (EVBOS), −8° (OBCBB AOI), +56.063° (EVEOS), and averaged over the entire EV scan (Scan Avg.), for HAM-A and HAM-B. Cases with differences exceeding ±0.3% are highlighted.
| Unit: % | On-Orbit RVS (the Wu et al. Method)—Prelaunch RVS |
|---|
| −56.063° | −8° | +56.063° | Scan Avg. |
|---|
| NOAA-20 | I4 | 0.11/0.09 | 0.16/0.11 | 0.03/0.00 | 0.10/0.07 |
| I5 | 0.32/0.30 | −0.10/−0.27 | −0.34/−0.55 | −0.09/−0.23 |
| M12 | 0.08/0.09 | 0.07/0.09 | −0.05/−0.04 | 0.03/0.04 |
| M13 | 0.02/0.02 | −0.06/−0.06 | −0.12/−0.12 | −0.06/−0.06 |
| M14 | 0.78/0.79 | 0.22/0.25 | −0.09/−0.04 | 0.25/0.28 |
| M15 | 0.44/0.43 | −0.14/−0.29 | −0.40/−0.60 | −0.09/−0.23 |
| M16 | 0.22/0.22 | −0.04/−0.17 | −0.20/−0.37 | −0.04/−0.15 |
| S-NPP | I4 | 0.03/0.01 | 0.04/−0.03 | −0.02/−0.09 | 0.02/−0.04 |
| I5 | −0.06/−0.12 | −0.25/−0.54 | −0.20/−0.55 | −0.19/−0.45 |
| M12 | −0.01/−0.02 | −0.08/−0.13 | −0.12/−0.18 | −0.08/−0.12 |
| M13 | −0.06/−0.06 | −0.20/−0.22 | −0.18/−0.22 | −0.17/−0.20 |
| M14 | 0.06/−0.04 | 0.13/−0.32 | 0.28/−0.27 | 0.17/−0.24 |
| M15 | −0.04/−0.13 | −0.24/−0.65 | −0.24/−0.74 | −0.20/−0.57 |
| M16 | −0.02/−0.07 | −0.14/−0.33 | −0.13/−0.35 | −0.11/−0.28 |
Table 5.
NOAA-20 VIIRS–CrIS scan averaged biases at 10 scene temperatures for the NOAA operational (prelaunch RVS) and the reprocessed SDRs (the Wang et al. method derived on-orbit RVS). Unit for scene temperatures and biases: K.
Table 5.
NOAA-20 VIIRS–CrIS scan averaged biases at 10 scene temperatures for the NOAA operational (prelaunch RVS) and the reprocessed SDRs (the Wang et al. method derived on-orbit RVS). Unit for scene temperatures and biases: K.
| Scene Temperature | Prelaunch RVS | Wang et al. On-Orbit RVS |
|---|
| M15 | M16 | M13 | I5 | M15 | M16 | M13 | I5 |
|---|
| 220 | 0.40 | 0.19 | - | 0.26 | 0.12 | 0.10 | - | 0.06 |
| 230 | 0.31 | 0.14 | - | 0.20 | 0.11 | 0.08 | - | 0.05 |
| 240 | 0.24 | 0.10 | - | 0.14 | 0.10 | 0.05 | - | 0.03 |
| 250 | 0.18 | 0.05 | 0.05 | 0.09 | 0.08 | 0.02 | 0.03 | 0.01 |
| 260 | 0.11 | 0.01 | 0.04 | 0.03 | 0.06 | 0.01 | 0.08 | 0.02 |
| 270 | 0.05 | 0.04 | 0.08 | 0.03 | 0.03 | 0.05 | 0.11 | 0.04 |
| 280 | 0.01 | 0.08 | 0.09 | 0.07 | 0.02 | 0.07 | 0.10 | 0.06 |
| 290 | 0.05 | 0.12 | 0.13 | 0.11 | 0.02 | 0.11 | 0.12 | 0.08 |
| 300 | 0.07 | 0.15 | 0.19 | 0.13 | 0.02 | 0.12 | 0.18 | 0.09 |
| 310 | 0.15 | 0.19 | 0.29 | 0.20 | 0.05 | 0.15 | 0.28 | 0.13 |
Table 6.
S-NPP VIIRS–CrIS scan averaged biases at 10 scene temperatures for the NOAA operational (prelaunch RVS) and reprocessed (the Wang et al. method derived on-orbit RVS) SDRs. Unit for scene temperatures and biases: K.
Table 6.
S-NPP VIIRS–CrIS scan averaged biases at 10 scene temperatures for the NOAA operational (prelaunch RVS) and reprocessed (the Wang et al. method derived on-orbit RVS) SDRs. Unit for scene temperatures and biases: K.
| Scene Temperature | Prelaunch RVS | Wang et al. On-Orbit RVS |
|---|
| M15 | M16 | M13 | I5 | M15 | M16 | M13 | I5 |
|---|
| 220 | 0.24 | 0.04 | - | 0.07 | 0.08 | 0.04 | - | 0.01 |
| 230 | 0.18 | 0.02 | - | 0.05 | 0.06 | 0.02 | - | 0.01 |
| 240 | 0.13 | 0.01 | - | 0.03 | 0.03 | 0.01 | - | 0.01 |
| 250 | 0.09 | 0.01 | 0.08 | 0.02 | 0.02 | 0.01 | 0.06 | 0.01 |
| 260 | 0.05 | 0.02 | 0.09 | 0.01 | 0.01 | 0.01 | 0.01 | 0.01 |
| 270 | 0.02 | 0.02 | 0.08 | 0.02 | 0.01 | 0.02 | 0.03 | 0.01 |
| 280 | 0.01 | 0.02 | 0.08 | 0.03 | 0.02 | 0.02 | 0.06 | 0.03 |
| 290 | 0.02 | 0.01 | 0.09 | 0.05 | 0.02 | 0.01 | 0.09 | 0.05 |
| 300 | 0.02 | 0.01 | 0.10 | 0.08 | 0.01 | 0.01 | 0.10 | 0.09 |
| 310 | 0.03 | 0.02 | 0.17 | 0.11 | 0.01 | 0.02 | 0.18 | 0.13 |


