Article

SBAS-InSAR Based Deformation Detection of Urban Land, Created from Mega-Scale Mountain Excavating and Valley Filling in the Loess Plateau: The Case Study of Yan’an City

College of Geo-Exploration Science and Technology, Jilin University, Changchun 130000, China
*
Author to whom correspondence should be addressed.
Remote Sens. 2019, 11(14), 1673; https://doi.org/10.3390/rs11141673
Submission received: 20 June 2019 / Revised: 9 July 2019 / Accepted: 11 July 2019 / Published: 14 July 2019
(This article belongs to the Special Issue Exploitation of Synthetic Aperture Radar Targets Velocities)

Abstract

:
Yan’an new district (YND) is one of the largest civil engineering projects for land creation in Loess Plateau, of which the amount of earthwork exceeds 600 million m3, to create 78.5 km2 of flat land. Such mega-scale engineering activities and complex geological characteristics have induced wide land deformation in the region. Small baseline subset synthetic aperture radar interferometry (SBAS-InSAR) method and 55 Sentinel-1A (S-1A) images were utilized in the present work to investigate the urban surface deformation in the Yan’an urban area and Yan’an new airport (YNA) from 2015 to 2019. The results were validated by the ground leveling measurements in the YNA. It is found that significant uneven surface deformation existed in both YND and YNA areas with maximum accumulative subsidence of 300 and 217 mm, respectively. Moreover, the average subsidence rate of the YND and YNA areas ranged from −70 to 30 mm/year and −50 to 25 mm/year, respectively. The present work shows that the land deformation suffered two periods (from 2015 to 2017 and from 2017 to 2019) and expanded from urban center to surrounding resettlement area, which are highly relevant with urban earthwork process. It is found that more than 60% of land subsidence occurs at filled areas, while more than 65% of surface uplifting occurs at excavation areas. The present work shows that the subsidence originates from the earth filling and the load of urban buildings, while the release of stress is the major factor for the land uplift. Moreover, it is found that the collapsibility of loess and concentrated precipitation deteriorates the degree of local land subsidence. The deformation discovered by this paper shows that the city may suffer a long period of subsidence, and huge challenges may exist in the period of urban maintaining buildings and infrastructure facilities.

Graphical Abstract

1. Introduction

Urban land subsidence is a widespread phenomenon associated with the rapid urbanization around the world [1,2,3]. Different reasons, including reclamation in coastal areas [4,5,6], industrial development and urban construction in delta areas [7,8,9] and the overexploitation of groundwater in plains areas [10,11] may cause urban ground deformation. Land subsidence is a complex geotechnical disaster with specific characteristics such as slow formation, long duration and irreversibility [12,13]. It should be indicated that land subsidence in large areas might cause settling funnels, seawater backflow, surface collapse and crustal displacement [14]. Moreover, land subsidence in urban areas could cause foundation collapse, underground pipeline destruction and road damage [15]. Therefore, the anticipation, detection and mitigation of urban land subsidence is of great significance [16].
The widely applied methods for monitoring urban surface deformation are leveling measurement and global navigation satellite system (GNSS) measurement [17]. These methods can achieve high precision at single points in the monitoring of local land subsidence with low spatial resolution and high cost [18]. On the other hand, synthetic aperture radar interferometry (InSAR) has significant advantages over other methods, including fast surface deformation with large monitoring range, operability in all climatic conditions, low operational cost and high spatial resolution [19]. The first application of the InSAR was the monitoring of an earthquake in Landers, California [20], but the temporal resolution was relatively low because of the absence of analyzing on time series images. To overcome this limitation, multi-temporal InSAR was introduced for long-term and large-scale monitoring of surface deformation [21,22]. More specifically, a permanent scatterers InSAR (PS-InSAR) method proposed by Ferretti et al. and a small baseline subset InSAR (SBAS-InSAR) method introduced by Berardino et al. have been widely used in related fields with millimetric accuracy [23,24,25]. Zhang and Zhou analyzed Wuhan land subsidence using SBAS-InSAR, and observed four major subsidence zones affected by urban construction and industrial development [26,27]. Chaussard et al. calculated land subsidence in Mexican and Indonesian cities using the SBAS-InSAR method, and found that land subsidence was directly related to the overexploitation of groundwater [2,28]. Studies show that the SBAS-InSAR algorithm has widened applicability in vegetation and nonurban regions, allowing researchers to analyze areas of low coherence [29,30,31].
China has undergone widespread urban land subsidence in different areas, including the Beijing-Tianjin-Hebei city belt, Yangtze River Delta urban zone and Pearl River Delta urban area [32,33]. Studies show that the overexploitation of groundwater is the major reason for land subsidence in China [34], while subsidence caused by mega-scale flat land creation is rarely considered. For a long time, cities on the Loess Plateau have suffered a shortage of flat land for urban construction [35], and as a result earthworks such as mountain excavating and valley filling have become significant to obtaining flat land for urban expansion [36]. However, these processes can lead to unpredictable environmental damages and geo-hazards [37,38]. Uneven subsidence associated with earthwork ranging from 0 to 55 mm was observed in Lanzhou from 2015 to 2016 [39]. Yan’an is a well-known city in China for having hosted the Central Committee of the Chinese Communist Party during World War II and preserving more than 140 historical relics from the revolution era [40]. However, urban expansion in Yan’an has been seriously limited due to the linear structure of the old city. Since 2011, the local government has carried out an enormous plan to establish a new 78-km2 city, Yan’an new district (YND), by excavating mountains and filling valleys. This plan has been named the mountain excavation and city construction (MECC) project, and is considered to be the largest earthwork project in the Loess Plateau [38]. The large-scale earthwork and complex site condition might induce significant surface deformation in the YND [37], and significant efforts have been carried out to ensure the implementation of the project, including theoretical research on the deformation mechanism of local loess and field monitoring of underground drainage blind ditches, collecting wells, drainage pipe culverts and groundwater level [41]. However, there is a lack of comprehensive and detailed research on distribution and the evolution of urban land subsidence in the YND land, posing an urgent need for the detection of surface deformation in the Yan’an urban area.
In this paper, the SBAS-InSAR method was applied to delineate the subsidence process in Yan’an city. Fifty-five Sentinel-1A images were processed to obtain comprehensive and detailed data of land subsidence in the Yan’an urban area from 2015 to 2019 after the earthwork completed. Moreover, the results were validated by ground measurements in the Yan’an new airport (YNA). This paper is organized as follows: Firstly, the background and significance of the research and study area are introduced. Then, the basic information of SBAS-InSAR method, data sets and specific procedure are presented. Finally, the main results of the subsidence in the Yan’an urban area and related causes are analyzed.

2. Study Area

Yan’an city (36°10′33″N to 37°2′5″N, 109°14′10″E to 110°30′43″E) is located at the middle region of the Yellow River in the central and southern areas of the Loess Plateau, China. Yan’an has a continental monsoon climate. The annual average precipitation in Yan’an is about 560 mm, where more than 70% of the total annual precipitation is concentrated in June to September [42]. Moreover, most of rainstorms occur in August, which is one of the main factors of the soil erosion in the study area [43]. For example, the extreme rainfall in July 2013 caused serious loess collapse, loess landslide, land subsidence and other geo-hazards in Yan’an [44]. The main landscapes in Yan’an are hills and valleys with an average elevation of 1200 m. Late Pleistocene aeolian Malan loess and Holocene alluvial loess with strong collapsibility are widely distributed, which are the primary deposits causing engineering construction complexity [45].
Figure 1 shows the old Yan’an urban area located at the intersection of three mountains (Phoenix Hill, Qingliang Hill and Pagoda Hill) and two rivers (the Yanhe and Nanchuan rivers). The old city has a typical Y-shaped structure with a total length of over 20 km, but is just hundreds of meters wide, which causes available land to be an extremely limited resource among a huge population. Furthermore, the new district (YND) is located at the north of Qingliang Hill, covering an area about 5 km from south to north, and about 6 km from west to east, which has been established by the local government for anticipated urban developments.
The construction of YND is the largest geotechnical project in a collapsible loess area around the world, and the volume of this earthwork is twice of that of the Three Gorges Dam. The earthwork was commenced April 2012, and was partly completed by the end of June 2015, with remaining earthwork postponed due to unpredictable environmental problems. Based on the official reports, the real amount of earthwork was about 600 million m3, of which about 330 million and 270 million m3 were related to excavating and filling works, respectively. The maximum depth of filling exceeded 112 m, and the real created flat land for the development and construction was approximately 22.7 km2, including 10.4 km2 of excavating and 12.3 km2 of filling (Figure 2) [41].
Yan’an new airport is located in Liulin Town, Baota District, 13 km southwest of Yan’an city center. It was built between August 2013 and November 2018, with a track 3 km long and 45 m wide. It should be indicated that, similar to YND, the land for the new airport was also acquired by mountain excavating and valley filling [46].

3. Materials and Methods

3.1. Sentinel-1A Data

In order to obtain a comprehensive and detailed surface deformation of the research region, 55 Sentinel-1A images are utilized from the period of February 2015 to January 2019, with a sampling interval of approximately 30 days. The mean and maximum absolute baseline are 51 and 121 m, respectively. Table 1 shows the specific information of the data set. Moreover, precise orbital ephemeris data and global terrain data (shuttle radar topography mission (SRTM)) are applied into the orbit refinement and terrain phase removal, respectively.

3.2. SBAS-InSAR

3.2.1. Basic Theory of SBAS-InSAR

The SBAS-InSAR technique is an analysis method for multi-master-image InSAR time series that utilizes interferometric pairs of small time-space baselines to generate the surface deformation. This technique overcomes the low coherence of some interferograms induced by single super-master images and reduces the requirement of the quantity of SAR images with respect to PS-InSAR [29]. SBAS-InSAR is widely applied in land subsidence detection [26,27,31], and is based on the following equations [25]:
N + 1 2 M N ( N + 1 2 )
ϕ j ( x , r ) = ϕ ( t B , x , r ) ϕ ( t A , x , r ) Δ ϕ d i s p + Δ ϕ t o p o + Δ ϕ o r b + Δ ϕ a t m + Δ ϕ n o i s e
Equation (1) represents the quantity range of M differential interferograms generated by N + 1 SAR images at the same area with ordered time ( t 0 , t 1 , t N ) . Moreover, Equation (2) represents the composition of the interferometric phase of interferogram j (generated by two images at t B and t A ) in the pixel ( x , r ) , where x and r are the azimuth and the range coordinate, respectively. Phase Δ ϕ d i s p is induced by the change of distance between target and radar along the line of sight (LOS). Furthermore, phases Δ ϕ t o p o , Δ ϕ o r b , Δ ϕ a t m and Δ ϕ n o i s e are generated by the terrain, satellite orbit error, atmosphere effect (especially the effect of tropospheric delay) and other noise, respectively. SBAS-InSAR removes the residual components from interferometric phase to obtain deformation phase Δ ϕ d i s p . Then, a system of M equations with N unknowns can be organized as the following matrix:
A ϕ = δ ϕ
where A donates an M × N coefficient matrix, ϕ = [ ϕ ( t 1 ) , ϕ ( t 2 ) , , ϕ ( t N ) ] T is the N × 1 vector of unknown deformation phase values with measurement points, and δ ϕ = [ δ ϕ ( t 1 ) , δ ϕ ( t 2 ) , , δ ϕ ( t N ) ] T is the N × 1 vector of unwrapped phase values. Deformation velocity can be obtained by rewriting Equation (3) into the following equation:
B v = δ ϕ
where B is an M × N coefficient matrix and v donates the mean phase velocity as follows:
v = [ v 1 , v 2 , v N ] T = [ ϕ 1 t 1 t 0 , ϕ 2 ϕ 1 t 2 t 1 , , ϕ N ϕ N 1 t N t N 1 ] T .
Finally, the least square (LS) or singular value decomposition (SVD) algorithms can be applied to Equations (4) and (5) to calculate the deformation velocity [31,47]. The cumulative deformation can be generated by performing the calculation on aforementioned equations over a specific time span.

3.2.2. Data Processing

For SBAS-InSAR process, primary errors come from data quality (orbit accuracy, coherence quality, etc.), atmosphere phase error and phase unwrapping. The data processing procedure can be divided into four parts as follow:
  • The first part is the basis of the SBAS-InSAR. By selecting a definite temporal-spatial baseline threshold (time baseline 120 days, space baseline 121 m), the data sets were divided into different subsets and 201 interferometric pairs were generated (Figure 3).
  • The second part is the interferometric flow step. Firstly, the external DEM data was utilized for auxiliary co-registration with accuracy of the sub-pixel level [48]. Then, the differential interferometry process was conducted for each pair to obtain interferograms and a coherence coefficient map. In addition, we removed the topographical phase by external DEM data, eliminated the noise phase using a Goldstein filter [49] and unwrapped the phase using the minimum cost flow (MCF) method [50]. Finally, Equation (6) was employed to calculate the theoretical precision with the interferometric coherence γ and the wavelength λ.
    1 γ 2 2 γ 2 λ 4 π
  • The third part is the key step in generating surface deformation. In this research, ground control points (GCPs) were exploited to eliminate the change of phase caused by satellite orbit errors and remove the residual topographic phase. Once the quality inspection was approved, the linear model and residual phase were used to estimate the surface deformation. The effect of atmosphere delay was alleviated by a spatial-temporal filter (time filter window set to 365 days, space filter window set to 1800 m) to obtain the accumulated land deformation and average deformation rate along the LOS direction [51].
  • The forth part is the process of generating land subsidence (vertical deformation). It is assumed that surface deformation mainly originated by vertical components while ignoring the influence of horizontal components. Vertical deformation S was calculated via combination with incident angle θ i and displacement d in the LOS direction, based on the relationship shown as Equation (7) [52]. Finally, the surface displacement data were geocoded to obtain the result in the WGS84 coordinate system.
    S = d c o s θ i

4. Results

The SBAS-InSAR achieved favorable coverage in the study area, with theoretical precision of 0–1.8 mm/year, 0–2.5 mm/year and 0–4 mm/year in the old urban, YND and YNA areas, respectively. Figure 4a indicates that the whole ground surface of the old urban area from February 2015 to January 2019 maintained stability, and the deformation rate was primarily in the range of −6 to 7 mm/year. Moreover, Figure 4b shows severe surface deformation within the YND region, varying from −70 to 30 mm/year. On the other hand, uneven surface deformation with a range of −50 to 25 mm/year was found in the south and north end of the runway in the YNA area. It should be indicated that the positive and negative values represent land uplift and subsidence, respectively. In addition, a precise ground leveling survey in YNA was utilized to validate obtained results from the SBAS-InSAR scheme, where 7.4 mm/year of the root mean square error (RMSE) was calculated.

4.1. Surface Deformation of YND

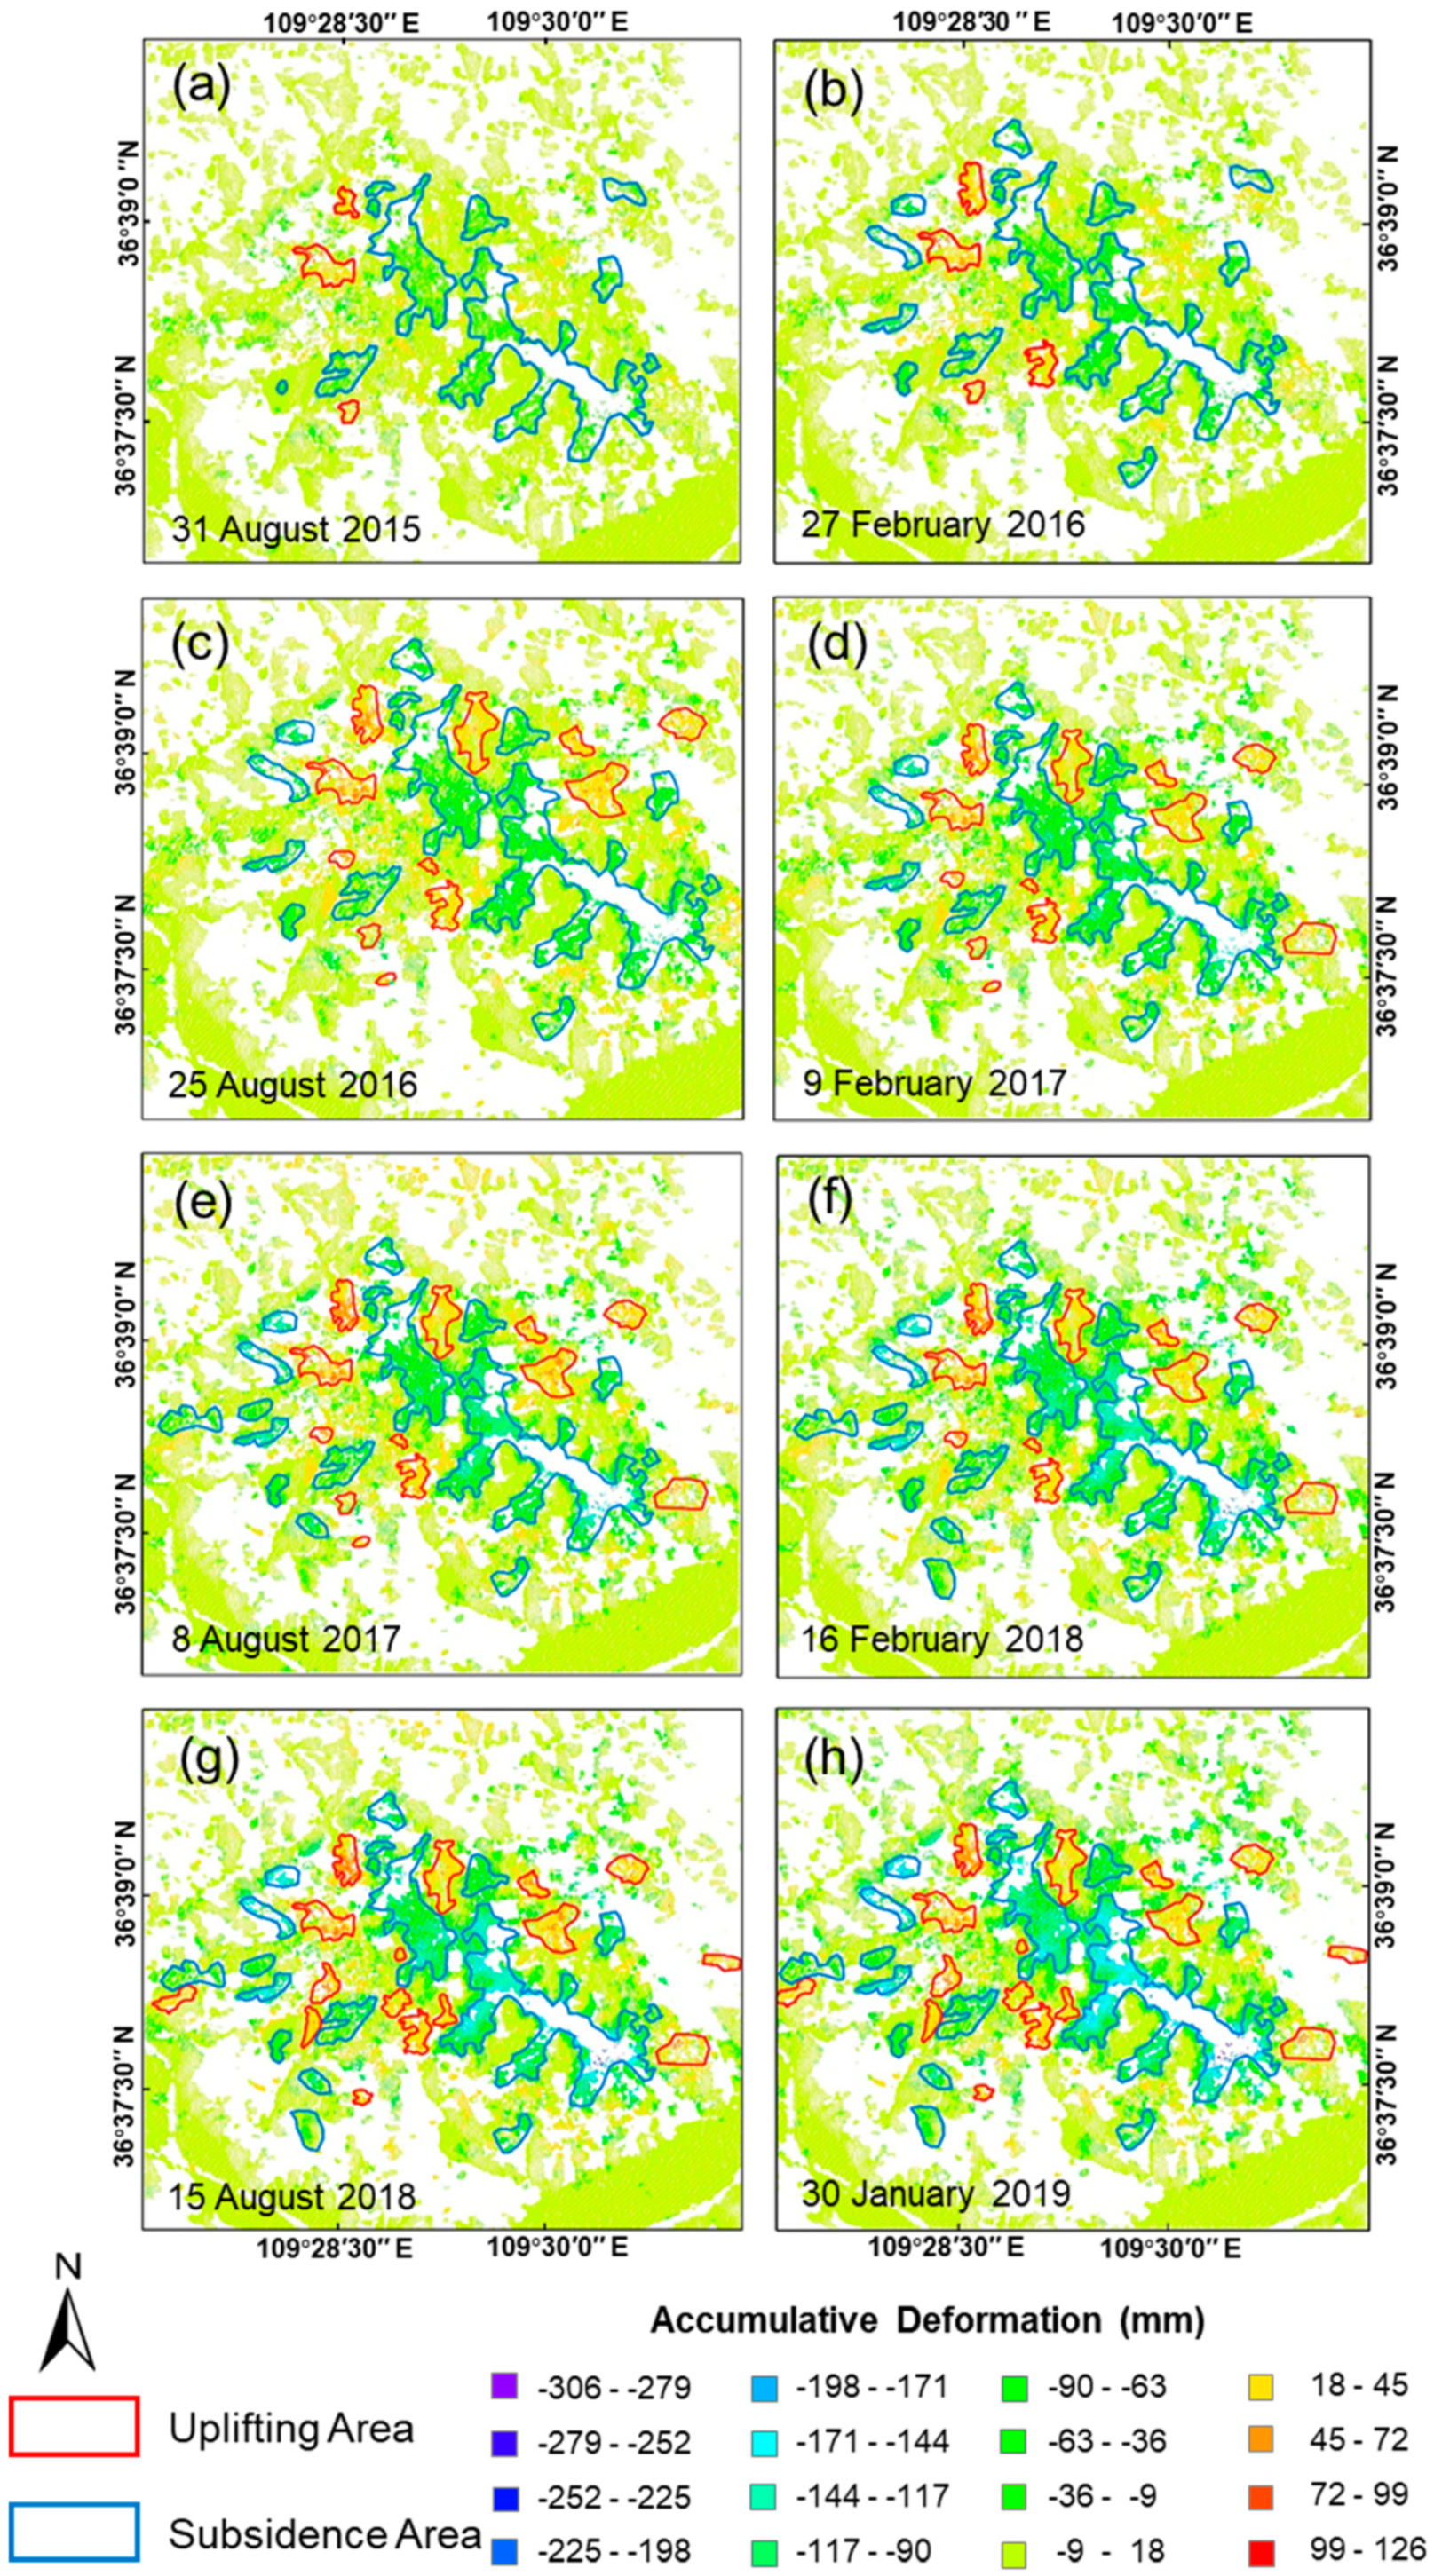
4.1.1. Spatial Distribution of the Land Subsidence

Figure 4 illustrates the results of the surface deformation in YND. The major land sinking was concentrated in filling areas along valleys with average and maximum subsidence rates of 20 and 70 mm/year, respectively. There was a northwest to southeast subsidence zone along the area between Shanghai Road and Xingzhi Road, which was spread between Yan’an Grand Theater and Yan’an People Park. The most significant subsidence occurred in the southeast end of the subsidence zone with cumulative land subsidence reaching 300 mm. The majority of land uplifting was performed at the mountain-excavated area, where the average and maximum uplift rates were 15 and 30 mm/year, respectively. The most significant uplifting was in the residential area on the northwest of YND and the surroundings of Yan’an Learning Academic, with cumulative uplift of 100 mm. Mega-scale earthwork of serious collapsible loess might be the main reason contributing to this phenomenon.
Figure 5 shows that a significant subsidence zone developed from the northwest towards southeast between the Xingzhi Road and Shanghai Road. Figure 5a shows that the most severe subsidence is located at narrow strips between the Xingzhi Road and the Shanghai Road, close to the Jinming Street (region A). It is observed that the maximum and average cumulative subsidence are 306 and 180 mm, respectively. Moreover, Figure 5b indicates that the velocity of subsidence decreases annually. The average rate of subsidence was approximately 100 mm/year from 2015 to 2017, while it was approximately 50 mm/year from 2017 to 2019. Furthermore, Figure 5a shows another severe subsidence region along the subsidence zone at the other end of the narrow strips, close to Zichang Road (region B). It is found that the maximum and average cumulative subsidence are 195 and 150 mm, respectively. Moreover, both maximum and average accumulations increase linearly with the maximum rate of 50 mm/year.
The subsidence zone is located in the central area of YND, where the main earth filling operation was carried out. The filling height is dozens of meters, with a maximum height of nearly 100 m. Figure 6 shows that there a negative correlation exists between the subsidence and elevation. Furthermore, it is observed that many residential and commercial buildings are built along the subsidence zone. Thus, human activities, including land creation and urban construction, might be the primary human factors contributing to local severe subsidence.
Figure 7a shows that there is an apparent uplifting trend in the north of the Yan’an Learning Academic (region C), where the large-scale mountain excavation project was launched. Figure 7b indicates that the maximum and average cumulative uplifts are 85 and 58 mm, respectively. Moreover, it is found that the uplift reached to 62 mm from February 2015 to October 2016, and a significant lifting of 30 mm is observed from May 2017 to August 2017, which might be attributed to the building construction. It is illustrated that the ground surface shows a steady trend during the interval of these two periods and after August 2017. The most significant land uplift is detected at the intersection of North Ring Road and Park North Road, with maximum and average uplifts of 126 and 46 mm, respectively. Figure 7c shows that this region has significant uplifting of about 100 mm from February 2015 to October 2015, while the lifting reduces to 20 mm from October 2015 to January 2019. The large amounts of mountain excavation work that were released by the load from the bulldozed mountains might be the major human factor leading to local surface uplift.

4.1.2. Temporal Evolution of the Land Subsidence

Figure 8 shows the evolution of cumulative surface deformation in the YND area from February 2015 to January 2019. It should be noted that two significantly different periods were observed. From 2015 to 2017, there were rapid land subsidence and uplift with maximum rates of 100 and 50 mm/year, respectively. The deformation region gradually expanded from the urban center to the surrounding areas, and the major land subsidence was concentrated in the subsidence zone (Figure 5a), while the major uplift was in the area surrounding the Yan’an Learning Academic (Figure 7a). The deformation might be attributable to the compressible and collapsible deformation, during which the air among the soil would be gradually discharged as the soil densifies. From 2017 to 2019, several new resettled residential quarters around YND experienced obvious land subsidence, and the urban center suffered, with maximum rate of 50 mm/year. The major earthwork was finished in the middle of 2015, and the deformation experienced a two-year uneven subsidence, with a decreasing rate since the end of 2017 and an uplift that was nearly zero during the same time, meaning that the load release had completed.

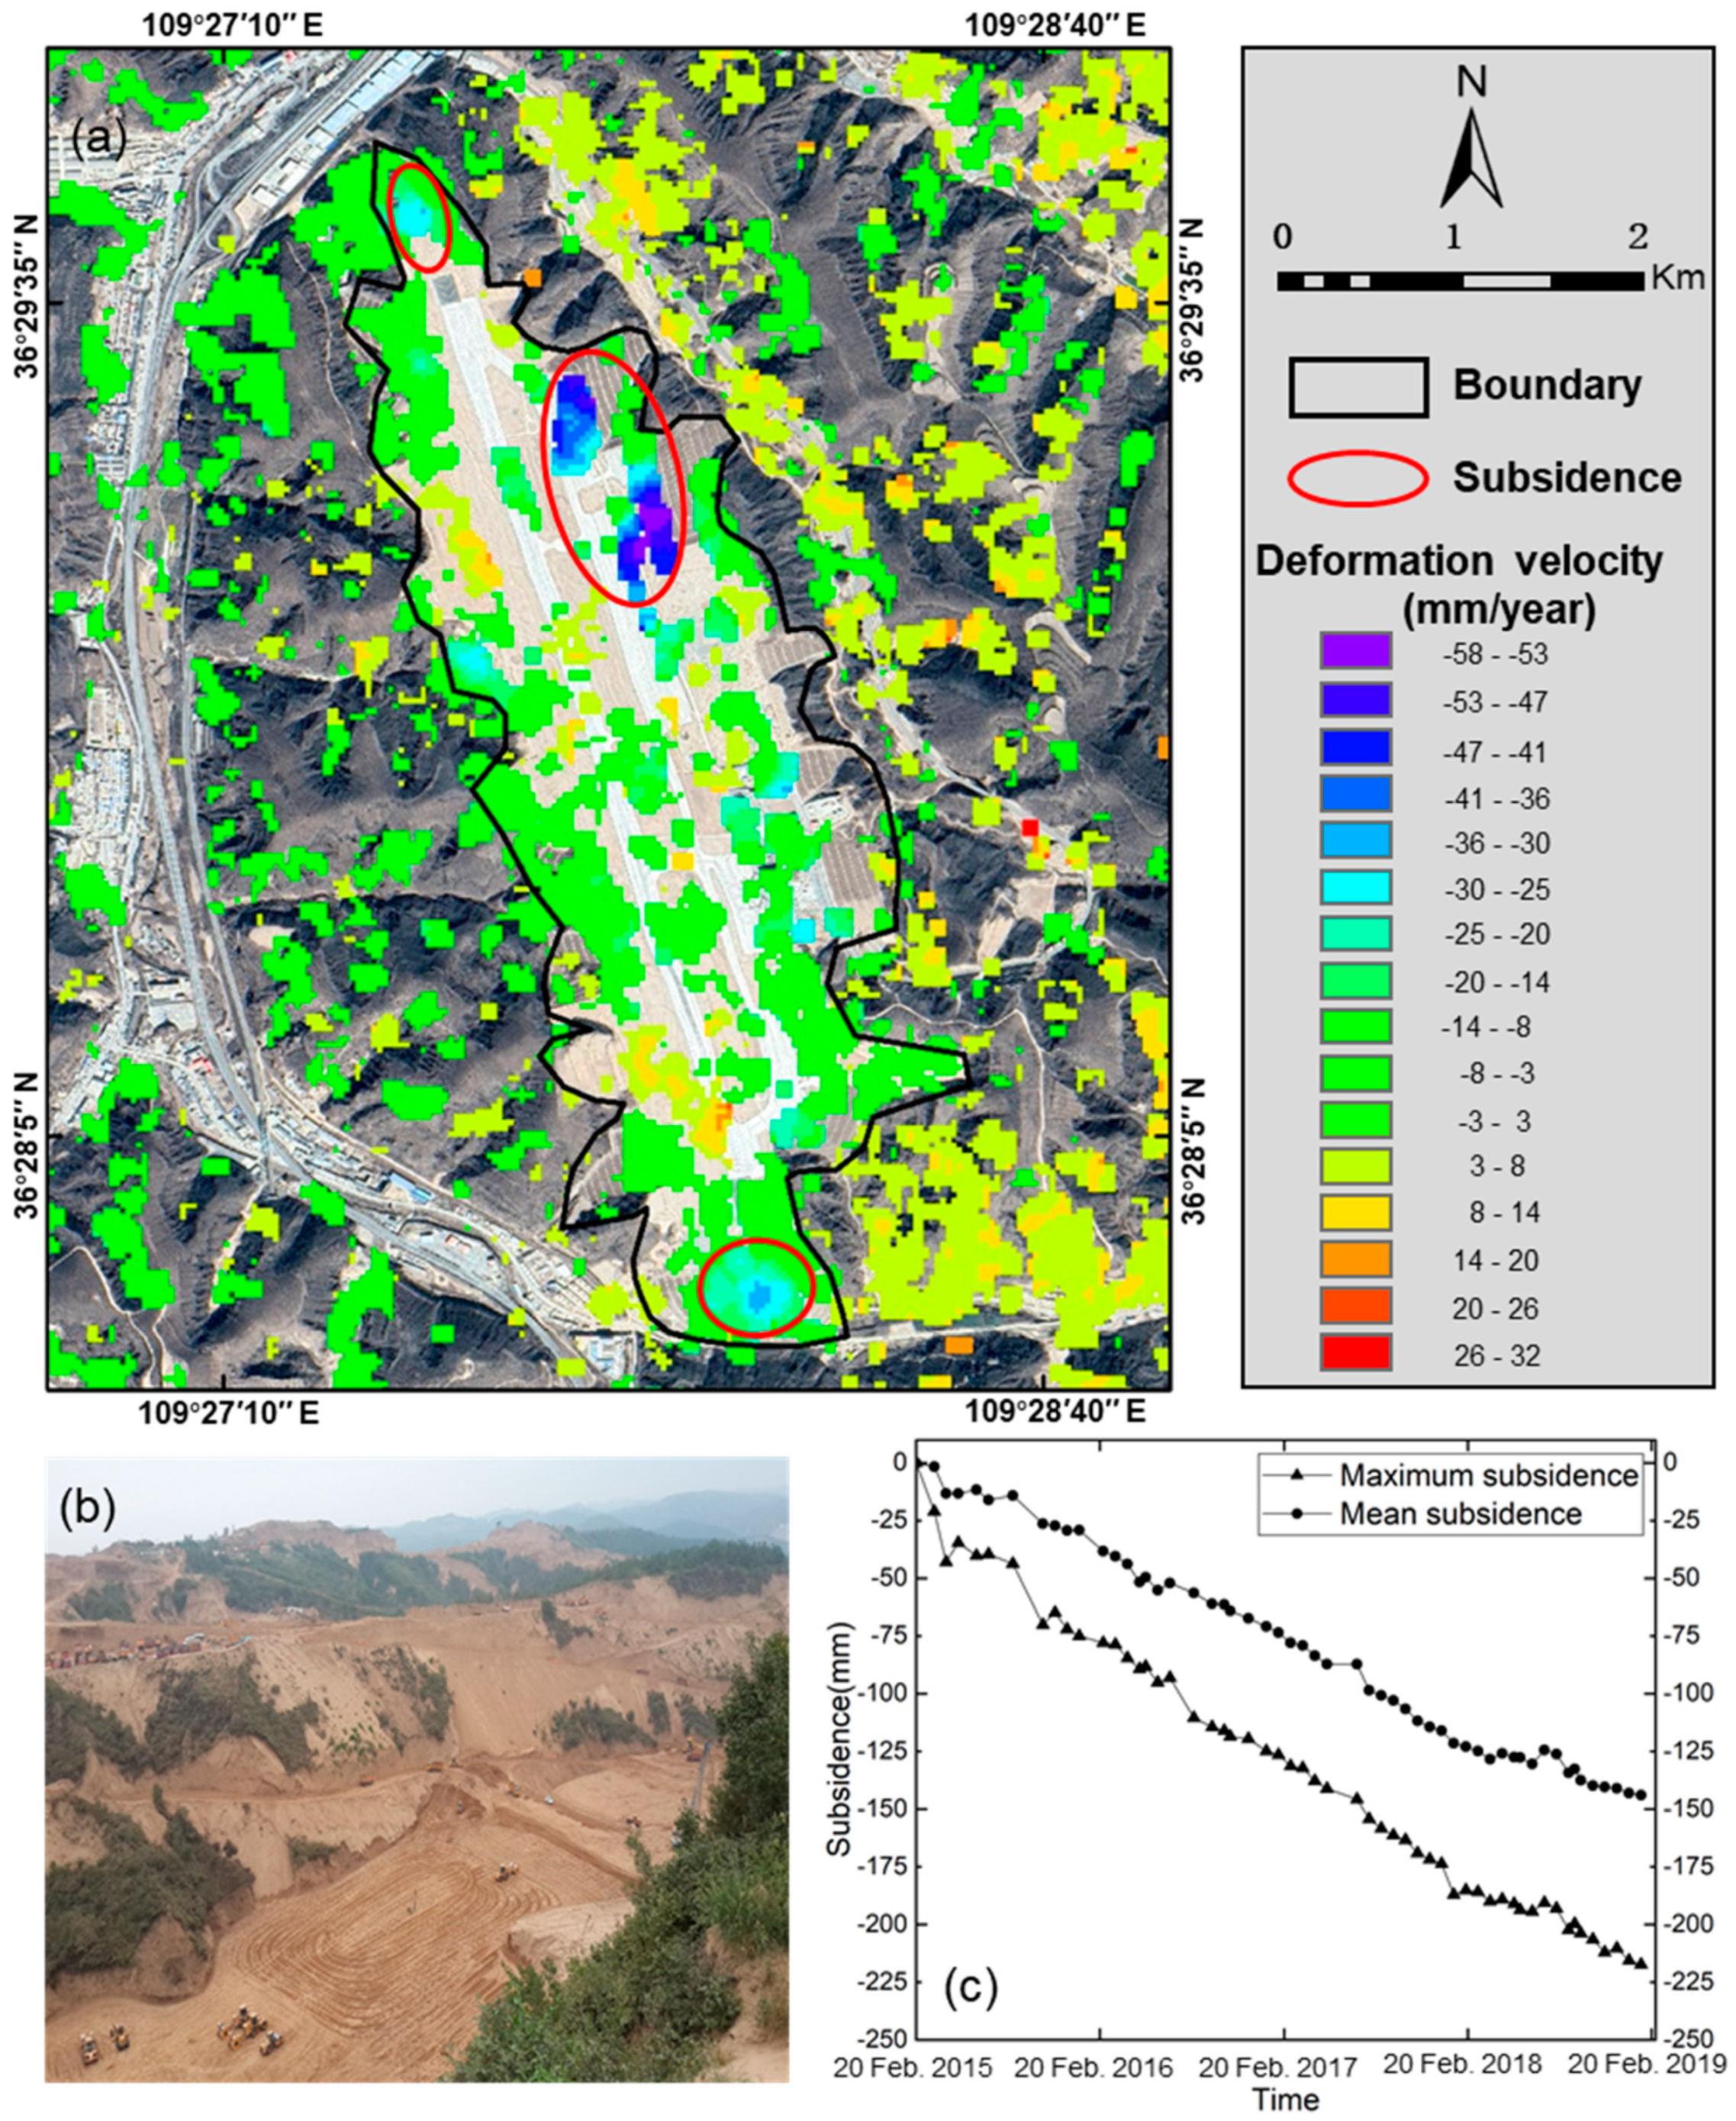
4.2. Surface Deformation of YNA

Figure 9a shows that the deformation velocity map derived from SBAS-InSAR method covers most area of the runway and the surrounding slopes in YNA. The obtained results show that there was uneven surface deformation between the north–south direction of slopes and runway from February 2015 to January 2019. Figure 9b indicates that the most significant subsidence occurred in the northeast of runway, where large amounts of filling loess was applied to fill valleys. On the other hand, Figure 9c indicates that the maximum and average cumulative subsidence amounts during the study period were 217 and 144 mm, respectively. Moreover, a linear trend of 50 mm/year is observed. It is found that the subsidence at the both ends of the runway is 30 mm/year. The west slope slightly uplifts with a maximum rate of 20 mm/year, where the mountains were excavated. The local uneven surface deformation may be attributable to the instability of loess foundation in the filling area and the released load of excavated mountains.

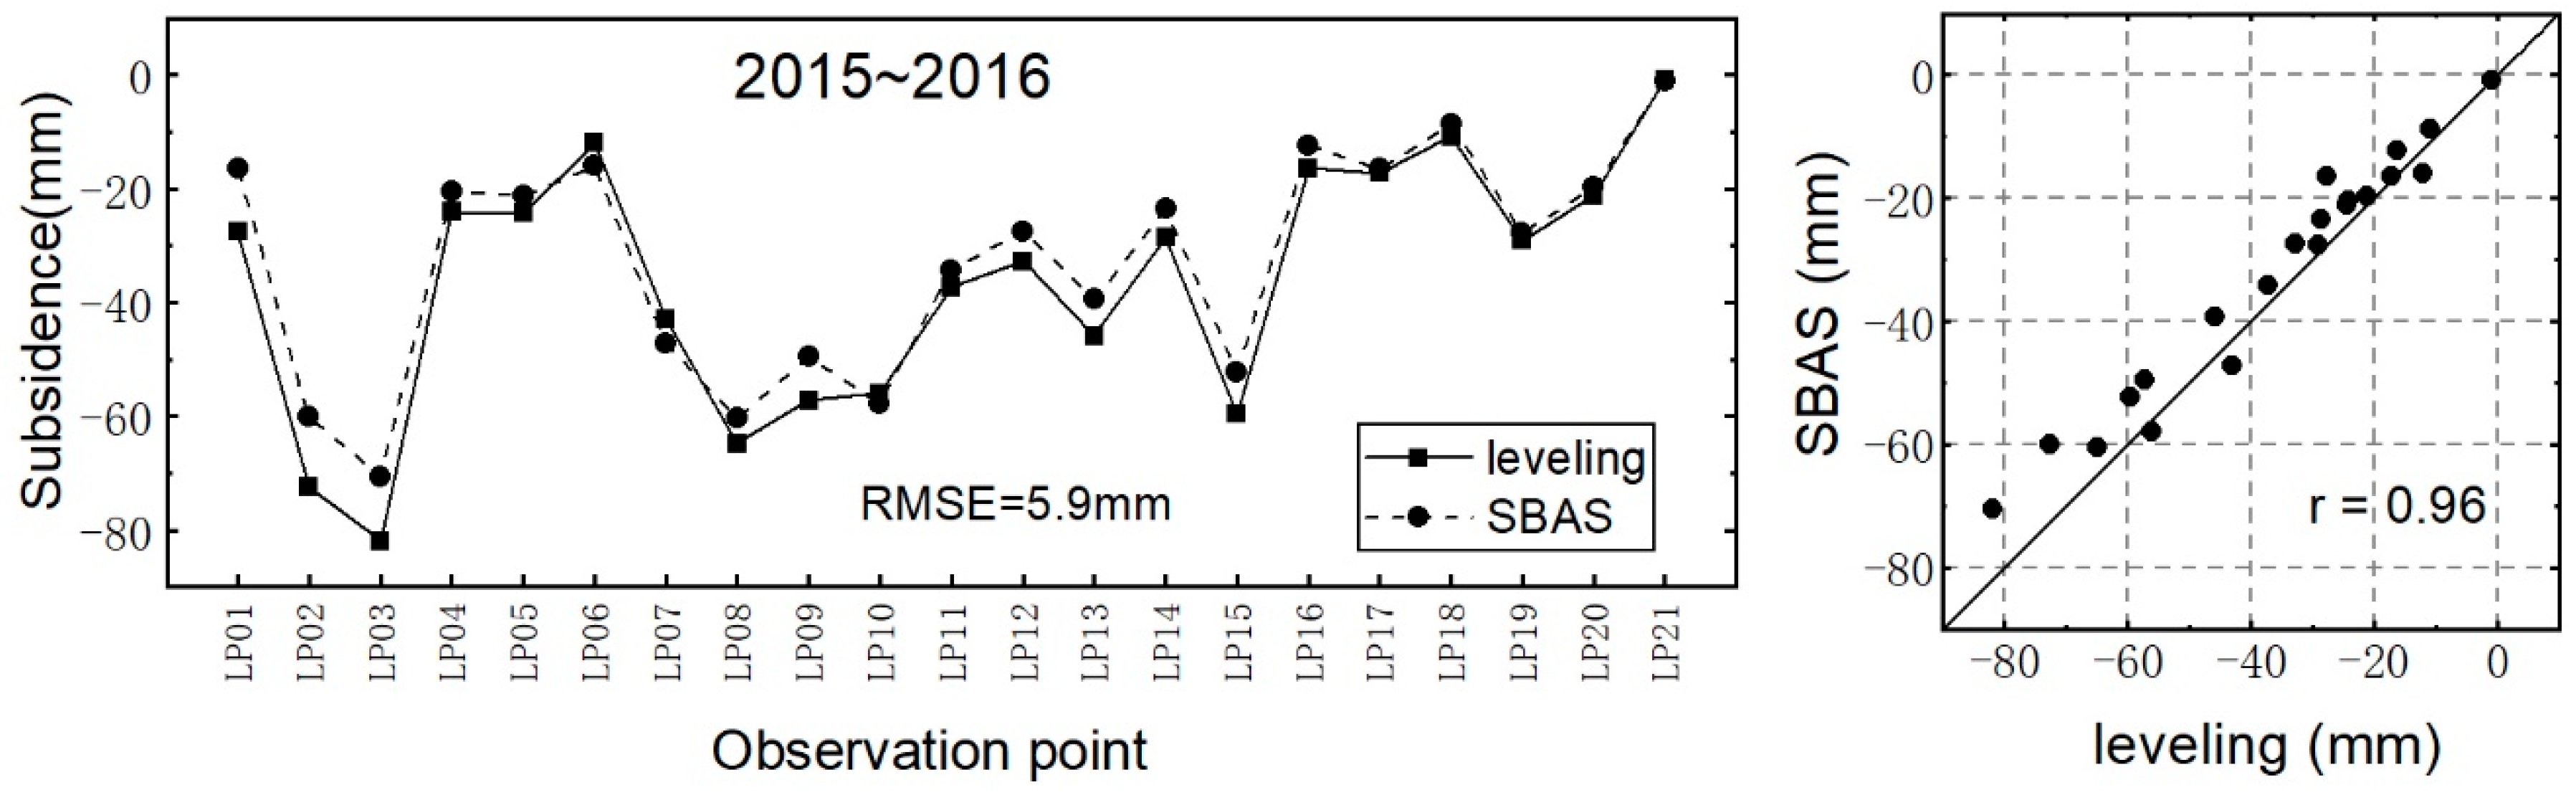
4.3. Validation of SBAS-InSAR Results

Twenty-one highly precise leveling points in YNA (Figure 10) were used to verify the validity of SBAS-InSAR results. This research compared the results of SBAS and leveling data at these leveling points. It should be noted that leveling results were derived from differences between the last and the first measurement, while SBAS results were extracted from the pixels, including the location of the leveling point. Figure 11 shows a comparison of the two sets from August 2015 to June 2016. Results show that the two data sets have reasonable consistency. Moreover, the RMSE and correlation coefficient value of the two sets are 5.9 mm (7.4 mm/year) and 0.96, respectively. The largest and mean differences between the two sets are 12.4 mm and 3.8 mm, respectively. Although leveling data of subsidence points in YND are absent, the data source and deformation process in YND and YNA are consistent, which indicates that the SBAS-InSAR monitoring in the YND also yielded relatively reliable results.

5. Discussion

5.1. Human Activities Contributing to the Land Subsidence

In the aforementioned sections, it was found that land creation and urban construction in Yan’an induced a wide area of surface deformation. Land creation has destroyed the original loess structure of the local area, which has caused severe instabilities in filling loess foundation. In addition, large numbers of buildings have increased the external pressure on surface and accelerated the compressible deformation of the loess layer and building foundations.

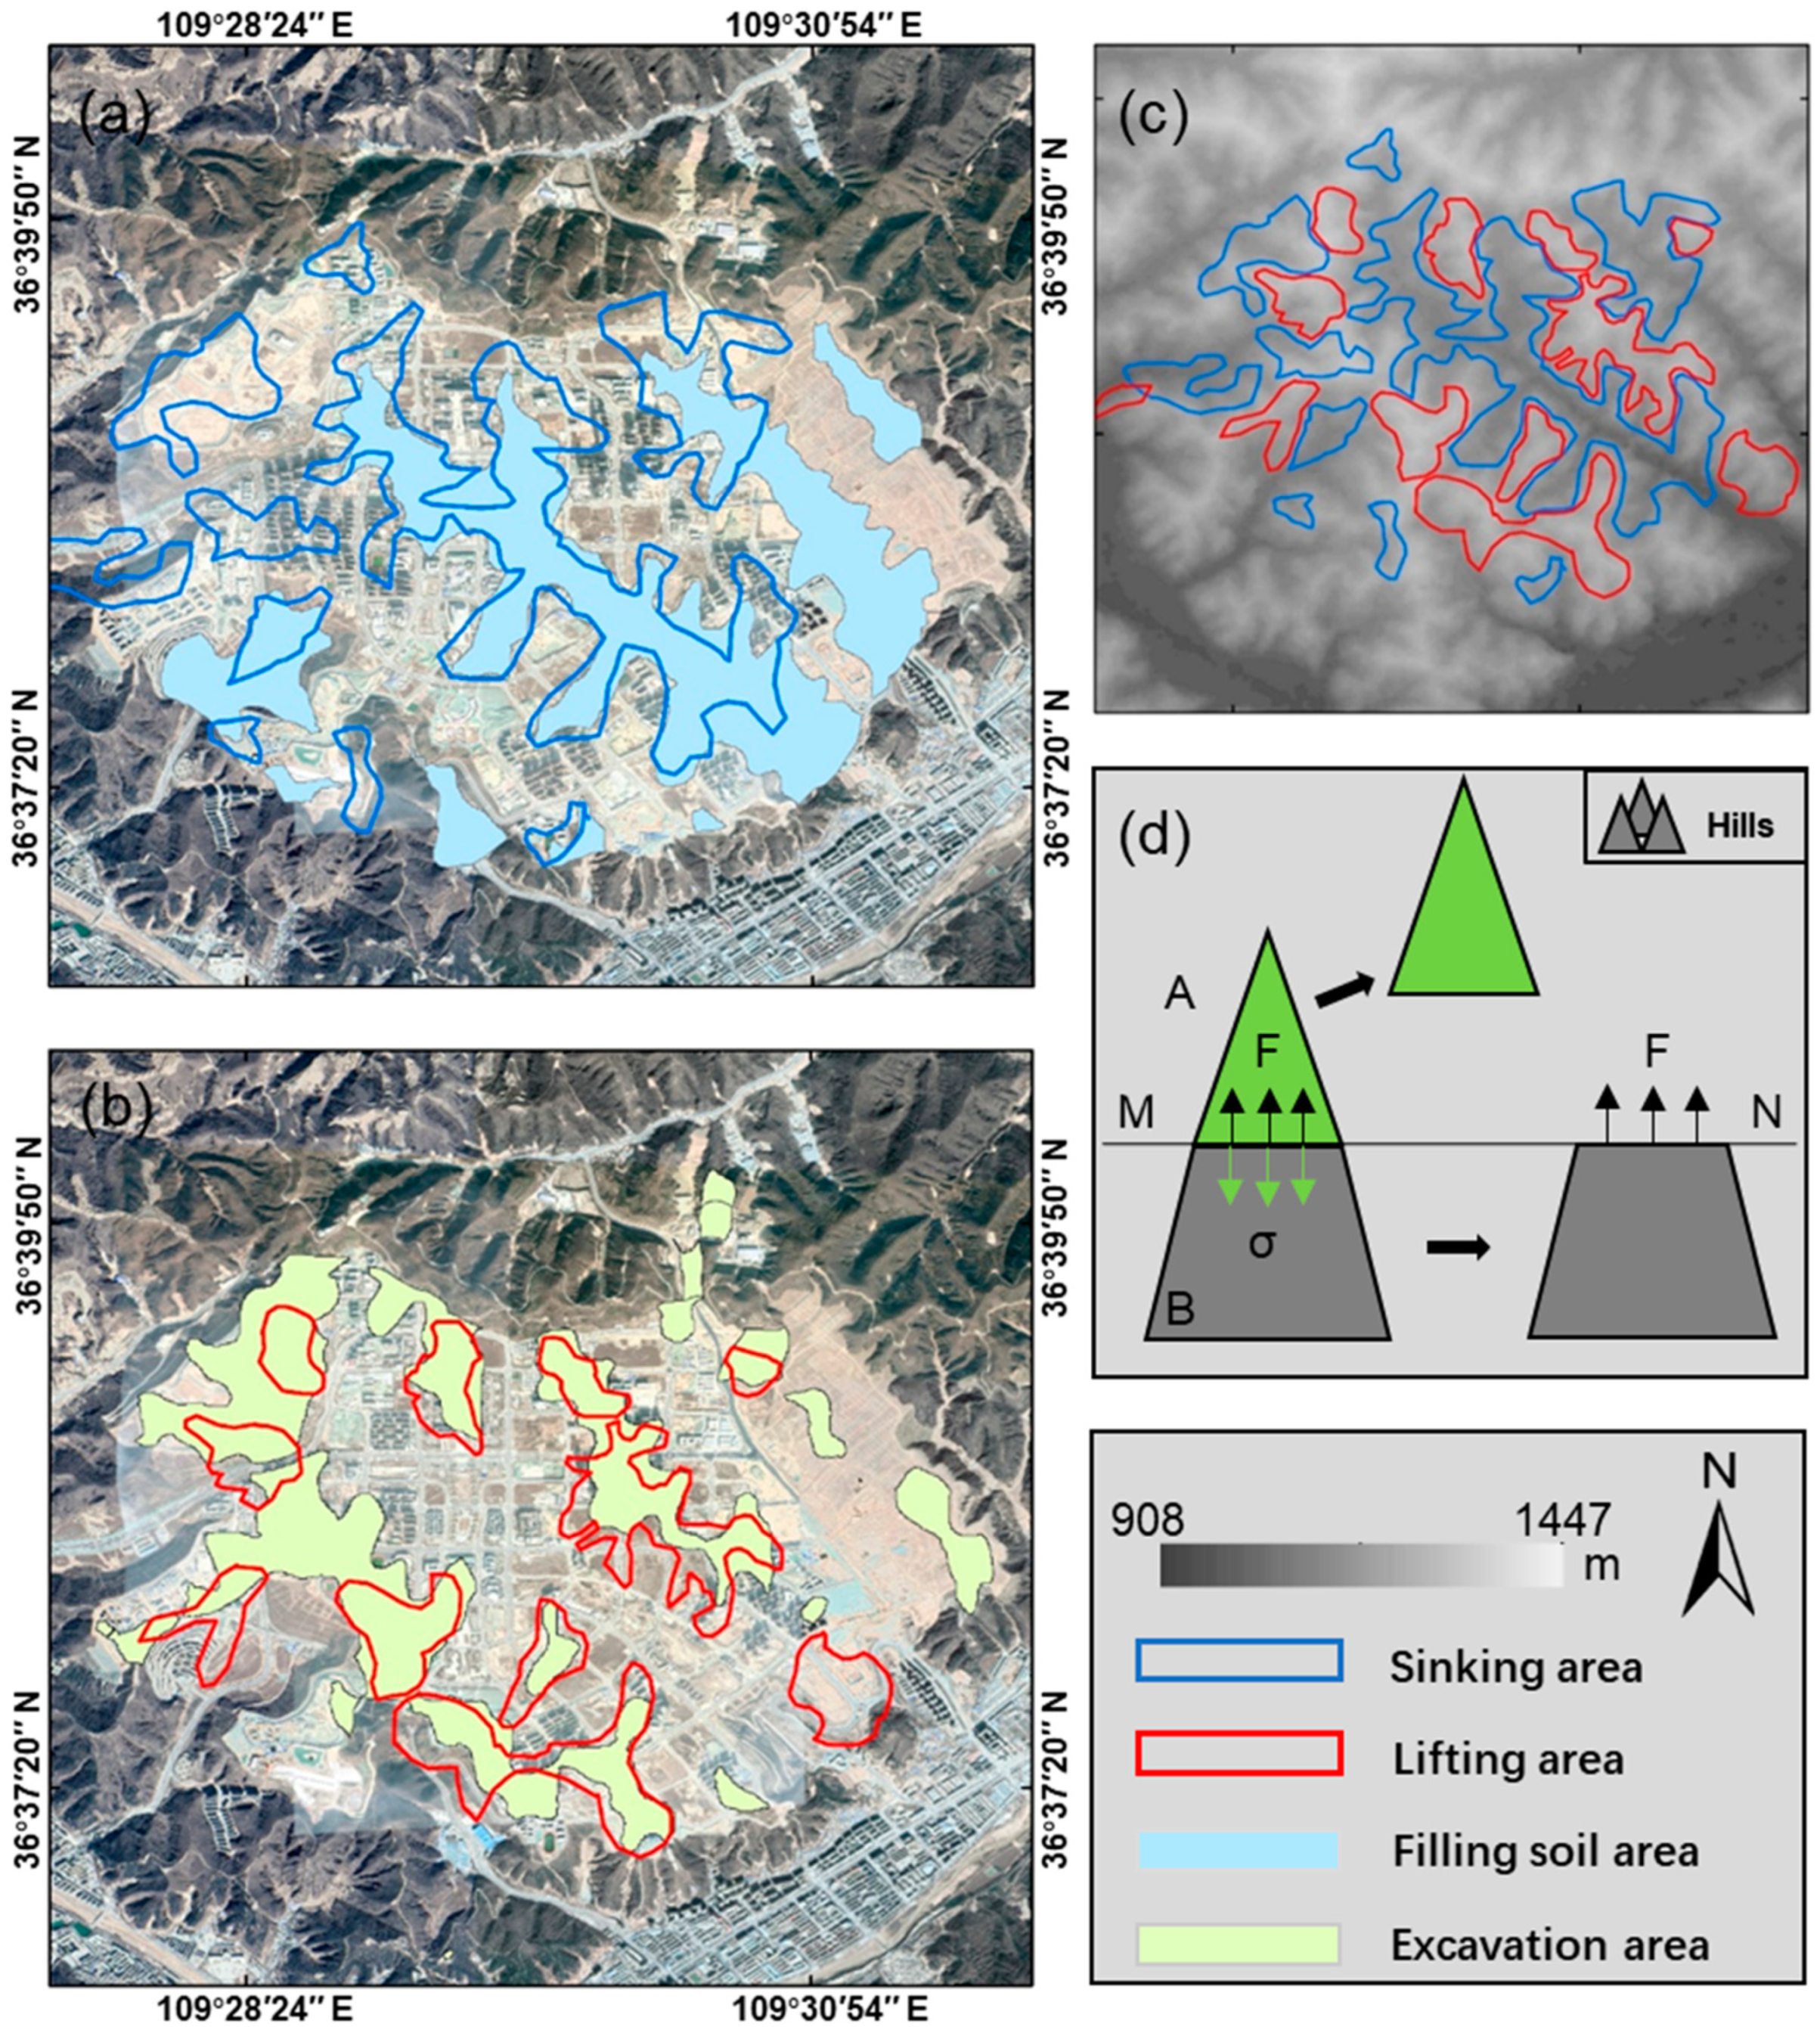
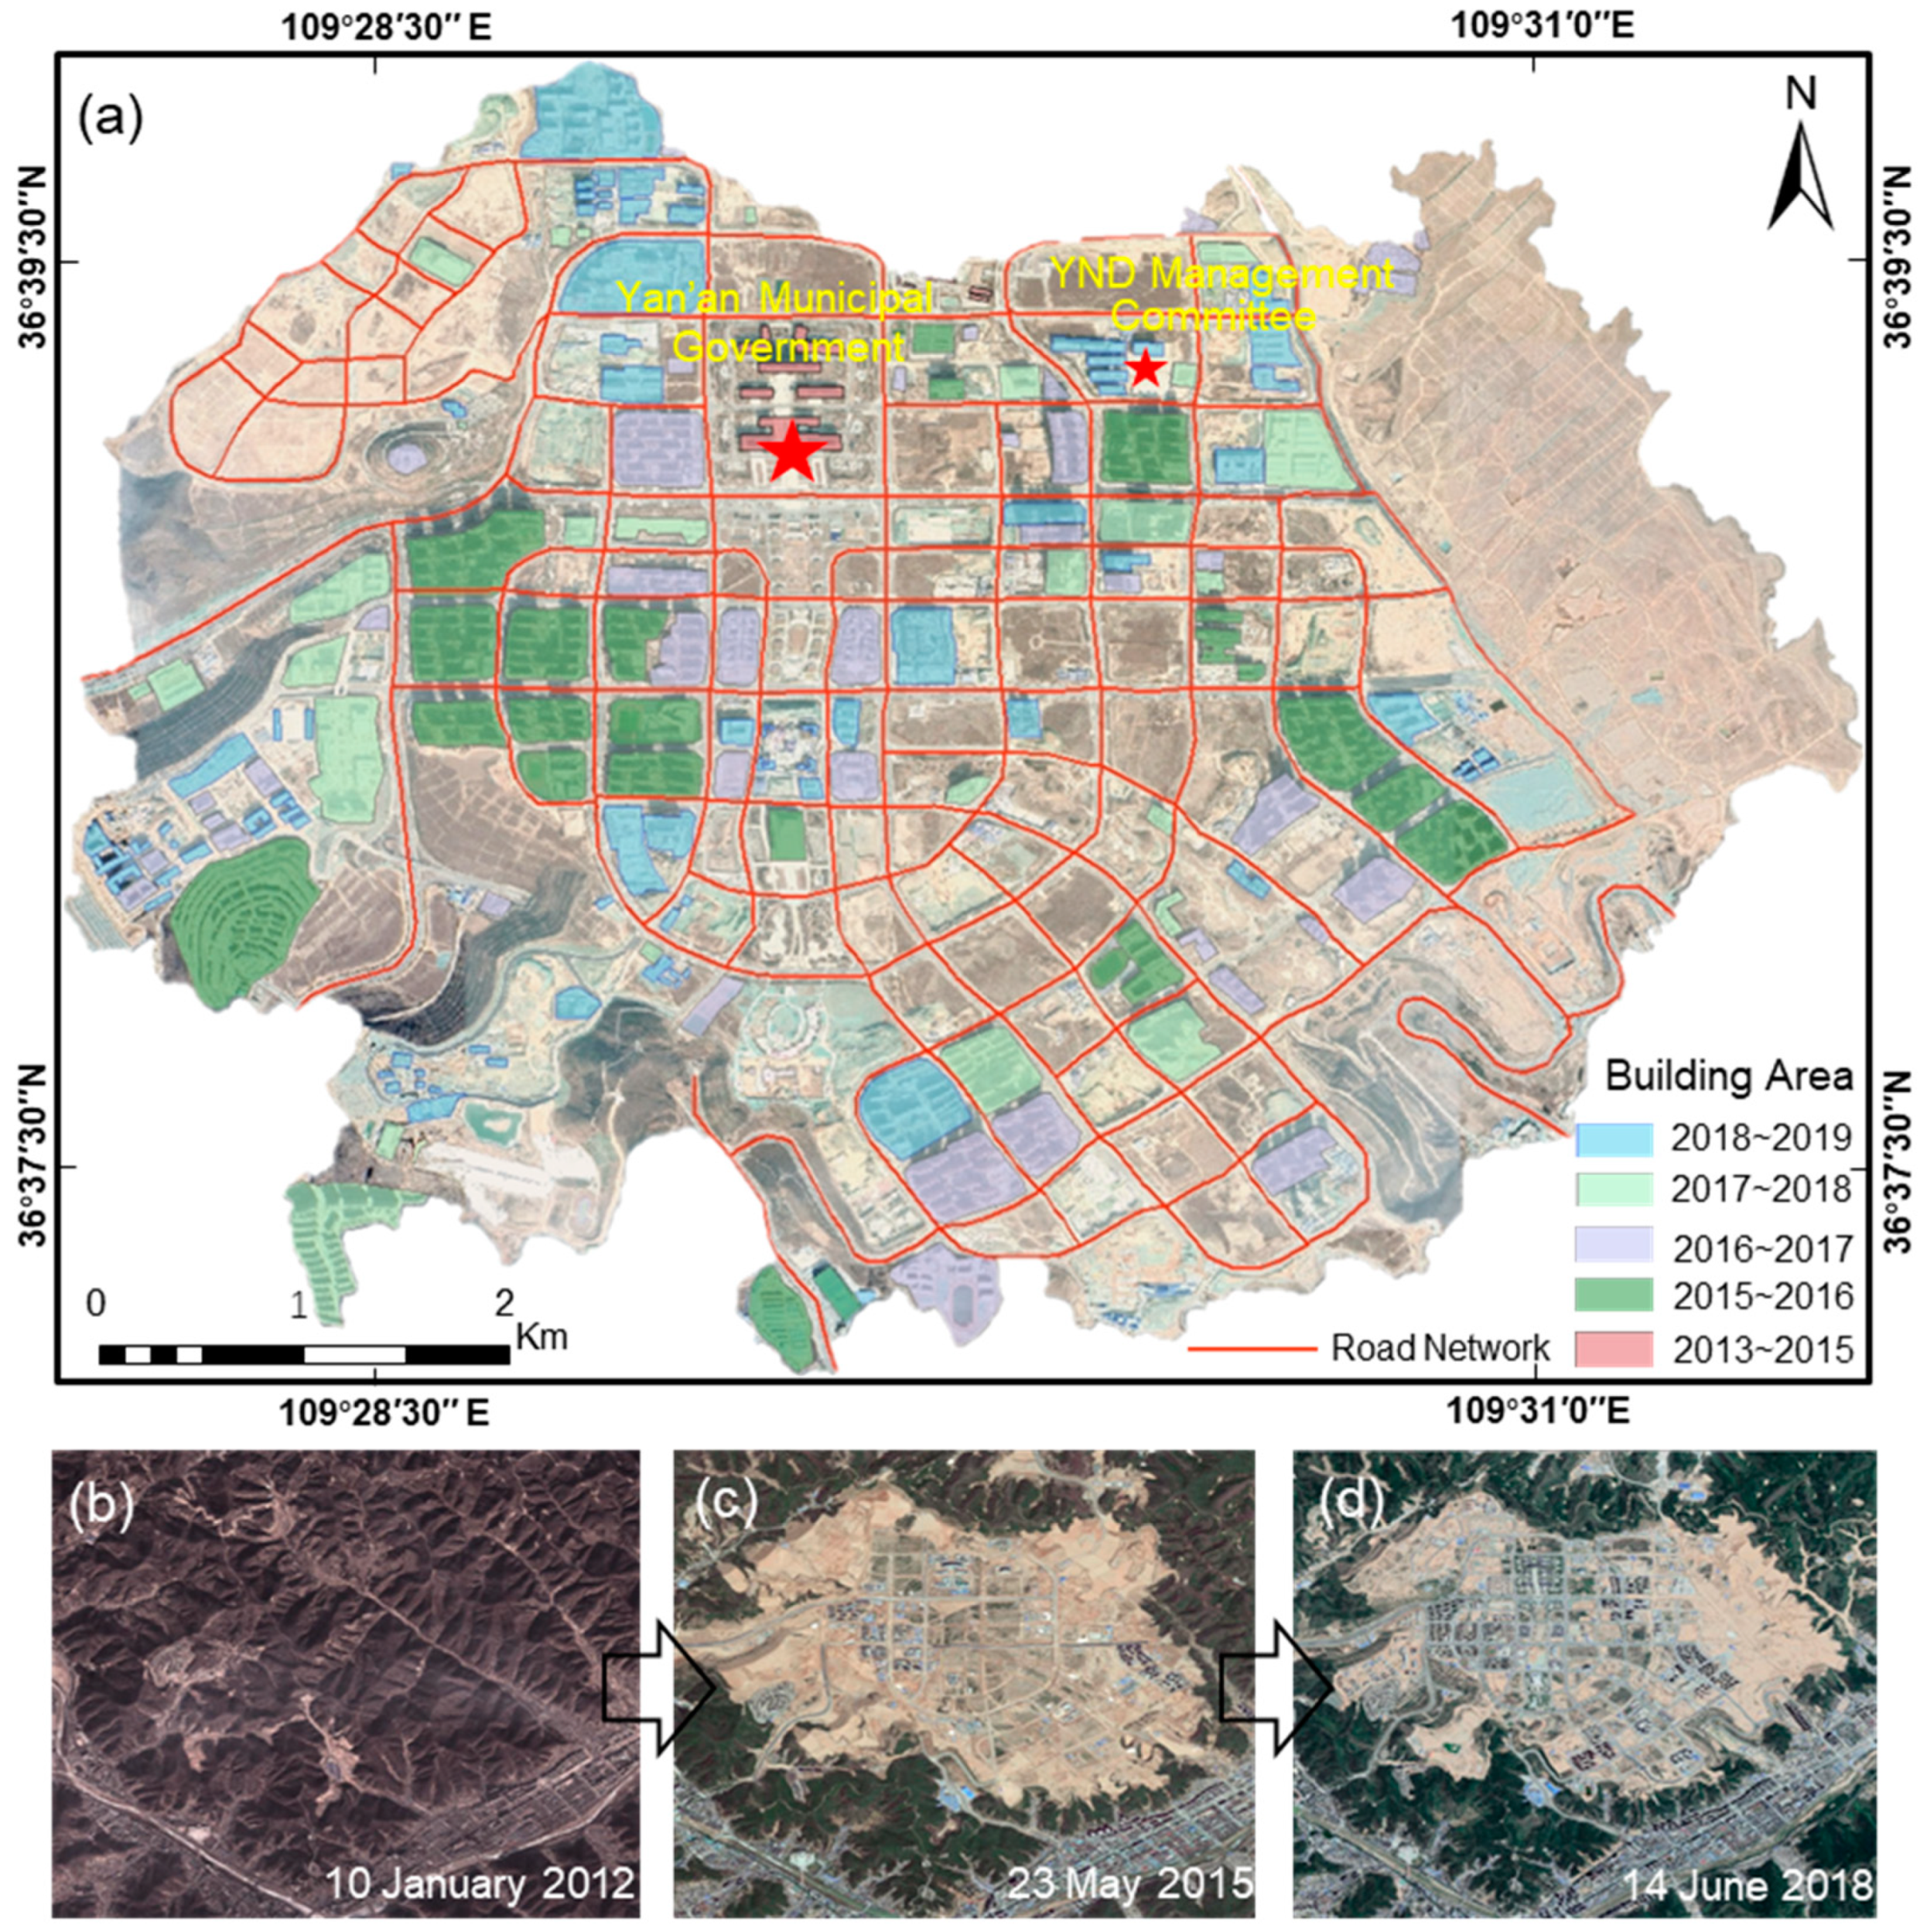
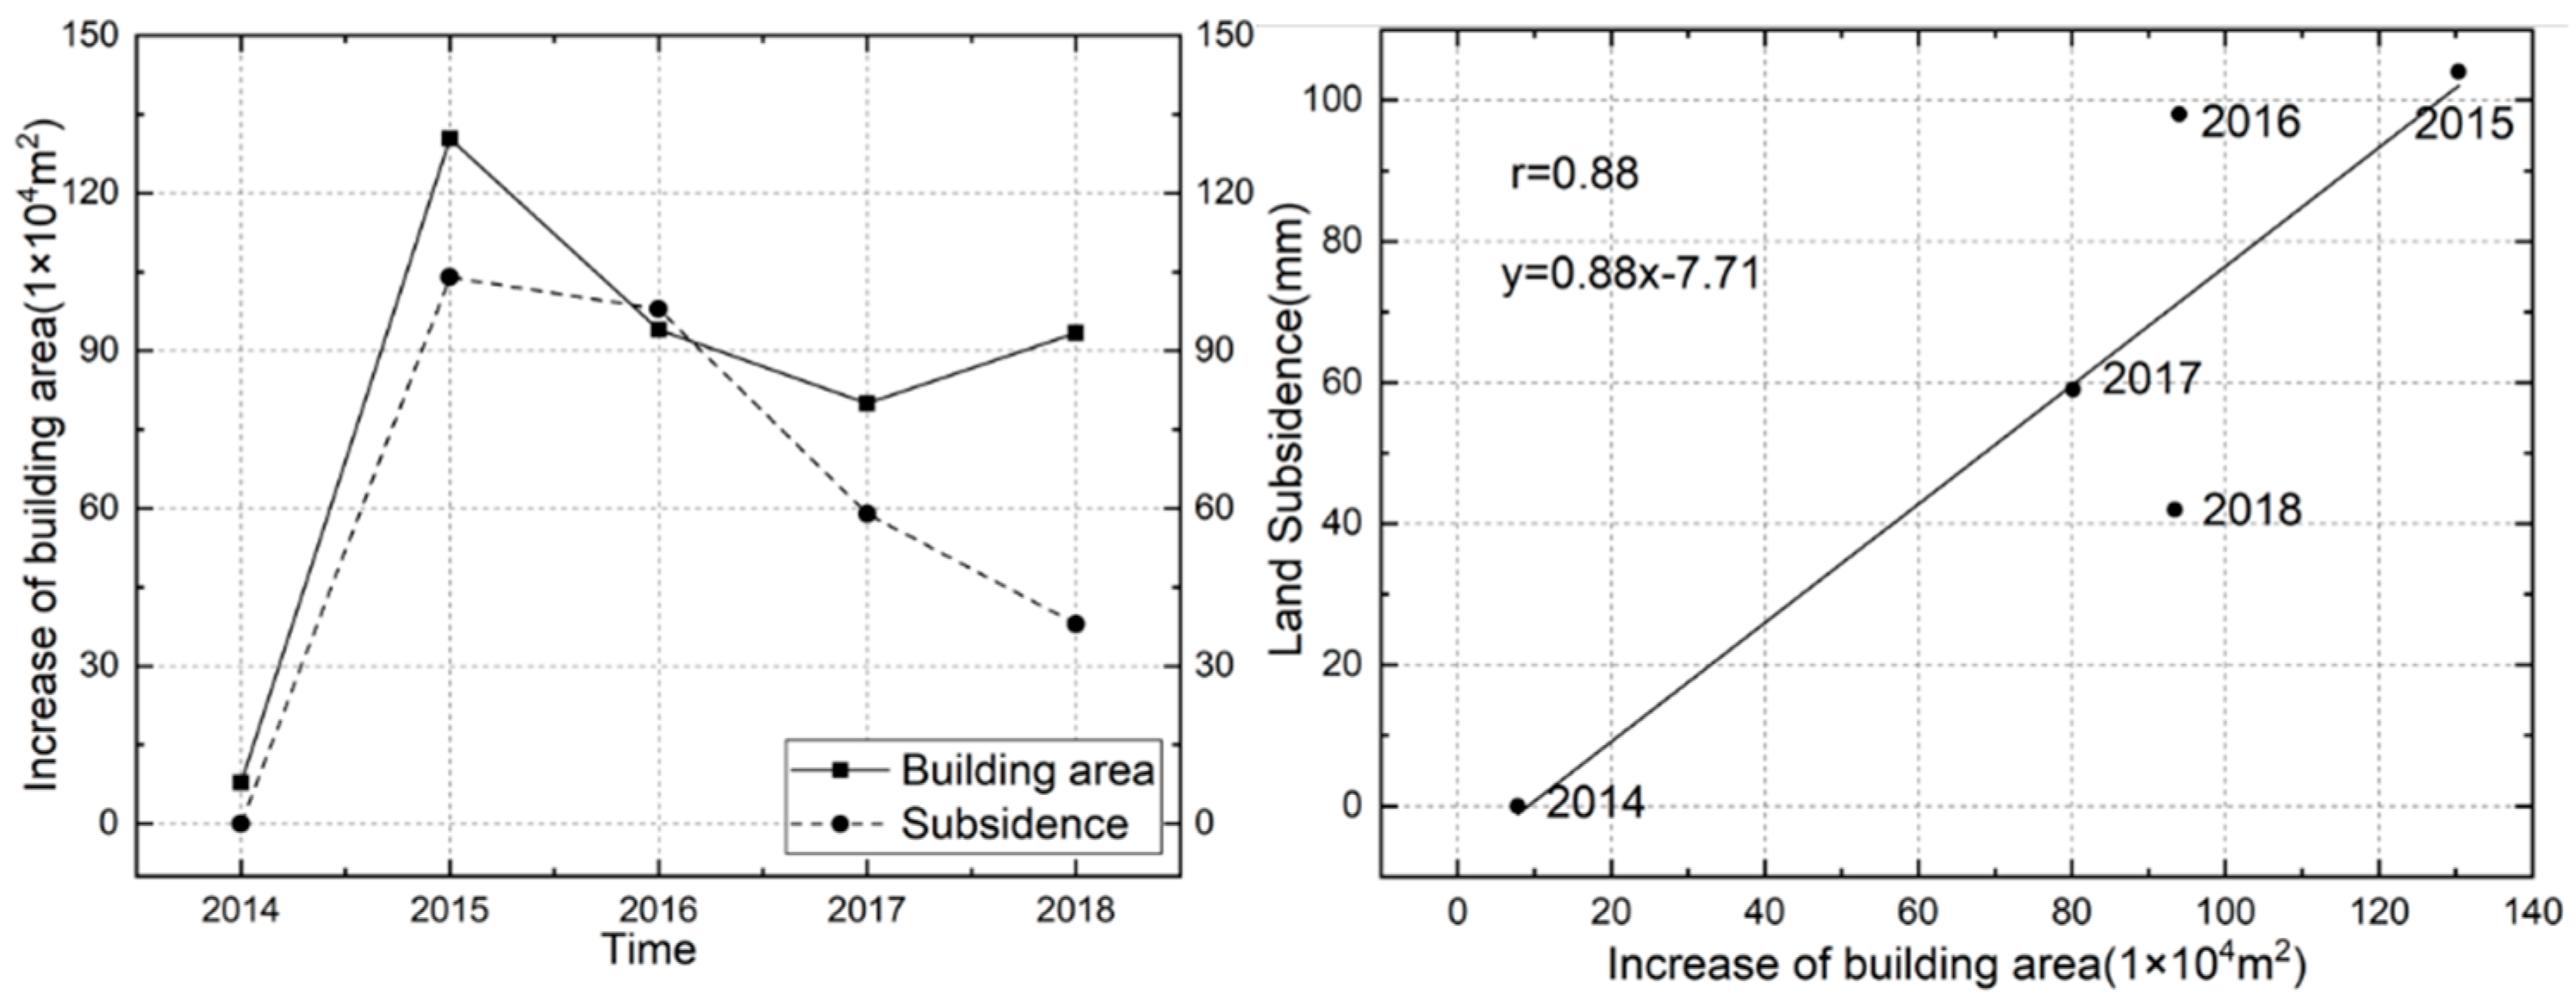
5.1.1. Large-Scale Land Creation

Figure 12 shows the overlap between the surface deformation area and earthwork region. It is indicated that there is a high correlation between the surface deformation and earthwork. More than 60% of the land subsidence occurred in the filling region, and more than 65% of the land uplift occurred in the mountain excavation region. The large-scale land creation project caused by excavating mountains and filling valleys explains this phenomenon appropriately. On the one hand, over 22 km2 of flat land was created to relieve the serious pressure caused by rapid population growth [41]. On the other hand, the large amount of earthwork destroyed the natural state and local geological structure of the original loess, producing many filled loess regions and changed the original landscapes and hydrological conditions. Figure 12d shows that the mountain excavation removed the upper part of the mountain and that the remaining part underneath the mountain released a rebound stress due to the process of mass removal. This phenomenon gradually led to surface uplift in the hilly excavation region until a balanced state was reached. In addition, valley filling changed the natural state of the local original loess. In the gully area, the surface of the original loess layer was covered with infilling loess stratum with maximum thickness up to 112 m [37]. The filling loess has the characteristics of weak structure, a relatively loose arrangement of soil particles and poor capacity for bearing external load, resulting in poor engineering features [53]. While the natural development of a loess layer is a time consuming process, including compression, collapsible deformation, consolidation and compaction (the latest loess layer has experienced a long development period of 5000 years) [45], the filling loess stratum in the YND area only developed for three years (the first phase of earthwork in YND commenced in April 2012 and was completed in June 2015). Thus, the structural change and collapsible subsidence of the surface are not completely stable. In addition, the dynamic compaction method used in the consolidation of the foundation in filling area could only weaken the collapsibility and enhance the intensity of filling loess to a certain extent [54]. It cannot completely change the physical characteristics of the collapsible loess, which led the loess foundation to not be fully tamped and more prone to ground subsidence. Moreover, there are serious stability problems in the unnatural connection of loess in filling and excavation areas, which can cause various geological disasters such as loess landslides, loess collapse and land subsidence [38].

5.1.2. Rapid Urban Construction

In the past five years, Yan’an has experienced a rapid urbanization progress. Figure 13 indicates that large numbers of buildings and roads are built to expand the urban space. Since the commencement of earthwork in April 2012, the construction of major roads, buildings and infrastructure in the new district has been completed, concluding in 2018. An investigation of the changing building area in YND from 2013 to 2019 indicates that there is a high correlation between the subsidence phenomenon and building construction, with a correlation coefficient of 0.88 (Figure 14). Before 2015, few buildings, including Yan’an Municipal Government and Yan’an New District Management Committee were built, and surface deformation was only slightly observed. Between 2015 and 2016, the area experienced a rapid construction period affecting more than 1,300,000 m2 of the building area from the urban center to the surrounding area. At the same time, severe subsidence with maximum accumulation of 100 mm was detected. From 2017 to 2019, the velocity of urban construction slowed down, and the maximum subsidence rate reduced to 50 mm/year. Generally, when loess is dry, compression deformation under an external load includes a large part of loess deformation. On the other hand, when loess is wet, the loess layer is prone to collapsible deformation under self-weight, and the degree of deformation gradually declines over a relatively long period [54]. Furthermore, large amounts of buildings add great external load to the surface and accelerate the deformation process significantly [13]. In the period of rapid urban construction, the land subsidence is also more visible and comprehensive in YND.

5.2. Natural Factors Contributing to the Land Subsidence

A related study has shown that the loess layer can result in a collapsible deformation when encountering external water, which might cause building instability and ground subsidence [54]. From the field research on humidification, consolidation and compression of loess in Yan’an, the strong collapsibility of loess is the basis of local widespread land deformation. The reasons are described as the following:
(1) The filling loess in Yan’an consists mainly of fine soil—while the clay content is about 15%, the silt content is about 76%, and the content of fine sand is about 9%. Moreover, the wet and dry densities are between 1.39 to 1.60 g/cm3 and 1.24 to 1.38 g/cm3, respectively. The low density and content of filing loess has led to a poor structural intensity of soil particles [55].
(2) The loess is loose and porous, and the porosity is as high as 40–50%. In addition to the intergranular pores, a variety of unique micropores, including joints, insect pores, radioactive pores, plant root pores and so on have also developed, leading to a strong water absorption ability in the local loess [54].
(3) The compactness level of the foundation in Yan’an new district is relatively low. It should be indicated that the compactness of the 1–12 m foundation is 64–72%, and the compactness of the 13–33 m foundation is 72–77% [56].
In addition, most precipitation in Yan’an is in the form of heavy rain, which is one of the inducing factors for widespread land deformation in the local area [42]. Rainwater reduces the cohesive intensity and matrix suction of loess clay, causing the loess to soften and an increase in collapsibility. Extreme precipitation (such as a rainstorm) produces a large amount of surface water in a short period of time that exceeds the water storage capacity of the soil. Surface water infiltrating into the loess foundation destroys the internal structure of the loess foundation, which induces the collapse of roadbed and building foundations and leads to the deformation of the surface.

6. Conclusions

In this study, the SBAS-InSAR method combined with Sentinel-1A data was utilized to calculate the urban land subsidence during the rapid construction period of Yan’an city from 2015 to 2019. The spatial distribution features and evolution of surface deformation in YND were analyzed. Moreover, the reasons for surface deformation and its correlation with urban construction were discussed. The conclusions can written as follows:
  • The SBAS-InSAR method and Sentinel-1A data achieved favorable results in the application of urban surface deformation monitoring in the Yan’an area, demonstrating the applicability of multi-temporal InSAR technology in the field of high-precision and large-scale land subsidence monitoring.
  • Uneven surface deformation was observed in YND and YNA areas from 2015 to 2019. The average deformation rate and maximum cumulative subsidence in YND were between −70 and 30 mm/year and 300 mm, respectively. Moreover, the area experienced a rapid subsidence period from 2015 to 2017 and a slow subsidence period from 2017 to 2019, with maximum subsidence rates of 100 and 50 mm/year, respectively. The average rate of surface deformation in YNA is between −50 and 25 mm/year, and the maximum cumulative subsidence is 217 mm. The strong collapsibility of loess and concentrated precipitation in local areas are the main natural factors contributing to surface deformation.
  • There was a high correlation between the deformation distribution and the earthwork. In other words, the land creation project carried out by mountain excavation and filling valleys and rapid urban construction are the primary human factors causing surface deformation.

Author Contributions

Conceptualization, Q.W. and C.J.; Validation, S.C.; Formal analysis, C.J.; Data curation, H.L.; Writing—original draft preparation, Q.W; Writing—review and editing, C.J. and H.L.; Funding acquisition, S.C.

Funding

This research was funded by the Program for JLU Science and Technology Innovative Research Team under Grant JLUSTIRT, 2017TD-26.

Acknowledgments

Sentinel-1A data used in this study were provided by European Space Agency (ESA) through the Sentinel-1 Scientific Data Hub. Google Earth images were used to generate results and describe the location of study area. Global terrain data used in this research were provided by National Aeronautics and Space Administration (NASA). We are very grateful for the above support.

Conflicts of Interest

The authors declare no conflict of interest.

References

  1. Costantini, M.; Ferretti, A.; Minati, F.; Falco, S.; Trillo, F.; Colombo, D.; Novali, F.; Malvarosa, F.; Mammone, C.; Vecchioli, F.; et al. Analysis of surface deformations over the whole Italian territory by interferometric processing of ERS, Envisat and COSMO-SkyMed radar data. Remote Sens. Environ. 2017, 202, 250–275. [Google Scholar] [CrossRef]
  2. Chaussard, E.; Wdowinski, S.; Cabral-Cano, E.; Amelung, F. Land subsidence in central Mexico detected by ALOS InSAR time-series. Remote Sens. Environ. 2014, 140, 94–106. [Google Scholar] [CrossRef]
  3. Gu, C. Urbanization: Positive and negative effects. Sci. Bull. 2019, 64, 281–283. [Google Scholar] [CrossRef]
  4. Konagai, K.; Kiyota, T.; Suyama, S.; Asakura, T.; Shibuya, K.; Eto, C. Maps of soil subsidence for Tokyo bay shore areas liquefied in the March 11th, 2011 off the Pacific Coast of Tohoku Earthquake. Soil Dyn. Earthq. Eng. 2013, 53, 240–253. [Google Scholar] [CrossRef] [Green Version]
  5. Aimaiti, Y.; Yamazaki, F.; Liu, W. Multi-Sensor InSAR Analysis of Progressive Land Subsidence over the Coastal City of Urayasu, Japan. Remote Sens. 2018, 10, 1304. [Google Scholar] [CrossRef]
  6. Kooi, H. Land subsidence due to compaction in the coastal area of The Netherlands: The role of lateral fluid flow and constraints from well-log data. Glob. Planet. Chang. 2000, 27, 207–222. [Google Scholar] [CrossRef]
  7. Yao, G.; Ke, C.-Q.; Zhang, J.; Lu, Y.; Zhao, J.; Lee, H. Surface deformation monitoring of Shanghai based on ENVISAT ASAR and Sentinel-1A data. Environ. Earth Sci. 2019, 78, 225. [Google Scholar] [CrossRef]
  8. Chen, J.; Wu, J.; Zhang, L.; Zou, J.; Liu, G.; Zhang, R.; Yu, B. Deformation Trend Extraction Based on Multi-Temporal InSAR in Shanghai. Remote Sens. 2013, 5, 1774–1786. [Google Scholar] [CrossRef] [Green Version]
  9. Xu, B.; Feng, G.; Li, Z.; Wang, Q.; Wang, C.; Xie, R. Coastal Subsidence Monitoring Associated with Land Reclamation Using the Point Target Based SBAS-InSAR Method: A Case Study of Shenzhen, China. Remote Sens. 2016, 8, 652. [Google Scholar] [CrossRef]
  10. Ng, A.H.-M.; Ge, L.; Li, X.; Zhang, K. Monitoring ground deformation in Beijing, China with persistent scatterer SAR interferometry. J. Geod. 2012, 86, 375–392. [Google Scholar] [CrossRef]
  11. Bergado, D.T.; Nutalaya, P.; Balasubramaniam, A.S.; Apaipong, W.; Chang, C.-C.; Khaw, L.G. Causes, Effects, and Predictions of Land Subsidence in AIT Campus, Chao Phraya Plain, Bangkok, Thailand. Bull. Assoc. Eng. Geol. 1988, 25, 57–81. [Google Scholar] [CrossRef]
  12. Lazecky, M.; Jirankova, E.; Kadlecik, P. Subsidence. In Encyclopedia of Engineering Geology; Bobrowsky, P.T., Marker, B., Eds.; Springer: Cham, Switzerland, 2016; pp. 1–5. ISBN 978-3-31-12127-7. [Google Scholar]
  13. Cui, Z.-D. Physical Model Test of Layered Soil Subsidence Considering Dual Effects of Building Load and Groundwater Withdrawal. In Land Subsidence Induced by the Engineering-Environmental Effect; Cui, Z.-D., Ed.; Springer: Singapore, 2018; pp. 169–191. ISBN 978-981-10-8040-1. [Google Scholar]
  14. Milliman, J.D.; Haq, B.U. Sea-Level Rise and Coastal Subsidence: Towards Meaningful Strategies. In Sea-Level Rise and Coastal Subsidence: Causes, Consequences, and Strategies; Milliman, J.D., Haq, B.U., Eds.; Springer: Dordrecht, The Netherlands, 1996; pp. 1–9. ISBN 978-90-481-4672-7. [Google Scholar]
  15. Zeitoun, D.G.; Wakshal, E. The Subsidence Phenomenon Throughout the World. In Land Subsidence Analysis in Urban Areas: The Bangkok Metropolitan Area Case Study; Zeitoun, D.G., Wakshal, E., Eds.; Springer: Dordrecht, The Netherlands, 2013; pp. 9–23. ISBN 978-94-007-5506-2. [Google Scholar]
  16. Soriano, M.; Simón, J. Subsidence rates and urban damages in alluvial dolines of the Central Ebro basin (NE Spain). Environ. Geol. 2002, 42, 476–484. [Google Scholar] [CrossRef]
  17. Abidin, H.Z.; Andreas, H.; Gamal, M.; Djaja, R.; Subarya, C.; Hirose, K.; Maruyama, Y.; Murdohardono, D.; Rajiyowiryono, H. Monitoring Land Subsidence of Jakarta (Indonesia) Using Leveling, GPS Survey and InSAR Techniques. In A Window on the Future of Geodesy; Springer: Berlin/Heidelberg, Germany, 2005; pp. 561–566. [Google Scholar]
  18. Abidin, H.Z.; Andreas, H.; Gumilar, I.; Yuwono, B.D.; Murdohardono, D.; Supriyadi, S. On Integration of Geodetic Observation Results for Assessment of Land Subsidence Hazard Risk in Urban Areas of Indonesia. In IAG 150 Years; Springer: Cham, Switzerland, 2016; pp. 435–442. [Google Scholar]
  19. Hu, J.; Li, Z.W.; Ding, X.L.; Zhu, J.J.; Zhang, L.; Sun, Q. Resolving three-dimensional surface displacements from InSAR measurements: A review. Earth Sci. Rev. 2014, 133, 1–17. [Google Scholar] [CrossRef]
  20. Massonnet, D.; Rossi, M.; Carmona, C.; Adragna, F.; Peltzer, G.; Feigl, K.; Rabaute, T. The displacement field of the Landers earthquake mapped by radar interferometry. Nature 1993, 364, 138–142. [Google Scholar] [CrossRef]
  21. Milillo, P.; Minchew, B.; Simons, M.; Agram, P.; Riel, B. Geodetic Imaging of Time-Dependent Three-Component Surface Deformation: Application to Tidal-Timescale Ice Flow of Rutford Ice Stream, West Antarctica. IEEE Trans. Geosci. Remote Sens. 2017, 55, 5515–5524. [Google Scholar] [CrossRef]
  22. Milillo, P.; Giardina, G.; DeJong, J.M.; Perissin, D.; Milillo, G. Multi-Temporal InSAR Structural Damage Assessment: The London Crossrail Case Study. Remote Sens. 2018, 10, 287. [Google Scholar] [CrossRef]
  23. Ferretti, A.; Prati, C.; Rocca, F. Nonlinear subsidence rate estimation using permanent scatterers in differential SAR interferometry. IEEE Trans. Geosci. Remote Sens. 2000, 38, 2202–2212. [Google Scholar] [CrossRef] [Green Version]
  24. Ferretti, A.; Prati, C.; Rocca, F. Permanent scatterers in SAR interferometry. IEEE Trans. Geosci. Remote Sens. 2001, 39, 8–20. [Google Scholar] [CrossRef]
  25. Berardino, P.; Fornaro, G.; Lanari, R.; Sansosti, E. A new algorithm for surface deformation monitoring based on small baseline differential SAR interferograms. IEEE Trans. Geosci. Remote Sens. 2002, 40, 2375–2383. [Google Scholar] [CrossRef] [Green Version]
  26. Zhang, Y.; Liu, Y.; Jin, M.; Jing, Y.; Liu, Y.; Liu, Y.; Sun, W.; Wei, J.; Chen, Y. Monitoring Land Subsidence in Wuhan City (China) using the SBAS-InSAR Method with Radarsat-2 Imagery Data. Sensors 2019, 19, 743. [Google Scholar] [CrossRef]
  27. Zhou, L.; Guo, J.; Hu, J.; Li, J.; Xu, Y.; Pan, Y.; Shi, M. Wuhan Surface Subsidence Analysis in 2015–2016 Based on Sentinel-1A Data by SBAS-InSAR. Remote Sens. 2017, 9, 982. [Google Scholar] [CrossRef]
  28. Chaussard, E.; Amelung, F.; Abidin, H.; Hong, S.-H. Sinking cities in Indonesia: ALOS PALSAR detects rapid subsidence due to groundwater and gas extraction. Remote Sens. Environ. 2013, 128, 150–161. [Google Scholar] [CrossRef]
  29. Zhu, J.; Li, Z.; Hu, J. Research Progress and Methods of InSAR for Deformation Monitoring. Acta Geod. Cartogr. Sin. 2017, 46, 1717–1733. [Google Scholar] [CrossRef]
  30. Tizzani, P.; Berardino, P.; Casu, F.; Euillades, P.; Manzo, M.; Ricciardi, G.P.; Zeni, G.; Lanari, R. Surface deformation of Long Valley caldera and Mono Basin, California, investigated with the SBAS-InSAR approach. Remote Sens. Environ. 2007, 108, 277–289. [Google Scholar] [CrossRef]
  31. Casu, F.; Manzo, M.; Lanari, R. A quantitative assessment of the SBAS algorithm performance for surface deformation retrieval from DInSAR data. Remote Sens. Environ. 2006, 102, 195–210. [Google Scholar] [CrossRef]
  32. Xue, Y.-Q.; Zhang, Y.; Ye, S.-J.; Wu, J.-C.; Li, Q.-F. Land subsidence in China. Environ. Geol. 2005, 48, 713–720. [Google Scholar] [CrossRef]
  33. Zhang, B.; Wang, R.; Deng, Y.; Ma, P.; Lin, H.; Wang, J. Mapping the Yellow River Delta land subsidence with multitemporal SAR interferometry by exploiting both persistent and distributed scatterers. ISPRS J. Photogramm. Remote Sens. 2019, 148, 157–173. [Google Scholar] [CrossRef]
  34. Holzer, T.L.; Johnson, A.I. Land subsidence caused by ground water withdrawal in urban areas. GeoJournal 1985, 11, 245–255. [Google Scholar] [CrossRef]
  35. Wang, S.; Fu, B.; Chen, H.; Liu, Y. Regional development boundary of China’s Loess Plateau: Water limit and land shortage. Land Use Policy 2018, 74, 130–136. [Google Scholar] [CrossRef]
  36. Liu, Y.; Li, Y. Environment: China’s land creation project stands firm. Nature 2014, 511, 410. [Google Scholar] [CrossRef]
  37. Li, P.; Qian, H.; Wu, J. Environment: Accelerate research on land creation. Nature 2014, 510, 29–31. [Google Scholar] [CrossRef] [PubMed]
  38. Juang, C.H.; Dijkstra, T.; Wasowski, J.; Meng, X. Loess geohazards research in China: Advances and challenges for mega engineering projects. Eng. Geol. 2019, 251, 1–10. [Google Scholar] [CrossRef]
  39. Chen, G.; Zhang, Y.; Zeng, R.; Yang, Z.; Chen, X.; Zhao, F.; Meng, X. Detection of Land Subsidence Associated with Land Creation and Rapid Urbanization in the Chinese Loess Plateau Using Time Series InSAR: A Case Study of Lanzhou New District. Remote Sens. 2018, 10, 270. [Google Scholar] [CrossRef]
  40. China Today. Available online: http://www.chinatoday.com/city/yanan.htm (accessed on 5 June 2019).
  41. Li, X.-A.; Li, L.; Song, Y.; Hong, B.; Wang, L.; Sun, J. Characterization of the mechanisms underlying loess collapsibility for land-creation project in Shaanxi Province, China—A study from a micro perspective. Eng. Geol. 2019, 249, 77–88. [Google Scholar] [CrossRef]
  42. Zhang, Y. Study on the Formation Mechanism of Loess Collapse Induced by Rainfall in Yan’an Area. Master’s Thesis, Xi’an University of Science and Technology, Xi’an, China, 2016. [Google Scholar]
  43. Zhou, J.; Fu, B.; Gao, G.; Lü, Y.; Liu, Y.; Lü, N.; Wang, S. Effects of precipitation and restoration vegetation on soil erosion in a semi-arid environment in the Loess Plateau, China. Catena 2016, 137, 1–11. [Google Scholar] [CrossRef]
  44. Wang, G.; Li, T.; Xing, X.; Zou, Y. Research on loess flow-slides induced by rainfall in July 2013 in Yan’an, NW China. Environ. Earth Sci. 2015, 73, 7933–7944. [Google Scholar] [CrossRef]
  45. Guorui, G. Formation and development of the structure of collapsing loess in China. Eng. Geol. 1988, 25, 235–245. [Google Scholar] [CrossRef]
  46. The Government Website of Shaanxi Province. Available online: http://www.shaanxi.gov.cn/sxxw/sxyw/125967.htm (accessed on 9 November 2018).
  47. Mora, O.; Mallorqui, J.J.; Broquetas, A. Linear and nonlinear terrain deformation maps from a reduced set of interferometric SAR images. IEEE Trans. Geosci. Remote Sens. 2003, 41, 2243–2253. [Google Scholar] [CrossRef]
  48. Sansosti, E.; Berardino, P.; Manunta, M.; Serafino, F.; Fornaro, G. Geometrical SAR image registration. IEEE Trans. Geosci. Remote Sens. 2006, 44, 2861–2870. [Google Scholar] [CrossRef]
  49. Goldstein, R.M.; Werner, C.L. Radar interferogram filtering for geophysical applications. Geophys. Res. Lett. 1998, 25, 4035–4038. [Google Scholar] [CrossRef] [Green Version]
  50. Costantini, M. A novel phase unwrapping method based on network programming. IEEE Trans. Geosci. Remote Sens. 1998, 36, 813–821. [Google Scholar] [CrossRef]
  51. Pepe, A.; Berardino, P.; Bonano, M.; Euillades, L.D.; Lanari, R.; Sansosti, E. SBAS-Based Satellite Orbit Correction for the Generation of DInSAR Time-Series: Application to RADARSAT-1 Data. IEEE Trans. Geosci. Remote Sens. 2011, 49, 5150–5165. [Google Scholar] [CrossRef]
  52. Yastika, P.E.; Shimizu, N.; Abidin, H.Z. Monitoring of long-term land subsidence from 2003 to 2017 in coastal area of Semarang, Indonesia by SBAS DInSAR analyses using Envisat-ASAR, ALOS-PALSAR, and Sentinel-1A SAR data. Adv. Space Res. 2019, 63, 1719–1736. [Google Scholar] [CrossRef]
  53. Jiang, M.; Zhang, F.; Hu, H.; Cui, Y.; Peng, J. Structural characterization of natural loess and remolded loess under triaxial tests. Eng. Geol. 2014, 181, 249–260. [Google Scholar] [CrossRef]
  54. Li, P.; Vanapalli, S.; Li, T. Review of collapse triggering mechanism of collapsible soils due to wetting. J. Rock Mech. Geotech. Eng. 2016, 8, 256–274. [Google Scholar] [CrossRef]
  55. Wang, F. Experimental Study on Deformation Characteristics of Structural Loess under High Stress in Yan’an Area. Master’s Thesis, Xi’an University of Science and Technology, Xi’an, China, 2018. [Google Scholar]
  56. Gao, D. Research on Characteristics of Deformation and Strength as well as Moisture Retention of Loess in Yan’an New Area. Master’s Thesis, Lanzhou University of Technology, Lanzhou, China, 2016. [Google Scholar]
Figure 1. The Yan’an urban area and the basic information of the research area, superimposed on the Google Earth image obtained 25 March 2019.
Remotesensing 11 01673 g001
Figure 2. Distribution of valley filling and mountain excavation in Yan’an new district (YND) superimposed on the Google Earth image. The blue and yellow regions represent filling and excavating areas, respectively.
Remotesensing 11 01673 g002
Figure 3. (a) Time-position of Sentinel-1A acquisitions and (b) time-baseline of Sentinel-1A interferometric pairs. Each green diamond denotes a slave image, each yellow diamond represents a super master image and each line represents a connection.
Remotesensing 11 01673 g003
Figure 4. The average velocity of surface deformation in the Yan’an urban area. (a) The urban area of Yan’an superimposed on the Google Earth image. The detailed surface deformation of YND superimposed on (b) the Google Earth image and (c) SRTM data.
Remotesensing 11 01673 g004
Figure 5. (a) The subsidence zone in YND superimposed on the Google Earth image; (b,c) represent the evolution of land subsidence of regions A and B, respectively.
Remotesensing 11 01673 g005
Figure 6. The correlation between elevation variation along the filling region and cumulative subsidence. The elevation is obtained along the red line in the left figure at the direction of southeast towards northwest with an interval of 40 m. The cumulative subsidence is calculated within the region by average. The x-axis of right figure represents the collection interval of the elevation.
Remotesensing 11 01673 g006
Figure 7. (a) The uplifting area in YND superimposed on the Google Earth image; (b,c) represent the evolution of land uplift of region C and D, respectively.
Remotesensing 11 01673 g007
Figure 8. (ah) Evolution of land deformation in YND from February 2015 to January 2019. Red and blue polygons represent uplift and subsidence areas, respectively. Moreover, the color scale represents the cumulative deformation relative to February 2015.
Remotesensing 11 01673 g008
Figure 9. (a) Average rate of surface deformation in Yan’an new airport (YNA) superimposed on the Google Earth image, (b) the earthwork scene in YNA, and (c) the maximum and average accumulated subsidence of the largest red circle in (a).
Remotesensing 11 01673 g009
Figure 10. Distribution of leveling points in Yan’an new airport.
Remotesensing 11 01673 g010
Figure 11. Comparison of SBAS and leveling results at leveling points in YNA from August 2015 to June 2016.
Remotesensing 11 01673 g011
Figure 12. Earthwork region and surface deformation area are superimposed on the Google Earth image. (a) Superimposed map of the subsidence area and filling region, (b) superimposed map of the uplift area and excavation region, (c) location of surface deformation area on DEM, and (d) force diagram from when the mountain was excavated.
Remotesensing 11 01673 g012
Figure 13. (a) The change of the buildings area and road network from 2013 to 2019. (bd) Change of landscape in YND based on Google Earth images.
Remotesensing 11 01673 g013
Figure 14. The relationship of the annual increase of building area and land subsidence from 2013 to 2018.
Remotesensing 11 01673 g014
Table 1. The specific information of Sentinel-1A images and SRTM data. SLC represents single look complex image, IW represents interferometric wide swath, VV represents vertical polarization.
DataParametersDescription
Sentinel-1ATypeSLC
Imaging modeIW
Band and wavelength (cm)C, 5.5
Track number84
Orbit directionAscending
Azimuth resolution (m)20
Range resolution (m)5
PolarizationVV
SRTMResolution (m)30
Positioning accuracy (m)20
Elevation accuracy (m)16

