Article

Retrieval of Internal Solitary Wave Amplitude in Shallow Water by Tandem Spaceborne SAR

1
Key Laboratory of Digital Earth Science, Institute of Remote Sensing and Digital Earth, Chinese Academy of Sciences, Beijing 100094, China
2
University of Chinese Academy of Sciences, Beijing 100049, China
3
Laboratory for Regional Oceanography and Numerical Modeling, Qingdao National Laboratory for Marine Science and Technology, Qingdao 266235, China
4
Hainan Key Laboratory of Earth Observation, Sanya 572029, China
5
P.O. Box 5136, Haidian District, Beijing 100094, China
*
Author to whom correspondence should be addressed.
Remote Sens. 2019, 11(14), 1706; https://doi.org/10.3390/rs11141706
Submission received: 4 July 2019 / Revised: 12 July 2019 / Accepted: 13 July 2019 / Published: 18 July 2019
(This article belongs to the Special Issue Synthetic Aperture Radar Observations of Marine Coastal Environments)

Abstract

:
The accurate estimation of the upper layer thickness in a two-layer ocean is a crucial step in the retrieval of internal solitary wave (ISW) amplitude from synthetic aperture radar (SAR) data. In this paper, we present a method to derive the upper layer thickness and the consequent ISW amplitude by combining two consecutive SAR images with the extended Korteweg-de Vries (eKdV) equation. An ISW case observed twice by the Chinese C-band SAR GaoFen-3 (GF-3) and the German X-band SAR TerraSAR-X (TS-X) with a temporal interval of approximately 11 min in shallow water to the southeast of Hainan Island in the northwestern South China Sea was used to demonstrate the applicability of the method. Using the in situ measurements of temperature and salinity near the observed ISW, the proposed method yielded an ISW amplitude of −4.52 m, in close proximity to −5.66 ± 1.24 m derived by applying the classic Korteweg–de Vries (KdV) equation based on the continuously stratified theory. Moreover, the climatological dataset of the World Ocean Atlas 2013 (WOA13) was also used with the proposed method in the Hainan case, and the results showed that the method can still provide a reasonable estimate of ISW amplitude in shallow water even when in situ oceanic stratification measurements are absent. The application of our method to derive the ISW amplitude from consecutive SAR images seems highly promising with the increasing emergence of tandem satellites in orbits.

Graphical Abstract

1. Introduction

Internal solitary waves (ISWs) are a class of high-frequency, non-linear, and non-hydrostatic gravity waves that are widely observed in the coastal oceans and marginal seas [1,2,3,4]. Internal solitary waves can enhance ocean mixing and are an important link in energy dissipation from the barotropic tide [5,6]. Additionally, ISWs can have a profound effect on offshore drilling operations [7], nutrients, pollutants, and sediments transport [8], acoustic propagation [9], and nearshore ecosystems [10]. For these reasons, the generation, propagation, steepening, and dissipation of ISWs have received much research attention for several decades.
Spaceborne synthetic aperture radar (SAR) is a powerful remote sensing instrument for observing ISWs [11]. Internal solitary waves can induce variations in surface currents and locally modulate the distribution and intensity of Bragg waves, which renders the ISWs visible on SAR images as alternating bright and dark stripes [12]. Spaceborne SAR data have been widely applied to determine the properties of ISWs, such as the characteristic half width, crest length, number of waves, propagation direction, wave speed, and wave amplitude [13,14,15,16].
The ISW amplitude refers to the maximum displacement of isopycnals departing from their equilibrium positions [17]. Knowing the variation in ISW amplitudes is important for understanding ISW evolution and dissipation processes. Field measurements, such as temperature chains, can accurately derive ISW amplitudes. However, the ISW amplitudes change significantly during progression due to the variations in stratification and bathymetry. Field measurements cannot well capture such variabilities. Therefore, we expect to derive ISW amplitudes from spaceborne remote sensing data, e.g., SAR data, because SAR has a large swath imaging capability that is independent of daylight, cloud coverage, and weather conditions.
To date, several types of methods have been proposed to extract ISW amplitudes from SAR intensity images and most of these methods use an internal wave evolution equation with a continuously stratified fluid model [17,18,19] or a two-layer fluid model [20,21,22]. Although the amplitude estimation from SAR images by adopting a continuously stratified fluid model has the potential to be more accurate than the estimations with a two-layer ocean model, this method has the crucial need for simultaneous or nearly simultaneous SAR and field observations, and thus, the method is difficult to use in practical applications. Therefore, the simplified two-layer model, which assumes that the ocean has an upper layer thickness of h 1 and a lower layer thickness of h 2 , is more often used as an approximation to estimate wave properties when studying long first mode internal waves. The amplitude estimation based on a two-layer model from SAR intensity data [20,21,22] generally follows a few steps: (1) an appropriate equation is selected to describe the wave evolution; (2) the ISW solution to the wave evolution equation is used to establish the relationship between the ISW amplitude and the observed ISW signal by SAR; (3) the ISW signal information is extracted from the SAR data; (4) the upper layer thickness, total water depth, and density difference Δ ρ between the two layers are determined; (5) the environmental parameters are calculated by h 1 , h 2 , and Δ ρ ; and (6) the ISW amplitude is determined based on the relationship established in the second step. Thus, given that the background stratification information and total water depth are known, the appropriate internal wave evolution equation, SAR-derived ISW information, and upper layer thickness are crucial for the amplitude estimation.
In an internal wave study, there are three types of weakly non-linear models that simulate the propagation characteristics of internal waves under various circumstances: the Korteweg-de Vries (KdV) equation in shallow water [23,24], the Joseph–Kubota equation in finite-depth water [25,26], and the Benjamin–Ono equation in deep water [27,28]. One key factor that justifies an appropriate model is the ratio of the horizontal scale of internal waves to the water depth. As we will show later, the wavelength in our case is greater than the local water depth. Therefore, we consider the observed ISWs in this paper to be shallow water non-linear internal waves. For the amplitude estimation of ISWs in a two-layer shallow water system, Xue et al. [21] suggested that the extended Korteweg-de Vries (eKdV) equation, which includes a higher-order non-linear term, can obtain more reasonable amplitude results from SAR images than the classic KdV equation.
The distance among the two adjacent peaks of internal wave patterns on SAR images (peak–peak distance) or the characteristic half width of internal waves is usually used to establish relationships with the internal wave amplitude. While the peak–peak distance can be determined by measuring the locations of positive peaks and negative peaks on the curve of the internal wave backscattering intensity profile, the characteristic half width is usually derived from SAR images by a few methods, e.g., the curve fitting method [20], wavelet transform method [29], empirical mode decomposition (EMD) method [30], and Cramér–Rao Bound method [31]. Among these methods, the curve fitting and Cramér–Rao Bound methods are more applicable for the information extraction of a single ISW (internal soliton) and may show little difference for the ISW with small amplitude of the SAR backscattering intensity [31].
The accurate estimation of upper layer thickness is crucial in determining the ISW amplitude using a two-layer water fluid model because the retrieved amplitude is sensitive to the upper layer thickness [21,22]. Although a variety of methods have been proposed to estimate the upper layer thickness, such as the maximum buoyancy frequency ( N m a x ) method, eigenfunction method, empirical orthogonal function (EOF) method, KdV method, Benjamin-Ono (BO) method, KdV-I method, and the KdV-II method; the estimations using these methods may have large discrepancies [32] and these methods based on in situ measurements are costly and can provide only point estimations. Therefore, some studies have attempted to infer upper layer thickness from SAR images as they can provide a wide view of ISW evolution with high spatial resolutions around tens of meters. For example, Zhao et al. [33] proposed that the upper layer thickness can be calculated by determining the polarity conversion point of the observed ISWs in SAR images, where the depression ISWs are converted into elevation ISWs and the upper layer thickness is exactly half that of the local water depth. However, this method is limited to the conversion point estimation. Li et al. [34] and Yang et al. [35] also derived the upper layer thickness from SAR images under the assumption that the ISW phase speed is close to the group velocity of ISW packets. Thus, the derived phase speed is an average speed within the whole tide period instead of the “true” phase speed of ISWs in a certain location, which may lead to large uncertainties in ISW amplitude estimations. In such cases, the consecutive remote sensing image pairs within a short time (tandem images) have potential applications in estimating the accurate upper layer thickness and subsequent amplitudes because ISWs can be observed multiple times in the tandem images, and therefore, we can derive a more accurate phase speed [36].
Therefore, one can find that although the two-layer model is more practical in retrieving ISW amplitude from SAR images than the continuously stratified model does, the facing challenge is the accurate estimation of upper layer thickness. In this study, we proposed a method of deriving the optimum upper layer thickness based on the accurate estimation of ISW phase speed using a tandem SAR image pair acquired within a short temporal interval. Consequently, the amplitude of the ISW is derived. An ISW case repeatedly observed by the Chinese C-and SAR GaoFen-3 (GF-3) and the German X-band SAR TerraSAR-X (TS-X) with a short temporal interval in shallow water on southeastern Hainan Island is used to demonstrate the method.

2. Materials and Methods

2.1. Brief Description of the Experiment

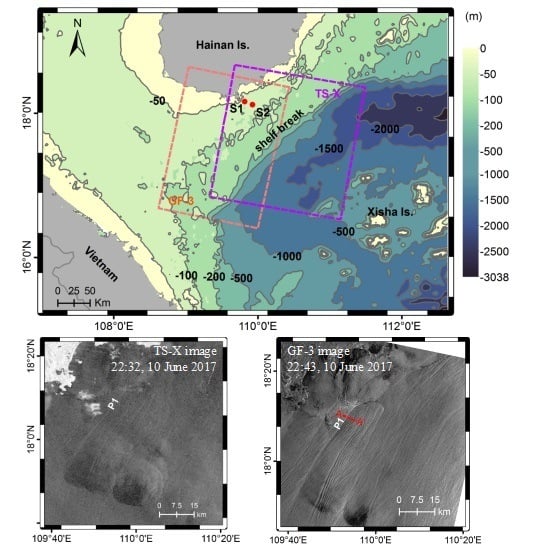
An ISW observational experiment was conducted on the southeast of Hainan Island in the northwestern South China Sea from 10 to 12 June 2017. During the experiment, a GF-3 and a TS-X image with a short temporal interval of approximately 11 min were acquired, whose spatial coverage are illuminated in Figure 1. The two SAR data across the shelf break cover most sea regions between the southeast of Hainan Island and the Xisha Island, and they both clearly present signals of ISWs which are observed to the west of the shelf break where the water depth is less than −200 m. More details about the SAR data are given in the next subsection. Two conductivity–temperature–pressure (CTD) casts of S1 (109.8190°E, 18.1596°N) and S2 (109.9268°E, 18.1167°N) located near the observed ISWs were performed during the experiment and their locations are indicated by red dots in Figure 1. The two casts were used to collect the background stratification (density) profiles of the study area, which are shown later in the paper.

2.2. Processing of the Spaceborne SAR Data and Extraction of ISW Characteristics

Table 1 lists the technical specifications of the TS-X and GF-3 images acquired in the experiment. The TS-X SAR image was acquired in the scanSAR mode with a single-polarization of vertical–vertical (VV). The GF-3 image was acquired in the standard stripmap mode with a dual-polarization of VV and vertical–horizontal (VH). Portions of the GF-3 (VV polarization) and TS-X image in the same geographical area are shown in Figure 2a,b, respectively. The manifestations of ISWs patterns are clearer in the GF-3 image than that in the TS-X image, as the former had better spatial resolution of 8 m. On the other hand, the incidence angle of the GF-3 sub-image was approximately 15.23–21.70 degrees, while that of the TS-X sub-image was 42.50–48.72 degrees.
Both images were processed by radiometric calibration, speckle filtering, and geolocation correction. In the two images, one can clearly observe three ISW packets distributed southeast of Hainan Island. The spatial-temporally collocated ERA5 reanalysis wind model suggests that the sea surface wind speed was no more than 5 m/s at the acquisition time of the SAR data, which favors a higher probability for observing these ISWs on SAR images during summer [17]. These observed ISWs in Figure 2 are interpreted as mode-1 depression ISWs because their SAR signatures appear as bright-dark stripes. The convex curvatures imply that these ISWs were propagating northwestwards onto the Hainan shelf. The most prominent packet in these observed ISWs is labeled P 1 in Figure 2a. A transect (AA’, the red dashed line in Figure 2a) parallel to the wave propagation direction was selected to analyze the variation in the normalized radar cross-section (NRCS) of the ISWs. To suppress the noise, the NRCS along AA’ was averaged in the direction perpendicular to the wave propagation direction, and then, the averaged NRCS was smoothed by a moving average filter and plotted in Figure 3. The horizontal distribution curve of pixel backscattering intensity values (averaged and smoothed NRCS) clearly reveals the leading three distinct solitons of packet P 1 . In this paper, we chose the first leading soliton, which is named L 1 , to derive the amplitude. From Figure 3, we obtain the wavelength of soliton L 1 as approximately 440 m, which is defined as the distance between the crest of L 1 and its following soliton. The local nautical chart shows that the water depth near L 1 was approximately −74 m. Therefore, the wavelength of L 1 in this case was greater than the water depth, which suggests that the ISW satisfies the shallow water internal wave criteria.

2.3. CTD Data and WOA13 V2 Data

The mean water density profiles shown in Figure 4a were sampled by the CTD casts of S1 and S2 on 12 June 2017. The soliton L 1 was located approximately 6 km from the both CTD casts and was observed on SAR images about two days before the CTD casts. Thus, the in situ water density profile in Figure 4a is treated as a mean stratification profile of the ocean background for the time in which the ISW case took place in the study. Figure 4b presents the corresponding background buoyancy frequency profile. A pycnocline is the cline or layer where the vertical water density changes dramatically. Thus, as shown in Figure 4, the study area features a strong and thick seasonal pycnocline located approximately between −9 m and −33 m. The thickness of the seasonal pycnocline accounts for approximately 32% of the total water depth, making the determination of the upper layer thickness in a two-layer model rather ambiguous and difficult.
The stratification profile is needed to be determined as an input to the proposed ISW amplitude estimation method. The conventional approach to underline the density stratification is to use in situ or climatological data. So apart from the in situ CTD data, we also used the background stratification profile from the monthly objectively analyzed mean climatological dataset of WOA13 V2 as an input to the proposed method, in order to examine the practicability of the proposed method in cases where in situ CTD measurements were not available. The WOA13 V2 dataset has a horizontal grid resolution of 0.25° and a 5 m depth vertical interval for water depths of less than 100 m. In this dataset, the point of (109.875°E, 18.125°N) is the nearest grid point to the location of soliton L 1 . Therefore, the temperature and salinity information from WOA13 V2 at this point in June was chosen to analyze the background stratification. The temperature and salinity profiles were interpolated to 1 m depth intervals and then substituted into the Thermodynamic Equation of Sea Water 2010 (TEOS-10) to calculate the density profile and its corresponding background buoyancy frequency profile, which are shown in Figure 5a,b, respectively. The profiles in Figure 5b are similar to the in situ measurements shown in Figure 4b, and it also shows a strong and thick seasonal pycnocline, which is located approximately between −12 m and −47 m. The buoyancy frequency value from the WOA13 V2 dataset shown in Figure 5b is about 0.15 s−1 smaller than that of our in situ measurements. The difference between WOA13 V2 climatological data and in situ measurements may be due to the impacts of weekly synoptic weather events and seasonally/yearly climate signals on the water column condition in shallow water regions. Given the free availability of WOA13 V2 data and the similarity between the WOA13 V2 and the in situ measured buoyancy frequency profile, we also applied the proposed method to derive amplitude by using the WOA13 V2 data in the study area, which is then compared with the derived amplitude by using the in situ stratification data.

2.4. The Conventional Method of ISW Amplitude Estimation Based on the Classic KdV Equation in a Continuously Stratified Ocean Model

The conventional ISW amplitude estimation method applying the classic KdV equation in a continuously stratified ocean was developed by Small et al. [18]. Here, we briefly describe the method. The following Equations (1)–(7) are from Reference [18] and are presented here for understanding the method.
The propagation of an ISW along the x -direction is described by the KdV equation:
η t + c 0 η x + α η η x + β 3 η x 3 = 0
where η ( x , t ) is the maximum vertical displacement of isopycnal surfaces, x is the spatial variable in the direction of wave propagation, t is the time, c 0 is the linear wave speed of ISWs, and α and β are the quadratic non-linear and dispersion parameters, respectively. For a continuously stratified system, these parameters are obtained as follows:
α = 3 2 c 0 H 0 ( d ϕ d z ) 3 d z H 0 ( d ϕ d z ) 2 d z
β = c 0 2 H 0 ϕ 2 d z H 0 ( d ϕ d z ) 2 d z
where H is the water depth, ϕ ( z ) is the vertical structure function for the first mode, which is normalized by its maximum absolute value. ϕ ( z ) and c 0 can be obtained by solving the following Sturm–Liouville equation for a Boussinesq fluid in two dimensions and with no current shear or rotation:
d 2 ϕ ( z ) d z 2 + N 2 ( z ) c 0 2 ϕ ( z ) = 0 ϕ ( H ) = ϕ ( 0 ) = 0
where N ( z ) is the buoyancy frequency, which can be obtained by in situ CTD measurements or climatological data.
An analytical solution of Equation (1) is as follows:
η ( ξ ) = η 0 s e c h 2 ( ξ l )   a n d   ξ = x c t
where l is the characteristic half width, η 0 is the ISW amplitude, and c is the non-linear phase speed. These parameters are obtained as follows:
η 0 = 12 β α l 2
c = c 0 + 1 3 η 0 α
Therefore, if we have the ISW characteristic half width l and the background stratification profile, the ISW amplitude can be calculated using Equation (6). The background stratification profile can be obtained from in situ measurements or climatological data. The characteristic half width of ISWs can be derived by the curve fitting method proposed in Reference [20]. However, since the expression for ISW signature on SAR images used in the curve fitting method of Reference [20] is based on a two-layer theory, we need to deduce the expression for ISW signature on SAR images in a continuously stratified ocean.
For a given radar wave number k 0 and incidence angle θ , the NRCS (denoted σ 0 ) depends on the surface capillary-gravity wave spectrum density [37]. Under the equilibrium and steady condition, the variations of surface capillary-gravity wave spectra density are mainly modulated by three terms: wind input, viscosity dissipation, and ISW-induced current [19,20]. On the horizontal scale of an internal wave packet, the first two terms of wind input and viscosity dissipation are uniform, and thereafter only contribute to the background of an internal wave SAR image. Thus, the modulation effects caused by the internal waves on σ 0 are what we focus on in this study. Following the ideas presented in Reference [19], the theoretical expression for the soliton-induced radar backscatter cross-section per unit area ( σ 0 I S W ) is given in Equation (8).
σ 0 I S W = 8 π k 0 4 m 3 1 | g i j ( θ ) | 2 c o s χ k s w 4 ω 1 ( ( u | z = 0 ) x )
where θ and k 0 represent the incidence angle and wave number of radar waves, respectively, k s w = 2 k 0 s i n θ indicates the wave numbers of the resonant surface Bragg waves, χ represents the SAR beam looking angle relative to the wave direction,   ω is the angular frequency of the resonant surface Bragg waves, and m 3 is the non-dimensional constant. The indices i and j denote the polarizations of the incident and backscattered microwaves, respectively, and g i j ( θ ) represents the first-order scattering coefficients. u is the ISW-induced horizontal velocity, which can be obtained as follows:
u = c 0 η ( ξ ) d ϕ d z
Substituting Equation (5) into Equation (9) and then substituting the result into Equation (8), we have the following equation:
σ 0 I S W = M s e c h 2 ( ξ l ) t a n h ( ξ l )
where M = 16 π k 0 4 ω l m 3 | g i j ( θ ) | 2 c o s χ k s w 4 c 0 η 0 ( d ϕ d z | z = 0 ) .
By taking a normal transect through an ISW pattern on the SAR image as the transect AA’ shown in Figure 2a, we can obtain a horizontal distribution curve of pixel backscattering intensity value I . Fitting the curve to Equation (10), we know that I can be expressed in the following form:
I ( ξ ) = A   s e c h 2 ( ξ B l ) t a n h ( ξ B l ) + C
where A , B , and C are the fitting parameters.
From Equation (11), we can see that the pixel values of ISWs on the SAR image are relevant to the four parameters ( A , B , l , and C ). These parameters are determined by the best fitting curve to the pixel values along a transect across an ISW on the SAR image by Equation (11). Having the ISW characteristic half width l and the background stratification profile, one can calculate the ISW amplitude using Equation (6).

2.5. The Proposed Method of ISW Amplitude Estimation Based on the eKdV Equation in a Two-Layer Ocean Model

As mentioned in the Introduction, a simplified two-layer oceanic model is more practical than a continuously stratified model for estimating the ISW amplitude. Thus, the proposed method was applied to a two-layer ocean and employs the eKdV equation because the eKdV equation is a good indicator of the ISW amplitude estimation in the two-layer shallow water [21].
The eKdV equation is written as follows [38,39]:
η t + c 0 η x + α η η x + α 1 η 2 η x + β 3 η x 3 = 0
where α 1 is the cubic non-linearity parameter.
For a two-layer system with a rigid lid and no background flow, in the Boussinesq approximation, the following Equations (13)–(16) can be obtained:
c 0 = ( g Δ ρ h 1 h 2 ρ 0 ( h 1 + h 2 ) ) 1 2
α = 3 2 c 0 h 1 h 2 h 1 h 2
β = c 0 6 h 1 h 2
α 1 = 3 c 0 ( h 1 h 2 ) 2 ( 7 8 ( h 1 h 2 ) 2 ( h 1 3 + h 2 3 h 1 + h 2 ) )
where h 1 is the upper layer thickness and h 2 is the lower layer thickness. For depression wave, h 1 < h 2 . Δ ρ / ρ 0 = 2 ( ρ 2 ρ 1 ) / ( ρ 2 + ρ 1 ) is the relative layer density difference, where ρ 1 ( ρ 2 ) is the uniform density of the upper (lower) layer, which is defined as follows [14]:
ρ 1 = 0 h 1 ρ ( z ) d z h 1
            ρ 2 = h 1 h 2 + h 1 ρ ( z ) d z h 2
here, ρ ( z ) is the background density profile.
From Equation (14), we know that α has a negative sign if considering the case in which the wave amplitude η 0 < 0 (depression wave). According to Equation (15), the dispersion parameter β is positive. As the term inside the square bracket of Equation (16) can be equally transformed into ( h 1 3 7 h 1 2 h 2 7 h 1 h 2 2 h 2 3 ) / 8 ( h 1 + h 2 ) , α 1 is negative.
One of the ISW solutions to the eKdV equation is as follows:
η ( ξ ) = η 0 b + ( 1 b ) c o s h 2 ( γ ξ )   a n d     ξ = x c t
where
c = c 0 + 1 3 η 0 ( α + 1 2 α 1 η 0 )
γ 2 = η 0 ( α + 1 2 α 1 η 0 ) 12 β
b = η 0 α 1 2 α + α 1 η 0
here, b is a parameter that satisfies b < 1 . When b > 1 , solution (19) would contain meaningless points of discontinuity, which make the denominator of solution (19) equal to 0. As the upper limit ( b 1 ) is approached, the waves begin to broaden until a limiting table-topped wave amplitude is reached.
To obtain the eKdV type σ 0 I S W , we substitute solution (19) into Equation (9) and then substitute the result into Equation (8). Therefore, σ 0 I S W is written as follows:
σ 0 I S W = Q s i n h ( γ ξ ) c o s h ( γ ξ ) ( b + ( 1 b ) c o s h 2 ( γ ξ ) ) 2
here, Q = 16 π k 0 4 ω m 3 | g i j ( θ ) | 2 c o s χ k s w 4 c 0 η 0   γ ( 1 b ) ( d ϕ d z | z = 0 ) .
Similar to Equation (11), Equation (23) is modified into the following form:
I ( ξ ) = A s i n h ( γ ( ξ B ) ) c o s h ( γ ( ξ B ) ) ( b + ( 1 b ) c o s h 2 [ γ ( ξ B ) ] ) 2 + C
where I still represents the SAR image pixel backscattering intensity value, and A , B , and C are, again, the fitting parameters of I to Equation (24).
From Equation (24), the pixel backscattering intensity value I is found to be related to the five parameters A , B , b , γ , and C . Figure 6 shows an illustrated plot of I versus ξ for setting A = 1 , B = 0 , C = 0 ,   γ = 1 , and b = 0.5 . In the I   ξ plot, there is one maximum point ( ξ m a x , I m a x ) and one minimum point ( ξ m i n , I m i n ), marked by red dots. According to Equation (24), we obtain that ξ m a x and ξ m i n are as follows:
ξ m a x = 1 γ a r c o s h ( b 3 ) 9 b 2 14 b + 9 4 ( b 1 ) + B
ξ m i n = 1 γ a r c o s h ( b 3 ) 9 b 2 14 b + 9 4 ( b 1 ) + B
Therefore, ξ m a x and ξ m i n satisfy the following equation:
ξ m a x + ξ m i n 2   = B
I m a x and I m i n are obtained as follows:
                                  I m a x = | A | ( b 3 ) 9 b 2 14 b + 9 4 ( b 1 ) · ( b 3 ) 9 b 2 14 b + 9 4 ( b 1 ) 1 [ b + ( 1 b ) · ( b 3 ) 9 b 2 14 b + 9 4 ( b 1 ) ] 2 + C
                          I m i n = | A | ( b 3 ) 9 b 2 14 b + 9 4 ( b 1 ) · ( b 3 ) 9 b 2 14 b + 9 4 ( b 1 ) 1 [ b + ( 1 b ) · ( b 3 ) 9 b 2 14 b + 9 4 ( b 1 ) ] 2 + C
From Equations (28) and (29), we obtain the following equation:
I m a x + I m i n 2   = C
Based on Equations (27) and (30), parameters B and C can be directly obtained after locating the maximum and minimum points in the pixel backscattering intensity profile of an ISW on the SAR image. From Equations (20)–(22), (28), and (29), the other three parameters   γ , b , and A are obtained:
γ 2 = ( c c 0 ) 4 β
b = η 0 2 α 1 6 ( c c 0 )   with   η 0 = α α 2 + 6 α 1 ( c c 0 ) α 1
| A | = 1 2 ( I m a x I m i n ) · [ b + ( 1 b ) · ( b 3 ) 9 b 2 14 b + 9 4 ( b 1 ) ] 2 ( b 3 ) 9 b 2 14 b + 9 4 ( b 1 ) · ( b 3 ) 9 b 2 14 b + 9 4 ( b 1 ) 1
According to Equation (32), the amplitude η 0 is dependent on the upper layer thickness h 1 , total water depth H , background density profile ρ ( z ) , and phase speed c . In this study, the water depth was determined from a local nautical chart, the background density profile was taken from in situ measurements or WOA13 dataset, the phase speed was determined by using two consecutive remote sensing images, and the upper layer thickness was found by a best fitting curve of the pixel values of an ISW using Equation (24). Finally, the amplitude was obtained in terms of Equation (32). Actually, the idea behind using consecutive remote sensing image pairs to find accurate upper layer thickness and estimating consequent ISW amplitude is similar to that of Reference [16] in which Doppler velocities from along-track InSAR data were considered to find a plausible upper layer thickness and internal soliton amplitude within their expected ranges. Moreover, a point that must be addressed is that another wave amplitude solution η 0 = ( α + α 2 + 6 α 1 ( c c 0 ) ) / α 1 can also be acquired by solving Equation (20), which is not considered here because in this case, the parameter b = ( α α 2 + 6 α 1 ( c c 0 ) ) / ( α + α 2 + 6 α 1 ( c c 0 ) ) was greater than 1 for α 1 < 0 and α < 0 .

3. Results and Analysis

This section presents the results of the ISW amplitude estimation in the Hainan case obtained using the two methods described above.

3.1. The Derived ISW Amplitude Using the Conventional Method

Figure 7 shows the best fitting curve between the pixel backscattering intensity value of the soliton L 1 observed on the GF-3 SAR image and the theoretical model result given in Equation (11). The pixel backscattering intensity values of the soliton   L 1 observed on the SAR images (the red points in Figure 7) are written as I 01 , I 02 , I 03 , I 04 , I 0 n , respectively. The optimal fitting coefficients ( A m , B m , l m , C m ) obtained by the curve fitting among the observation values ( I 0 i ,   i = 1 , 2 , 3 , n ) and the theoretical model (11) are −10.75, 1.35, 144.93 m, and −11.66, respectively. Here, the curve fitting method rather than the Cramér–Rao Bound method [31] was applied for estimating the characteristic half width. It is because the amplitude of the ISW backscattering intensity defined in Reference [31] was small (about 0.85) in our case, from which we could deduce that the curve fitting and Cramér–Rao Bound methods may have little difference in the characteristic half width estimation (refer to Figure 4b in Reference [31]). Thus, the curve fitting method was adopted here for its relative simplicity. Determined by the background density profile shown in Figure 4, the quadratic parameter α and dispersion parameter β were −0.0158 and 157.06, respectively. Therefore, the amplitude of the soliton L 1 using this conventional method was estimated to be −5.66 m.
Small et al. [18] concluded that the conventional method of using the ISW characteristic half width estimated from SAR images to derive soliton amplitudes can provide basic estimates of amplitude, but the results contain some uncertainties and may be affected by some factors, such as the characteristic half width, water depth, and background stratification. Therefore, this estimation of −5.66 m cannot be directly treated as a real value for comparison with the amplitude derived using the proposed method. To clarify the reliability of this amplitude estimation, we conducted the following uncertainty analysis. Here, the analysis method was similar to that adopted in Reference [19].
The theoretical model (11) in the case of the optimal curve fitting estimation can be rewritten as follows:
I m ( ξ ) = A m s e c h 2 ( ξ B m l m ) t a n h ( ξ B m l m ) + C m
The total root mean square (RMS) deviation D e v of the pixel backscattering intensity values between the observations on SAR images and theoretical model (34) is as follows:
D e v = 1 n i = 1 n [ I o i I m ( A m , B m , l m , C m , ξ i ) ] 2
From model (34), we know that the D e v of pixel backscattering intensity values is caused by the uncertainties in the four parameters A m , B m , l m , and C m . Thus, the D e v can also be written as follows:
D e v = | I m l | | Δ l m | + | I m A | | Δ A m | + | I m B | | Δ B m | + | I m C | | Δ C m |
where Δ l m is the uncertainty in l m and
| I m l | = 1 n i = 1 n ( I l ) 2 ( A m , B m , l m , C m , ξ i )
As the amplitude η 0 is a function of α , β , and l (refer to Equation (6)), and α and β , which are derived from the field observation profile, are close to the real value, the uncertainty in the amplitude estimation ( Δ η 0 m ) is caused by only Δ l m and can be written as follows:
Δ η 0 m = | η 0 l ( α , β , l m ) | | Δ l m |
According to Equation (38), Δ η 0 m is directly proportional to Δ l m . To give a maximum estimation of the uncertainty in the amplitude retrieval, we assume that D e v = | I m l | | Δ l m | by neglecting the contributions of the three parameters A m ,   B m , and C m to D e v in Equation (36). Therefore, the uncertainty in parameter l m can be derived by the following equation:
Δ l m = D e v | I m l |
Substituting the optimal curve fitting parameters A m , B m , l m , and C m into Equations (35) and (37)–(39), respectively, we obtain D e v , Δ l m , and Δ η 0 m as 0.32, 15.87 m, and 1.24 m, respectively. Thus, the amplitude of the soliton L 1 should be −5.66 m with an uncertainty of ± 1.24 m.

3.2. The Derived ISW Amplitude Using the Proposed Method

From the profile of the pixel backscattering intensity value of the soliton L 1 (Figure 7), we can derive the maximum point ( ξ m a x , I m a x ) and minimum point ( ξ m i n , I m i n ) located at approximately (1.26, −7.50) and (1.44, −15.62), respectively. Thus, B and C are estimated to be 1.35 and −11.56, respectively. As the internal soliton usually features a wide stripe on SAR images, we define the point where the positive peak of the ISW signature is on the SAR image as its location. Therefore, the propagation distance of an ISW within a short time is defined as the distance between two positive peaks, whose geographic locations can be determined from SAR images with the help of Sentinel Toolbox software (http://step.esa.int/main/download/). In the present study, the propagation distance of the soliton L 1 determined from the two consecutive GF-3 and TS-X SAR images within 11 min was 435.6 m (thus, the phase speed was approximately 0.66 m/s). From the background density profiles shown in Figure 4, it is difficult to exactly determine the upper layer thickness, which seems to be in a large range of 9 m to 33 m. Using a simple iterative approximation scheme, the optimal upper layer thickness of 23 m was eventually determined by making the best fitting curve between Equation (24) and the SAR image pixel values along the transect AA’ of the soliton L 1 . Figure 8 shows the best fitting curve between the pixel backscattering intensity value of the soliton L 1 observed on the GF-3 SAR image and the theoretical model given in Equation (24). Therefore, the amplitude of soliton L 1 was subsequently calculated to be approximately −4.52 m, which agrees with the amplitude estimation of −5.66 ± 1.24 m derived by the conventional KdV equation in a continuously stratified ocean.
A great challenge of using SAR images to retrieve the ISW amplitude is the need for synchronous in situ background stratification data. Here, we showed that our method could partially overcome this challenge using the climatological data WOA13 V2. The density profile (Figure 5) obtained from the WOA13 V2 climatological datasets was used to derive the amplitude of soliton L 1 in the Hainan case. Our method yields an amplitude of −7.35 m, which is comparable to the reference value of −5.66 ± 1.24 m. However, if the density profile of WOA13 V2 was used for the conventional method based on the KdV equation in a continuously stratified ocean, the estimated amplitude would be −16.30 m, which is almost three times the reference value. Clearly, the proposed method yields more credible results than the conventional method in the case where in situ measurements are unavailable. This result may be because the 5 m depth vertical interval of the background stratification profile from the WOA13 V2 dataset is relatively coarse for the amplitude estimation in shallow water using the conventional method. In contrast, the coarse oceanic density profile obtained from the WOA13 V2 dataset has fewer effects on the amplitude estimation using the proposed method, which suggests that the proposed method using consecutive SAR images and the eKdV equation in a two-layer ocean is a reliable way to estimate the ISW amplitude independent of in situ oceanic density profile measurements.

4. Discussion

Determining the upper layer thickness is a crucial step in estimating ISW amplitude from SAR images. In some reported cases, the sea water features a thin and strongly stratified pycnocline, sandwiched between two homogeneous layers, and therefore the upper layer thickness can be accurately estimated. Two common approaches have been proposed to determine the upper layer thickness from the background density profile. One approach is the eigenfunction method, which defines that the depth where the first mode eigenfunction has its maximum is the upper layer thickness. The other one is the N m a x method, which determines the depth of the maximum buoyancy frequency as the upper layer thickness. If the eigenfunction method is applied to the Hainan case, based on the two-layer eKdV theory, the upper layer thickness and amplitude of the soliton L 1 are estimated to be approximately 29 m and −5.37 m, respectively. If the N m a x method is applied, the upper layer thickness is approximately 13 m, and the amplitude of the soliton L 1 is approximately −12.01 m. Therefore, one can find that the uncertainties of upper layer thickness estimation can lead to large discrepancy of amplitude estimation. The stratification profile in the Hainan case suggests that the uncertainties of upper layer thickness estimation arises from the typical stratification of a thick pycnocline, which makes the determination of the upper layer thickness in a two-layer model rather ambiguous and difficult. Our proposed method solves this problem by using tandem SAR images to determine the accurate ISW phase speed, which then is used to estimate the optimum upper layer thickness and the consequent ISW amplitude.
While a case study shows the effectiveness of the proposed method, there are some aspects needed to be discussed.
The key to the proposed method is to seek two consecutive images to estimate the accurate phase speed. As the derived ISW phase speed in the proposed method is used to fit the theoretical model of radar backscatter intensity to the SAR observation for determining the optimum upper layer thickness, the image pair applied in the proposed method should include at least one SAR image. In this study, we use two consecutive SAR images (tandem SAR images) to drive the method. A development trend of modern spaceborne SAR is constellation configurations, such as Cosmo-SkyMed, TerraSAR-X and its twin Tandem-X, and the recently launched Radarsat constellation mission; therefore, acquisitions of tandem SAR images become increasingly feasible. In addition to the combination of tandem SAR images, a combination of SAR image and an optical image is also feasible to construct consecutive image pairs to apply the proposed method, which shall be tested in our further work. However, for constructing a consecutive image pair used for the proposed method, two aspects remain further studies. One is the geolocation accuracy of the two consecutive images. The geolocation accuracy directly determines the retrieval accuracy of the phase speed and the consequent amplitude. The other aspect is the temporal interval between the two consecutive images. The appropriate temporal interval for estimation of phase speed of ISWs should depend on the propagation and evolution characteristics of ISWs. In principle, the larger the variation of the ISW phase speed between two observations is, the shorter the temporal interval between two remote sensing images should be.
There is not yet a method for calculating the exact equivalent two-layer ocean model of a continuously stratified ocean [33]. A reasonable approach to judge whether a two-layer fluid model is or not a good representation of the actual continuous density profile is to compare the coefficients of the KdV-type equation (including the linear wave speed c 0 , quadratic non-linear parameter α , cubic parameter α 1 and dispersion parameter β ). In this study, the derived four coefficients of c 0 , α , α 1 , and β in the two-layer eKdV equation using the derived optimum upper layer thickness of 23 m are 0.63, −0.0226, −0.0018, and 123.54, respectively, which agree with the four coefficients estimated based on the continuous stratified eKdV equation [40] without considering current shear or rotation with values of 0.60, −0.0158, −0.0003, and 157.06, respectively. This should be the reason why the ISW amplitude derived by the conventional method and the proposed method is close to each other in the Hainan case.

5. Summary and Conclusions

Amplitude is one of the most important parameters of ISWs, while the retrieval of their amplitudes from satellite remote sensing images, which generally reflects sea surface variations, remains difficult, although observations of ISWs from space have been available for a few decades. Combining satellite remote sensing images, e.g., SAR images, and the KdV equation for application in a continuous stratification can generally yield reasonable ISW amplitude estimations. However, this method requires simultaneous in situ measurements of background stratification (density) profiles, which are often not available. To overcome this difficulty, the simplified two-layer ocean model was introduced, which improves the practicability of deriving ISW amplitudes from SAR images. However, uncertainties in estimating upper layer thickness in the two-layer ocean may lead to large discrepancies in amplitude estimations. The Hainan case shown in this study is a typical one with such an existing such problem, where the thick pycnocline relative to water depth makes it difficult to determine the upper layer thickness from the oceanic density profile. Therefore, we proposed a new method to solve this problem in the retrieval of ISW amplitudes from SAR images.
In the proposed method, we firstly developed a theoretical model describing the radar backscatter cross-section of ISWs based on the eKdV theory in a two-layer ocean. By fitting the theoretical model estimation of radar backscatter to the SAR observations, we exploited consecutive SAR images to determine the optimum upper layer thickness for amplitude estimation. The retrieved ISW amplitude in the Hainan case agrees well with the result estimated by the classic KdV equation in the measured stratification. A key parameter needed in this method is the ISW phase speed. Different from the previous methods (assuming phase speed is equivalent to the group velocity), our estimation of phase speed was based on two consecutive SAR images acquired with a short temporal interval on a scale of dozens of minutes, which ensures derivation of an instantaneous phase speed and further leads to accurate estimations of ISW amplitudes. Besides, using the representative climatological dataset of WOA13 V2 instead of in situ measurements can also yield a more reasonable estimation of ISW amplitudes than the results using the conventional method based on the KdV theory in a continuously stratified ocean in this shallow water case. This result suggests that the proposed method can provide basic yet reliable information on ISW amplitudes even when in situ measurements are absent.
In conclusion, the present study demonstrates a method of retrieving ISW amplitude from SAR images, which are characterized by a consecutive image pair within a short time interval. Since the method has a potential capability to get reliable amplitude estimations when the in situ measurements are absent, it could have a wide and attractive application in retrieving ISW amplitude under the trend that modern spaceborne SAR tends to be in constellation configurations.

Author Contributions

Conceptualization, X.-M.L.; Formal analysis, T.J.; Funding acquisition, X.-M.L.; Investigation, T.J., J.L. and X.-M.L.; Methodology, T.J., J.L., X.-M.L.; Project administration, X.-M.L.; Resources, X.-M.L.; Supervision, X.-M.L.; Writing—original draft, T.J.; Writing—review and editing, J.L., X.-M.L., and K.F.

Funding

The National Natural Science Foundation of China (No. 41876201) and the Natural Science Foundation of Hainan Province (2016CXTD2016) funded this research.

Acknowledgments

The authors would like to thank China Remote Sensing Satellite Ground Station for providing the GF-3 SAR data and the German Aerospace Center (DLR) for the TS-X SAR data. The ERA5 wind data were accessed from the European Center for Medium-Range Weather Forecasts (ECMWF, available at https://cds-dev.copernicus-climate.eu/cdsapp#!/data-set/reanalysis-era5-single-levels-area-without-map?tab=form). The WOA13 V2 data were provided by National Centers for Environmental Information (NCEI, available at www.nodc.noaa.gov/OC5/woa13/).

Conflicts of Interest

The authors declare no conflict of interest.

References

  1. Magalhaes, J.M.; Da Silva, J.C.B. Internal solitary waves in the Andaman Sea: New insights from SAR imagery. Remote Sens. 2018, 10, 861. [Google Scholar] [CrossRef]
  2. Apel, J.R.; Holbrook, J.R.; Liu, A.K.; Tsai, J.J. The Sulu Sea internal soliton experiment. J. Phys. Oceanogr. 1985, 15, 1625–1651. [Google Scholar] [CrossRef]
  3. Liang, J.; Li, X.-M.; Sha, J.; Jia, T.; Ren, Y. The lifecycle of nonlinear internal waves in the northwestern South China Sea. J. Phys. Oceanogr. 2019. [Google Scholar] [CrossRef]
  4. Lavrova, O.; Mityagina, M. Satellite survey of internal waves in the Black and Caspian Seas. Remote Sens. 2017, 9, 892. [Google Scholar] [CrossRef]
  5. Sandstrom, H.; Elliott, J.A. Internal tide and solitons on the Scotian Shelf: A nutrient pump at work. J. Geophys. Res. Oceans 1984, 89, 6415–6426. [Google Scholar] [CrossRef]
  6. Nash, J.D.; Shroyer, E.L.; Kelly, S.M.; Inall, M.E.; Duda, T.F.; Levine, M.D.; Jones, N.L.; Musgrave, R.C. Are any coastal internal tides predictable? Oceanography 2012, 25, 80–95. [Google Scholar] [CrossRef]
  7. Osborne, A.R.; Burch, T.L.; Scarlet, R.I. The influence of internal waves on deep-water drilling. J. Pet. Technol. 1978, 30, 1497–1504. [Google Scholar] [CrossRef]
  8. Horne, E.; Beckebanze, F.; Micard, D.; Odier, P.; Maas, L.R.M.; Joubaud, S. Particle transport induced by internal wave beam streaming in lateral boundary layers. J. Fluid Mech. 2019, 870, 848–869. [Google Scholar] [CrossRef] [Green Version]
  9. Chiu, C.S.; Ramp, S.R.; Miller, C.W.; Lynch, J.F.; Duda, T.F.; Tang, T.Y. Acoustic intensity fluctuations induced by South China Sea internal tides and solitons. IEEE J. Ocean. Eng. 2004, 29, 1249–1263. [Google Scholar] [CrossRef]
  10. Woodson, C.B. The fate and impact of internal waves in nearshore ecosystems. Annu. Rev. Mar. Sci. 2018, 10, 421–441. [Google Scholar] [CrossRef]
  11. Jackson, C.R.; Da Silva, J.C.B.; Jeans, G.; Alpers, W.; Caruso, M.J. Nonlinear internal waves in synthetic aperture radar imagery. Oceanography 2013, 26, 68–79. [Google Scholar] [CrossRef]
  12. Alpers, W. Theory of radar imaging of internal waves. Nature 1985, 314, 245–247. [Google Scholar] [CrossRef]
  13. Porter, D.L.; Thompson, D.R. Continental shelf parameters inferred from SAR internal wave observations. J. Atmos. Ocean. Technol. 1999, 16, 475–487. [Google Scholar] [CrossRef]
  14. Fan, K.; Fu, B.; Gu, Y.; Yu, X.; Liu, T.; Shi, A.; Xu, K.; Gan, X. Internal wave parameters retrieval from space-borne SAR image. Front. Earth Sci. 2015, 9, 700–708. [Google Scholar] [CrossRef]
  15. Wang, J.; Yang, J.; Li, J.; Ren, L.; Zheng, G. Study on extracting and verifying internal wave parameter of SAR image. In Proceedings of the SPIE 9638, Remote Sensing of the Ocean, Sea Ice, Coastal Waters, and Large Water Regions 2015, Toulouse, France, 23 September 2015. [Google Scholar] [CrossRef]
  16. Romeiser, R.; Graber, H.C. Advanced remote sensing of internal waves by spaceborne along-track InSAR-A demonstration with TerraSAR-X. IEEE Trans. Geosci. Remote Sens. 2015, 53, 6735–6751. [Google Scholar] [CrossRef]
  17. Wang, C.; Wang, X.; Da Silva, J.C.B. Studies of internal waves in the strait of Georgia based on remote sensing images. Remote Sens. 2019, 11, 96. [Google Scholar] [CrossRef]
  18. Small, J.; Hallock, Z.; Pavey, G.; Scott, J. Observations of large amplitude internal waves at the Malin Shelf edge during SESAME 1995. Cont. Shelf Res. 1999, 19, 1389–1436. [Google Scholar] [CrossRef]
  19. Pan, J.; Jay, D.A.; Orton, P.M. Analyses of internal solitary waves generated at the Columbia River plume front using SAR imagery. J. Geophys. Res. Oceans 2007, 112. [Google Scholar] [CrossRef] [Green Version]
  20. Zheng, Q.; Yuan, Y.; Klemas, V.; Yan, X. Theoretical expression for an ocean internal soliton synthetic aperture radar image and determination of the soliton characteristic half width. J. Geophys. Res. Oceans 2001, 106, 31415–31423. [Google Scholar] [CrossRef]
  21. Xue, J.; Graber, H.C.; Lund, B.; Romeiser, R. Amplitudes estimation of large internal solitary waves in the Mid-Atlantic Bight using synthetic aperture radar and marine X-band radar images. IEEE Trans. Geosci. Remote Sens. 2013, 51, 3250–3258. [Google Scholar] [CrossRef]
  22. Hong, D.-B.; Yang, C.-S.; Ouchi, K. Preliminary study of internal solitary wave amplitude off the East coast of Korea based on synthetic aperture radar data. J. Mar. Sci. Technol. Taiwan 2016, 24, 1194–1203. [Google Scholar] [CrossRef]
  23. Benjamin, T.B. Internal waves of finite amplitude and permanent form. J. Fluid Mech. 1966, 25, 241–270. [Google Scholar] [CrossRef] [Green Version]
  24. Benney, D.J. Long non-linear waves in fluid flows. J. Math Phys. 1966, 45, 52–63. [Google Scholar] [CrossRef]
  25. Joseph, R.I. Solitary waves in a finite depth fluid. J. Phys. A Math. Gen. 1977, 10, L225–L227. [Google Scholar] [CrossRef]
  26. Kubota, T.; Ko, D.R.S.; Dobbs, L. Propagation of weakly nonlinear internal waves in a stratified fluid of finite depth. J. Hydronaut. 1978, 12, 157–165. [Google Scholar] [CrossRef]
  27. Benjamin, T.B. Internal waves of permanent form in fluids of great depth. J. Fluid Mech. 1967, 29, 559–592. [Google Scholar] [CrossRef]
  28. Ono, H. Algebraic solitary waves in stratified fluids. J. Phys. Soc. Jpn. 1975, 39, 1082–1091. [Google Scholar] [CrossRef]
  29. Rodenas, J.A.; Garello, R. Wavelet analysis in SAR ocean image profiles for internal wave detection and wavelength estimation. IEEE Trans. Geosci. Remote Sens. 1997, 35, 933–945. [Google Scholar] [CrossRef]
  30. Gan, X. A new method to extract internal wave parameters from SAR imagery with Hilbert-Huang transform. J. Remote Sens. 2007, 11, 39–47. [Google Scholar]
  31. Wang, P.; Wang, X.; Chong, J.; Lu, Y. Optimal parameter estimation method of internal solitary waves in SAR images and the Cramér–Rao bound. IEEE Trans. Geosci. Remote Sens. 2016, 54, 3143–3150. [Google Scholar] [CrossRef]
  32. Chen, G.-Y.; Wu, C.-L.; Wang, Y.-H. Interface depth used in a two-layer model of nonlinear internal waves. J. Oceanogr. 2014, 70, 329–342. [Google Scholar] [CrossRef]
  33. Zhao, Z.; Klemas, V.; Zheng, Q.; Li, X.; Yan, X.-H. Estimating parameters of a two-layer stratified ocean from polarity conversion of internal solitary waves observed in satellite SAR images. Remote Sens. Environ. 2004, 92, 276–287. [Google Scholar] [CrossRef]
  34. Li, X.; Clemente-Colón, P.; Friedman, K.S. Estimating oceanic mixed-layer depth from internal wave evolution observed from Radarsat-1 SAR. Johns Hopkins APL Tech. Dig. 2000, 21, 130–135. [Google Scholar]
  35. Yang, J.; Huang, W.; Xiao, Q.; Zhou, C.; Hsu, M.K. Oceanic pycnocline depth retrieval from SAR imagery in the existence of solitary internal waves. Acta Oceanol. Sin. 2005, 24, 46–49. [Google Scholar]
  36. Liu, B.; Yang, H.; Zhao, Z.; Li, X. Internal solitary wave propagation observed by tandem satellites. J. Geophys. Res. Oceans 2014, 41, 2077–2085. [Google Scholar] [CrossRef]
  37. Plant, W.J. Bragg scattering of electromagnetic waves from the air/sea interface. In Surface Waves and Fluxes; Geernaert, G.L., Plant, W.J., Eds.; Kluwer Academic Publishers: Dordrecht, The Netherland, 1990; Volume II, pp. 41–108. [Google Scholar]
  38. Helfrich, K.R.; Melville, W.K. Long nonlinear internal waves. Annu. Rev. Fluid Mech. 2006, 38, 395–425. [Google Scholar] [CrossRef]
  39. Grimshaw, R. Internal solitary waves. In Environmental Stratified Flows; Grimshaw, R., Ed.; Kluwer Academic Publishers: Boston, MA, USA, 2003; pp. 1–27. [Google Scholar]
  40. Grimshaw, R.; Pelinovsky, E.; Talipova, T.; Kurkin, A. Simulation of the transformation of internal solitary waves on oceanic shelves. J. Phys. Oceanogr. 2004, 34, 2774–2791. [Google Scholar] [CrossRef]
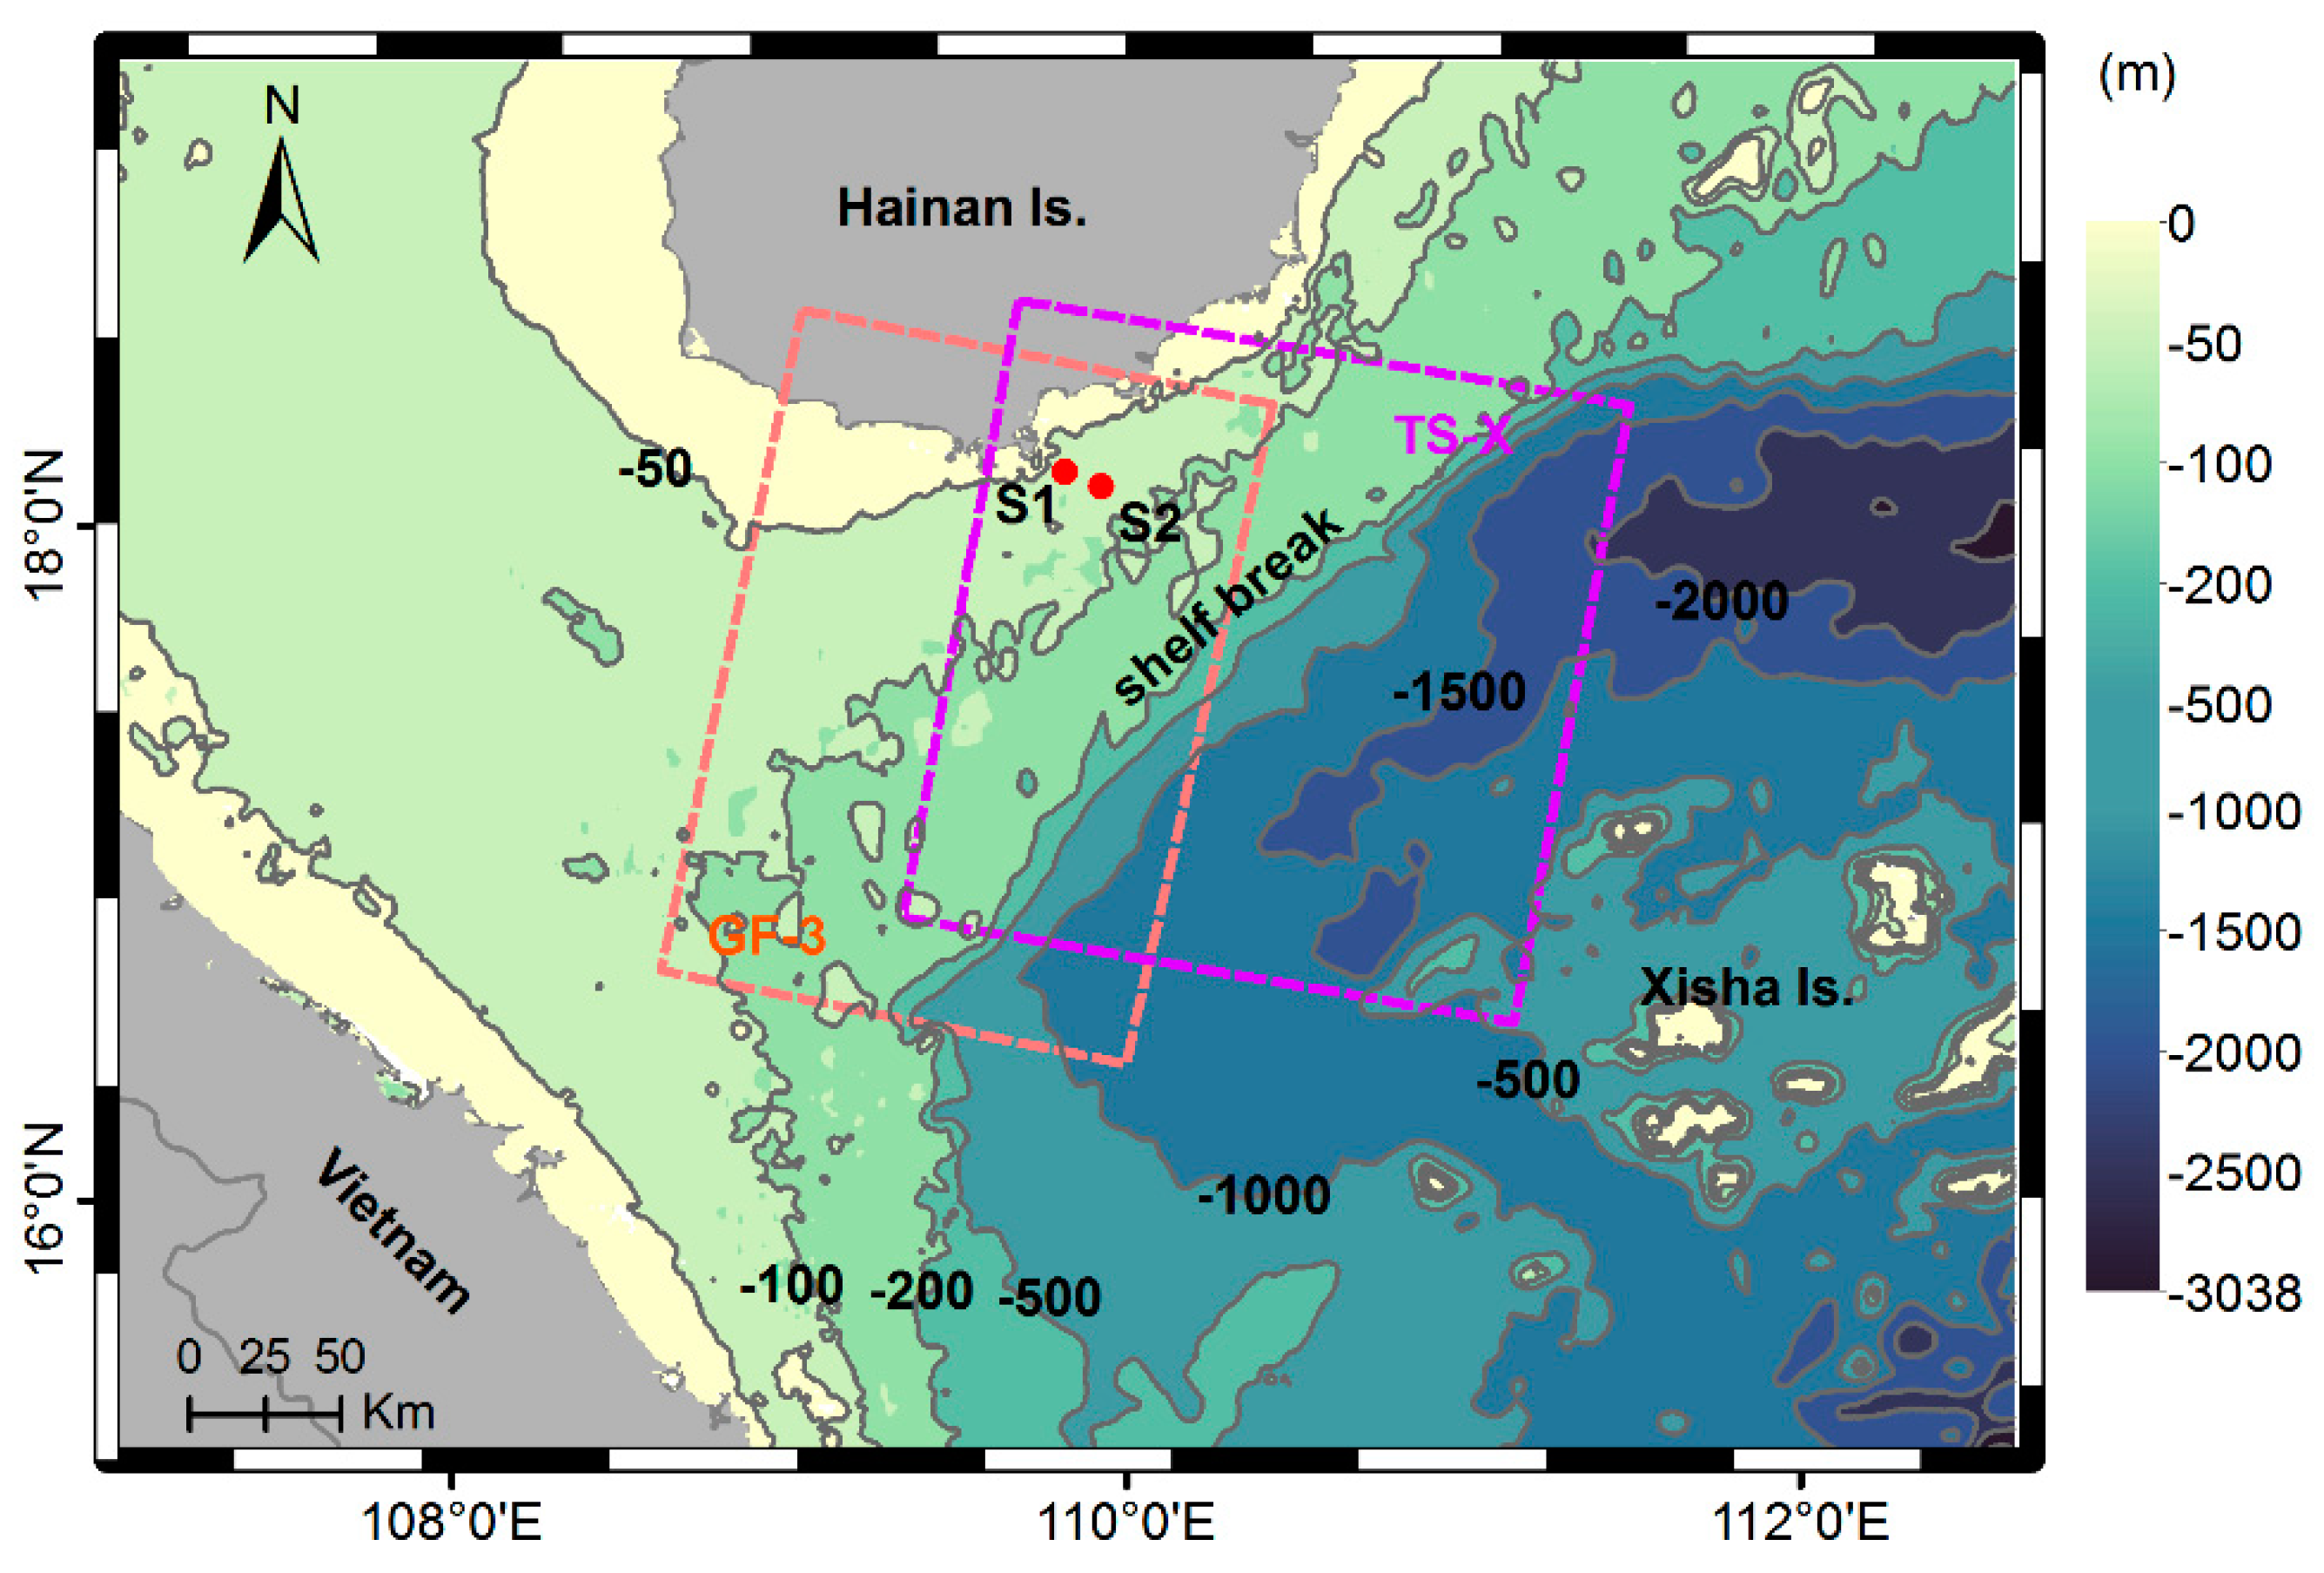
Figure 1. Bathymetric map of southeastern Hainan Island and its adjacent area. The synthetic aperture radar (SAR) image coverages are indicated in the orange dashed line box (GF-3) and the purple box (TS-X). The two locations S1 and S2 where conductivity–temperature–pressure (CTD) measurements were taken are marked by red dots.
Remotesensing 11 01706 g001
Figure 2. A portion of (a) the GF-3 SAR image acquired at 22:43 UTC on 10 June 2017 and (b) a TS-X image acquired at 22:32 UTC on 10 June 2017. The yellow arrows superimposed on the GF-3 sub-image show the ERA5 reanalysis sea surface wind vectors (hourly available at 0.25 degree grids) at 23:00 UTC on 10 June 2017.
Remotesensing 11 01706 g002
Figure 3. Variations in the pixel backscattering intensity values (averaged and smoothed NRCS) along the transect AA’ corresponding to the red line in Figure 2a.
Remotesensing 11 01706 g003
Figure 4. Mean background oceanic profiles of (a) density and (b) buoyancy frequency from CTD casts of S1 (109.8190°E, 18.1596°N) and S2 (109.9268°E, 18.1167°N).
Remotesensing 11 01706 g004
Figure 5. Background profiles of (a) density and (b) buoyancy frequency in June obtained from the monthly WOA13 V2 dataset.
Remotesensing 11 01706 g005
Figure 6. An example plot of the eKdV solitary wave in SAR images for A = 1 , B = 0 , C = 0 ,   γ = 1 , and b = 0.5 .
Remotesensing 11 01706 g006
Figure 7. Curve fittings of the theoretical model (Equation (11)) (the black line) to the pixel observation intensity value (red point) of the soliton   L 1 along transect AA’ in Figure 2a.
Remotesensing 11 01706 g007
Figure 8. Curve fittings of the theoretical model (Equation (24)) (the black line) to the pixel observation intensity value (red point) of the soliton L 1 along transect AA’ in Figure 2a.
Remotesensing 11 01706 g008
Table 1. Technical specifications of the spaceborne SAR data used in the study.
SARAcquisition Time (UTC) and DateImaging ModeResolution (m)Incidence Angle (°)Polarization
TS-X22:32
10 June 2017
ScanSAR3634.59–48.75VV1
GF-322:43
10 June 2017
Standard stripmap815.23–26.57VV-VH1
1 V and H are the vertical and horizontal polarization of the SAR signal, respectively. The first letter denotes polarization of the transmitting signal. The second letter represents polarization of the receiving signal.