Article

Remote Sensing Observation of New Particle Formation Events with a (UV, VIS) Polarization Lidar

CNRS, Institut Lumière Matière, Université Claude Bernard Lyon 1, University of Lyon, F-69622 Villeurbanne, France
*
Author to whom correspondence should be addressed.
Remote Sens. 2019, 11(15), 1761; https://doi.org/10.3390/rs11151761
Submission received: 7 June 2019 / Revised: 23 July 2019 / Accepted: 24 July 2019 / Published: 26 July 2019
(This article belongs to the Section Atmospheric Remote Sensing)

Abstract

:
Observations of new particle formation events in free troposphere are rather seldom and limited in time and space, mainly due to the complexity and the cost of the required on-board instrumentation for airplane field campaigns. In this paper, a calibrated (UV, VIS) polarization elastic lidar (2β + 2δ) is used to remotely sense new particle formation events in the free troposphere in the presence of mineral dust particles. Using very efficient (UV, VIS) light polarization discriminators (1:107) and after robust calibration, the contribution of mineral dust particles to the co-polarized (UV, VIS) lidar channels could be removed, to reveal the backscattering coefficient of the newly nucleated particles after these numerous particles have grown to a size detectable with our lidar. Since our polarization and wavelength cross-talks are fully negligible, the observed variation in the (UV, VIS) particle backscattering time–altitude maps could be related to variations in the particle microphysics. Hence, day and nighttime differences, at low and high dust loadings, were observed in agreement with the observed nucleation process promoted by mineral dust. While light backscattering is more sensitive to small-sized particles at the UV lidar wavelength of 355 nm, such new particle formation events are here for the first time also remotely sensed at the VIS lidar wavelength of 532 nm at which most polarization lidars operate. Moreover, by addressing the (UV, VIS) backscattering Angstrom exponent, we could discuss the particles’ sizes addressed with our (UV, VIS) polarization lidar. As nucleation concerns the lowest modes of the particles’ size distribution, such a methodology may then be applied to reveal the lowest particle sizes that a (UV, VIS) polarization lidar can address, thus improving our understanding of the vertical and temporal extent of nucleation in free troposphere, where measurements are rather seldom.

Graphical Abstract

1. Introduction

As underscored by the latest IPCC report [1], atmospheric aerosols contribute to the Earth’s radiative budget by interacting with solar radiation and participating in the formation of clouds [2,3,4]. Aerosols are mainly formed in the atmosphere by nucleation from low-volatility vapors, forming clusters that then grow to sizes at which they contribute to cloud formation to act on the Earth’s climate. In free troposphere, the dominant source of aerosols is provided by new particle formation (NPF) events [5]. To improve future scenarios of the Earth’s climate, the nucleation process should be fully understood. Hence, over the last 10 years, there has been a growing interest in NPF events identifying the key role played by sulfuric acid in NPF [6], heterogeneous surface photochemistry [7], but also low-volatility vapors [8,9]. The state-of-the-art literature on nucleation [10] shows that NPF is a worldwide phenomenon [10,11,12,13], which varies with altitude, temperature [14], and humidity [15]. However, field observations of NPF in free troposphere [16,17,18,19,20,21,22] require a complex instrumentation, with inherent expensive costs. As underscored by Kumula’s protocol [10], sensitive differential mobility analyzers and mass spectrometers are required to evaluate the number and the nanometer size of the newly-formed particles. As a result, field observations of NPF in free troposphere are rather scarce and restricted to only a few mountain locations [16] or to very interesting but sporadic airplane field campaigns [23], which can hardly provide the spatial and temporal extent of nucleation [24], due to their intrinsics limit duration.
In this context, lidar remote sensing, based on time-resolved detection of laser light elastic backscattering, is really interesting as it is actually the only technique providing continuous vertical profiles of particles’ backscattering as a function of altitude, under in-situ conditions of temperature and humidity [25], which govern the spatial and temporal extension of NPF events. In the literature, several multi-wavelength lidar systems [26,27] have been deployed for aerosol characterization, including mineral dust, that include Raman lidar facilities, even with a water vapor lidar channel [28]. Polarization lidars have been used in addition to optically partition the free troposphere into its spherical and non-spherical particle backscattering components [29] by several groups, including ours [30,31,32,33], who developed a sensitive and accurate (UV, VIS) polarization lidar (2β + 2δ) based on the scattering matrix formalism. Of course, laser light backscattering cannot be used to detect freshly nucleated particles in the nanometer size range, for which Kulmula’s protocol must be used [10]. However, not only the size of the particles plays a role in the lidar backscattering coefficient: The particle number concentration and the wavelength also matter, as demonstrated by the lidar detection of molecular Rayleigh scattering up to the stratosphere, responsible for the blue color of the Earth’s sky. Hence, and as we demonstrated [32], laser light backscattering can be used to remotely trace the subsequent particles’ growth following nucleation, when the number of nucleated particles is high enough to be detectable, as underscored by K. Lehtipalo from the CERN Cloud experiment [34]. In [32], we hence identified the required sensitivity and accuracy, ensuring a lidar backscattering detector was sensitive to the subsequent particles’ growth following nucleation, in the case of NPF events promoted by mineral dust [7]. We showed that for a lidar device to be sensitive to dust NPF events, it should operate in the UV spectral range, with depolarization capabilities, and exhibit a sensitivity similar to ours [30,32]. Such dust NPF events occur around the dust particles’ surface through photochemistry: During daytime, the semi-conductors present in mineral dust act as photo catalysts to produce OH-radicals that oxidize SO2 to form sulfuric acid. A dust NPF event actually occurs only at low dust loadings (at high dust loadings, mineral dust particles, in too high a number, act as a condensation sink preventing NPF observations) and during daytime (during nighttime, photocatalysis is no longer activated).
In [32], however, only a sole NPF event promoted by mineral dust was remotely sensed in free troposphere, and moreover, only the 355 nm lidar wavelength was used. We here report on the observation of several such dust NPF events and analyze the added benefits of using a (UV, VIS) polarization lidar rather than the single UV-wavelength, which broadens the range of applicability of our methodology to the most widely used lidar wavelength (532 nm). As in [32], we focus on dust NPF events [7], since mineral dust mainly contributes to the aerosol load and has been largely studied with lidar remote sensing, with major contributions from [35,36] and our group [33]. Also, lidar remote sensing of other NPF events is a challenging work, far beyond the scope of this paper. The present contribution is structured as follows. Section 2 specifies the sensitivity and the accuracy of our calibrated (UV, VIS) polarization home-built lidar and presents our methodology to identify lidar optical tracers to remotely sense dust NPF events, based on a very efficient (UV, VIS) polarization discriminator (better than 1:107), relying on recent laboratory findings in laser light backscattering by atmospheric aerosols [37]. Section 3 presents time–altitude maps of (UV, VIS) particle backscattering in free troposphere during a Saharan dust outbreak that occurred at Lyon (France). Day and nighttime differences in the retrieved lidar profiles are discussed, at low and high dust loadings, in agreement with the characteristics of such dust NPF events. Moreover, since our wavelength cross-talks are negligible, the observed differences in the UV and VIS lidar profiles reveal the spectral dependence of particles backscattering in the form of so-called backscattering Angstrom exponent ( B A E ), generally considered as a particle size indicator. Vertical profiles of B A E are provided and a discussion is proposed on the ability of this quantity to distinguish the lidar-addressed particles sizes. Statistics of the appearance of such dust NPF events at Lyon are then provided. The proposed methodology, based on a calibrated and highly sensitive (UV, VIS) polarization lidar, may complement the existing methodologies for NPF events observations in free troposphere, where measurements are rather seldom. Moreover, as nucleation involves the lowest particle sizes that a lidar can address, the proposed discussion on the particle sizes addressed by our (UV, VIS) polarization lidar may be beneficial to the whole lidar remote sensing community, to discuss the size addressed by multi-wavelength polarization lidar instruments. The paper ends with a conclusion and proposes future outlooks.

2. (UV, VIS) Polarization Lidar Methodology to Observe NPF Events

Our lidar methodology relies on a robust description of the polarization state of the incident and backscattered radiations, allowing a robust calibration of our (UV, VIS) polarization lidar device. Basically, at altitude z and at lidar wavelength, λ i ( λ U V = 355 nm, λ V I S = 532 nm), the polarization state of the backscattered radiation can be described by its Stokes vector [ S t ], related to the Stokes vector [ S t i ] of the incident laser radiation by the scattering matrix [ F p ( λ i ) ] of the particles (p), such as [ S t ] = [ F p ( λ i ) ] [ S t i ] / z 2 , where [ F p ( λ i ) ] is called the scattering matrix [38]. Interestingly, when particles are in a random orientation, in a specific Lidar backward scattering direction ( θ = 180.0°), [ F p ( λ i ) ] is diagonal and only depends on two scattering matrix elements, namely F 11 , p ( λ i ) and F 22 , p ( λ i ) , which depend on the particles’ size, shape, and chemical composition [38]. Readers interested in the distribution of random orientations may refer to [38] as recognized reference literature. The ratio of F 11 , p ( λ i ) and F 22 , p ( λ i ) determines the so-called lidar linear particles depolarization ratio at wavelength λ i :
δ p ( λ i ) = [ 1 f 22 , p ( λ i ) ] [ 1 + f 22 , p ( λ i ) ] .
Hence, spherical particles, for which f 22 , p ( λ i ) = F 22 , p ( λ i ) / F 11 , p ( λ i ) = 1 , do not depolarize laser light. As a result, the polarization can be used as a shape indicator as any deviation from isotropy can be detected from non-zero depolarization.

2.1. Lyon (UV, VIS) Polarization Lidar Experiment

Our home-built lidar instrument, which operates at the UV and VIS wavelength ( λ U V = 355 nm and λ V I S = 532 nm), is based on a unique laboratory polarimeter implemented as our lidar detector, allowing for the first time laser light scattering to be investigated in the laboratory for particles in ambient air at a specific lidar π-angle (180.0 ± 0.2°) [37,39]. This laboratory approach is necessary as manufacturers generally specify the optical components for unpolarized continuous white light while our concern is relative to polarized pulsed laser light. Also, scattering at a specific backscattering angle may strongly differ from scattering at angles approaching the Lidar π-angle, as we recently demonstrated [40]. This laboratory polarimeter is extremely sensitive (polarization discriminator better than 1:107) and wavelengths’ cross-talk between the UV and VIS lidar detectors are also insignificant (OD > 5 rejection rate). By implementing this (UV, VIS) laboratory Pi-polarimeter on our lidar station, potential biases in the lidar detector were hence minimized. As a result, the contribution to light backscattering from highly irregularly shaped particles, such as mineral dust particles, can be efficiently removed, leading to unequivocal time–altitude maps of spherical particle backscattering. To give an idea on the achieved sensitivity and accuracy, particle depolarization ratios from 0.4% (close to molecular depolarization) up to 40% (for volcanic ash [41]) were evaluated, and high contrast time–altitude maps of (UV, VIS) particle backscattering and depolarization have hence been reported [30,32,41], even in the UV spectral range where molecular scattering is strong.

2.1.1. Calibration of the (UV, VIS) Polarization Lidar Detector

Since our wavelength and polarization cross-talks are negligible, a robust calibration of the (UV, VIS) polarization lidar experiment can be performed to accurately evaluate particle backscattering coefficients. This calibration consists in evaluating the electro-optics gain calibration constant, G ( λ i ) [30], of the lidar detector at the UV and VIS wavelengths. Existing calibration methods rely on a molecular atmosphere [42], which does not rigorously exist, or on the ± 45° methodology [43]. Our methodology is illustrated Figure 1a. In a few words, to gain in accuracy, our calibration procedure relies on 12-points statistics, performed at angles at which the photomultiplier tubes do not saturate. More precisely, a precise evaluation of G ( λ i ) is achieved by adjusting the variations of the measured atmospheric depolarization, δ * ( λ i ) , with the angle, φ , between the laser linear polarization and the fast axis of a half-wavelength plate (HWP), inserted on the optical pathway from the laser to the atmosphere. At wavelength λ i , the measured atmospheric depolarization, δ * , relates to the depolarization, δ , of the atmosphere as follows:
δ * ( λ i ) = G ( λ i ) 1 + δ ( λ i ) ( 1 δ ( λ i ) ) cos ( 4 φ ) 1 + δ ( λ i ) + ( 1 δ ( λ i ) ) cos ( 4 φ ) .
As a novelty, we demonstrate Equation (2) in the framework of the scattering matrix formalism. The starting point is the detected lidar intensity on each π = ( p , s ) polarization channel:
I π ( λ i ) = η π ( λ i ) P 0 ( λ i ) z 2 ( P j ) [ P B C ] [ F ( λ i ) ] [ H W P ] [ S t i ] ,
where P 0 ( λ i ) is the laser power density at wavelength λ i and ( P j ) = (1, 0, 0, 0) is a projection unitary raw vector. η π ( λ i ) is the optoelectronics constant of the π -polarization channel (defined with respect to the incident laser polarization) and the gain-optics calibration constant, G ( λ i ) , relates to this quantity as follows: G ( λ i ) = η s ( λ i ) / η p ( λ i ) . In Equation (3), [ P B C ] and [ H W P ] are the Mueller matrices of the polarizing beam-splitter cube (PBC) and the HWP, respectively, as provided in polarization textbooks [44]. Equation (2), providing the measured depolarization, δ * ( λ i ) = I s ( λ i ) / I p ( λ i ) , is then retrieved by noting that ( S t i ) = [ 1 , 1 , 0 , 0 ] T and using Equation (1) to replace f 22 ( λ i ) as a function of δ ( λ i ) . As a result, the calibration constant, G ( λ i ) , at wavelength λ i can be evaluated with a 2% accuracy by adjusting the φ variations of δ * ( λ i ) from Equation (2), as illustrated in Figure 1 (left) at both UV and VIS wavelengths.

2.1.2. Sensitivity to Particle Backscattering

Molecular backscattering may overcome particle backscattering, especially in the UV spectral range where molecular scattering is strong. Figure 1b displays the spectral dependence of the molecular backscattering cross-section, numerically simulated by including elastic Cabannes scattering (where no change is induced in the rotational and vibrational states of the molecules) and inelastic Raman rotational sidebands (originating from molecular anisotropy), as underscored by Bucholtz [45]. To increase our sensitivity to particle backscattering compared with molecular backscattering, very selective interference filters (Δλ = 0.3 nm) were used to spectrally bound Rayleigh molecular backscattering down to Cabannes backscattering. Following [42], the molecular depolarization, δ m , λ , at wavelength λ is then determined by integration over the filter bandwidth ( δ m ( λ U V ) = 0.37 % and δ m ( λ V I S ) = 0.36%). Of course, the sky background is then also minimized.

2.1.3. Retrieving (UV, VIS) Vertical Profiles of Polarization-Resolved Particle Backscattering

As extensively detailed in our previous publications [30,46], vertical profiles of particle backscattering coefficients, β p , / / and β p , (defined with respect to the laser linear polarization), can be determined at wavelength λ i from the lidar raw data as follows:
β p , / / = ( R / / 1 ) × β m , / / , β p , = ( R / / δ δ m ) × β m , / / ,
where the dependence with lidar wavelength λ i has been omitted to aid the reading and the vertical profile of βm,// is computed from reanalysis model of the European Centre for Medium-Range Weather Forecasts (ECMWF). For the sake of completeness, we recall that the atmospheric depolarization is linked to the particles depolarization, δ p , and the molecular depolarization, δ m , by the following relationship: δ = ( 1 1 / R / / ) δ p + δ m / R / / [30]. R / / = 1 + β p , / / / β m , / / . The contrast of molecular-to-particle backscattering can be determined by applying Klett’s algorithm [47] to correct for particle extinction. For that, a pre-defined value of the extinction-to-backscatter ratio or lidar ratio, S, is required. The lidar ratio of mineral dust particles depends on the dust particles’ size and shape, as shown by our Discrete Dipole Approximation and T-matrix numerical simulations [33]. In the field, Müller et al. [26] and Veselovskii et al. [48] showed that multi-wavelength Raman lidar measurements are useful for precise determinations of lidar ratios of particle mixtures involving mineral dust. In the absence of such multi-wavelength Raman lidar measurements, we used the lidar ratios, SUV = (68 ± 10) sr and SVIS = (55 ± 10) sr, measured by [48] at a few hundred kilometres from Lyon as a reference literature. The lidar ratio is hence identical to that considered in our original work [32], which was, however, dedicated to the sole UV-lidar wavelength. We accounted for potential variation in the lidar ratios by considering a 10 sr error bar at each wavelength. The corresponding error bar on the vertical profiles of β p , / / and β p , displayed in Figures 6 and 7 was calculated by considering the maximum difference obtained when using the minimum and maximum values of the lidar ratio.

2.1.4. (UV, VIS) Lidar Particle Backscattering during NPF Events

For the sake of clarity, we here recall the methodology developed in [32] to remotely sense dust NPF events, based on a sensitive UV-polarization lidar. Polarimetry is used as it acts as a very efficient shape discriminator (1:107, Pi-polarimeter, [37]), allowing unequivocal removal of the contribution of mineral dust to particle backscattering, whatever the dust particles’ sizes, either small or not. Hence, the backscattering coefficient, β s , of spherical (s) particles is accurately evaluated. Operating this polarization lidar at 355 nm then acts as a particle size discriminator as backscattering is more sensitive to smaller particles in the UV spectral range. Hence, at the lidar UV wavelength, very small particles, for sizes in the tens of nanometer range, strongly contribute to β s . As a result [32], the subsequent particle growth following nucleation can be remotely sensed in free troposphere by following the lidar backscattering coefficient, β s , of spherical particles. More precisely, the appearance of a dust NPF event can be remotely sensed by analyzing the backscattering coefficient, β s , of spherical particles, in regards to the β d of mineral dust (d) particles. Indeed, as explained in the introduction, dust NPF events only occur at low dust loadings: Increased β s values, relating the subsequent particle growth following nucleation, must then be correlated with decreasing β d values. The lower β d is, the higher β s is. Moreover, in a dust NPF event occurring only during daytime [7], increasing β s values are no longer associated with decreasing β d values during nighttime. To summarize, and as we published in Figure 5B of [7], a clear lidar signature of the appearance of a dust NPF event is provided by representing the particles backscattering coefficient, β s , as a function of β d over a range of considered lidar altitudes: If a dust NPF event occurs at these altitudes, within our error bars, the scatter plot, β s = f ( β d ) , should exhibit a negative slope during daytime, since the lower β d is, the higher β s is. In contrast, during nighttime, the same scatter plot should then exhibit, within our error bars, a positive slope over the range of considered altitudes. Examples of lidar scatter plots, β s = f ( β d ) , are presented in Section 4.1. Practically speaking, β s and β d can be accurately determined at UV and VIS wavelengths by optically partitioning the atmospheric particle mixture, ( p ) = { s , d } , into its s and d backscattering components [29,31,33]:
β s = β s , / / = β p , / / β d , / / = β p , / / β p , / δ d , β d = β d , / / + β d , = β d , ( 1 + 1 / δ d ) = β p , ( 1 + 1 / δ d ) ,
where δ d = β d , / β d , / / is the dust particles’ depolarization ratio that can be retrieved from laboratory measurements [37] and the dependence with the lidar wavelength, λ i , has been omitted to ease the reading. Time–altitude maps of β s and β d are presented in Section 3.2.

2.2. Lidar Backscattering Angstrom Exponent ( B A E ) during an NPF Event

Using the VIS wavelength allows the spectral dependence of the lidar backscattering coefficient, β s , to be addressed in the form of the corresponding backscattering Angstrom exponent:
B A E = L n [ β s ( λ U V ) / β s ( λ V I S ) ] / L n [ λ V I S / λ U V ] .
Following Equation (6), B A E is an intensive quantity and positive B A E values are related to higher particles backscattering at the UV than at the VIS lidar wavelength. B A E was first introduced by Sasano and Browell [49] a few decades ago, leading to the general conclusion that B A E values are often considered as size indicators [50] since the higher BAE is, the smaller the particles are. High B A E values are hence expected during an NPF event. Figure 2 (left) represents an example of particle size distribution observed during a dust NPF event after condensational growth. From this size distribution, we applied the Mie theory to compute the variations of B A E displayed in Figure 2 (right) with the maximal diameter, D M , involved in the lidar backscattering coefficient, β s (i.e., the upper bound of the integral defining β s ). More precisely, BAE was evaluated as a function of D M by considering Equation (6) and the definition of the particle backscattering coefficient (see Equation (1) of [32]):
β p ( λ i ) = 0 D M ( d σ d Ω ) p ( D p , λ i ) × n p ( D p ) d D p .
To achieve this computation, we considered the complex refractive index of sulfuric acid and its wavelength dependence [51], as sulfuric acid is the main driver for atmospheric nucleation in dust NPF events [7]. Though the curve is not monotonic, it is clear that B A E values beyond 2.0 correspond to particles with sizes below 200 nm. Moreover, B A E values reaching 3.5 correspond to smaller particles, with sizes up to 130 nm. Therefore, the particles sizes that our (UV, VIS) polarization lidar can address during such NPF events can be better circumvented by precise evaluations of B A E , as detailed in Section 4.2.

3. (UV, VIS) Lidar Remote Sensing Observations of NPF Events in Free Troposphere

In this section, time–altitude maps of s and d particles’ backscattering are retrieved in the free troposphere of Lyon (France) during a Saharan dust outbreak which occurred on 2 to 3 July 2015, taken as a case study. Special emphasis is set on highlighting differences in particle backscattering during day to nighttime or/and under low to high dust loadings, to reveal an optical pathway towards lidar remote sensing detection of dust NPF events.

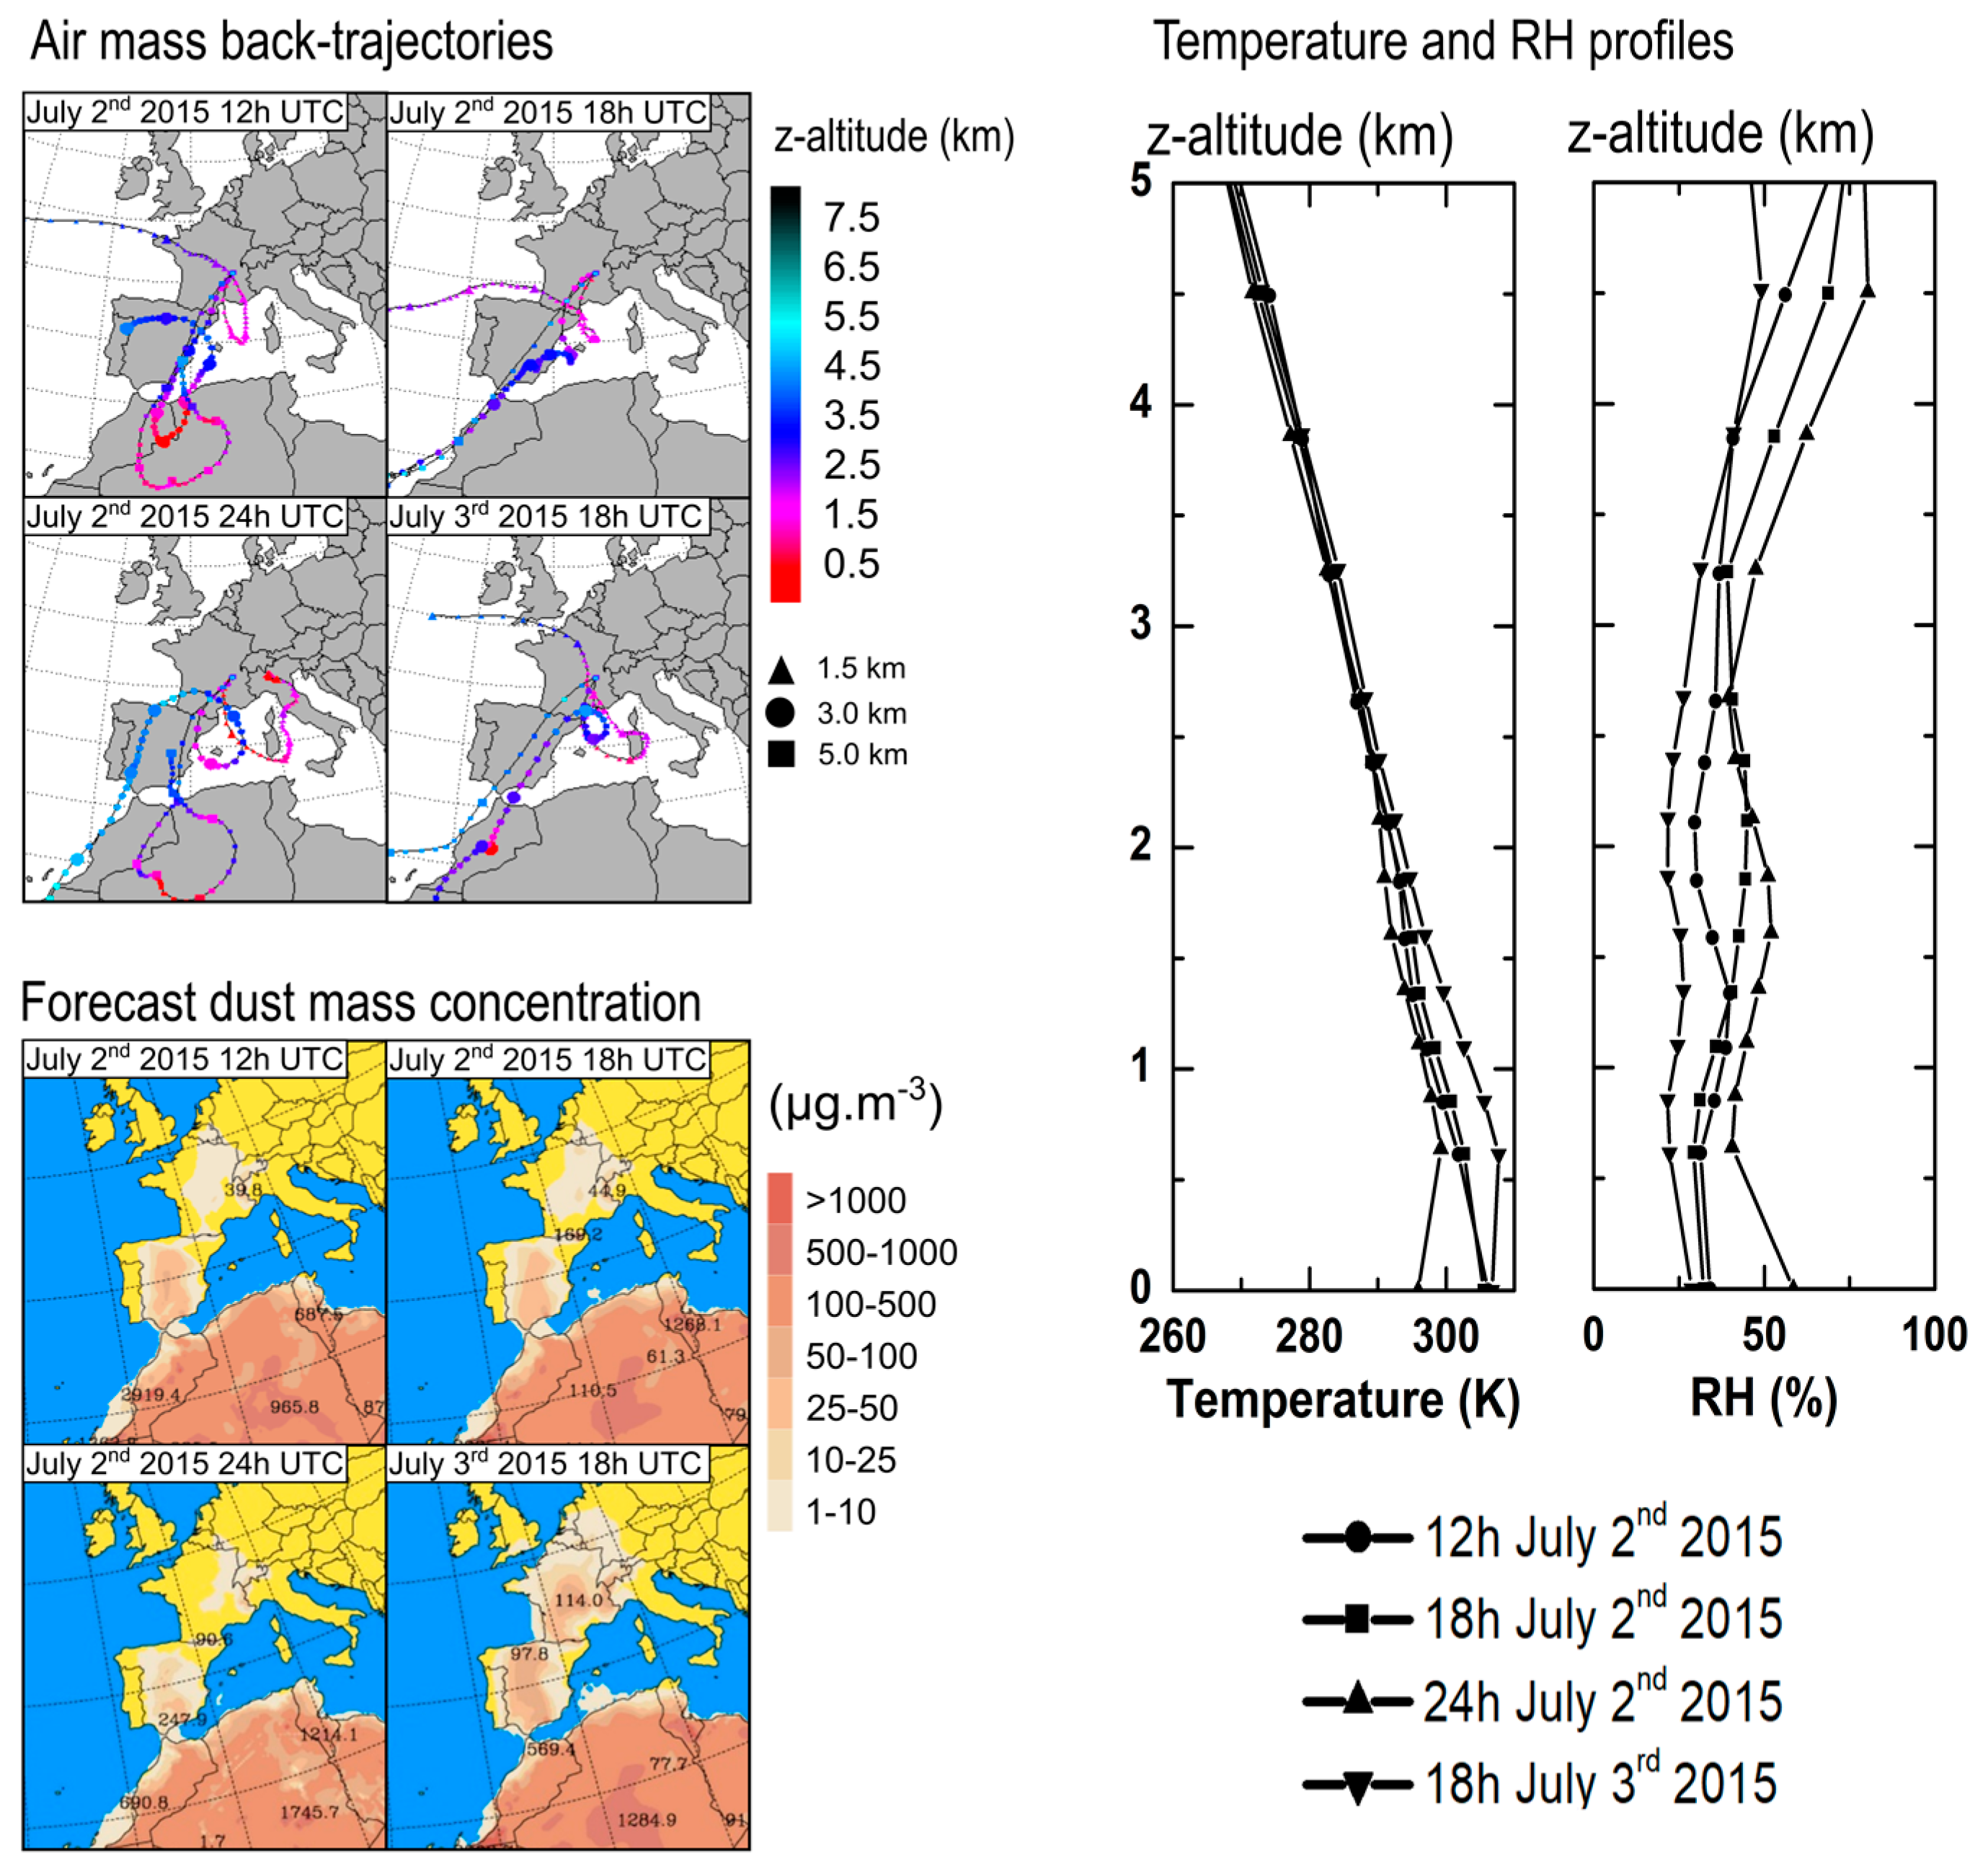
3.1. Meteorological Situation

The corresponding seven-day air mass backtrajectories observed at Lyon [52] are displayed in Figure 3, together with forecast dust mass concentrations over Europe [53] and vertical profiles of the temperature and relative humidity on 2 July 2015 at 12:00h, 18:00h, and 24:00h UTC and the day after at 18:00h UTC. At all these dates, a temperature inversion is observed at around a 2 km altitude and the backtrajectories confirm the Saharan dust origin of the air masses passing above the lidar station above the 2 km altitude. On 2 July 2015, the Saharan dust origin of the air masses passing above Lyon lidar station is confirmed above the 3 km altitude at 12:00h UTC (daytime), then at a higher altitude, around a 5 km altitude, at 24:00h UTC (nighttime), as shown by the corresponding backtrajectories falling near ground level in the Saharan dust source region. The dust mass concentrations are in the range of 10 µg.m−3, hereafter referred to as the low dust loading scenario, in contrast to 3 July 2015, where the dust loading is 10 times higher (around 110 µg.m−3), hereafter referred to as the high dust loading scenario. On 3 July at 18:00h UTC, the dust origin of the air masses above our lidar station is confirmed at 18:00h UTC around a 3 km altitude. In all dust scenarios, the relative humidity is sufficient (mostly above 40% above a 2 km altitude) to allow the appearance of dust NPF events [7].

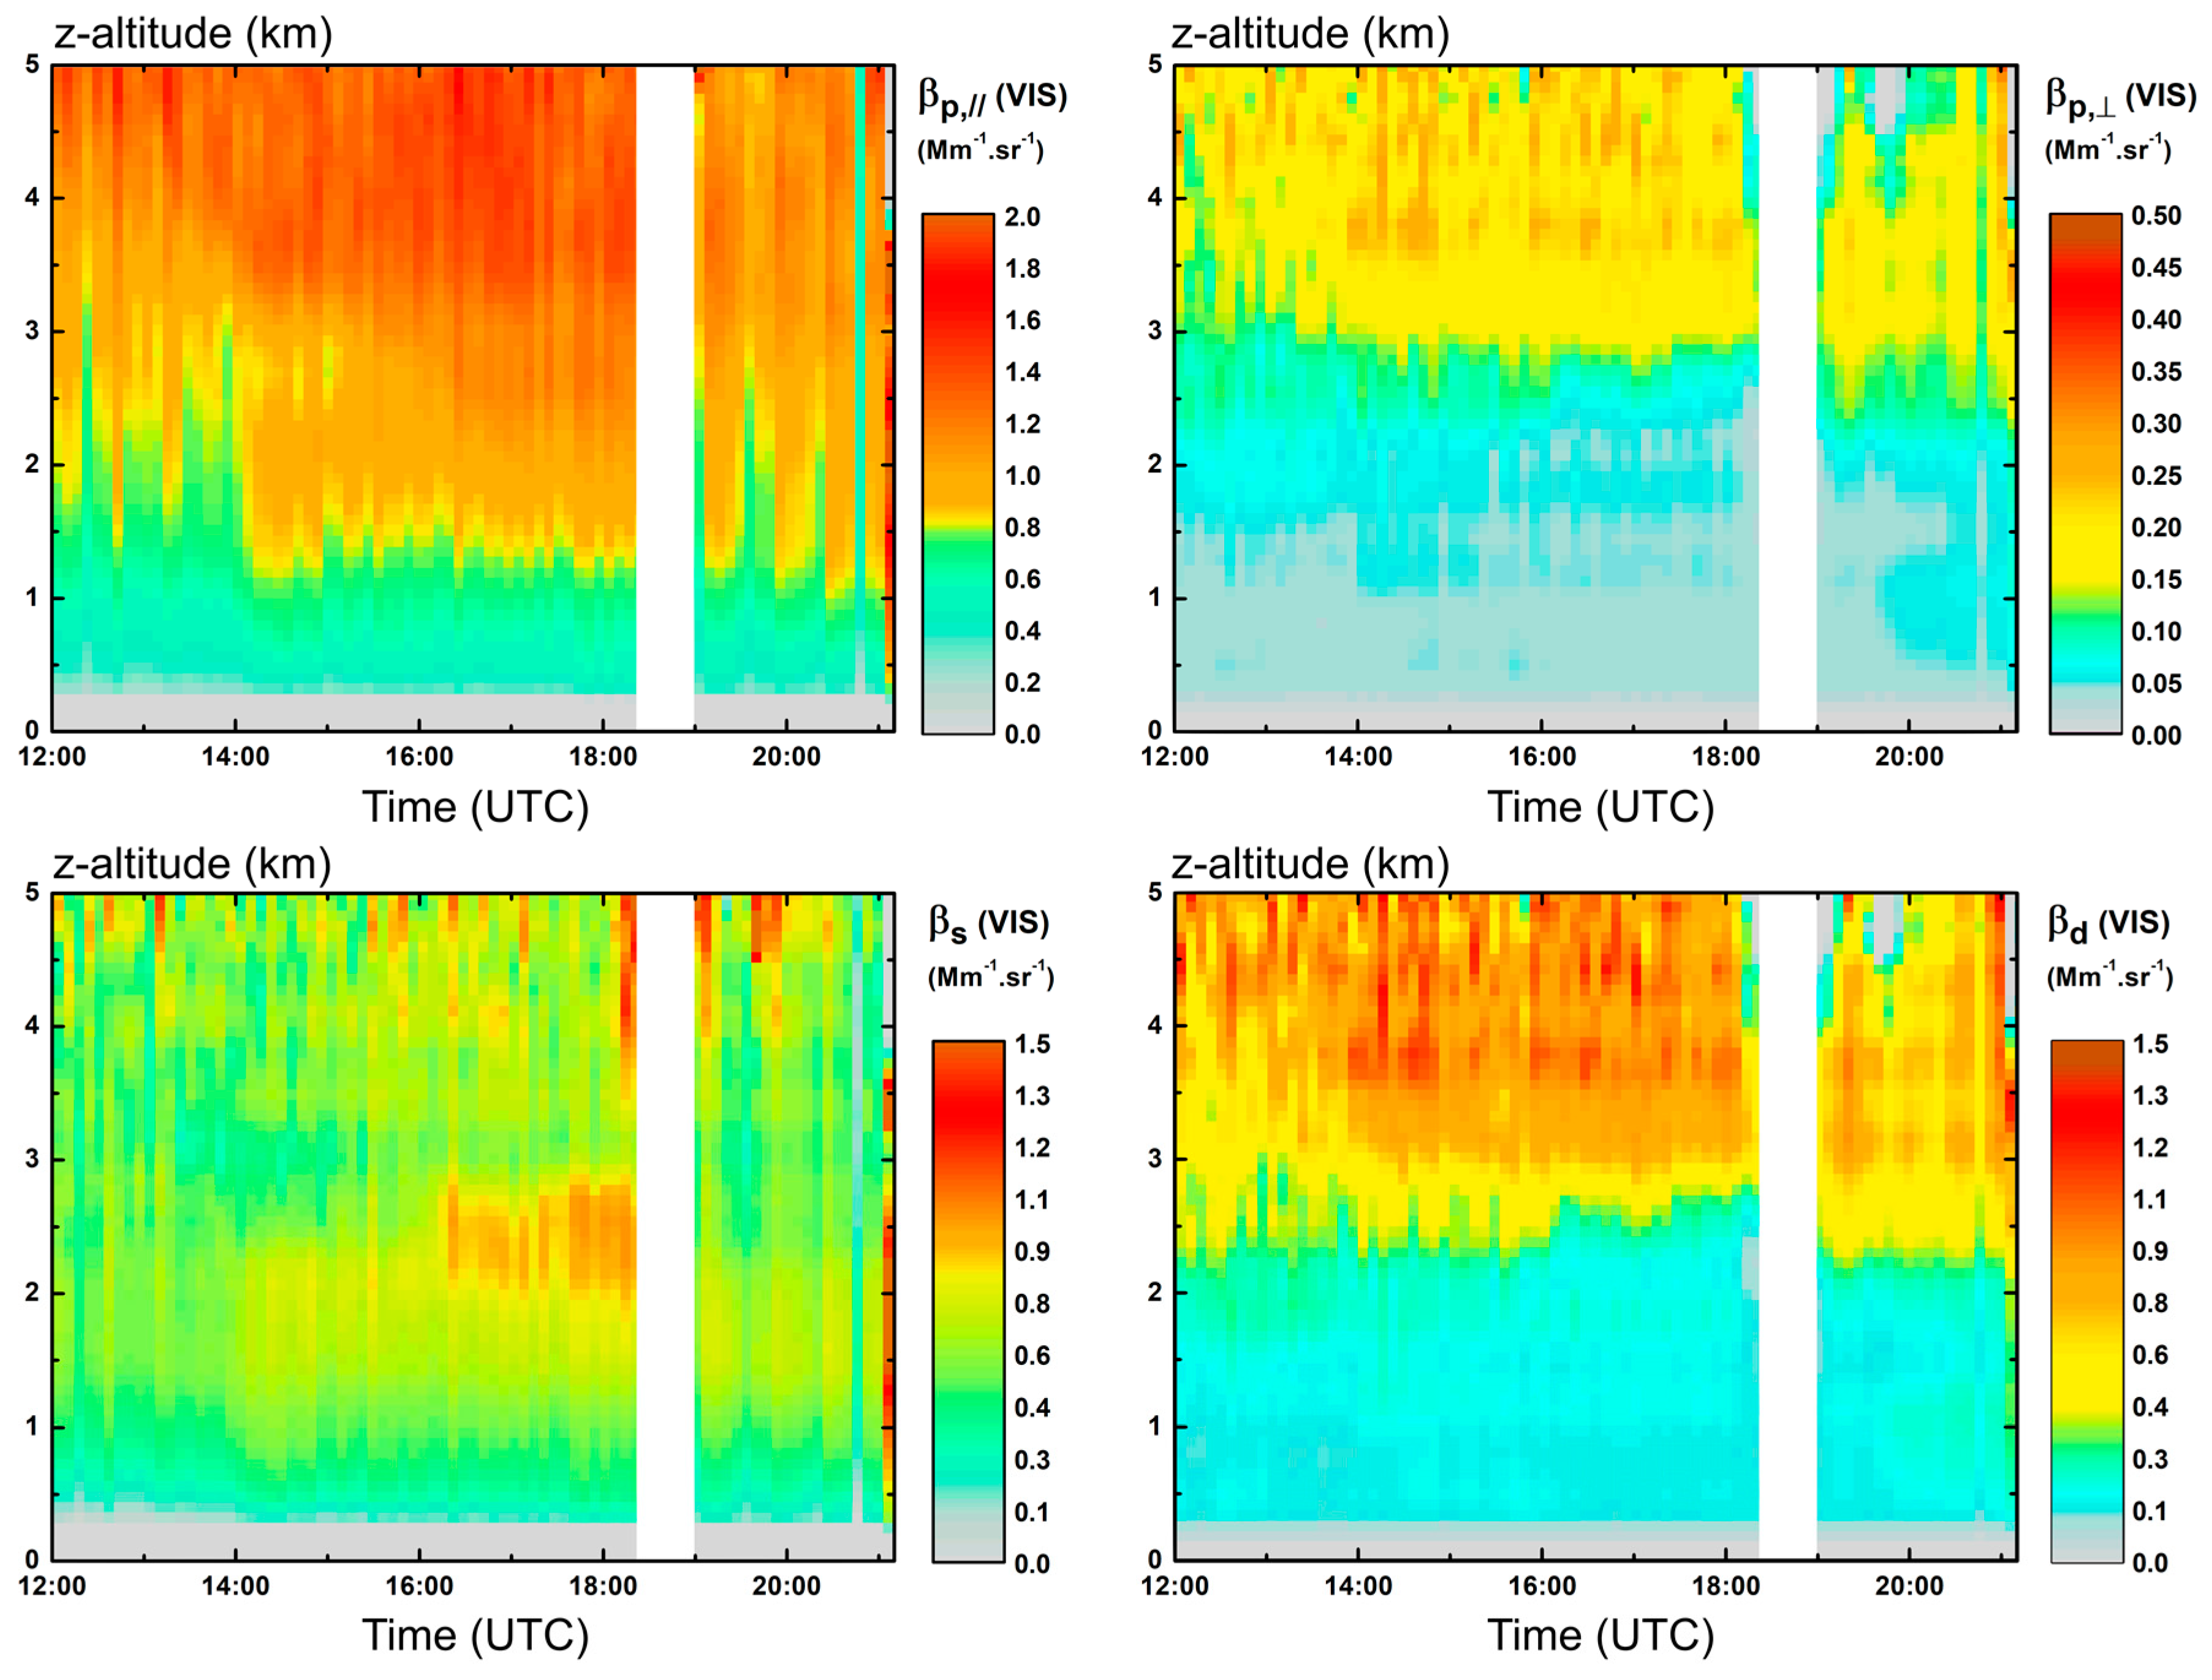
3.2. (UV, VIS) Lidar Time–Altitude Maps of Particle Backscattering

Following the methodology developed in Section 2, (UV, VIS) lidar time–altitude maps of particle backscattering on 2 July 2015 are displayed in Figure 4 and Figure 5. Figure 4 is dedicated to lidar wavelength λ U V while Figure 5 is its analogous at wavelength λ V I S . In each figure, from left to right, lidar time–altitude maps are plotted of co- (//) and cross-polarized ( ) particle backscattering coefficients, β p , / / and β p , , as derived from Equations (4), then β s and β d , by applying Equation (5), using 35.5% for the dust depolarization at wavelength λ U V (30.5% at wavelength λ V I S ), as measured in [37]. The β s and β d time–altitude maps are interesting as they reveal the specific scattering behavior of s and d particles. Of particular interest is the β s time–altitude map, which differs from that of β p , / / , as nonspherical mineral dust particles not only contribute to the cross-polarized particles backscattering coefficient, β p , , but also to β p , / / , as mathematically stated by Equation (5a). Let us focus on the time–altitude maps of β s and β d displayed in Figure 4, dedicated to wavelength λ U V . As expected from the backtrajectories’ analysis, dust particles are present above the 2 km altitude. The sensitivity of our polarization lidar reveals that the highest β d values are observed at the highest altitudes. Moreover, from around 14:00h UTC and during the afternoon, the lowest β d values (at around a 3 km altitude and below) are correlated with a clear enhancement in the observed β s values, viewed as brownish colors in the β s time–altitude map between 2 and 3 km. Interestingly, such a behavior does not occur during nighttime. The same conclusions can be drawn in Figure 5 dedicated to wavelength λ V I S , with, however, an apparently reduced sensitivity (to be discussed in Section 4.1). To be more quantitative, we analyzed the vertical profiles of particle backscattering at 14:00h and 21:00h UTC, as case studies.

3.3. (UV, VIS) Lidar Profiles of Particle Backscattering under Low Dust Loadings

To display the sensitivity of our (UV, VIS) polarization lidar to dust NPF events, vertical profiles of particle backscattering are displayed in Figure 6 at low dust loadings (2 July 2015), under day (14:00h UTC, upper panel) and nighttime conditions (21:00h UTC, lower panel). The vertical profiles are restricted to free tropospheric altitudes, above 2 km, at which the temperature inversion occurs. This meteorological approach is here sufficient since our paper is dedicated to the development of a remote sensing methodology to study nucleation in free troposphere and its application to case studies. Determining planetary boundary layer (PBL) heights would, however, be essential for systematic studies, performed over large time scales for geophysical purposes. For that, Klett’s algorithm should be applied by using a different lidar ratio in the PBL. In both panels, the sensitivity and the accuracy of our lidar measurements are featured in the displayed vertical profiles of β p , / / and β p , , which were deduced from the lidar raw data. In particular, the β p , profile reveals the vertical layering of light backscattering by nonspherical mineral dust particles as a function of the lidar wavelength (see left panels for λ U V , right panels for λ V I S ) . The variations of β p , / / as a function of the altitude and wavelength are likewise interesting since β p , / / is a key quantity to retrieve the β s vertical profile (see Equation (5a)). Differences are observed in the β p , / / vertical profiles at wavelengths λ U V and λ V I S and this spectral dependence modifies B A E , as discussed in Section 4.2. We now focus on wavelength λ U V and discuss day and nighttime differences in the vertical profiles of β s and β d . During the daytime (14:00h UTC), within our error bars, the lower β d is, the higher β s is. This is especially true between 2 and 3.5 km, but also at higher altitudes, with, however, a less pronounced magnitude since β d is higher and hence β s is lower. At such altitudes, increasing β s values are correlated with decreasing β d values. During nighttime, however (21:00h UTC), at altitudes where the dust cloud is present, increasing (decreasing) β s values are no longer related with decreasing (increasing) β d values. Interestingly, within our error bars, similar differences in the scattering behavior under day/nighttime conditions are observed at wavelength λ V I S .

3.4. (UV, VIS) Lidar Profiles of Particle Backscattering under High Dust Loadings

Figure 7 is the analog of Figure 6 under high dust loading conditions (10 times higher dust mass concentrations), which occurred at Lyon on 3 July 2015 at 16:00h UTC. Figure 7 shows that in contrast to the low dust loading scenario, even during daytime hours (16:00h UTC), increasing β s values are no longer related with decreasing β d values at altitudes where the dust cloud is present. Interestingly, a similar difference is observed in the scattering behavior at low/high dust loadings at wavelength λ V I S .

4. Interpretation of the Lidar Profiles in Terms of NPF Events

In this section, the above lidar profiles are interpreted by highlighting the optical signatures of NPF events promoted by mineral dust. For that, lidar scatter plots, β s = f ( β d ) , and B A E vertical profiles are displayed and analyzed during the day and nighttime. The discussion is then extended to several such NPF events, leading to the conclusion that our lidar methodology is sensitive and robust.

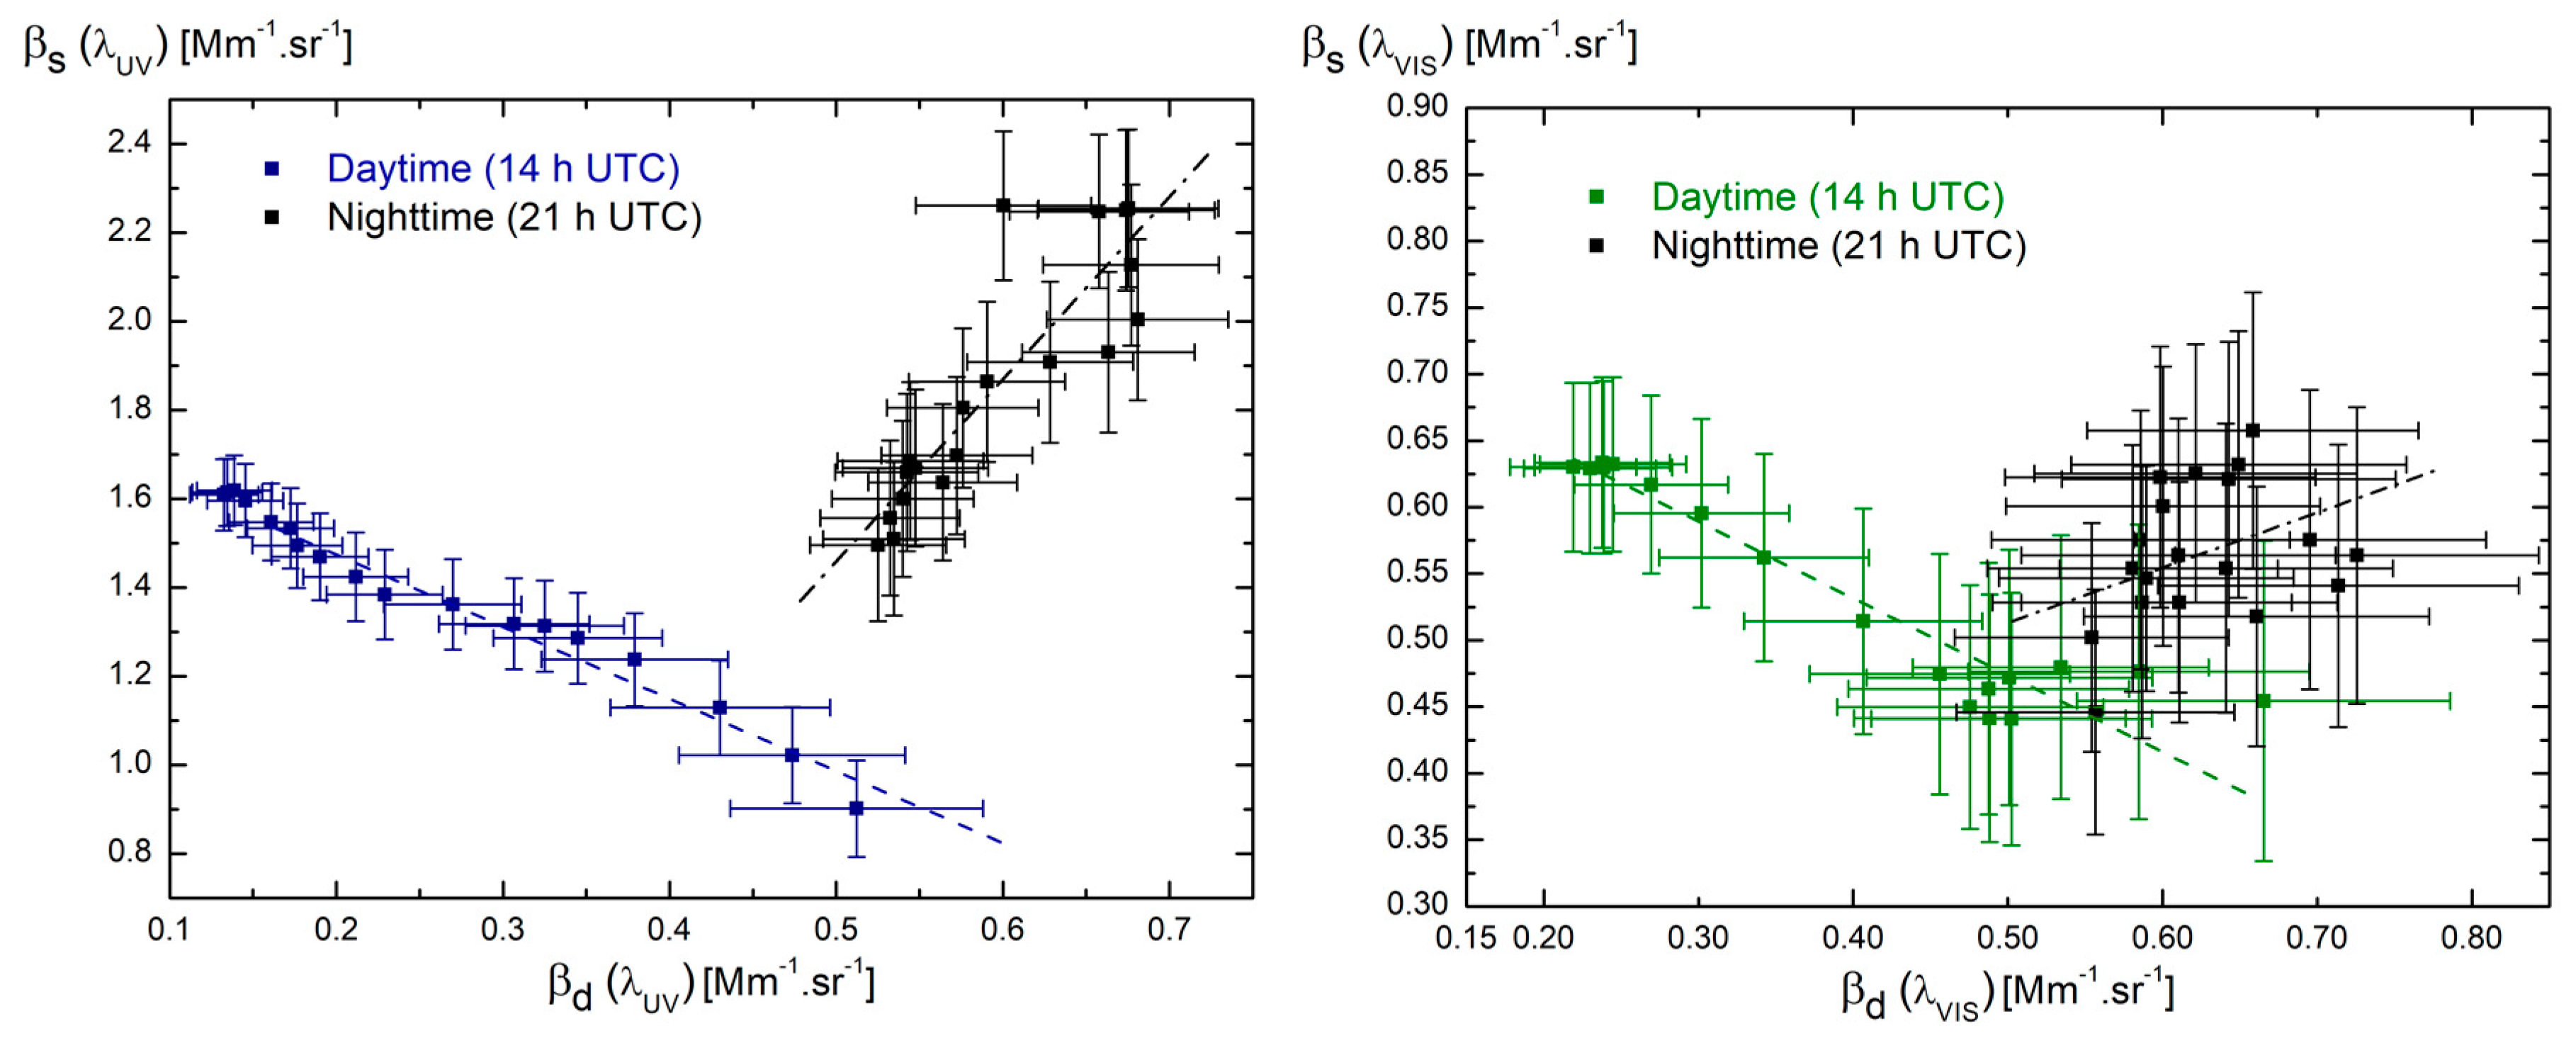
4.1. Lidar Scatter Plot

The observed variations between the day and nighttime vertical profiles of β s and β d in Figure 6 can be interpreted as due to variations in the underlying physical chemistry occurring in the free troposphere. Indeed, the variations in the β s and β d vertical profiles cannot be related to systematic errors in our polarization lidar experiment, because our polarization cross-talks are fully negligible (see Section 2.1). To put light on the underlying physical chemistry and interpret the retrieved lidar profiles of β s and β d , we plotted in Figure 8 the scatter plot, β s = f ( β d ) , at wavelengths λ U V and λ V I S at altitudes where the dust cloud is present, under the low dust loading scenario corresponding to Figure 6. Let us first focus on the left scatter plot corresponding to wavelength λ U V . Within our error bars, the slope of β s = f ( β d ) is negative and equal to 1.62 ± 0.06 at daytime hours (14:00h UTC), in contrast to nighttime hours (21:00h UTC), where the slope is positive and equal to 4.11 ± 0.55. It is hence only during daytime that increasing values of β s can be related to decreasing values of β d . Besides, following Figure 7, which is dedicated to the high dust loading scenario, the slope of the scatter plot, β s = f ( β d ) , is only negative at low dust loadings. As a result, it is only during daytime and at low dust loadings that the slope of the scatter plot, β s = f ( β d ) , is negative. These features are in agreement with the state-of-the-art literature on dust NPF events and the laboratory findings by [7]. As we discussed in [32], actually, the state-of-the-art literature does not provide any possible other explanation. Indeed, when nucleation promoted by mineral dust occurs, the subsequent particle growth following nucleation results in increasing values of β s and laboratory findings [7] show that the nucleation growth rate is greater when the number of dust particles is lower, i.e. when β d is low. In short, and as observed in the lidar-retrieved scatter plot, the lower β d is, the higher β s is and this occurs during daytime and at low dust loadings. In [32], such a lidar observation had only been carried out on a single Saharan dust episode (Lyon, July 2010) and at the sole wavelength of λ U V . Here, the Saharan dust episode is different, but the lidar observations exhibit the same features, leading to the conclusion that our (UV, VIS) polarization lidar exhibits sufficient robustness to reveal this underlying physical chemistry [7]. Moreover, for the first time, the same features are observed at wavelength λ V I S (right graph): The slope of β s = f ( β d ) is negative and equal to 0.58 ± 0.04 under daytime conditions and positive and equal to 0.41 ± 0.25 under nighttime conditions, as for wavelength λ U V . However, the slope at wavelength λ V I S is more than 2.5 smaller than that observed at wavelength λ U V . This difference is nonetheless consistent with the increased sensitivity of light backscattering to smaller particles at lower wavelengths. Morover, this 2.5 factor agrees with the numerical simulation that we performed in Figure 2 of [32]. To our knowledge, it is the first time that such dust NPF events are observed at wavelength λ V I S , which is the most widely used lidar wavelength.

4.2. Backscattering Angstrom Exponent during NPF Events

As a second point, we display in Figure 9 the variations of B A E with altitude by using Equation (6) and the vertical profiles of β s , under the low dust loading scenario (Figure 6, during daytime). For the sake of clarity, we recal in Figure 9 the β s vertical profiles at wavelengths λ U V and λ V I S as presented in Figure 6. Interestingly, our vertical profiles of B A E exhibit a high sensitivity, with B A E values varying from near 1 up to 3.5 at altitudes where the dust cloud is present. Since our wavelength cross-talks are fully negligible (see Section 2.1), the observed B A E variations cannot be related with systematic errors in our (UV, VIS) polarization lidar and can hence be considered as due to variations in the particle microphysics in the free troposphere. More precisely, following the discussion set in Section 2.2, the observed B A E variations can be related to the particle sizes addressed by our (UV, VIS) polarization lidar. The observed layers at 3 and 4.5 km in the daytime B A E vertical profile, corresponding to a B A E around 2, are hence related to a maximal diameter of the particle size distribution in the range of 200 nm. The 21:00h UTC vertical profile is also interesting to study. Interestingly, B A E increases with altitude to reach more than 3.5 at the 5 km altitude where the dust cloud is present. Following Section 2.2, this value of 3.5 for B A E can be related to a maximal diameter of the particle size distribution of 130 nm, which then appears as our observed lowest lidar-detected size. Indeed, it is not surprising that a (UV, VIS) polarization lidar cannot address lower sizes and in particular the newly-formed particles as their size is too low to provide a detectable backscattering intensity. However, for the first time to our knowledge, the retrieved B A E values allow better circumvention of the particle sizes a (UV, VIS) polarization lidar is sensitive to. Other lidars, if they exhibit the same sensitivity and accuracy, will arrive to the same conclusions.

4.3. Statistics of Appearance of such NPF Events in Free Troposphere

In all observed Saharan dust NPF events at Lyon, the threshold for lidar observation of this phenomenon, defined through the spherical backscattering coefficient, was in the range 0.7 to 0.8 Mm−1.sr−1. To our knowledge, it is the first time that such a general feature is provided for the appearance of such NPF events promoted by mineral dust, while such measurements are rather seldom in the free troposphere.

5. Conclusions

This paper analyzed the application of the lidar remote sensing technique to reveal the vertical and temporal extent of nucleation, the process by which most particles are formed in the free troposphere. Observations of this process in the free troposphere are indeed rather scarce, as they require a complex and expensive instrumentation. This topic is nevertheless important to study and investigate the altitude at which cloud formation occurs. We here propose (UV, VIS) lidar remote sensing observations of NPF events promoted by mineral dust in the free troposphere in the form of time–altitudes maps of particle backscattering, providing the vertical and temporal extent of NPF. To our knowledge, it is the first time that such remote observations of an NPF-event have been performed at the VIS wavelength, at which most polarization lidars operate. Indeed, since our polarization and wavelength cross-talks were negligible, every observed variation in the (UV, VIS) time–altitude maps of particle backscattering could be related to variations in the particles microphysics, thus revealing the underlying microphysics and chemistry of such dust nucleation events through observed differences in particle backscattering during day/nighttime, at low/high dust loadings. For that, a calibrated (UV, VIS) polarization lidar exhibiting a sensitivity similar to ours should be used. In short, our (UV, VIS) polarization lidar detector is based on a unique laboratory experiment addressing laser light backscattering in the specific lidar backward scattering direction [37]. This laboratory approach is required as manufacturers’ specifications are given for continuous unpolarized white light while our concern in polarization lidar is relative to pulsed monochromatic polarized light. Moreover, we then addressed the (UV, VIS) spectral dependence of the backscattering coefficient to distinguish the lidar-addressed particle sizes, by quantitatively evaluating the corresponding backscattering Angstrom exponent. We could then specify the lowest detected particle diameters, in the range of 130 nm, that our (UV, VIS) polarization lidar could address during such NPF events. The outlooks of this work are numerous. To give an example, the lidar-addressed particle sizes could be confronted with the sizes provided by particle sizers as used during air field campaigns [21,22], which is, however, far beyond the scope of this paper. Also, potential benefits of adding the IR wavelength could be studied in a similar way. Still, lots of work is to be done before remote detection of nucleation events is possible in general. This task is challenging, but it is clear that laboratory, numerical, and field developments are probably required. We hope that this paper will contribute to these future developments.

Author Contributions

Formal analysis, D.C. and T.M.; Investigation, A.M.; Methodology, A.M.; Project administration, A.M. and P.R.; Software, D.C. and T.M.; Supervision, A.M. and P.R.; Validation, A.M.; Visualization, D.C.; Writing—original draft, A.M.; Writing—review & editing, D.C. and P.R.

Funding

This research was funded by CNRS and Lyon University.

Acknowledgments

We acknowledge J-F Sivignon from ILM for his technical support.

Conflicts of Interest

The authors declare no conflict of interest.

References

  1. IPCC. Climate change 2013: The physical science basis. In Working Group I contribution to the Fifth Assessment Report of the Intergovernmental Panel on Climate Change; Stocker, T., Ed.; IPCC: Geneva, Switzerland, 2013. [Google Scholar]
  2. Lolli, S.; Campbell, J.R.; Lewis, J.R.; Gu, Y.; Marquis, J.W.; Chew, B.N.; Liew, S.C.; Salinas, S.V.; Welton, E.J. Daytime Top-of-the-Atmosphere Cirrus Cloud Radiative Forcing Properties at Singapore. J. Appl. Meteorol. Climatol. 2017, 56, 1249–1257. [Google Scholar] [CrossRef] [Green Version]
  3. Barja, B.; Antuña, J.C. The effect of optically thin cirrus clouds on solar radiation in Camagüey, Cuba. Atmos. Chem. Phys. 2011, 11, 8625–8634. [Google Scholar] [CrossRef]
  4. Berry, E.; Mace, G.G. Cloud properties and radiative effects of the Asian summer monsoon derived from A-Train data. J. Geophys. Res. Atmos. 2014, 119, 9492–9508. [Google Scholar] [CrossRef]
  5. Yu, F.; Luo, G. Oceanic Dimethyl Sulfide Emission and New Particle Formation around the Coast of Antarctica: A Modeling Study of Seasonal Variations and Comparison with Measurements. Atmosphere 2010, 1, 34–50. [Google Scholar] [CrossRef] [Green Version]
  6. Kirkby, J.; Curtius, J.; Almeida, J.; Dunne, E.; Duplissy, J.; Ehrhart, S.; Franchin, A.; Gagné, S.; Ickes, L.; Kürten, A.; et al. Role of sulphuric acid, ammonia and galactic cosmic rays in atmospheric aerosol nucleation. Nature 2011, 476, 429–433. [Google Scholar] [CrossRef] [PubMed]
  7. Dupart, Y.; King, S.M.; Nekat, B.; Nowak, A.; Wiedensohler, A.; Herrmann, H.; David, G.; Thomas, B.; Miffre, A.; Rairoux, P.; et al. Mineral dust photochemistry induces nucleation events in the presence of SO2. Proc. Natl. Acad. Sci. USA 2012, 109, 20842–20847. [Google Scholar] [CrossRef] [PubMed]
  8. Almeida, J.; Schobesberger, S.; Kürten, A.; Ortega, I.K.; Kupiainen-Määttä, O.; Praplan, A.P.; Adamov, A.; Amorim, A.; Bianchi, F.; Breitenlechner, M.; et al. Molecular understanding of sulphuric acid–amine particle nucleation in the atmosphere. Nature 2013, 502, 359–363. [Google Scholar] [CrossRef] [PubMed]
  9. Kirkby, J.; Duplissy, J.; Sengupta, K.; Frege, C.; Gordon, H.; Williamson, C.; Heinritzi, M.; Simon, M.; Yan, C.; Almeida, J.; et al. Ion-induced nucleation of pure biogenic particles. Nature 2016, 533, 521–526. [Google Scholar] [CrossRef] [PubMed]
  10. Kulmala, M.; Petäjä, T.; Nieminen, T.; Sipilä, M.; Manninen, H.E.; Lehtipalo, K.; Dal Maso, M.; Aalto, P.P.; Junninen, H.; Paasonen, P.; et al. Measurement of the nucleation of atmospheric aerosol particles. Nat. Protoc. 2012, 7, 1651–1667. [Google Scholar] [CrossRef]
  11. Kulmala, M.; Kerminen, V.M. On the formation and growth of atmospheric nanoparticles. Atmos. Res. 2008, 90, 132–150. [Google Scholar] [CrossRef]
  12. Kyrö, E.M.; Kerminen, V.M.; Virkkula, A.; Maso, M.D.; Parshintsev, J.; Ruíz-Jimenez, J.; Forsström, L.; Manninen, H.E.; Riekkola, M.L.; Heinonen, P.; et al. Antarctic new particle formation from continental biogenic precursors. Atmos. Chem. Phys. 2013, 13, 3527–3546. [Google Scholar] [CrossRef] [Green Version]
  13. O’Dowd, C.D.; Lowe, J.A.; Smith, M.H.; Davison, B.; Hewitt, C.N.; Harrison, R.M. Biogenic sulphur emissions and inferred non-sea-salt-sulphate cloud condensation nuclei in and around Antarctica. J. Geophys. Res. Atmos. 1997, 102, 12839–12854. [Google Scholar] [CrossRef]
  14. Frege, C.; Ortega, I.K.; Rissanen, M.P.; Praplan, A.P.; Steiner, G.; Heinritzi, M.; Ahonen, L.; Amorim, A.; Bernhammer, A.K.; Bianchi, F.; et al. Influence of temperature on the molecular composition of ions and charged clusters during pure biogenic nucleation. Atmos. Chem. Phys. 2018, 18, 65–79. [Google Scholar] [CrossRef] [Green Version]
  15. Li, J.; Sun, J.; Zhou, M.; Cheng, Z.; Li, Q.; Cao, X.; Zhang, J. Observational analyses of dramatic developments of a severe air pollution event in the Beijing area. Atmos. Chem. Phys. 2018, 18, 3919–3935. [Google Scholar] [CrossRef] [Green Version]
  16. Bianchi, F.; Tröstl, J.; Junninen, H.; Frege, C.; Henne, S.; Hoyle, C.R.; Molteni, U.; Herrmann, E.; Adamov, A.; Bukowiecki, N.; et al. New particle formation in the free troposphere: A question of chemistry and timing. Science 2016, 352, 1109–1112. [Google Scholar] [CrossRef] [PubMed] [Green Version]
  17. Boulon, J.; Sellegri, K.; Hervo, M.; Laj, P. Observations of nucleation of new particles in a volcanic plume. Proc. Natl. Acad. Sci. USA 2011, 108, 12223–12226. [Google Scholar] [CrossRef] [PubMed] [Green Version]
  18. Boulon, J.; Sellegri, K.; Hervo, M.; Picard, D.; Pichon, J.M.; Fréville, P.; Laj, P. Investigation of nucleation events vertical extent: A long term study at two different altitude sites. Atmos. Chem. Phys. 2011, 11, 5625–5639. [Google Scholar] [CrossRef]
  19. Bukowiecki, N.; Weingartner, E.; Gysel, M.; Coen, M.C.; Zieger, P.; Herrmann, E.; Steinbacher, M.; Gäggeler, H.W.; Baltensperger, U. A Review of More than 20 Years of Aerosol Observation at the High Altitude Research Station Jungfraujoch, Switzerland (3580 m asl). Aerosol Air Qual. Res. 2016, 16, 764–788. [Google Scholar] [CrossRef] [Green Version]
  20. Hallar, A.G.; Lowenthal, D.H.; Chirokova, G.; Borys, R.D.; Wiedinmyer, C. Persistent daily new particle formation at a mountain-top location. Atmos. Environ. 2011, 45, 4111–4115. [Google Scholar] [CrossRef]
  21. Kulmala, M.; Kontkanen, J.; Junninen, H.; Lehtipalo, K.; Manninen, H.E.; Nieminen, T.; Petäjä, T.; Sipilä, M.; Schobesberger, S.; Rantala, P.; et al. Direct Observations of Atmospheric Aerosol Nucleation. Science 2013, 339, 943–946. [Google Scholar] [CrossRef]
  22. Rose, C.; Sellegri, K.; Velarde, F.; Moreno, I.; Ramonet, M.; Weinhold, K.; Krejci, R.; Ginot, P.; Andrade, M.; Wiedensohler, A.; et al. Frequent nucleation events at the high altitude station of Chacaltaya (5240 m a.s.l.), Bolivia. Atmos. Environ. 2015, 102, 18–29. [Google Scholar] [CrossRef]
  23. Rose, C.; Sellegri, K.; Asmi, E.; Hervo, M.; Freney, E.; Colomb, A.; Junninen, H.; Duplissy, J.; Sipilä, M.; Kontkanen, J.; et al. Major contribution of neutral clusters to new particle formation at the interface between the boundary layer and the free troposphere. Atmos. Chem. Phys. 2015, 15, 3413–3428. [Google Scholar] [CrossRef] [Green Version]
  24. Quan, J.; Liu, Y.; Liu, Q.; Jia, X.; Li, X.; Gao, Y.; Ding, D.; Li, J.; Wang, Z. Anthropogenic pollution elevates the peak height of new particle formation from planetary boundary layer to lower free troposphere. Geophys. Res. Lett. 2017, 44, 7537–7543. [Google Scholar] [CrossRef]
  25. Measures, R.M. Laser Remote Sensing: Fundamentals and Applications; Krieger Publishing Company: Malabar, FL, USA, 1992. [Google Scholar]
  26. Müller, D.; Ansmann, A.; Freudenthaler, V.; Kandler, K.; Toledano, C.; Hiebsch, A.; Gasteiger, J.; Esselborn, M.; Tesche, M.; Heese, B.; et al. Mineral dust observed with AERONET Sun photometer, Raman lidar, and in situ instruments during SAMUM 2006: Shape-dependent particle properties. J. Geophys. Res. Atmos. 2010, 115, 115. [Google Scholar] [CrossRef]
  27. Haarig, M.; Ansmann, A.; Gasteiger, J.; Kandler, K.; Althausen, D.; Baars, H.; Radenz, M.; Farrell, D.A. Dry versus wet marine particle optical properties: RH dependence of depolarization ratio, backscatter, and extinction from multiwavelength lidar measurements during SALTRACE. Atmos. Chem. Phys. 2017, 17, 14199–14217. [Google Scholar] [CrossRef] [Green Version]
  28. Engelmann, R.; Kanitz, T.; Baars, H.; Heese, B.; Althausen, D.; Skupin, A.; Wandinger, U.; Komppula, M.; Stachlewska, I.S.; Amiridis, V.; et al. The automated multiwavelength Raman polarization and water-vapor lidar PollyXT: The neXT generation. Atmos. Meas. Tech. 2016, 9, 1767–1784. [Google Scholar] [CrossRef]
  29. Miffre, A.; David, G.; Thomas, B.; Rairoux, P. Atmospheric non-spherical particles optical properties from UV-polarization lidar and scattering matrix. Geophys. Res. Lett. 2011, 38, L16804. [Google Scholar] [CrossRef]
  30. David, G.; Miffre, A.; Thomas, B.; Rairoux, P. Sensitive and accurate dual-wavelength UV-VIS polarization detector for optical remote sensing of tropospheric aerosols. Appl. Phys. B 2012, 108, 197–216. [Google Scholar] [CrossRef] [Green Version]
  31. David, G.; Thomas, B.; Nousiainen, T.; Miffre, A.; Rairoux, P. Retrieving simulated volcanic, desert dust and sea-salt particle properties from two/three-component particle mixtures using UV-VIS polarization lidar and T matrix. Atmos. Chem. Phys. 2013, 13, 6757–6776. [Google Scholar] [CrossRef] [Green Version]
  32. David, G.; Thomas, B.; Dupart, Y.; D’Anna, B.; George, C.; Miffre, A.; Rairoux, P. UV polarization lidar for remote sensing new particles formation in the atmosphere. Opt. Express 2014, 22, A1009. [Google Scholar] [CrossRef]
  33. Mehri, T.; Kemppinen, O.; David, G.; Lindqvist, H.; Tyynelä, J.; Nousiainen, T.; Rairoux, P.; Miffre, A. Investigating the size, shape and surface roughness dependence of polarization lidars with light-scattering computations on real mineral dust particles: Application to dust particles’ external mixtures and dust mass concentration retrievals. Atmos. Res. 2018, 203, 44–61. [Google Scholar] [CrossRef]
  34. Katrianne Lehtipalo Spotlight on Optics: UV Polarization Lidar for Remote Sensing New Particles Formation in the Atmosphere. Available online: https://www.osapublishing.org/spotlight/summary.cfm?id=284277 (accessed on 24 April 2019).
  35. Ansmann, A.; Seifert, P.; Tesche, M.; Wandinger, U. Profiling of fine and coarse particle mass: Case studies of Saharan dust and Eyjafjallajökull/Grimsvötn volcanic plumes. Atmos. Chem. Phys. 2012, 12, 9399–9415. [Google Scholar] [CrossRef]
  36. Shimizu, A.; Sugimoto, N.; Matsui, I.; Arao, K.; Uno, I.; Murayama, T.; Kagawa, N.; Aoki, K.; Uchiyama, A.; Yamazaki, A. Continuous observations of Asian dust and other aerosols by polarization lidars in China and Japan during ACE-Asia. J. Geophys. Res. Atmos. 2004, 109, 109. [Google Scholar] [CrossRef]
  37. Miffre, A.; Mehri, T.; Francis, M.; Rairoux, P. UV-VIS depolarization from Arizona Test Dust particles at exact backscattering angle. J. Quant. Spectrosc. Radiat. Transf. 2016, 169, 79–90. [Google Scholar] [CrossRef]
  38. Mishchenko, M.I.; Travis, L.D.; Lacis, A.A. Scattering, Absorption, and Emission of Light by Small Particles; Cambridge University Press: Cambridge, UK, 2002. [Google Scholar]
  39. David, G.; Thomas, B.; Coillet, E.; Miffre, A.; Rairoux, P. Polarization-resolved exact light backscattering by an ensemble of particles in air. Opt. Express 2013, 21, 18624. [Google Scholar] [CrossRef]
  40. Miffre, A.; Cholleton, D.; Rairoux, P. Laboratory evaluation of the scattering matrix elements of mineral dust particles from 176.0 up to 180.0-exact backscattering angle. J. Quant. Spectrosc. Radiat. Transf. 2019, 222, 45–59. [Google Scholar] [CrossRef]
  41. Miffre, A.; David, G.; Thomas, B.; Rairoux, P.; Fjaeraa, A.M.; Kristiansen, N.I.; Stohl, A. Volcanic aerosol optical properties and phase partitioning behavior after long-range advection characterized by UV-Lidar measurements. Atmos. Environ. 2012, 48, 76–84. [Google Scholar] [CrossRef]
  42. Behrendt, A.; Nakamura, T. Calculation of the calibration constant of polarization lidar and its dependency on atmospheric temperature. Opt. Express 2002, 10, 805–817. [Google Scholar] [CrossRef]
  43. Freudenthaler, V.; Esselborn, M.; Wiegner, M.; Heese, B.; Tesche, M.; Ansmann, A.; MüLLER, D.; Althausen, D.; Wirth, M.; Fix, A.; et al. Depolarization ratio profiling at several wavelengths in pure Saharan dust during SAMUM 2006. Tellus B Chem. Phys. Meteorol. 2009, 61, 165–179. [Google Scholar] [CrossRef] [Green Version]
  44. Shurcliff, W.A. Polarized Light: Production and Use; Harvard University Press: Cambridge, MA, USA, 1962. [Google Scholar]
  45. Bucholtz, A. Rayleigh-scattering calculations for the terrestrial atmosphere. Appl. Opt. 1995, 34, 2765–2773. [Google Scholar] [CrossRef]
  46. Miffre, A.; David, G.; Thomas, B.; Chacra, M.A.; Rairoux, P. Interpretation of Accurate UV Polarization Lidar Measurements: Application to Volcanic Ash Number Concentration Retrieval. J. Atmos. Ocean. Technol. 2012, 29, 558–568. [Google Scholar] [CrossRef]
  47. Klett, J.D. Lidar inversion with variable backscatter/extinction ratios. Appl. Opt. 1985, 24, 1638–1643. [Google Scholar] [CrossRef] [PubMed]
  48. Veselovskii, I.; Dubovik, O.; Kolgotin, A.; Lapyonok, T.; Di Girolamo, P.; Summa, D.; Whiteman, D.N.; Mishchenko, M.; Tanré, D. Application of randomly oriented spheroids for retrieval of dust particle parameters from multiwavelength lidar measurements. J. Geophys. Res. 2010, 115, 115. [Google Scholar] [CrossRef]
  49. Sasano, Y.; Browell, E.V. Light scattering characteristics of various aerosol types derived from multiple wavelength lidar observations. Appl. Opt. 1989, 28, 1670–1679. [Google Scholar] [CrossRef] [PubMed]
  50. Sakai, T.; Shibata, T.; Iwasaka, Y.; Nagai, T.; Nakazato, M.; Matsumura, T.; Ichiki, A.; Kim, Y.S.; Tamura, K.; Troshkin, D.; et al. Case study of Raman lidar measurements of Asian dust events in 2000 and 2001 at Nagoya and Tsukuba, Japan. Atmos. Environ. 2002, 36, 5479–5489. [Google Scholar] [CrossRef]
  51. Hummel, J.R.; Shettle, E.P.; Longtin, D.R. A New Background Stratospheric Aerosol Model for Use in Atmospheric Radiation Models; Optimetrics Inc.: Hialeah, FL, USA, 1988. [Google Scholar]
  52. Stohl, A. Computation, accuracy and applications of trajectories—A review and bibliography. Atmos. Environ. 1998, 32, 947–966. [Google Scholar] [CrossRef]
  53. SKIRON—Dust Forecast Mediterranean Europe North Atlantic. Available online: http://forecast.uoa.gr/dustindx.php (accessed on 24 April 2019).
Figure 1. (a) Left: Scheme of our calibration procedure based on inserting a half-wavelength plate (HWP) on the optical pathway from the laser to the atmosphere then measuring the induced polarization cross-talks on the polarization lidar detector. Right: Calibration curves of the polarization lidar detector relying on a 12-points adjustment at UV (blue) and VIS (green) wavelengths ( G ( λ U V ) = 7.10 ± 0.12 ,   G ( λ V I S ) = 2.23 ± 0.06 ). (b): Spectral dependence of molecular backscattering cross-section at a UVwavelength numerically simulated for a standard atmosphere, for co (black)- and cross (grey)-polarized components. The Raman sidebands are spectrally broadened by the Doppler effect and due to the finite spectral linewidth (1 GHz) of the emitting laser.
Remotesensing 11 01761 g001
Figure 2. Left: Particle size distribution associated with a dust NPF event after condensational growth. Right: Numerical simulation of B A E as a function of the maximal diameter, D M , involved in a lidar experiment (i.e., the upper bound, D M , of the integral defining the backscattering coefficient, β s ).
Remotesensing 11 01761 g002
Figure 3. Seven-day air mass backtrajectories [52] (upper left), forecast dust mass concentrations from Skiron [53] (lower left) together with vertical profiles of temperature and relative humidity RH (right) at Lyon on 2 and 3 July 2015. On 2 July 2015, at 12:00h, 18:00h, and 24:00h UTC, the dust mass concentrations are low (range of 10 µg.m−3), as a low dust loading scenario. In contrast, on 3 July 2015 at 18:00h UTC, the dust mass concentration is 10 times higher (range of 110 µg.m−3), as a high dust loading scenario.
Remotesensing 11 01761 g003
Figure 4. Time–altitude maps of particle backscattering at λ U V = 355 nm under low dust loadings (i.e., on 2 July 2015 at Lyon): co- (//) and cross-polarized ( ) particle backscattering coefficient, β p , / / and β p , (upper two panels), as derived from the lidar raw data, then β s and β d (lower two panels), as retrieved from Equation (5). The time zone represented in white color was used to calibrate our (UV, VIS) polarization lidar, as explained in Section 2.1. To put light on the achieved sensitivity, a different color code has been used for each time–altitude map.
Remotesensing 11 01761 g004
Figure 5. Same as Figure 4 at lidar wavelength λ V I S = 532 nm.
Remotesensing 11 01761 g005
Figure 6. Low dust loading. Day (14:00h UTC, upper panels) and nighttime (21:00h UTC, lower panels) vertical profiles of particle backscattering under low dust loading conditions (2 July 2015, dust mass concentrations of 10 µg.m−3). In the three left panels dedicated to wavelength λ U V , β p , / / , β p , , β s (in blue), and β d (in brown) are successively displayed. The (up and down) three right panels, dedicated to wavelength λ V I S , successively display β p , / / , β p , , then β s (in green) and β d (in brown). The vertical range resolution is 75 m. Whatever the chosen lidar wavelength, it is only during daytime conditions (14:00h UTC) that increasing β s values are correlated with decreasing β d values.
Remotesensing 11 01761 g006
Figure 7. Same as in Figure 6 at high dust loading (dust mass concentrations of 110 µg.m−3, 3 July 2015). The figure is limited to daytime conditions (t = 16:00h UTC) since NPF events promoted by mineral dust cannot occur during the nighttime.
Remotesensing 11 01761 g007
Figure 8. Scatter plot, β s = f ( β d ) , at wavelength λ U V (left graph) and wavelength λ V I S (right graph) as derived from Figure 6 (low dust loading conditions) at altitudes where the dust cloud is present. Within our error bars, the slope of β s = f ( β d ) is clearly negative during daytime and positive during nighttime, in agreement with the state-of-the-art literature on dust NPF events [7].
Remotesensing 11 01761 g008
Figure 9. Vertical profiles of the backscattering Angstrom exponent, B A E , under daytime (14:00h UTC, left panels) and nighttime conditions (21:00h UTC, right panels) under the low dust loading scenario corresponding to Figure 6. For each considered hour, β s ( λ U V ) (in blue) and β s ( λ V I S ) (in green) then B A E (in dark yellow) are successively represented.
Remotesensing 11 01761 g009

