Article

Different Agricultural Responses to Extreme Drought Events in Neighboring Counties of South and North Korea

1
Department of Applied Plant Science, Chonnam National University, 77 Yongbong-ro, Gwangju 61186, Korea
2
Department of Spatial Information Engineering, Pukyong National University, 45 Yongso-ro, Namgu, Busan 48513, Korea
3
Department of Geoinformatic Engineering, Inha University, 100 Inha-ro, Michuhol-gu, Incheon 22212, Korea
4
Department of Environment, Energy, and Geoinformatics, Sejong University, 209 Neungdong-ro, Gwangjin-gu, Seoul 05006, Korea
5
National Meteorological Satellite Center, Korea Meteorological Administration, 64-18 Guam-gil, Gwangheywon-myeon, Jincheon-gun 27803, Korea
*
Author to whom correspondence should be addressed.
Remote Sens. 2019, 11(15), 1773; https://doi.org/10.3390/rs11151773
Submission received: 17 June 2019 / Revised: 18 July 2019 / Accepted: 26 July 2019 / Published: 27 July 2019
(This article belongs to the Special Issue Remote Sensing of Drought Monitoring)

Abstract

:
Satellite-based remote sensing techniques have been widely used to monitor droughts spanning large areas. Various agricultural drought indices have been developed to assess the intensity of agricultural drought and to detect damaged crop areas. However, to better understand the responses of agricultural drought to meteorological drought, agricultural management practices should be taken into consideration. This study aims to evaluate the responses to drought under different forms of agricultural management for the extreme drought that occurred on the Korean Peninsula in 2014 and 2015. The 3-month standardized precipitation index (SPI3) and the 3-month vegetation health index (VHI3) were selected as a meteorological drought index and an agricultural drought index, respectively. VHI3, which comprises the 3-month temperature condition index (TCI3) and the 3-month vegetation condition index (VCI3), differed significantly in the study area during the extreme drought. VCI3 had a different response to the lack of precipitation in South and North Korea because it was affected by irrigation. However, the time series of TCI3 were similar in South and North Korea. These results meant that each drought index has different characteristics and should be utilized with caution. Our results are expected to help comprehend the responses of the agricultural drought index on meteorological drought depending on agricultural management.

Graphical Abstract

1. Introduction

Drought is a common climatic phenomenon in most climatic regimes. However, in some cases, it can be a critical natural hazard that affects agricultural, hydrological, and socioeconomic systems [1,2]. The limitation of water supply caused by drought can occur over a broad spectrum in a large-scale area for a long-term period [3,4]. Such drought has been globally increasing in terms of frequency, duration, and severity since 1951, particularly in regional areas of eastern Asia, Africa, and southern Australia [4]. Furthermore, the local drought magnitude is expected to be worse in the future, due to global warming [5].
Drought commonly begins with a continuation of dry weather in terms of meteorological condition. The growth and development of crops and crop yields suffer under the conditions of a continual meteorological drought [6]. Such agricultural drought is caused by reductions in not only the soil moisture in farmland but also the water sources for irrigation, such as streams, reservoirs, and groundwater [7]. The effects of drought on croplands have critical problems, ranging from those related to farmers or rural economy to dependable food supply [8]. However, it is often difficult to measure the degree and range of influence of drought on croplands. Although agricultural drought is caused by long-lasting meteorological drought, the damage assessment from agricultural aspect is highly dependent on the cropping ability and resilience of the farming system [9]. This means that, to identify the different sensitivities of drought on croplands, not only dry climatic conditions but also cropland conditions and agricultural management need to be investigated.
The satellite remote sensing technique has been widely used to monitor drought and to assess its influence [10]. Especially, it is possible to extensively and continually observe the surface dryness/moisture, vegetation, and thermal states related with the phenomenon of agricultural drought [11]. Using these land-surface properties, numerous satellite-based drought indices have been developed for effective drought monitoring [12,13]. However, the correlations among satellite-based drought indices are not always acceptable because the definitions of indices are conceptually different based on the indicated drought phenomenon and the time scale for observing the progress [14,15,16]. The types of parameters used in the calculation of each index differ according to the meteorological, agricultural, and hydrological drought concepts. For example, while meteorological drought considers only atmospheric dry conditions, agricultural, and hydrological droughts are highly related to land conditions. In addition, the time lag and scales of the phenomenon indicated in drought indices are different [17]. For example, under the lack of precipitation, agricultural drought associated with soil moisture will be more severe than hydrological drought of water resources [15,18].
The normalized difference vegetation index (NDVI), originally used to monitor vegetation conditions, has been applied to detect surface drought conditions because the vegetation suffers under the dryness condition [19]. In addition, land-surface temperature (LST) is often used to indicate drought intensity because the surface water loss by evapotranspiration increased under high thermal conditions [20]. Indeed, both NDVI and LST strongly affect the water−energy balance of the surface [21]. In previous studies, these two indices have been often combined to represent surface dryness or evapotranspiration [22,23]. Given that both dryness condition and evapotranspiration loss are critically related to soil moisture for crop water supply, the application of NDVI and LST together can be an indicator of agricultural drought, such as the vegetation health index (VHI), temperature vegetation dryness index (TVDI), and vegetation supply water index (VSWI) [21,24,25]. A TVDI is calculated using the triangle relationship between NDVI and LST, where values close to zero indicate wet conditions, and a TVDI close to 1 represents dry surface conditions. The VSWI is the ratio between LST and NDVI (or NDVI and LST), and has been related to soil water content and rainfall [26].
Given that agricultural drought is affected by not only natural water shortage but also artificial farm management [27,28], NDVI and LST are expected to be suitable for representing both influences. For example, the irrigation system is one of the major agricultural managements, and has been developed to minimize the damage of crop yield in response to meteorological drought [29]. Thus, such agricultural water management will not cause the fall of NDVI by crop damage and the rise of LST by lower soil moisture under some drought progress. Nevertheless, the response of agricultural drought under agricultural management is critical to distinguish between the severity of climatic drought and agricultural vulnerability; this has not been well-investigated.
This study aims to identify the responses of drought to different farm management regions under the extreme drought conditions. Croplands of developing and developed countries are affected by the drought, but in different ways [30]. Accordingly, the neighboring counties in South and North Korea are selected as the study area, assuming that these regions have a similar climate and different crop management facilities. The VHI data, satellite-based drought index that combines NDVI and LST, are mainly used to analyze the agricultural drought under the different types of farm management. In addition, VHI is compared with the standardized precipitation index (SPI), a representative meteorological drought index, to better understand agricultural drought.

2. Materials and Methods

2.1. Study Area

The study areas were designed to satisfactorily understand the sensitivity of agricultural management against disaster related to drought. We required similar climate condition but different form of agricultural management. For this reason, we focused on the border areas between South and North Korea as our study areas (Figure 1).
Paju county (hereafter Paju) in South Korea and Gaesong county (heareafter Gaesong) in North Korea are located near the demilitarized zone (DMZ). Similar climate characteristics in Paju and Gaesong were confirmed from the analysis conducted using the ground-observed air temperature and precipitation from 2003 to 2017. In both counties, air temperature was the highest during July–August and precipitation was the largest in July. As compared to the mean precipitation in 2003–2017, which period was defined as the normal year in this study, in the drought years (2014–2015), the precipitation was about 51.60% and 47.07% in Paju and Gaesong, respectively. In particular, the precipitation in 2014 was low throughout the year in comparison to the mean precipitation for the period from 2003 to 2017 (Figure 2a,b). The air temperature for the drought years was ~1.04 °C and ~1.01 °C higher in Paju and Gaesong, respectively, during the non-growing period (November to March) in comparison to the normal year. However, the air temperature during the growing period (April to October) was not remarkably different to the normal year temperature. It increased by ~0.10 °C and ~0.51 °C in Paju and Gaesong, respectively, during the growing period in both 2014 and 2015. This means that the 2014–2015 drought occurred largely as a result of extremely low precipitation, as oppose to a heatwave. The differences in the monthly mean air temperature and monthly cumulative precipitation between Paju and Gaesong are shown in Figure 3. For air temperature, the difference below 1 °C (2 °C) between two counties was about 81.56% (97.22%) for 15 years (Figure 3a). For precipitation, the difference below 25 mm/month (50 mm/month) was about 68.15% (83.24%) (Figure 3c). Furthermore, during the drought years (2014–2015), the precipitation difference of above 50 mm/month occurred only once.
Cheorwon county (hereafter Cheorwon) in South Korea and Pyonggang county (hereafter Pyonggang) in North Korea were also investigated. In 2014, the annual precipitation in Cheorwon and Pyonggang were just 48.90% and 46.76% of the normal year precipitation (Figure 2c,d). In 2015, annual precipitation in Cheorwon remained at ~78.23%, while in Pyonggang it exceeded 100% of the normal year precipitation. In Pyonggang, it rained ~711.7 mm during the period July to August in 2015. The air temperature during the growing period (and non-growing period) in the 2014–2015 period was ~0.35 °C and ~0.06 °C (~1.23 °C and ~0.96 °C) higher in Cheorwon and Pyonggang as compared to the normal year (Figure 2). For precipitation, a difference of below 25 mm/month (50 mm/month) was 71.11% (84.44%) (Figure 3d). For air temperature, a difference of below 2 °C was about 96.67% (Figure 3b). The overall climatic similarity between Cheorwon and Pyonggang was close to that in Paju and Gaesong. Therefore, in this study, each of these neighbor country pairs (Paju-Gaesong and Cheorwon-Pyonggang) were regarded as the same climatic conditions.

2.2. Agricultural Management

The food crop in South Korea is paddy rice, which occupies about 89.2% of all production. In case of North Korea, rice and corn are the major crops, which occupied about 46.1% and 35.2% in 2016 [31]. Rice productions per square meter in South and North Korea were 539,000 and 389,000 kg in 2016 [32]. Rice production in North Korea was lower than that in South Korea, even under the non-disaster condition. This difference in production could be caused by the climatic conditions in South and North regions, but the agricultural facilities and management are also significant. Indeed, the shortages of fertilizer, tractors, mechanized operation, fuel, and irrigation facilities are likely to lead to reduced crop production in North Korea [33,34]. For example, for fertilizers, just below 50% of the total requirement was supplied in North Korea [33] and about 60% of arable area was only prepared using mechanized operations [34]. In particular, the number of irrigation facilities, which are the only artificial way to overcome agricultural drought, was largely different in South and North Korea (Table 1) [35,36]. Although the cropland area in North Korea is larger than that in South Korea, reservoirs in South Korea were about 9 times more abundant than those in North Korea, and an irrigation canal, which can offer water from a reservoir to the cropland, was better organized in South Korea. On the other hand, the number of groundwater pumping stations was higher in North Korea. Although the detailed information related to the selected counties in North Korea cannot be known due to international tensions, the groundwater-dependent regions such as North Korea might be weak because of a water shortage condition. Figure 1c shows a map of the major rivers, including the Imjin River and the North Han River and associated streams. In this study, the inflow volume data for the shared rivers of North Korea and South Korea were used to indirectly understand the water resource conditions of North Korea.

2.3. Landcover

The study areas had not only cropland but also other land use types such as forest and urban. Thus, the cropland was extracted using the Globeland30 (GL30) data product, which has a spatial resolution of about 30 m [37]. Son and Kim [38] showed that GL30 had the highest accuracy in Korea peninsular regions compared to9 other landcovers such as Global landcover 2000 (GLC2000), Global landcover map 2009 (GlobCover2009), and MODIS landcover in South Korea.
GL30 data was converted from 30 m to 1 km to match the NDVI and LST data from the Moderate Resolution Imaging Spectroradiometer (MODIS) products. At this time, the most frequent landcover was selected as representative landcover. The converted GL30 appeared to be better than MODIS landcover data for this study. For example, the MODIS landcover data could not well classify the cropland into urban and forest in Gaesong. In contrast, although the built-up area in Gaesong was misclassified as grassland in GL30, this is not a concern for our study. Therefore, GL30 was used in this study to distinguish the cropland.

2.4. Meteorological Drought Index

Drought is defined as “an insidious natural hazard that results from a deficiency of precipitation from expected or normal” [39,40]. SPI is one of the representative meteorological drought indices [41,42] calculated by the current precipitation data and long-term precipitation data record [43]. It has characteristics of probability distribution and is transformed to a normal distribution [27]. Thus, a negative value of SPI represents dry conditions. The drought severity of SPI is generally classified as shown in Table 2 [11,16,41].
In addition, SPI can be produced as multiple time scales such as 1-, 3-, 6-, and 12 months. The short-term is less than 6 months, while the long-term is greater than 6 months. According to previous studies, depending on the time scales, SPI can have some relation with the short-term surface moisture conditions associated with agricultural drought [44,45]. Park et al. [15] showed that three-month SPI (hereafter referred to as SPI3) had the highest correlation with crop yield, and that oscillations of short-term drought can occur in association with the crop growth period [20]. In addition, Ji and Peters [19] suggested an SPI3 to evaluate the sensitivity of vegetation to drought. Given that the cultivation period for major crops—such as paddy rice and maize—in the study area is <5 months, this can be considered as relatively short-term. The 3-month drought index has often been used for investigating the response of crops to drought condition [46,47].
Daily cumulative precipitation data were achieved from the Korean Meteorological Administration [48]. The precipitation data recorded in the weather stations located in South and North Korea are shown in Figure 1b. The daily scale value of the point-based precipitation was converted to monthly cumulative data in order to estimate the SPI from 2003 to 2017. This period was exactly the same as the period of the satellite dataset.
Duration, severity, and intensity of meteorological drought are often used to quantitatively evaluate droughts [4,5]. Drought duration was defined as commencing with the first month of drought conditions (start) until the last month of drought conditions (end). Here, the standard for the start and end of the drought was set to −1.0 value of the SPI3 according to the drought classes of the SPI3 (Table 2). The severity of the drought is calculated as the ratio of the drought deficit volume to the drought duration [5]. The intensity of the meteorological drought was regarded as the minimum value of SPI during the duration [4]. In this study, the mean value of the SPI3 over the drought duration was used instead of severity [13].

2.5. Agricultural Drought Index

The distinction between drought and normal condition should be relative depending on the area and period [1]. Furthermore, the vulnerability to drought varies highly depending on the land properties. Thus, some agricultural drought indices stand on the basis of the relative value to normal tendency during a long-term period.
VHI, a satellite-based agricultural drought index, was calculated from the NDVI and LST data of Aqua/MODIS that has been operating since May 2002. VHI was originally developed using the NDVI and brightness temperature (BT) of NOAA/AVHRR to monitor drought globally. In this study, LST was used instead of BT because the atmospheric vapor conditions and solar zenith angle were well-considered in the estimation of LST [49]. VHI comprises the vegetation condition index (VCI) developed by NDVI and the temperature condition index (TCI) developed by LST:
VHI = α × VCI + ( 1 α ) × TCI
According the previous studies, the value of α is 0.5 [16,50,51]. The drought severity of VHI, TCI, and VCI are classified in Table 2. Both VHI and SPI represent more severity at lower values. VCI is a normalized index calculated using the maximum and minimum values of NDVI, as shown in Equation 2. It was originally developed to monitor the drought that reflected the phenological and physiological responses of vegetation to soil moisture conditions [2]. When VCI is high, it indicates a wet condition.
VCI = NDVI NDV I MIN NDV I MAX + NDV I MIN × 100
NDVIMAX (NDVIMIN) means the maximum (minimum) value at each pixel over the past period. The NDVI from Aqua/MODIS MYD13A3 collection 6 was used, and the spatiotemporal resolution was 1 km and monthly. To calculate VCI, the monthly maximum and minimum values of NDVI were estimated on the basis of the monthly NDVI observed from 2003 to 2017.
TCI is another normalized index calculated using the maximum and minimum values of LST, as shown in Equation (3). It represents the thermal energy condition that reflects the change in the surface heat energy balance on the basis of the participation between sensible and latent heat fluxes according to surface dryness [2]. When TCI is high, it indicates a dry condition.
TCI = LS T MAX LST LS T MAX + LS T MIN × 100
LSTMAX and LSTMIN indicate the maximum and minimum LST values. The Aqua/MODIS MYD11A2 collection 6 LST was used, and the spatiotemporal resolution was 1 km and 8-day. To match the temporal resolution with the NDVI product, the 8-day LST was converted to monthly LST using a weighting function.
In this study, VHI, VCI, and TCI, as agricultural drought indices, were calculated based on 3-month NDVI and LST, defined as VHI3, VCI3, and TCI3, respectively (Table 3). In addition, each of the pixel-based satellite-derived agricultural drought indices were recalculated according to administrative area and land use type. The pixels of cropland in each county were averaged, and each were then used as the representative value for their respective county. All analysis was subsequently performed. In four of the counties, the mean values of the 3-month NDVI (LST) during the study period were 0.472, 0.448, 0.524, and 0.479 (19.05 °C, 19.74 °C, 17.07 °C, and 17.76 °C) for Paju, Gaesong, Cheorwon, and Pyonggang, respectively.
The duration, the mean value of drought index during the maximum duration, and the intensity of the agricultural drought in 2014 and in 2015, in South and North Korea, were calculated in a similar way to the SPI3. Thus, the standard for the start and end of the drought was set to a value of 40 for VHI3, TCI3, and VCI3 (Table 2). Since some of the start and end time points can have several durations, the drought in 2014 and in 2015 were evaluated for its maximum duration.

3. Results

3.1. Time Series of SPI3

In Paju and Gaesong, the time series of SPI3 were similar for 15 years (Figure 4a), which means that these two counties have suffered from the dry climatic condition at the same period time. The correlation coefficient of SPI3 between two counties was 0.886 (p < 0.001) during the whole study period. The extreme drought event that occurred from 2014 to 2015 in the center of Korean Peninsula was also clearly represented using SPI3. For two years, larger negative values of SPI3 as compared to those in the other periods since 2003 were continued. The drought intensity in 2014 was more serious than that in 2015. The lowest SPI3s in Paju (Gaesong) were -2.30 and −2.13 (−2.37 and −1.97) in 2014 and 2015, respectively. Furthermore, the mean value of the SPI3 in the growing season (April to October) was higher than that in the non-growing season. In Paju (Gaesong), the mean values of the SPI3 in 2014 and 2015 were −1.63 and −0.33 (−1.72 and −1.41) in the growing season, whereas they were −0.33 and 0.09 (−0.58 and −0.27) in the non-growing season.
The SPI3 in Cheorwon and Pyonggang also had a similar time-series pattern (Figure 4b), although it showed some different patterns in 2005 and 2006 due to the seriously lower precipitation in Pyonggang. The correlation of SPI3 between two counties was 0.760 (p < 0.001). In 2014, both Cheorwon and Pyonggang counties were under extreme meteorological drought, which continued into the next year, but its intensity became weaker (Table 4). In 2014, Cheorwon and Pyonggang were under slightly more serious meteorological drought conditions than Paju and Gaesong.

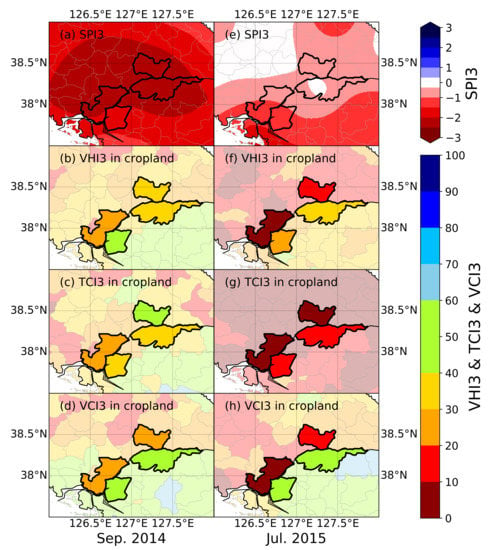
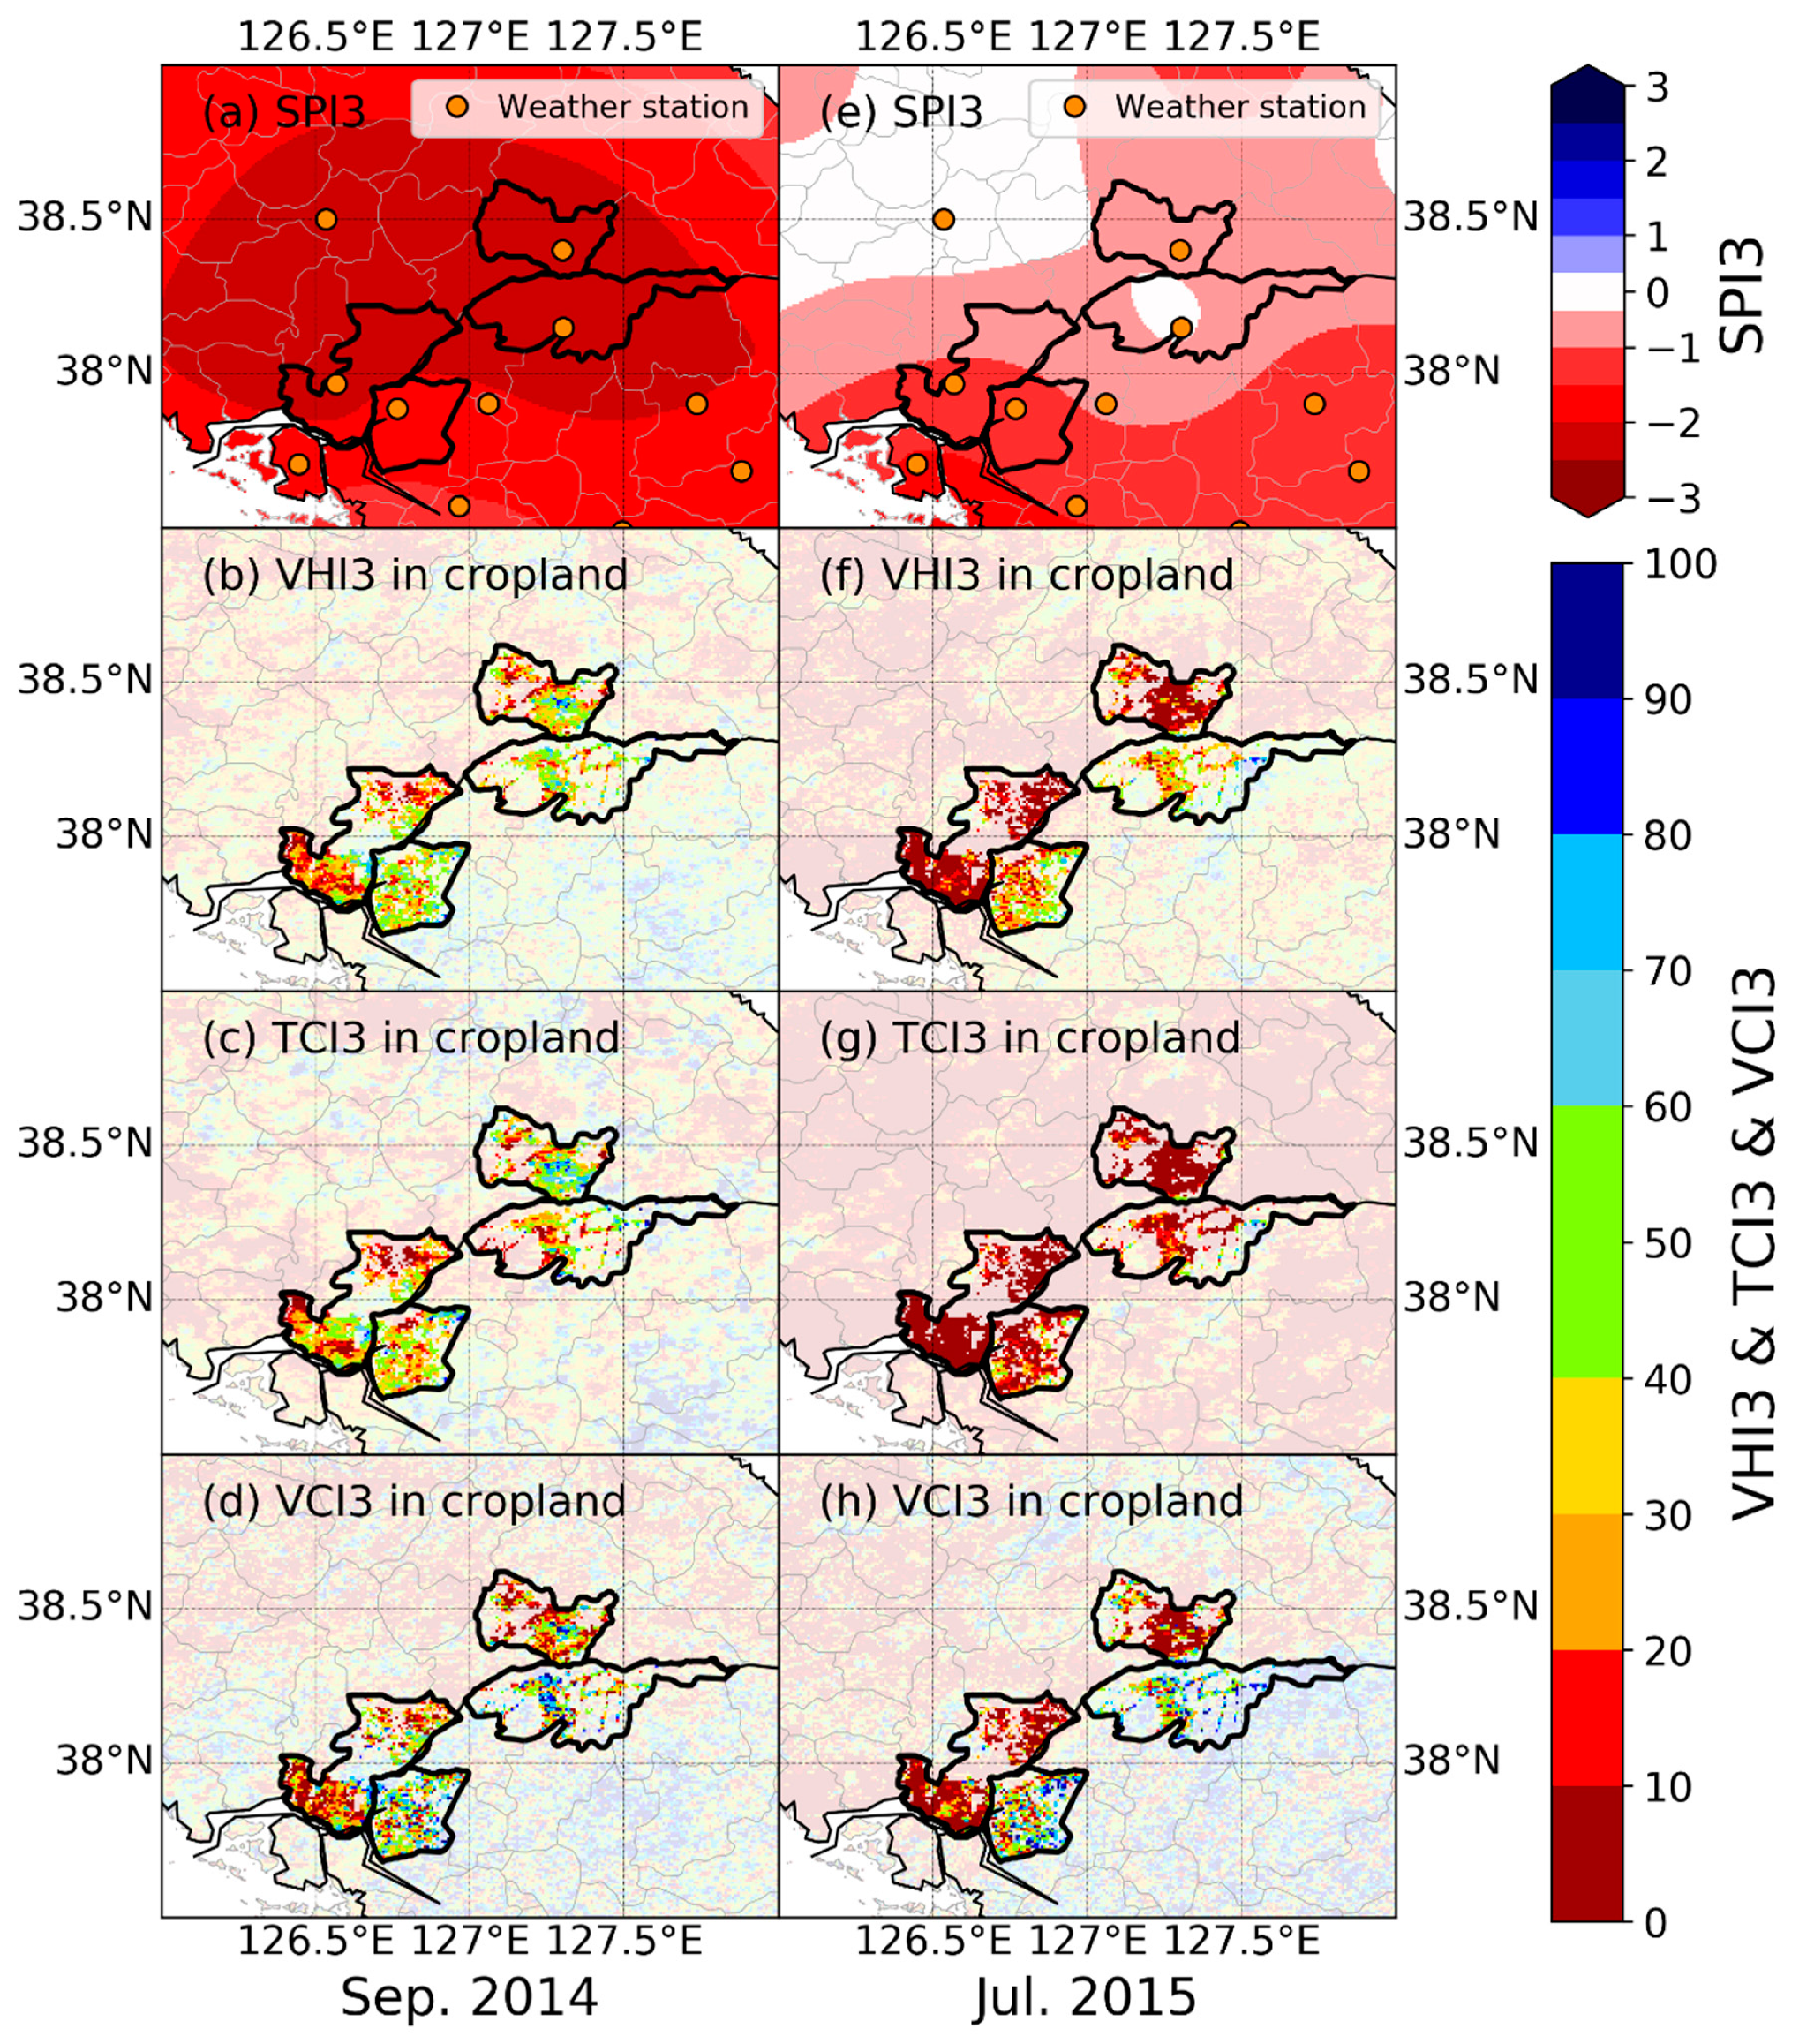
3.2. SPI3 and VHI3 during Drought Event

VHI3 was used to evaluate the response in cropland to meteorological drought condition. The correlation coefficients between SPI3 and VHI3 were 0.351 (p < 0.001), 0.428 (p < 0.001), 0.259 (p < 0.001), and 0.218 (p < 0.01) in Paju, Gaesong, Cheorwon, and Pyonggang, respectively, during 2003–2017. To view the situations in the drought years, Figure 5 shows the time series of SPI3 and VHI3 in each of the four counties from July 2013 to June 2016.
In Paju and Gaesong, the time-series patterns of VHI3 were close to those of SPI3 in principle, but the degree of similarity differed depending on the counties (Figure 5a,b). Before the early growing seasons in 2014 and 2015, less precipitation caused a decrease in not only SPI3 but also VHI3 in the cropland. The precipitation in Paju (Gaesong) was 181.2 mm and 223.9 mm (167.1 mm and 118.9 mm) from January to June in 2014 and 2015, and it was just 47.86% and 59.13% (50.29% and 35.79%) compared to mean values during normal year. Accordingly, SPI3 and VHI3 of the growing seasons had low negative values. On the other hand, both indices recovered to a zero value in the growing season in 2016.
The phenomena in Cheorwon and Pyonggang also generally resembled those in Paju and Gaesong (Figure 5c,d). The precipitation in Cheorwon (Pyonggang) was 209.0 mm and 262.5 mm (238.4 mm and 265.9 mm) from January to June in 2014 and 2015, and it was just 53.96% and 67.78% (71.23% and 79.44%) comparing to mean values in other years. Although precipitation increased in 2015 compared to 2014, the time series of SPI3 and VHI3 had the difference in 2015. The SPI3s of Cheorwon and Pyonggang in 2015 were not serious as those of Paju and Gaesong. The VHI3 in Cheorwon seemed to follow SPI3, but the VHI3 in Pyonggang was significantly decreased, even under the increasing SPI3. In other words, while SPI3s in Gaesong and Pyonggang had a different degree in 2015, those had lower VHI3 values, indicating severe agricultural drought.

3.3. TCI3 and VCI3 during Drought Event

The correlation coefficient of TCI3 between Paju and Gaesong (Cheorwon and Pyonggang) from 2003 to 2017 was 0.931 (0.904) (p < 0.001). This shows that the thermal conditions in both areas were very close during the entire 15 years. On the other hand, the correlation coefficient of VCI3 in Paju and Gaesong (Cheorwon and Pyonggang) was 0.811 (0.659) (p < 0.001), which was lower than that in the case of TCI3.
A detailed analysis of TCI3 and VCI3 during the drought period is shown in Figure 6. The TCI3 between the two counties of South and North Korea had similar time-series patterns (Figure 6a,c). The TCI3 had been decreasing before the growing season in 2014, and then became the lowest in spring; however, the TCI3 was increased soon over the growing season. After 1 year, the almost lowest TCI3 values again appeared over the growing season, but the TCI3s of Paju and Cheorwon in South Korea were somewhat higher than those of counties in North Korea.
Unlike TCI3, the VCI3 between the two counties of South and North Korea was different (Figure 6b,d). In 2014, the VCI3 of counties in South Korea did not indicate drought conditions, while that of counties in North Korea expressed drought condition because of the lower VCI3. For example, the VCI3 in Paju had been increasing after March 2014, while that in Gaesong had been decreasing. In 2015, the VCI3 in all counties represented drought conditions. However, the intensity and drought periods were different between counties in South and North Korea. The lowest VCI3s in 2015 were 24.96 and 32.18 in Paju and Cheorwon in South Korea, whereas they were 5.17 and 11.13 in Gaesong and Pyonggang in North Korea (Table 4). In addition, the drought duration for the VCI3 in South Korea was shorter than that in North Korea, and drought was maintained for 3, 3, 8, and 7 months in Paju, Cheorwon (South Korea), Gaesong, and Pyonggang (North Korea), respectively.

3.4. Spatial Analysis of SPI3, VHI3, TCI3, and VCI3

Figure 7 shows SPI3, VHI3, TCI3, and VCI3 maps in September 2014 and July 2015 of the drought period. The SPI3 was interpolated on the basis of the point data observed from weather stations. In the cases of the VHI3, the TCI3, and the VCI3 based on raster data, the pixels of cropland in the four counties of Paju, Gaesong, Cheorwon, and Pyonggang are shown in Figure 7. The difference response of agricultural drought between counties of South and North Korea under the similar meteorological drought was represented from the mean values of VHI3, TCI3, and VCI3 on the cropland pixels in each county.
In September 2014, the SPI3s in the four counties showed severe and extreme meteorological drought conditions. In agricultural drought, the mean values of VHI pixels on the cropland in Paju and Gaesong expressed normal and moderate drought conditions, and both Cheorwon and Pyonggang expressed mild drought conditions. The TCI3s also expressed normal-to-moderate drought conditions, similarly to VHI3s. Each pair of the study areas did not have large difference in SPI3 and TCI3. However, the drought conditions of VCI3 were remarkably distinguished according to South and North Korea. Although the extreme and severe pixels on the meteorological drought existed in South and North Korea, the VCI3s were mostly under normal conditions in the counties in South Korea, but the VCI3s in North Korea were under moderate drought conditions.
Although the meteorological drought for 2015 was weaker than that for 2014, the agricultural drought was aggravated in 2015. The different response of agricultural drought between South and North Korea in July 2015 was larger than that in 2014. Mean VHI3s in the four counties represented the distribution from extreme-to-moderate drought conditions. In particular, the VHI3s in North Korea indicated more serious drought conditions than those in South Korea. These differences in VHI3 between South and North Korea were mostly caused by the spatial variation in VCI3. The VCI3s in South Korea dramatically maintained the averagely normal condition in 2015, even lower SPI values in 2014 and 2015. TCI3s were low in all counties.

3.5. Relation between VCI3 and Capacity of Reservoirs

In 2014 and 2015, the unexpected high values of VCI3 in South Korea might be due to the well-organized irrigation facilities located there. Given that most irrigation water consumption in paddy rice occurs during April to July, the relation between VCI3 and reservoir capacity in South Korea is shown during the first half of the growing season (April to October) (Figure 8). The reservoir capacity decreases from April to July, which is attributed to not only high evaporation on the water surface but also agricultural irrigation. In addition, the VCIs increase as the capacity of reservoirs decreases, even though the slopes between the two factors depend on the season and region. This shows the importance of the effect of agricultural management for drought evaluation.

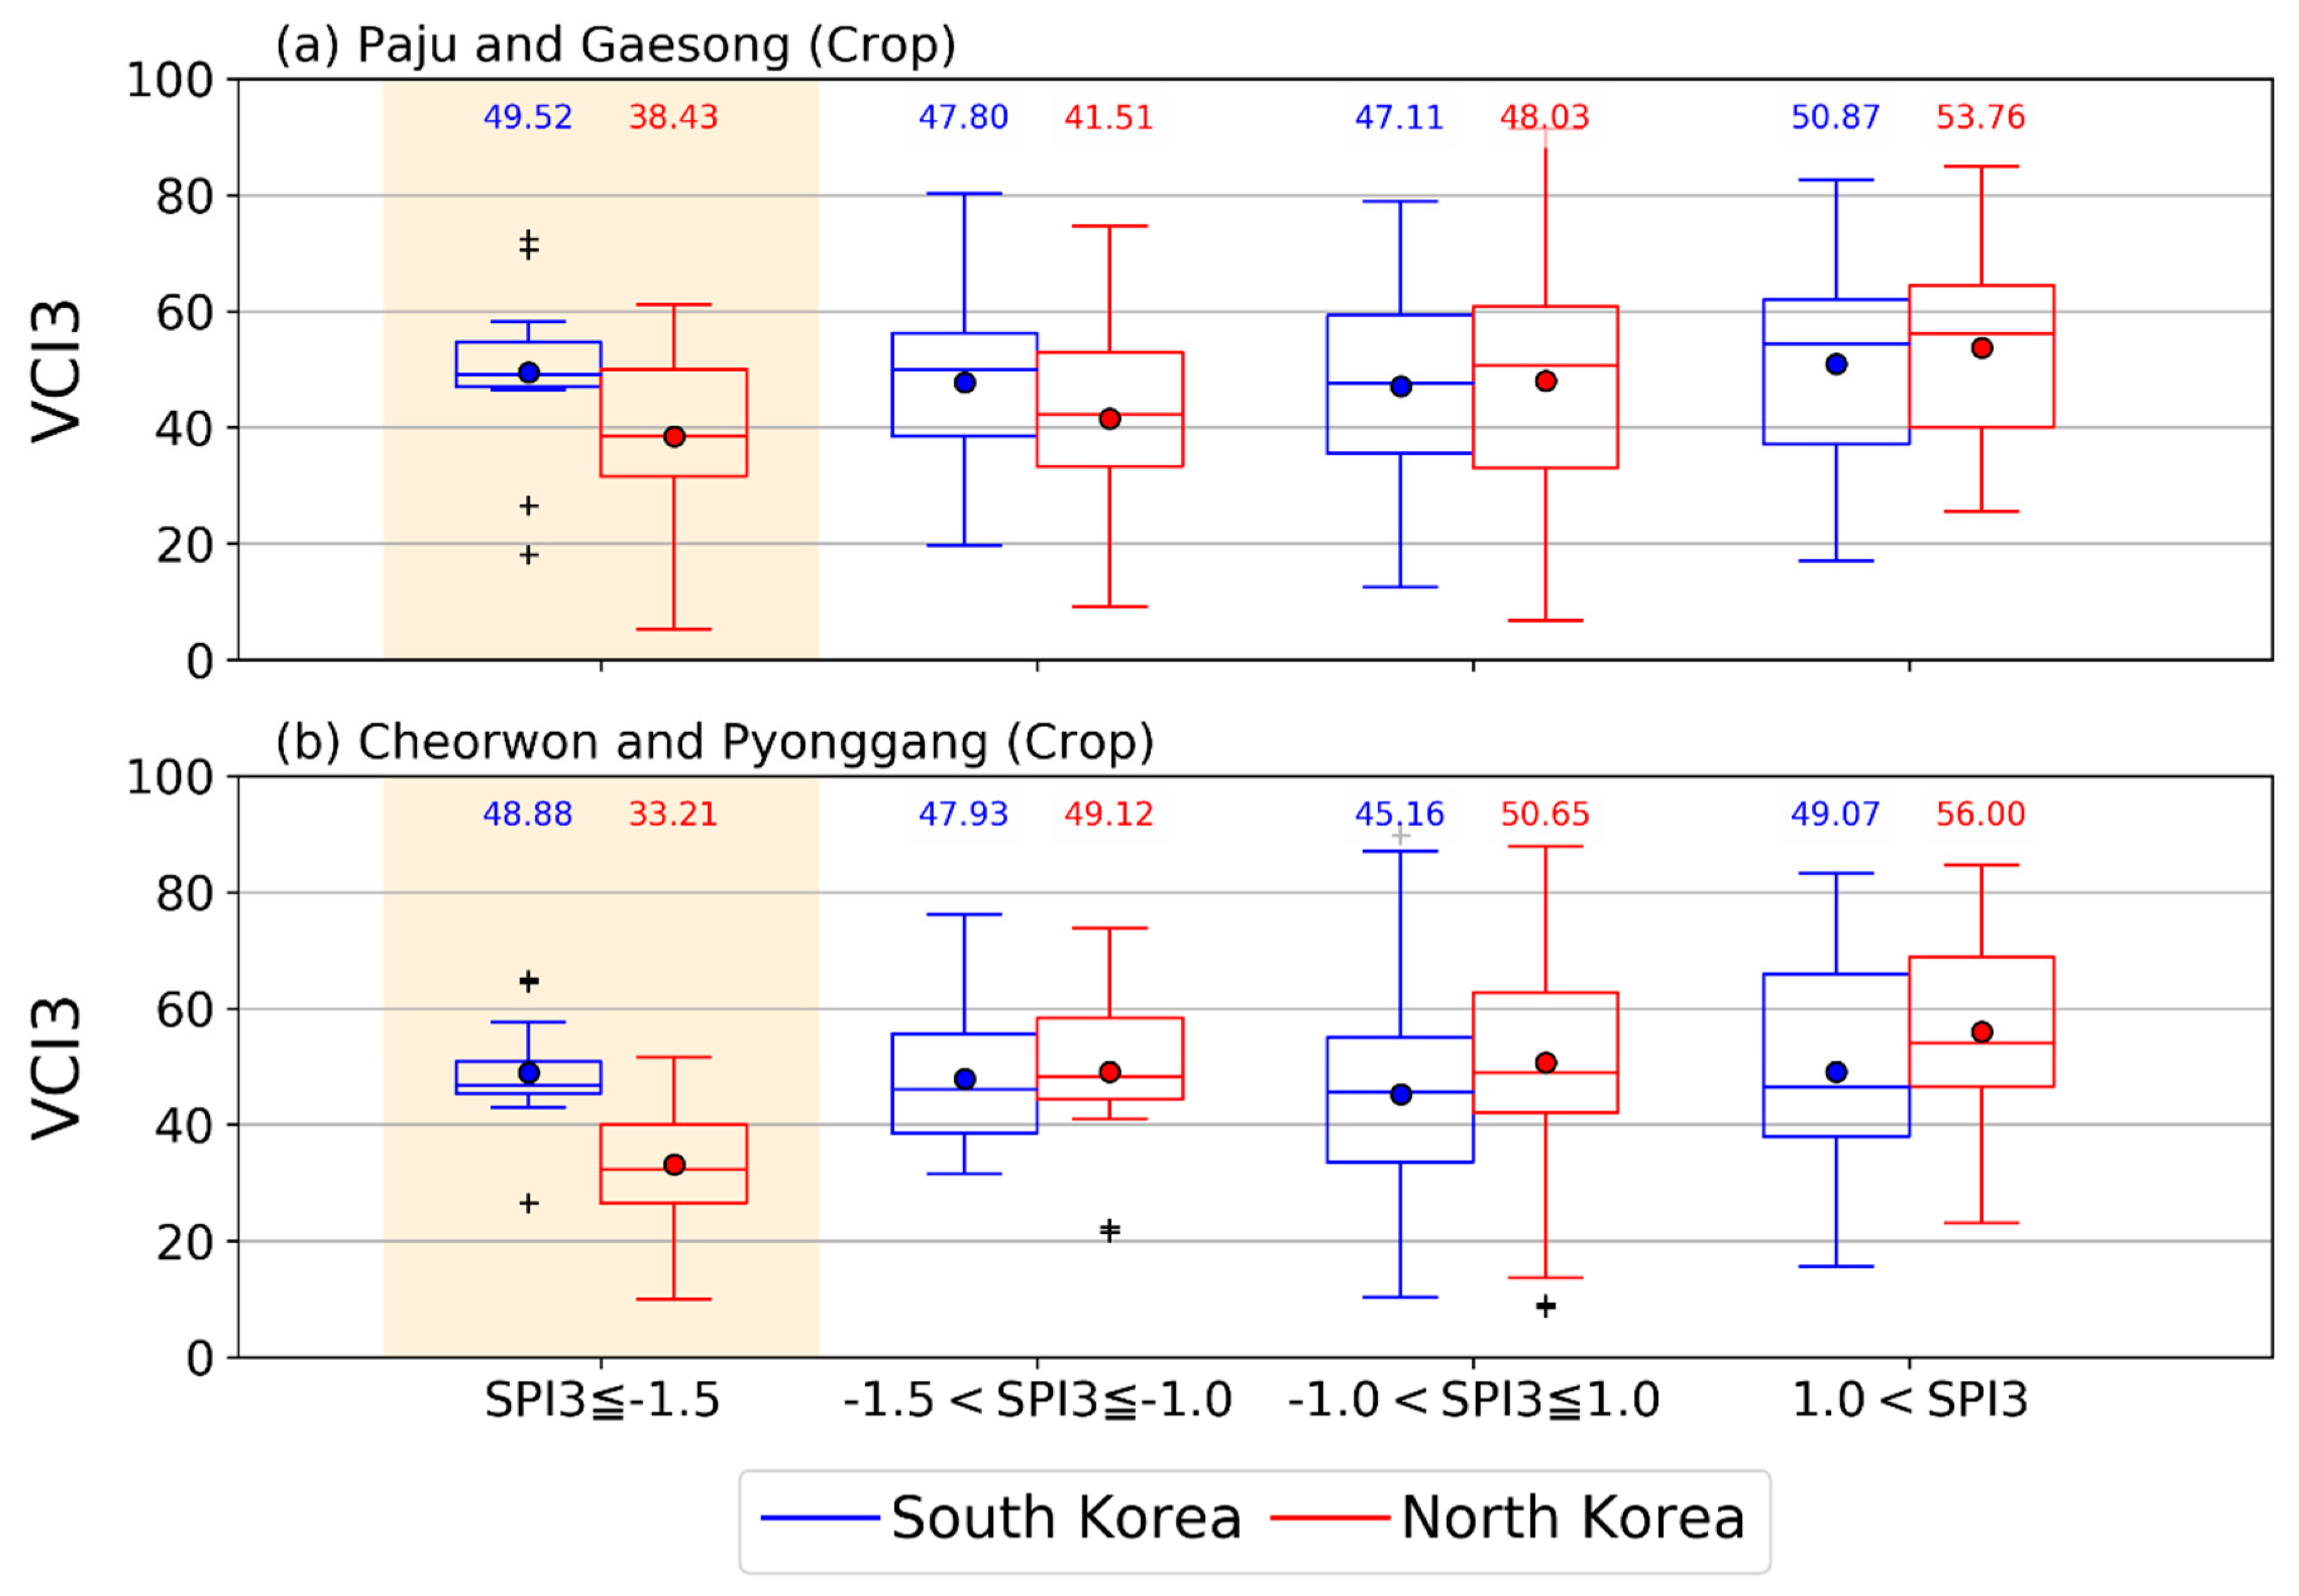
3.6. Relation between SPI3 and VCI3

Our results indicate that a different response to agricultural drought occured because of the variation in vegetation that was affected by the degree of meteorological drought condition. In Figure 9, the values of VCI3 are represented according to the SPI3 of meteorological drought classified as four levels: Extreme and severe (SPI3 −1.5), moderate (−1.5 SPI3 −1.0), normal (−1.0 < SPI3 1.0), and wet (1.0 < SPI3). The blue boxes indicate the results in South Korea, while the red boxes indicate those in North Korea.
The mean values of VCI3 in Paju were 49.52, 47.80, 47.11, and 50.87 on the four SPI3 levels, and were almost constant regardless of the meteorological drought (Figure 9a). In contrast, the VCI3s in Gaesong exhibited an increasing pattern from extreme to wet condition, as 38.43, 41.51, 48.03, and 53.76. These results were similarly represented in Cheorwon and Pyonggang. The mean values of VCI3 in Cheorwon (Pyonggagn) were 48.88, 47.93, 45.16,0, and 49.07 (33.21, 49.12, 50.65, and 56.00) depending on the levels of SPI3. The responses of VCI3 to SPI3 were different in South and North Korea.

4. Discussion

SPI indicates the values of long-term means and standard deviations of the observed precipitation. The calculation of VHI uses the minimum and maximum values of NDVI and LST. In general, NDVI and LST are affected by precipitation. Accordingly, our results showed that the temporal signal of increase and decrease patterns of VHI were similar to those of SPI. However, a strong correlation between SPI and VHI did not appear because there were some time lags among the temporal changes in SPI, VCI, and TCI. This delay is attributed to the differences in the definitions of the drought index and calculation methodology. This result is consistent with those obtained in previous studies [14]. For example, Zhang [18,52] indicated that the agricultural drought index increases with meteorological drought.
Artificial irrigation should relieve the damage caused by drought on the cropland [15,28,53]. Furthermore, given that about 71.8%–75.5% of annual precipitation in Korean Peninsula occurred in the monsoon rainy season (June to September), the river water reservoir will be more critical in agricultural management [54]. Therefore, the regional difference in the sensitivity of the agricultural drought index to the dryness condition can be expected in Korea. The VHI, VCI, and TCI result in South and North Korea over the drought season enable such characteristics, particularly in VCI. TCI3 exhibited similar temporal patterns between the neighboring country pairs of South and North Korea, but not VCI3 (Figure 6). In South Korea, the well-appointed irrigation systems affected the crop growth under drought conditions [33]. The number of reservoirs in South Korea is about nine times that in North Korea (Table 1). The irrigation canal for supplying water from the reservoirs in South Korea is also two times longer than that in North Korea. Although the number of pumping stations in North Korea is about seven times more than that in South Korea, it is just an evidence of the lack of irrigation facilities. Hence, VCI3 is held at a level such as that under the non-drought condition. However, the VCI3 in North Korea was dropped in 2014. In addition, the gap of VCI3 between South and North Korea became more significant in 2015 than in 2014 (Figure 6 and Figure 7) because it might be caused by the cumulative effect from the severe meteorological drought in 2014.
The physiological damage caused by drought on crop growth cannot continue until the next year because the annual crop is generally cultivated in South and North Korea. Therefore, the cumulative damage caused by drought on the cropland will be the degree of soil moisture in the deep soil layer and water storage in the reservoir-irrigation system. The Global land data assimilation system (GLDAS)/Noah model-based 3-month standardized soil moisture index (SSI3, 0–10 cm), which has a 0.25 degree of spatial resolution, decreased in the four counties during the drought years (Figure S1). In particular, in Paju and Gaesong, the minimum value of the SSI3 in 2015 was lower than that in 2014, even though the annual precipitation in 2015 was larger than that in 2014 (Figure S1a,b). According to a report of food and agriculture organization (FAO)/global information and early warning system (GIEWS) [34], the actual water consumption against the water demand in North Korea was about 41.67% in 2014 (Table 5). In addition, the inflow of water (m3/s) into Gunnam dam, located in the southern part DMZ of the Imjin River from North Korea to South Korea (Figure 1c), represented the lowest values in 2014 during 2010–2018 (Figure S2a). This can be attributed to stopping the discharge for holding the river water resource under a rainfall deficit [55,56]. Even though the statistical data on the water level of reservoirs in North Korea are not well-published, the severely low water resource reserve in the first drought year 2014 can be estimated to continue to the next year. Accordingly, the shortage of water storage would affect the crop growth in North Korea, despite becoming a soft meteorological drought in 2015.
The indices in this study also showed these phenomena through the cropland response. In South Korea, the agricultural drought indices in 2014 did not express severe or extreme conditions, although the meteorological drought was the worst. On the other hand, in North Korea, the lowest values of agricultural drought indices represented a more serious condition from 2014 to 2015, although the meteorological drought in the second drought year 2015 was weaker than that in first year 2014. This change to a stronger agricultural drought in North Korea is mainly attributed to the insufficient irrigation system [57,58]. Furthermore, the water shortage at the rice-planting time will bring more significant damage during the growth period. However, much of this initial damage can be recovered not only by the irrigation system but also by highly developed cultivation skills, such as re-planting by agricultural machines and chemical fertilizers. These skills in South Korea are commonly known to be better than the equivalent capabilities in North Korea. All these factors represent the different vulnerabilities of agricultural drought according to cropland management.
The different degrees of agricultural drought under similar meteorological drought conditions in South and North Korea should be associated with the gap of yields of major crops. According to the rural development administration (RDA) of South Korea, the measured yields for South Korea and the estimated yields for North Korea as per the cultivation acreage (as kilogram per square meter, kg/m2) (hereafter yield) on rice and maize increased in the first drought year of 2014, compared to the normal year 2013 (Table S1). The reasons for the increase in crop yield were not only more solar radiation energy from the sunny days under meteorological drought condition but also continuous water supply from sufficient water storage in the normal last year [59]. For example, the percentage of insolation duration 2014 over Paju was 56.68%, which was higher than the mean value (50.62%) during the 15 years. North Korea also exhibited an increase in the yield. Such crop yield situations in 2014 changed in the second year 2015 in both South Korea and North Korea. The rice yield (kg/m2) was reduced by about 6.6% in North Korea, but continuously increased by about 4.5% in South Korea. This might receive a benefit from the irrigation management of paddy fields in South Korea. In maize case, about 7.6% of yield decreased in North Korea, and the ratio of reduction on yield in South Korea was about 1.5% which is smaller than that in North Korea. The results related to the decrease in crop yield in North Korea were published from FAO/GIEWS [58,60] as well as RDA. In 2014, the yield of rice decreased by about −5.7% and the yield of maize increased by about 16.4% compared to 2013 [60]. In 2015, the yields of rice and maize decreased by about 16.5% and 7.5% in 2015 compared to 2014 [58]. These results meant that the damage on crop yield is large in the second drought year.
These yield data were consistent with the results of VCI3 in the cropland (Figure 6). The lower NDVI value was highly associated with the smaller yield by the damage on crop growth [61]. In the summer of the first meteorological drought year 2014, the VCI3s in Paju, Cheorwon, Gaesong, and Pyonggang did not indicate severe drought conditions. In the summer of the second drought year 2015, the VCI3 in South Korea continued to not indicate severe agricultural drought. On the other hand, extreme and severe agricultural drought conditions were observed in Gaesong and Pyonggang in North Korea.

5. Conclusions

The different agricultural responses to meteorological drought due to different cropland managements were identified in the neighboring counties of South and North Korea, which have similar climate conditions. The following conclusions were drawn:
(1)
The change in VHI3, an agricultural drought index, can causally occur from severe meteorological drought. The strength of the agricultural drought would then be worse in the second meteorological drought year due to the continuation of a water shortage.
(2)
Agriculture is essentially defined as an artificial management to enhance the crop plant value. However, the levels of cultivation skill and irrigation system can highly alleviate the strength of agricultural drought deepened from the meteorological dryness. The water shortage on the crop growth in South Korea can be overcome through the relatively high level of agricultural management, but it is not prevented in North Korea because of the relatively low level of agricultural management.
(3)
VHI consists of TCI and VCI. Both TCI and VCI reflect the land conditions. In South and North Korea, VCI has a different response to a similar lack of rainfall, unlike TCI, because the vegetation is critically affected by agricultural management, particularly as the irrigation system. The crop growth under meteorological drought condition is not decreased owing to the reservoir water and goes as far as to be increased with rich insolation duration.
(4)
The surface thermal condition, indicated by TCI, will be commonly influenced by solar radiation, air temperature, and soil moisture. However, the TCIs in South and North Korea are quite similar, even under different soil moisture conditions caused by the irrigation water supply. This weak effect on the TCI of soil moisture is not well-analyzed, and thus, further study is required in different regions with satellite images of various resolutions.
It is important to use a reasonable drought index depending on the purpose, because the indices developed in previous studies represented different drought conditions. Thus, it is necessary to comprehend the characteristic of each drought index to realize the drought damage. Furthermore, agricultural drought must analyze not only meteorological conditions (e.g., precipitation and insolation) but also agricultural management. Eventually, such well-monitored and understood agricultural drought will be helpful for evaluating the crop yield with in situ field data and crop model simulation.

Supplementary Materials

Supplementary materials can be accessed at https://www.mdpi.com/2072-4292/11/15/1773/s1. Figure S1, Time series of SPI3, SSI3, and VHI3 from July 2013 to June 2016, which included the drought years (2014–2015). Blue, green, red plots indicate SPI3, SSI3, and VHI3. Moccasin color means growing season (April–October) in Korean Peninsula. Figure S2, Time series of hydrological variables. (a) Inflow volume in Gunnam Dam located near DMZ, (b) Capacity of reservoirs in Paju, (c) Capacity of reservoirs in Cheorwon. Table S1, Yield of rice and maize in South and North Korea from 2013 to 2017.

Author Contributions

All authors contributed this paper. J.-H.R., the main author, designed the research, analyzed the remote sensing data, and wrote the manuscript; K.-S.H., Y.-W.L., N.-W.P., S.H., and C.-Y.C., the co-authors, reviewed the paper and contributed to the discussion; J.C., corresponding author, designed the research and wrote the manuscript.

Acknowledgments

This work was supported by “Development of Hydrology, wildfire, and statistical Applications” project, funded by ETRI, which is a subproject of “Development of Geostationary Meteorological Satellite Ground Segment (NMSC-2019-01)” program funded by NMSC (National Meteorological Satellite Center) of KMA (Korea Meteorological Administration).

Conflicts of Interest

The authors declare no conflict of interest.

References

  1. Hazaymeh, K.; Hassan, Q.K. Remote sensing of agricultural drought monitoring: A state of art review. AIMS Environ. Sci. 2016, 3, 604–630. [Google Scholar] [CrossRef]
  2. Du, L.; Tian, Q.; Yu, T.; Meng, Q.; Jancso, T.; Udvardy, P.; Huang, Y. A comprehensive drought monitoring method integrating MODIS and TRMM data. Int. J. Appl. Earth Obs. Geoinf. 2013, 23, 245–253. [Google Scholar] [CrossRef]
  3. Yu, C.; Li, C.; Xin, Q.; Chen, H.; Zhang, J.; Zhang, F.; Li, X.; Clinton, N.; Huang, X.; Yue, Y.; et al. Dynamic assessment of the impact of drought on agricultural yield and scale-dependent return periods over large geographic regions. Environ. Model. Softw. 2014, 62, 454–464. [Google Scholar] [CrossRef] [Green Version]
  4. Spinoni, J.; Naumann, G.; Carrao, H.; Barbosa, P.; Vogt, J. World drought frequency, duration, and severity for 1951–2010. Int. J. Climatol. 2014, 34, 2792–2804. [Google Scholar] [CrossRef]
  5. Nam, W.H.; Hayes, M.J.; Svoboda, M.D.; Tadesse, T.; Wilhite, D.A. Drought hazard assessment in the context of climate change for South Korea. Agric. Water Manag. 2015, 160, 106–117. [Google Scholar] [CrossRef]
  6. Anjum, S.A.; Ashraf, U.; Zohaib, A.; Tanveer, M.; Naeem, M.; Ali, I.; Tabassum, T.; Nazir, U. Growth and development responses of crop plants under drought stress: A review. Zemdirbyste 2017, 104, 267–276. [Google Scholar] [CrossRef]
  7. Yu, M.; Cho, Y.; Kim, T.W.; Chae, H.S. Analysis of drought propagation using hydrometeorological data: From meteorological drought to agricultural drought. J. Korea Water Resour. Assoc. 2018, 51, 195–205, (In Korean with English Abstract). [Google Scholar] [CrossRef]
  8. Bandara, J.S.; Cai, Y. The impact of climate change on food crop productivity, food prices and food security in South Asia. Econ. Anal. Policy 2014, 44, 451–465. [Google Scholar] [CrossRef]
  9. Liu, X.; Zhu, X.; Pan, Y.; Li, S.; Liu, Y.; Ma, Y. Agricultural drought monitoring: Progress, challenges, and prospects. J. Geogr. Sci. 2016, 26, 750–767. [Google Scholar] [CrossRef] [Green Version]
  10. Manesh, M.B.; Khosravi, H.; Alamdarloo, E.H.; Alekasir, M.S.; Gholami, A.; Singh, V.P. Linkage of agricultural drought with meteorological drought in different climates of Iran. Theor. Appl. Climatol. 2019, 1–9. [Google Scholar] [CrossRef]
  11. Kogan, F.N. Operational space technology for global vegetation assessment. Bull. Am. Meteorol. Soc. 2001, 82, 1949–1964. [Google Scholar] [CrossRef]
  12. AghaKouchak, A.; Farahmand, A.; Melton, F.S.; Teixeira, J.; Anderson, M.C.; Wardlow, B.D.; Hain, C.R. Remote sensing of drought: Progress, challenges and opportunities. Rev. Geophys. 2015, 53, 452–480. [Google Scholar] [CrossRef] [Green Version]
  13. Du, T.; Bui, D.; Nguyen, M.; Lee, H. Satellite-Based, Multi-Indices for Evaluation of Agricultural Droughts in a Highly Dynamic Tropical Catchment, Central Vietnam. Water 2018, 10, 659. [Google Scholar] [CrossRef]
  14. Zhang, L.; Jiao, W.; Zhang, H.; Huang, C.; Tong, Q. Studying drought phenomena in the Continental United States in 2011 and 2012 using various drought indices. Remote Sens. Environ. 2017, 190, 96–106. [Google Scholar] [CrossRef]
  15. Park, S.; Im, J.; Jang, E.; Rhee, J. Drought assessment and monitoring through blending of multi-sensor indices using machine learning approaches for different climate regions. Agric. For. Meteorol. 2016, 216, 157–169. [Google Scholar] [CrossRef]
  16. Park, S.Y.; Sur, C.; Kim, J.S.; Lee, J.H. Evaluation of multi-sensor satellite data for monitoring different drought impacts. Stoch. Environ. Res. Risk Assess. 2018, 32, 2551–2563. [Google Scholar] [CrossRef]
  17. Wu, D.; Qu, J.J.; Hao, X. Agricultural drought monitoring using MODIS-based drought indices over the USA Corn Belt. Int. J. Remote Sens. 2015, 36, 5403–5425. [Google Scholar] [CrossRef]
  18. Zhang, X.; Chen, N.; Li, J.; Chen, Z.; Niyogi, D. Multi-sensor integrated framework and index for agricultural drought monitoring. Remote Sens. Environ. 2017, 188, 141–163. [Google Scholar] [CrossRef] [Green Version]
  19. Ji, L.; Peters, A.J. Assessing vegetation response to drought in the northern Great Plains using vegetation and drought indices. Remote Sens. Environ. 2003, 87, 85–98. [Google Scholar] [CrossRef]
  20. Mishra, A.K.; Desai, V.R.; Singh, V.P. Drought forecasting using a hybrid stochastic and neural network model. J. Hydrol. Eng. 2007, 12, 626–638. [Google Scholar] [CrossRef]
  21. Sandholt, I.; Rasmussen, K.; Andersen, J. A simple interpretation of the surface temperature/vegetation index space for assessment of surface moisture status. Remote Sens. Environ. 2002, 79, 213–224. [Google Scholar] [CrossRef]
  22. Nishida, K.; Nemani, R.R.; Glassy, J.M.; Running, S.W. Development of an evapotranspiration index from Aqua/MODIS for monitoring surface moisture status. IEEE Trans. Geosci. Remote Sens. 2003, 41, 493–501. [Google Scholar] [CrossRef]
  23. Cho, J.; Ryu, J.H.; Yeh, P.J.F.; Lee, Y.W.; Hong, S. Satellite-based assessment of Amazonian surface dryness due to deforestation. Remote Sens. Lett. 2016, 7, 71–80. [Google Scholar] [CrossRef]
  24. Kogan, F. World droughts in the new millennium from AVHRR-based vegetation health indices. Eos Trans. Am. Geophys. Union 2002, 83, 557–563. [Google Scholar] [CrossRef]
  25. Jing, Y.; Li, J.; Weng, Y.; Wang, J. The assessment of drought relief by typhoon Saomai based on MODIS remote sensing data in Shanghai, China. Nat. Hazards 2014, 71, 1215–1225. [Google Scholar] [CrossRef]
  26. Cunha, A.P.M.; Alvalá, R.C.; Nobre, C.A.; Carvalho, M.A. Monitoring vegetative drought dynamics in the Brazilian semiarid region. Agric. For. Meteorol. 2015, 214, 494–505. [Google Scholar] [CrossRef]
  27. Mishra, A.K.; Singh, V.P. A review of drought concepts. J. Hydrol. 2010, 391, 202–216. [Google Scholar] [CrossRef]
  28. Qian, X.; Liang, L.; Shen, Q.; Sun, Q.; Zhang, L.; Liu, Z.; Zhao, S.; Qin, Z. Drought trends based on the VCI and its correlation with climate factors in the agricultural areas of China from 1982 to 2010. Environ. Monit. Assess. 2016, 188, 639. [Google Scholar] [CrossRef]
  29. Wilhelmi, O.V.; Wilhite, D.A. Assessing vulnerability to agricultural drought: A Nebraska case study. Nat. Hazards 2002, 25, 37–58. [Google Scholar] [CrossRef]
  30. Miyan, M.A. Droughts in Asian least developed countries: Vulnerability and sustainability. Weather Clim. Extrem. 2015, 7, 8–23. [Google Scholar] [CrossRef]
  31. Hwang, S.K. Explanation of Major Indicators. In Major Statistics Indicators of North Korea; Yoon, Y.O., Ed.; Statistics Korea: Daejeon, Korea, 2017; ISSN 2005-5242. Available online: http://kosis.kr/upsHtml/upload/Magazine/NEW/IF/bukhanY17.pdf (accessed on 18 July 2019).
  32. Hwang, S.K. Statistical Indicators of South & North Korea. In Major Statistics Indicators of North Korea; Yoon, Y.O., Ed.; Statistics Korea: Daejeon, Korea, 2017; ISSN 2005-5242. Available online: http://kosis.kr/upsHtml/upload/Magazine/NEW/IF/bukhanY17.pdf (accessed on 18 July 2019).
  33. Rhie, J.H.; Lee, K.S.; Seo, I.H.; Min, S.W.; Chung, D.Y. Assessing the Limits of Agricultural Situation for the Food Security in North Korea. Korean J. Soil. Sci. Fert. 2017, 50, 275–284. [Google Scholar] [CrossRef] [Green Version]
  34. UN Food and Agriculture Organization (FAO). Global Information and Early Warning System (GIEWS). Special Alert No. 340. 2017. Available online: http://www.fao.org/3/a-i7544e.pdf (accessed on 18 July 2019).
  35. Ministry for Food, Agriculture, Forestry and Fisheries; Korea Rural Community Corporation Statistical Tables. Statistical Yearbook of Land and Water Development for Agriculture 2016; Korea Rural Community Corporation, Rural Research Institute, Ed.; Ministry for Food, Agriculture, Forestry and Fisheries: Ansan, Korea; Korea Rural Community Corporation: Ansan, Korea, 2017; Available online: http://rims.ekr.or.kr/stat_print/doun/2017.pdf (accessed on 18 July 2019).
  36. Jang, J.S. Basic research. In Research Report 2016; Rural Research Institute: Ansan, Korea, 2017; Available online: https://rri.ekr.or.kr/cop/bbs/selectBoardArticle.do?bbsId=BBSMSTR_000000000039&nttId=4609&bbsTyCode=BBST01&bbsAttrbCode=BBSB02&authFlag=&pageIndex=1&searchBgnDe=&searchEndDe=&searchCnd=&searchWrd=&year=&searchNat=&searchOrg=&searchCd=&searchCo=&koYn=Y (accessed on 18 July 2019).
  37. Chen, J.; Chen, J.; Liao, A.; Cao, X.; Chen, L.; Chen, X.; He, C.; Han, G.; Peng, S.; Lu, M.; et al. Global land cover mapping at 30 m resolution: A POK-based operational approach. ISPRS J. Photogramm. Remote Sens. 2015, 103, 7–27. [Google Scholar] [CrossRef]
  38. Son, S.; Kim, J. Accuracy assessment of global land cover datasets in South Korea. Korean J. Remote Sens. 2018, 34, 601–610. [Google Scholar] [CrossRef]
  39. Wilhite, D.A.; Hayes, M.J.; Knutson, C.L. Drought preparedness planning: Building institutional capacity. In Drought and Water Crises: Science, Technology, and Management Issues; Wilhite, D.A., Ed.; CRC Press: Boca Raton, FL, USA, 2005; pp. 93–135. [Google Scholar]
  40. Belal, A.A.; El-Ramady, H.R.; Mohamed, E.S.; Saleh, A.M. Drought risk assessment using remote sensing and GIS techniques. Arab. J. Geosci. 2014, 7, 35–53. [Google Scholar] [CrossRef]
  41. McKee, T.B.; Doesken, N.J.; Kleist, J. The relationship of drought frequency and duration to time scales. In Proceedings of the 8th Conference on Applied Climatology, Anaheim, CA, USA, 17–22 January 1993; pp. 179–184. [Google Scholar]
  42. Vicente-Serrano, S.M. Differences in spatial patterns of drought on different time scales: An analysis of the Iberian Peninsula. Water Resour. Manag. 2006, 20, 37–60. [Google Scholar] [CrossRef]
  43. Mu, Q.; Zhao, M.; Kimball, J.S.; McDowell, N.G.; Running, S.W. A remotely sensed global terrestrial drought severity index. Bull. Am. Meteorol. Soc. 2013, 94, 83–98. [Google Scholar] [CrossRef]
  44. Rimkus, E.; Stonevičius, E.; Korneev, V.; Kažys, J.; Valiuškevičius, G.; Pakhomau, A. Dynamics of meteorological and hydrological droughts in the Neman river basin. Environ. Res. Lett. 2013, 8, 045014. [Google Scholar] [CrossRef] [Green Version]
  45. Cunha, A.P.M.; Tomasella, J.; Ribeiro-Neto, G.G.; Brown, M.; Garcia, S.R.; Brito, S.B.; Carvalho, M.A. Changes in the spatial–temporal patterns of droughts in the Brazilian Northeast. Atmos. Sci. Lett. 2018, 19, e855. [Google Scholar] [CrossRef]
  46. Sepulcre-Canto, G.; Horion, S.M.A.F.; Singleton, A.; Carrao, H.; Vogt, J. Development of a Combined Drought Indicator to detect agricultural drought in Europe. Nat. Hazards Earth Syst. Sci. 2012, 12, 3519–3531. [Google Scholar] [CrossRef] [Green Version]
  47. Zhang, Q.; Sun, P.; Li, J.; Singh, V.P.; Liu, J. Spatiotemporal properties of droughts and related impacts on agriculture in Xinjiang, China. Int. J. Climatol. 2015, 35, 1254–1266. [Google Scholar] [CrossRef]
  48. Korean Meteorological Administration Home Page. Available online: https://data.kma.go.kr (accessed on 18 July 2019).
  49. Sobrino, J.A.; Li, Z.L.; Stoll, M.P.; Becker, F. Improvements in the split-window technique for land surface temperature determination. IEEE Trans. Geosci. Remote Sens. 1994, 32, 243–253. [Google Scholar] [CrossRef]
  50. Cong, D.; Zhao, S.; Chen, C.; Duan, Z. Characterization of droughts during 2001–2014 based on remote sensing: A case study of Northeast China. Ecol. Inform. 2017, 39, 56–67. [Google Scholar] [CrossRef]
  51. Ma’rufah, U.; Hidayat, R.; Prasasti, I. Analysis of relationship between meteorological and agricultural drought using standardized precipitation index and vegetation health index. IOP Conf. Ser. Earth Environ. Sci. 2017, 54, 012008. [Google Scholar] [CrossRef]
  52. Zhang, X.; Wei, C.; Obringer, R.; Li, D.; Chen, N.; Niyogi, D. Gauging the severity of the 2012 Midwestern US drought for agriculture. Remote Sens. 2017, 9, 767. [Google Scholar] [CrossRef]
  53. Gessner, U.; Naeimi, V.; Klein, I.; Kuenzer, C.; Klein, D.; Dech, S. The relationship between precipitation anomalies and satellite-derived vegetation activity in Central Asia. Glob. Planet. Chang. 2013, 110, 74–87. [Google Scholar] [CrossRef]
  54. Ahn, S.R.; Park, M.J.; Park, G.; Kim, S.J. The effect of meteorological factors on the temporal variation of agricultural reservoir storage. J. Korean Soc. Agric. Eng. 2007, 49, 3–12, (In Korean with English Abstract). [Google Scholar] [CrossRef]
  55. Lee, M.K.; Lee, H.S.; Jang, S.H.; Lee, J.K. An Assessment of Continuous Streamflow Simulation at Imjin River Shared by South and North Korea. Crisisonomy 2017, 13, 109–118, (In Korean with English Abstract). [Google Scholar] [CrossRef]
  56. Jang, S.H.; Lee, J.K.; Oh, J.H.; Lee, H.S. Drought and water deficit analysis in Imjin river basin: Focusing on influence of Hwanggang dam in North Korea. Crisisonomy 2016, 12, 79–95, (In Korean with English Abstract). [Google Scholar] [CrossRef]
  57. Kamara, A.Y.; Menkir, A.; Badu-Apraku, B.; Ibikunle, O. The influence of drought stress on growth, yield and yield components of selected maize genotypes. J. Agric. Sci. 2003, 141, 43–50. [Google Scholar] [CrossRef]
  58. UN Food and Agriculture Organization (FAO). Global Information and Early Warning System (GIEWS). GIEWS Updates. 27 April 2016. Available online: http://www.fao.org/3/a-i5572e.pdf (accessed on 18 July 2019).
  59. Takai, T.; Matsuura, S.; Nishio, T.; Ohsumi, A.; Shiraiwa, T.; Horie, T. Rice yield potential is closely related to crop growth rate during late reproductive period. Field Crops Res. 2006, 96, 328–335. [Google Scholar] [CrossRef]
  60. UN Food and Agriculture Organization (FAO). Global Information and Early Warning System (GIEWS). GIEWS Updates. 3 February 2015. Available online: http://www.fao.org/3/a-i4363e.pdf (accessed on 18 July 2019).
  61. Hong, S.Y.; Na, S.I.; Lee, K.D.; Kim, Y.S.; Baek, S.C. A study on estimating rice yield in DPRK using MODIS NDVI and rainfall data. Korean J. Remote Sens. 2015, 31, 441–448. [Google Scholar] [CrossRef]
Figure 1. (a) Korean Peninsula-covered MODIS landcover; (b) Study area-covered Globeland30 (GL30); (c) Major rivers and streams. Imjin River and North Han River are the major shared rivers from North Korea to South Korea. Paju and Cheorwon counties were selected in South Korea, and Gaesong and Pyonggang counties were selected in North Korea. Blue (Red) lines indicate administrative boundary lines in South Korea (North Korea). Orange circles indicate the weather stations located in the counties.
Remotesensing 11 01773 g001
Figure 2. Mean monthly precipitation during 2003–2017 (grey bars), 2014 (red bars), and 2015 (gold bars), and the difference in mean monthly air temperatures in 2014 and 2015 relative to the normal year (mean values during 2003−2017) for (a) Paju, (b) Gaesong, (c) Cherowon, and (d) Pyonggang.
Remotesensing 11 01773 g002
Figure 3. Difference of monthly meteorological variables between counties located in South and North Korea. Dark gray (Gold) color indicates the percentage on difference of variables from 2003 to 2017 (2014 to 2015). Differen ce in (a) air temperature between Paju and Gaesong, (b) air temperature between Cheorwon and Pyonggang, (c) precipitation between Paju and Gaesong, and (d) precipitation between Cheorwon and Pyonggang. The dash and dotted lines indicate the difference below 1 °C and 2 °C (25 mm/month and 50 mm/month) between air temperatures (precipitations) of two counties for 15 years, where the percentages indicate the cumulative values under each condition.
Remotesensing 11 01773 g003
Figure 4. Time series of SPI3 from 2003 to 2017. Blue colors indicate positive values of SPI3, while red colors indicate negative values of SPI3. (a) Bar expresses SPI3 in Paju located in South Korea, and plot shows SPI3 in Gaesong located in North Korea. (b) Bar expresses SPI3 in Cheorwon located in South Korea, while plot shows SPI3 in Pyonggagn located in North Korea.
Remotesensing 11 01773 g004
Figure 5. Time series of SPI3 and VHI3 from July 2013 to June 2016, which included the drought years (2014–2015). Blue plots indicate SPI3, while red plots indicate VHI3. Moccasin color means the growing season (April–October) in the Korean Peninsula. (a) SPI3 and VHI3 in Paju, (b) SPI3 and VHI3 in Gaesong, (c) SPI3 and VHI3 in Cheorwon, and (d) SPI3 and VHI3 in Pyonggang.
Remotesensing 11 01773 g005
Figure 6. Time series of TCI3 and VCI3 from July 2013 to June 2016 that included drought years (2014–2015). Blue colors indicate drought indices in South Korea, and red colors indicate those in North Korea. Moccasin color indicates growing season (April–October) in Korean Peninsula. (a) TCI3 in Paju and Gaesong, (b) VCI3 in Paju and Gaesong, (c) TCI3 in Cheorwon and Pyonggang, and (d) TCI3 in Cheorwon and Pyonggang.
Remotesensing 11 01773 g006
Figure 7. Maps of drought indices in September 2014 and in July 2015. (ad) SPI3, VHI3, TCI3, and VCI3 in September 2014. (eh) SPI3, VHI3, TCI3, and VCI3 in July 2015. SPI3 was interpolated on the basis of the point data observed by weather stations.
Remotesensing 11 01773 g007
Figure 8. Relation between VCI3 and capacity of reservoirs from April to July in Paju and Cheorwon. The capacity of reservoirs is the weighted mean value depending on the size of reservoir located in the county.
Remotesensing 11 01773 g008
Figure 9. Boxplot for VCI3 in cropland of (a) Paju and Gaesong and (b) Cheorwon and Pyonggang according to meteorological drought conditions. Blue (Red) boxplots are the results in South (North) Korea. Each step means extreme and severe (SPI3 −1.5), moderate (−1.5 < SPI3 −1.0), normal (−1.0 < SPI3 1.0), and wet (1.0 < SPI3) conditions. Moccasin color represents the results of VCI3 for the drought years (2014–2015).
Remotesensing 11 01773 g009
Table 1. Information on agricultural area and irrigation facilities in South and North Korea in 2016 [31,35,36].
Agricultural Area (km2)aNumber of ReservoirsNumber of Pumping StationIrrigation Canal (km)a
South Korea16,46017,313 7,052117,457
North Korea19,100191036,40051,400
a km: kilometer
Table 2. Drought classes of SPI, VHI, TCI, and VCI [11,16,41].
Range of SPIDrought Classes of SPIRange of VHI, TCI, and VCIDrought Classes of VHI, TCI, and VCI
More than 2.00Extremely wetMore than 60.00Wet
1.50 to 1.99Very wet
1.00 to 1.49Moderately wet
−0.99 to 0.99Near normal40.00 to 59.99Normal
−1.00 to −1.49Moderately dry30.00 to 30.99Mild
20.00 to 20.99Moderate
−1.50 to −1.99Severely dry10.00 to 10.99Severe
Less than −2.00Extremely dry0.00 to 9.99Extreme
Table 3. Meteorological and agricultural drought indices.
ObservationData TypeDrought IndexInput VariablesPeriods
Weather stationsVector (Point)SPI33-month Precipitation2003–2017
Satellite (Aqua/MODIS)Raster (1 × 1 km pixel)VHI3VCI3, TCI32003–2017
VCI33-month NDVI2003–2017
TCI33-month LST2003–2017
Table 4. Maximum duration, mean value of the drought index, and intensity of the drought in 2014 and 2015 depending on the county in South and North Korea.
CountyDrought
Variables
20142015
SPI3VHI3TCI3VCI3SPI3VHI3TCI3VCI3
Paju
(South Korea)
Durationa 7491610123
Mean valueb−1.7029.9121.7537.88−1.6026.7612.0227.13
Intensityc−2.3024.532.5837.88−2.1314.4512.0224.96
Gaesong
(North Korea)
Duration99128912108
Mean value−1.6026.8422.6831.41−1.3221.777.5620.03
Intensity−2.3721.271.6324.27−1.974.671.225.17
Cheorwon
(South Korea)
Duration836115103
Mean value−1.9326.1717.9534.81−1.1232.2118.4335.32
Intensity−3.0123.991.4934.81−1.1227.070.1832.18
Pyonggagn
(North Korea)
Duration444301087
Mean value−1.8323.4215.1315.3821.087.6220.53
Intensity−2.4315.223.939.188.112.2411.13
a The maximum number of consecutive drought months (Unit: Month). b The mean value of the drought index during the maximum duration. c The lowest value of the drought index during the maximum duration is represented as drought intensity.
Table 5. Water volume of reservoirs located in North Korea [34].
YearTarget
(10 million m3)
Actual
(10 million m3)
Actual/Target
(%)
2012357375105.04%
2013357364101.96%
201424010041.67%
201524523395.10%
201623523399.15%

