Characterizing Crop Water Use Dynamics in the Central Valley of California Using Landsat-Derived Evapotranspiration
Abstract
:1. Introduction
2. Materials and Methods
2.1. Study Area
2.2. Landsat
2.3. The SSEBop Modeling Approach
2.4. USDA-NASS Cropland Data Layer (CDL)
2.5. County Crop Acreage Reports
2.6. Kern County Crop Boundaries
2.7. Other Datasets
2.8. Water Use Estimates and Net Irrigation
2.9. Trend Analysis
3. Results
3.1. Crop Water Use in the Central Valley 2008–2018
3.2. County-Scale Crop Water Use—Kern County, 1999–2018
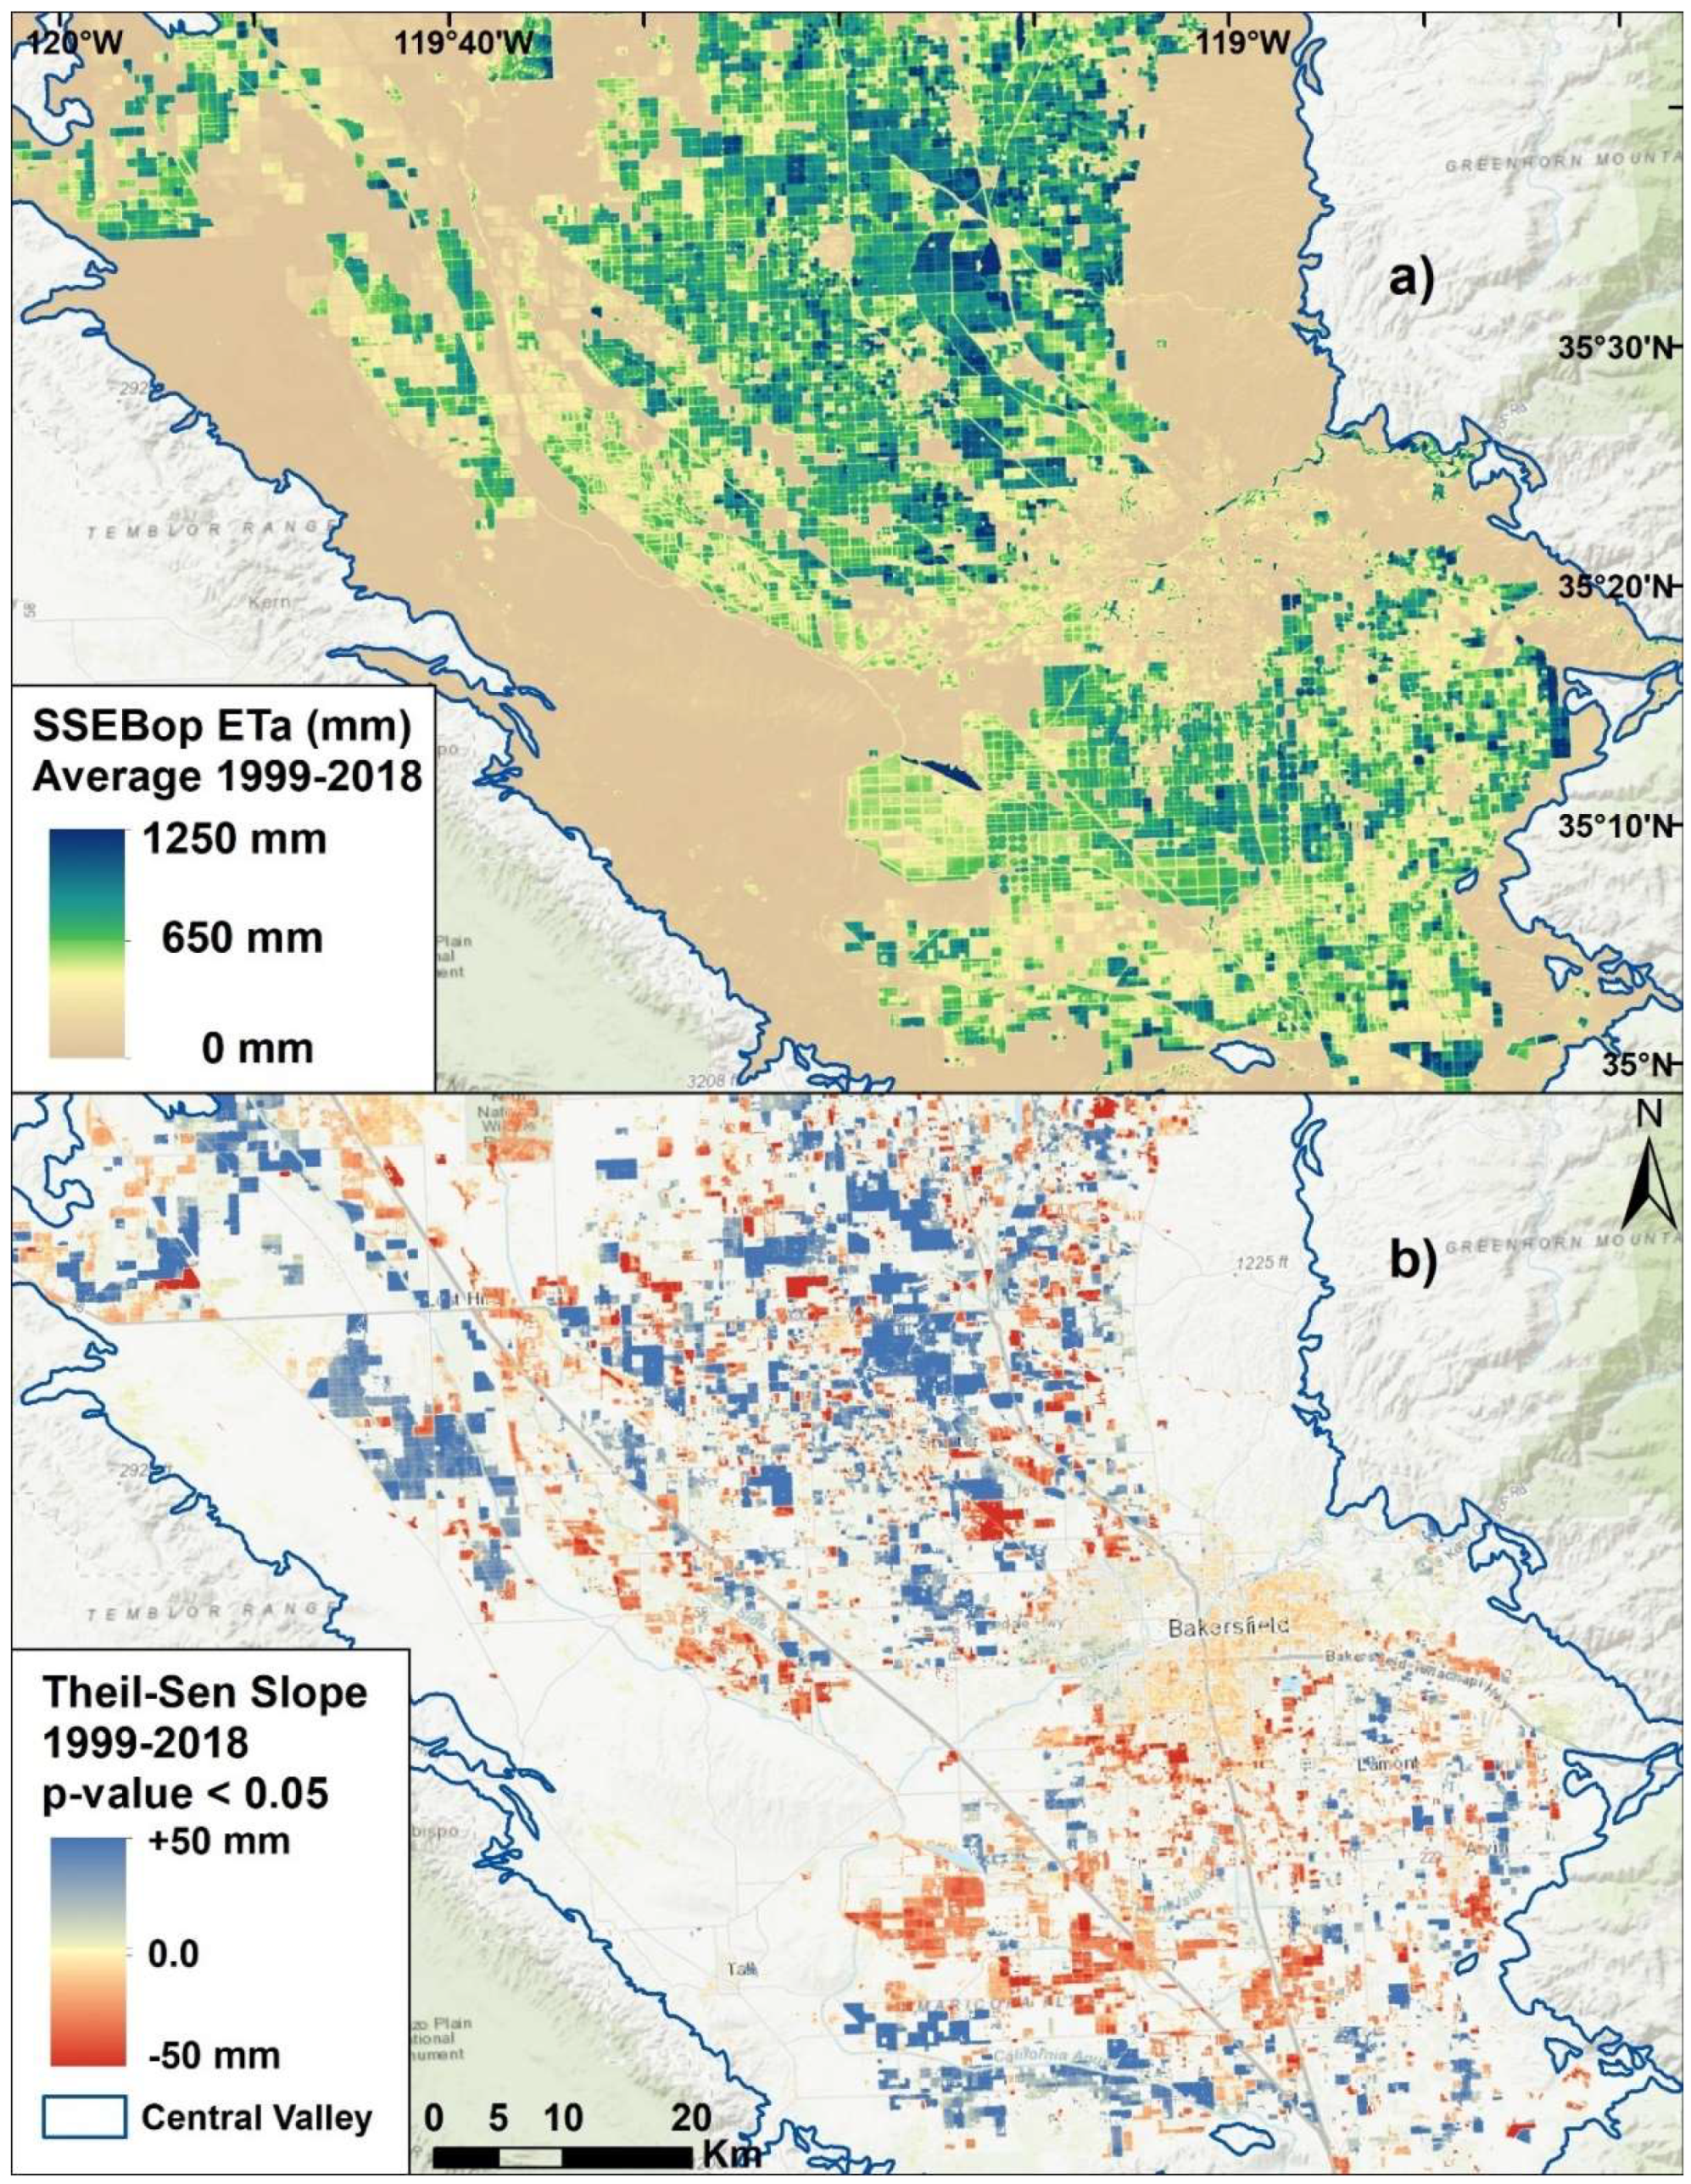
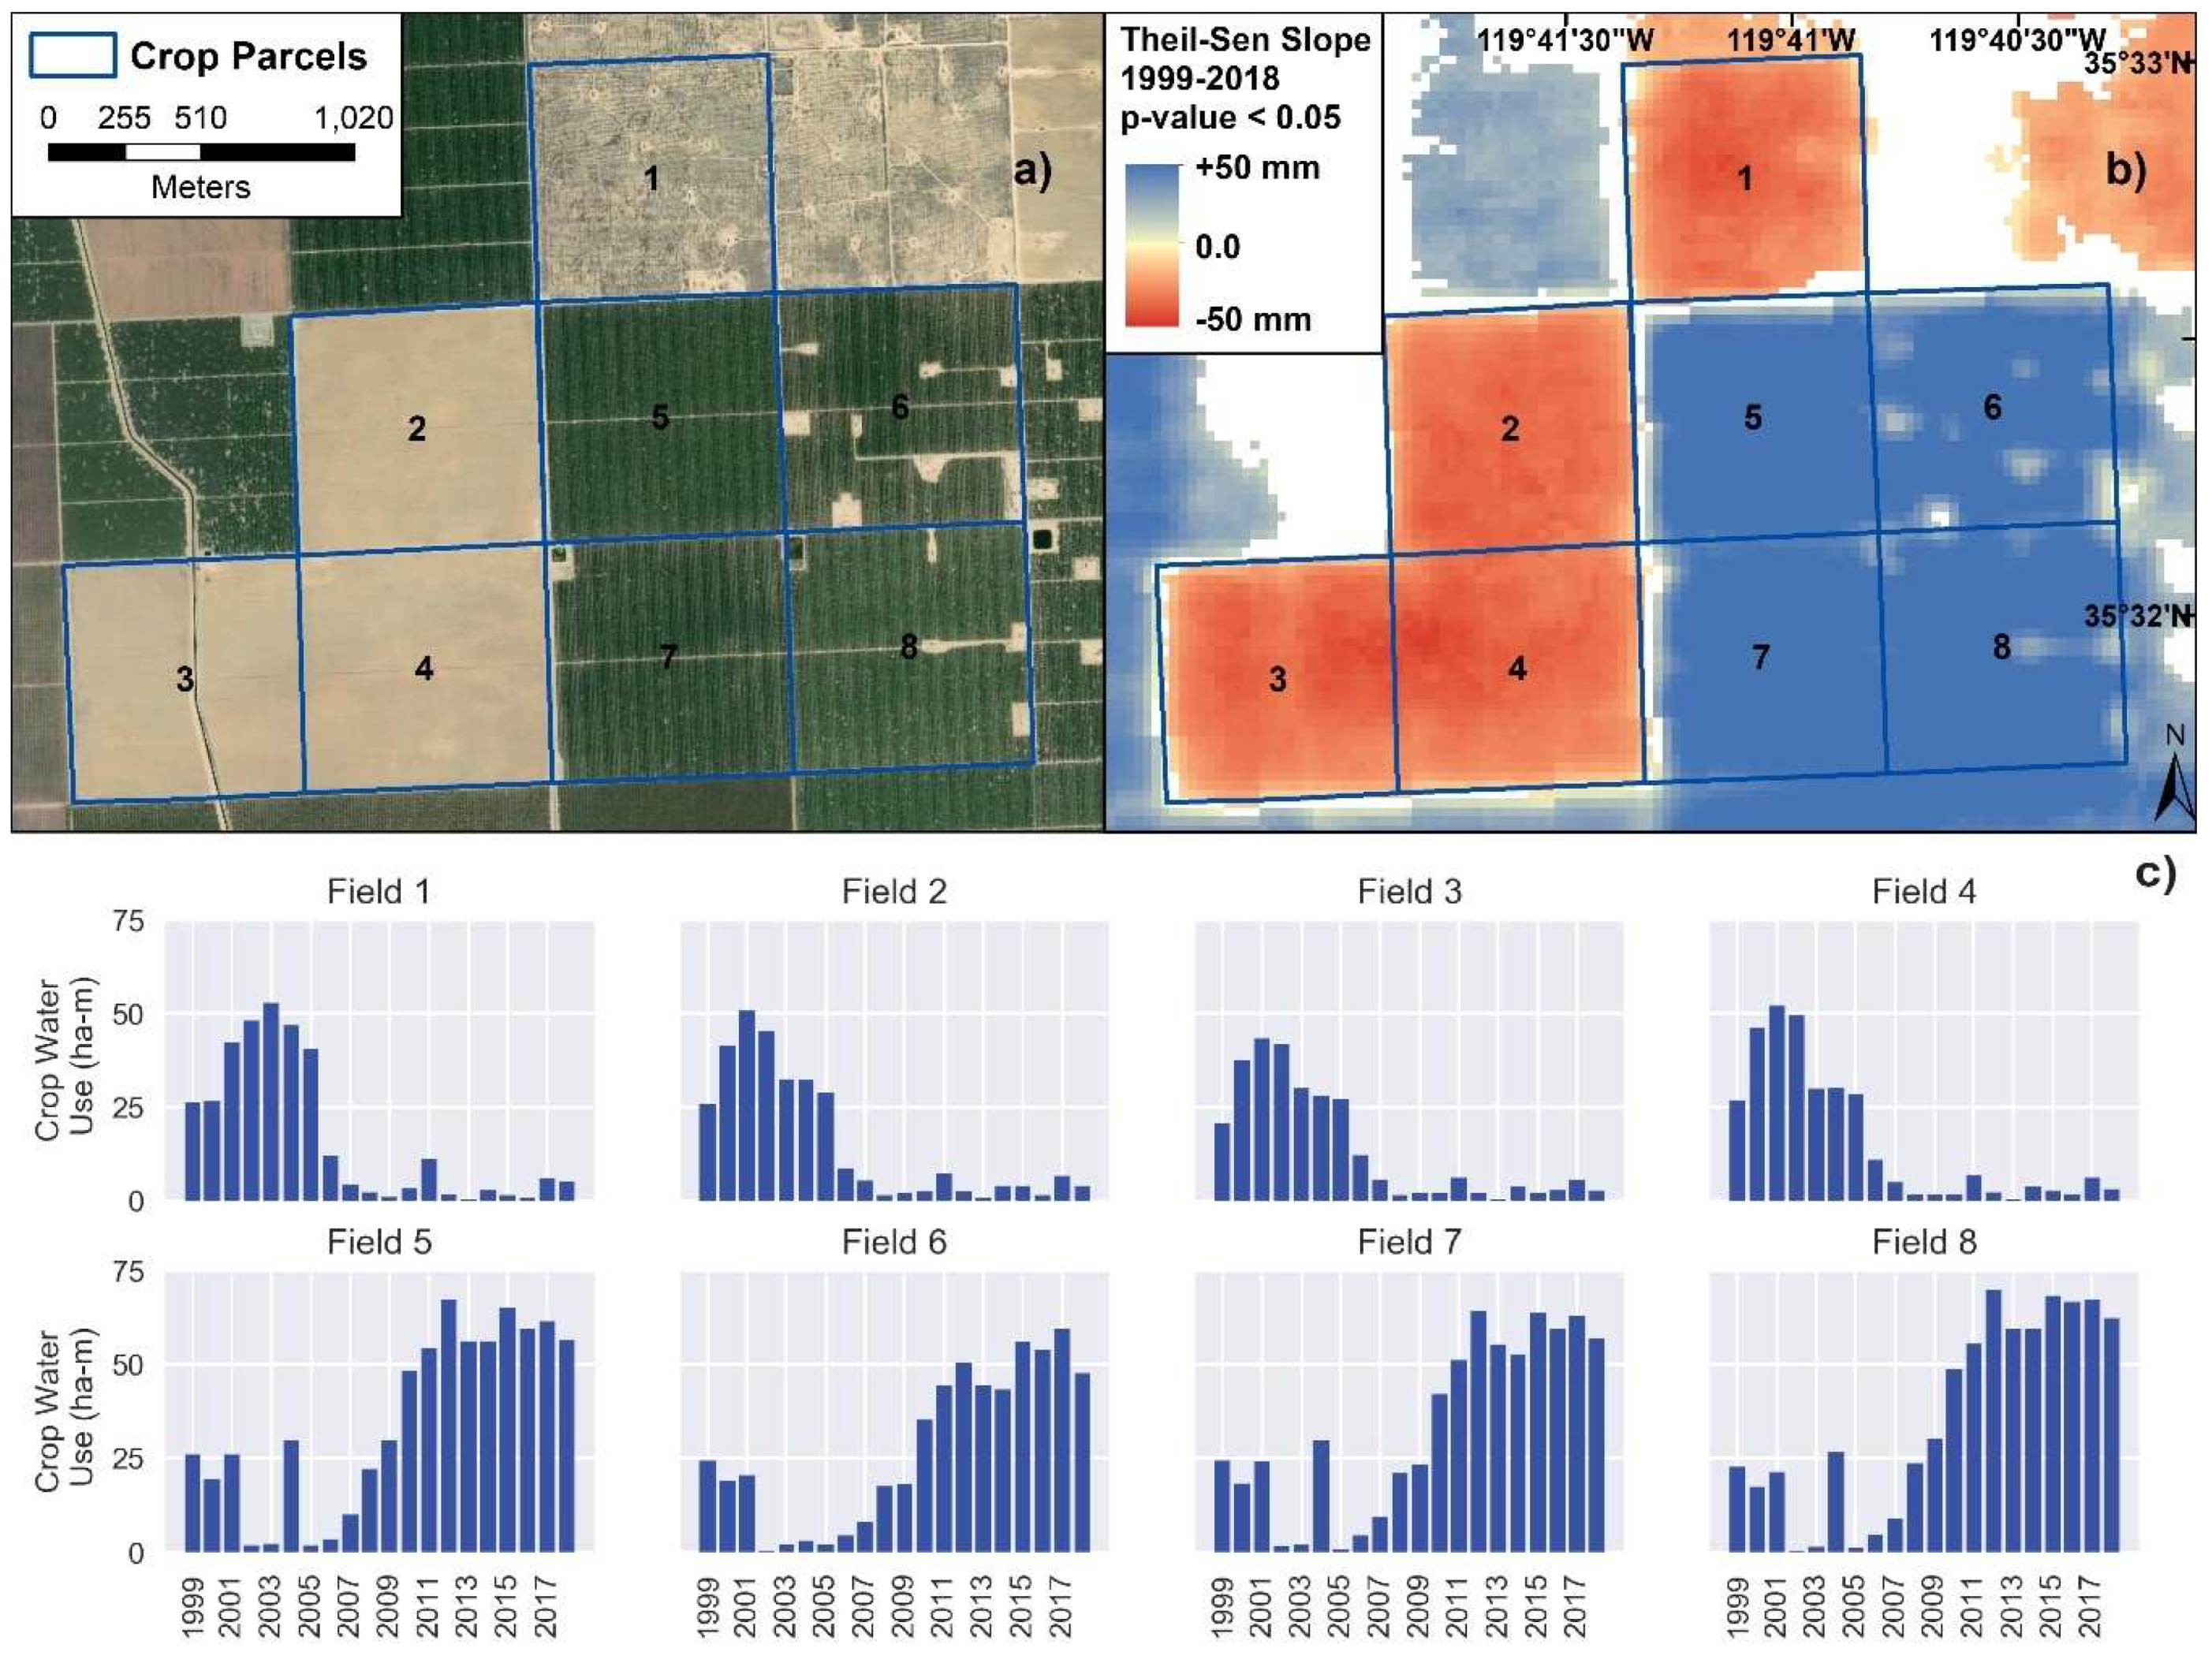
3.3. Field-Scale Analysis and Pixel-Based Mann–Kendall Trends
4. Discussion
5. Conclusions
Author Contributions
Funding
Acknowledgments
Conflicts of Interest
Data Availability
References
- Nelson, K.S.; Burchfield, E.K. Effects of the structure of water rights on agricultural production during drought: A spatiotemporal analysis of California’s central valley. Water Resour. Res. 2017, 53, 8293–8309. [Google Scholar] [CrossRef]
- Matios, E.; Burney, J. Ecosystem services mapping for sustainable agricultural water management in California’s central valley. Environ. Sci. Technol. 2017, 51, 2593–2601. [Google Scholar] [CrossRef] [PubMed]
- Pathak, T.B.; Maskey, M.L.; Dahlberg, J.A.; Kearns, F.; Bali, K.M.; Zaccaria, D. Climate change trends and impacts on California agriculture: A detailed review. Agronomy 2018, 8, 25. [Google Scholar] [CrossRef]
- Howes, D.J.; Fox, P.; Hutton, P.H. Evapotranspiration from natural vegetation in the central valley of California: Monthly grass reference-based vegetation coefficients and the dual crop coefficient approach. J. Hydrol. Eng. 2015, 20, 04015004. [Google Scholar] [CrossRef]
- Senay, G.B.; Schauer, M.; Friedrichs, M.; Velpuri, N.M.; Singh, R.K. Satellite-based water use dynamics using historical Landsat data (1984–2014) in the southwestern United States. Remote Sens. Environ. 2017, 202, 98–112. [Google Scholar] [CrossRef]
- Senay, G.B. Satellite psychrometric formulation of the operational simplified surface energy balance (Ssebop) model for quantifying and mapping evapotranspiration. Appl. Eng. Agric. 2018, 34, 555–566. [Google Scholar] [CrossRef]
- Faunt, C.C.; Sneed, M.; Traum, J.; Brandt, J.T. Water availability and land subsidence in the Central Valley, California, USA. Hydrogeol. J. 2015, 24, 675–684. [Google Scholar] [CrossRef] [Green Version]
- Xiao, M.; Koppa, A.; Mekonnen, Z.; Pagán, B.R.; Zhan, S.; Cao, Q.; Aierken, A.; Lee, H.; Lettenmaier, D.P. How much groundwater did California’s Central Valley lose during the 2012-2016 drought? Geophys. Res. Lett. 2017, 44, 4872–4879. [Google Scholar] [CrossRef]
- Thomas, B.F.; Famiglietti, J.S.; Landerer, F.W.; Wiese, D.N.; Molotch, N.P.; Argus, D.F. GRACE groundwater drought index: Evaluation of California central valley groundwater drought. Remote Sens. Environ. 2017, 198, 384–392. [Google Scholar] [CrossRef]
- Famiglietti, J.S.; Lo, M.; Ho, S.L.; Bethune, J.; Anderson, K.J.; Syed, T.H.; Swenson, S.C.; de Linage, C.R.; Rodell, M. Satellites measure recent rates of groundwater depletion in California’s Central Valley. Geophys. Res. Lett. 2011, 38, L03403. [Google Scholar] [CrossRef]
- Szilagyi, J.; Jozsa, J. Evapotranspiration trends (1979-2015) in the Central Valley of California, USA: Contrasting tendencies during 1981–2007. Water Resour. Res. 2018, 54, 5620–5635. [Google Scholar] [CrossRef]
- Semmens, K.A.; Anderson, M.C.; Kustas, W.P.; Gao, F.; Alfieri, J.G.; McKee, L.; Prueger, J.H.; Hain, C.R.; Cammalleri, C.; Yang, Y.; et al. Monitoring daily evapotranspiration over two California vineyards using Landsat 8 in a multi-sensor data fusion approach. Remote Sens. Environ. 2016, 185, 155–170. [Google Scholar] [CrossRef] [Green Version]
- Shivers, S.; Roberts, D.; McFadden, J.; Tague, C. Using imaging spectrometry to study changes in crop area in California’s Central Valley during drought. Remote Sens. 2018, 10, 1556. [Google Scholar] [CrossRef]
- Anderson, M.; Gao, F.; Knipper, K.; Hain, C.; Dulaney, W.; Baldocchi, D.; Eichelmann, E.; Hemes, K.; Yang, Y.; Medellin-Azuara, J.; et al. Field-scale assessment of land and water use change over the California delta using remote sensing. Remote Sens. 2018, 10, 889. [Google Scholar] [CrossRef]
- Prueger, J.H.; Parry, C.K.; Kustas, W.P.; Alfieri, J.G.; Alsina, M.M.; Nieto, H.; Wilson, T.G.; Hipps, L.E.; Anderson, M.C.; Hatfield, J.L.; et al. Crop water stress index of an irrigated vineyard in the Central Valley of California. Irrig. Sci. 2018, 37, 297–313. [Google Scholar] [CrossRef]
- Faunt, C.C.; Hanson, R.T.; Belitz, K. Groundwater Availability of the Central Valley Aquifer, California; U.S. Geological Survey Professional Paper 1766; U.S. Geological Survey: Reston, Virginia, 2009.
- He, X.G.; Wada, Y.; Wanders, N.; Sheffield, J. Intensification of hydrological drought in California by human water management. Geophys. Res. Lett. 2017, 44, 1777–1785. [Google Scholar] [CrossRef] [Green Version]
- Kern County Crop Report. In Kern County Department of Agriculture and Measurement Standards Crop Reports; Kern County Department Of Agriculture And Measurement Standards: Bakersfield, CA, USA, 2018.
- USDA-NASS. USDA National Agricultural Statistics Service Cropland Data Layer. Available online: https://nassgeodata.gmu.edu/CropScape (accessed on 12 July 2019).
- Singh, R.; Senay, G.; Velpuri, N.; Bohms, S.; Scott, R.; Verdin, J. Actual evapotranspiration (water use) assessment of the Colorado River Basin at the landsat resolution using the operational simplified surface energy balance model. Remote Sens. 2013, 6, 233–256. [Google Scholar] [CrossRef]
- Gorelick, N.; Hancher, M.; Dixon, M.; Ilyushchenko, S.; Thau, D.; Moore, R. Google earth engine: Planetary-scale geospatial analysis for everyone. Remote Sens. Environ. 2017, 202, 18–27. [Google Scholar] [CrossRef]
- Senay, G.B.; Schauer, M.; Velpuri, N.M.; Singh, R.K.; Kagone, S.; Friedrichs, M.; Litvak, M.E.; Douglas-Mankin, K.R. Long-term (1986–2015) crop water use characterization over the upper Rio Grande Basin of United States and Mexico using landsat-based evapotranspiration. Remote Sens. 2019, 11, 1587. [Google Scholar] [CrossRef]
- Abatzoglou, J.T. Development of gridded surface meteorological data for ecological applications and modelling. Int. J. Climatol. 2013, 33, 121–131. [Google Scholar] [CrossRef]
- Chen, M.S.; Senay, G.B.; Singh, R.K.; Verdin, J.P. Uncertainty analysis of the Operational Simplified Surface Energy Balance (SSEBop) model at multiple flux tower sites. J. Hydrol. 2016, 536, 384–399. [Google Scholar] [CrossRef] [Green Version]
- Senay, G.B.; Bohms, S.; Singh, R.K.; Gowda, P.H.; Velpuri, N.M.; Alemu, H.; Verdin, J.P. Operational evapotranspiration mapping using remote sensing and weather datasets: A new parameterization for the SSEB approach. J. Am. Water Resour. Assoc. 2013, 49, 577–591. [Google Scholar] [CrossRef]
- Senay, G.B.; Friedrichs, M.; Singh, R.K.; Velpuri, N.M. Evaluating Landsat 8 evapotranspiration for water use mapping in the Colorado River Basin. Remote Sens. Environ. 2016, 185, 171–185. [Google Scholar] [CrossRef] [Green Version]
- Velpuri, N.M.; Senay, G.B.; Morisette, J.T. Evaluating new SMAP soil moisture for drought monitoring in the rangelands of the US high plains. Rangelands 2016, 38, 183–190. [Google Scholar] [CrossRef]
- Lark, T.J.; Mueller, R.M.; Johnson, D.M.; Gibbs, H.K. Measuring land-use and land-cover change using the U.S. department of agriculture’s cropland data layer: Cautions and recommendations. Int. J. Appl. Earth Obs. Geoinf. 2017, 62, 224–235. [Google Scholar] [CrossRef]
- Boryan, C.; Yang, Z.W.; Mueller, R.; Craig, M. Monitoring US agriculture: The US Department of Agriculture, National Agricultural Statistics Service, cropland data layer program. Geocarto Int. 2011, 26, 341–358. [Google Scholar] [CrossRef]
- Fulton, J.; Norton, M.; Shilling, F. Water-indexed benefits and impacts of California almonds. Ecol. Indic. 2019, 96, 711–717. [Google Scholar] [CrossRef]
- Daly, C.; Smith, J.W.; Smith, J.I.; McKane, R.B. High-resolution spatial modeling of daily weather elements for a catchment in the Oregon Cascade Mountains, United States. J. Appl. Meteorol. Climatol. 2007, 46, 1565–1586. [Google Scholar] [CrossRef]
- Douglas, E.M.; Vogel, R.M.; Kroll, C.N. Trends in floods and low flows in the United States: Impact of spatial correlation. J. Hydrol. 2000, 240, 90–105. [Google Scholar] [CrossRef]
- Hirsch, R.M.; Slack, J.R. A Nonparametric trend test for seasonal data with serial dependence. Water Resour. Res. 1984, 20, 727–732. [Google Scholar] [CrossRef]
- Lettenmaier, D.P.; Wood, E.F.; Wallis, J.R. Hydro-climatological trends in the continental United-States, 1948–1988. J. Clim. 1994, 7, 586–607. [Google Scholar] [CrossRef]
- Yue, S.; Pilon, P.; Cavadias, G. Power of the Mann–Kendall and Spearman’s rho tests for detecting monotonic trends in hydrological series. J. Hydrol. 2002, 259, 254–271. [Google Scholar] [CrossRef]
- Wilcox, R.R. Fundamentals of Modern Statistical Methods: Substantially Improving Power and Accuracy; Springer: Berlin, Germany, 2010. [Google Scholar]
- Bellvert, J.; Adeline, K.; Baram, S.; Pierce, L.; Sanden, B.L.; Smart, D.R. Monitoring crop evapotranspiration and crop coefficients over an almond and pistachio orchard throughout remote sensing. Remote Sens. 2018, 10, 2001. [Google Scholar] [CrossRef]
- Park, A.; Lurie, J. It takes how much water to grow an almond? Available online: https://www.motherjones.com/environment/2014/02/wheres-californias-water-going (accessed on 12 July 2019).
- Census of Agriculture. 2012. Available online: https://www.nass.usda.gov/Publications/AgCensus/2012/ (accessed on 30 July 2019).
- Schauer, M.; Senay, G.B. Crop water use in the Central Valley of California using landsat-derived evapotranspiration. In U.S. Geological Survey Data Release; U.S. Geological Survey: Sioux Falls, SD, USA, 2019. [Google Scholar]

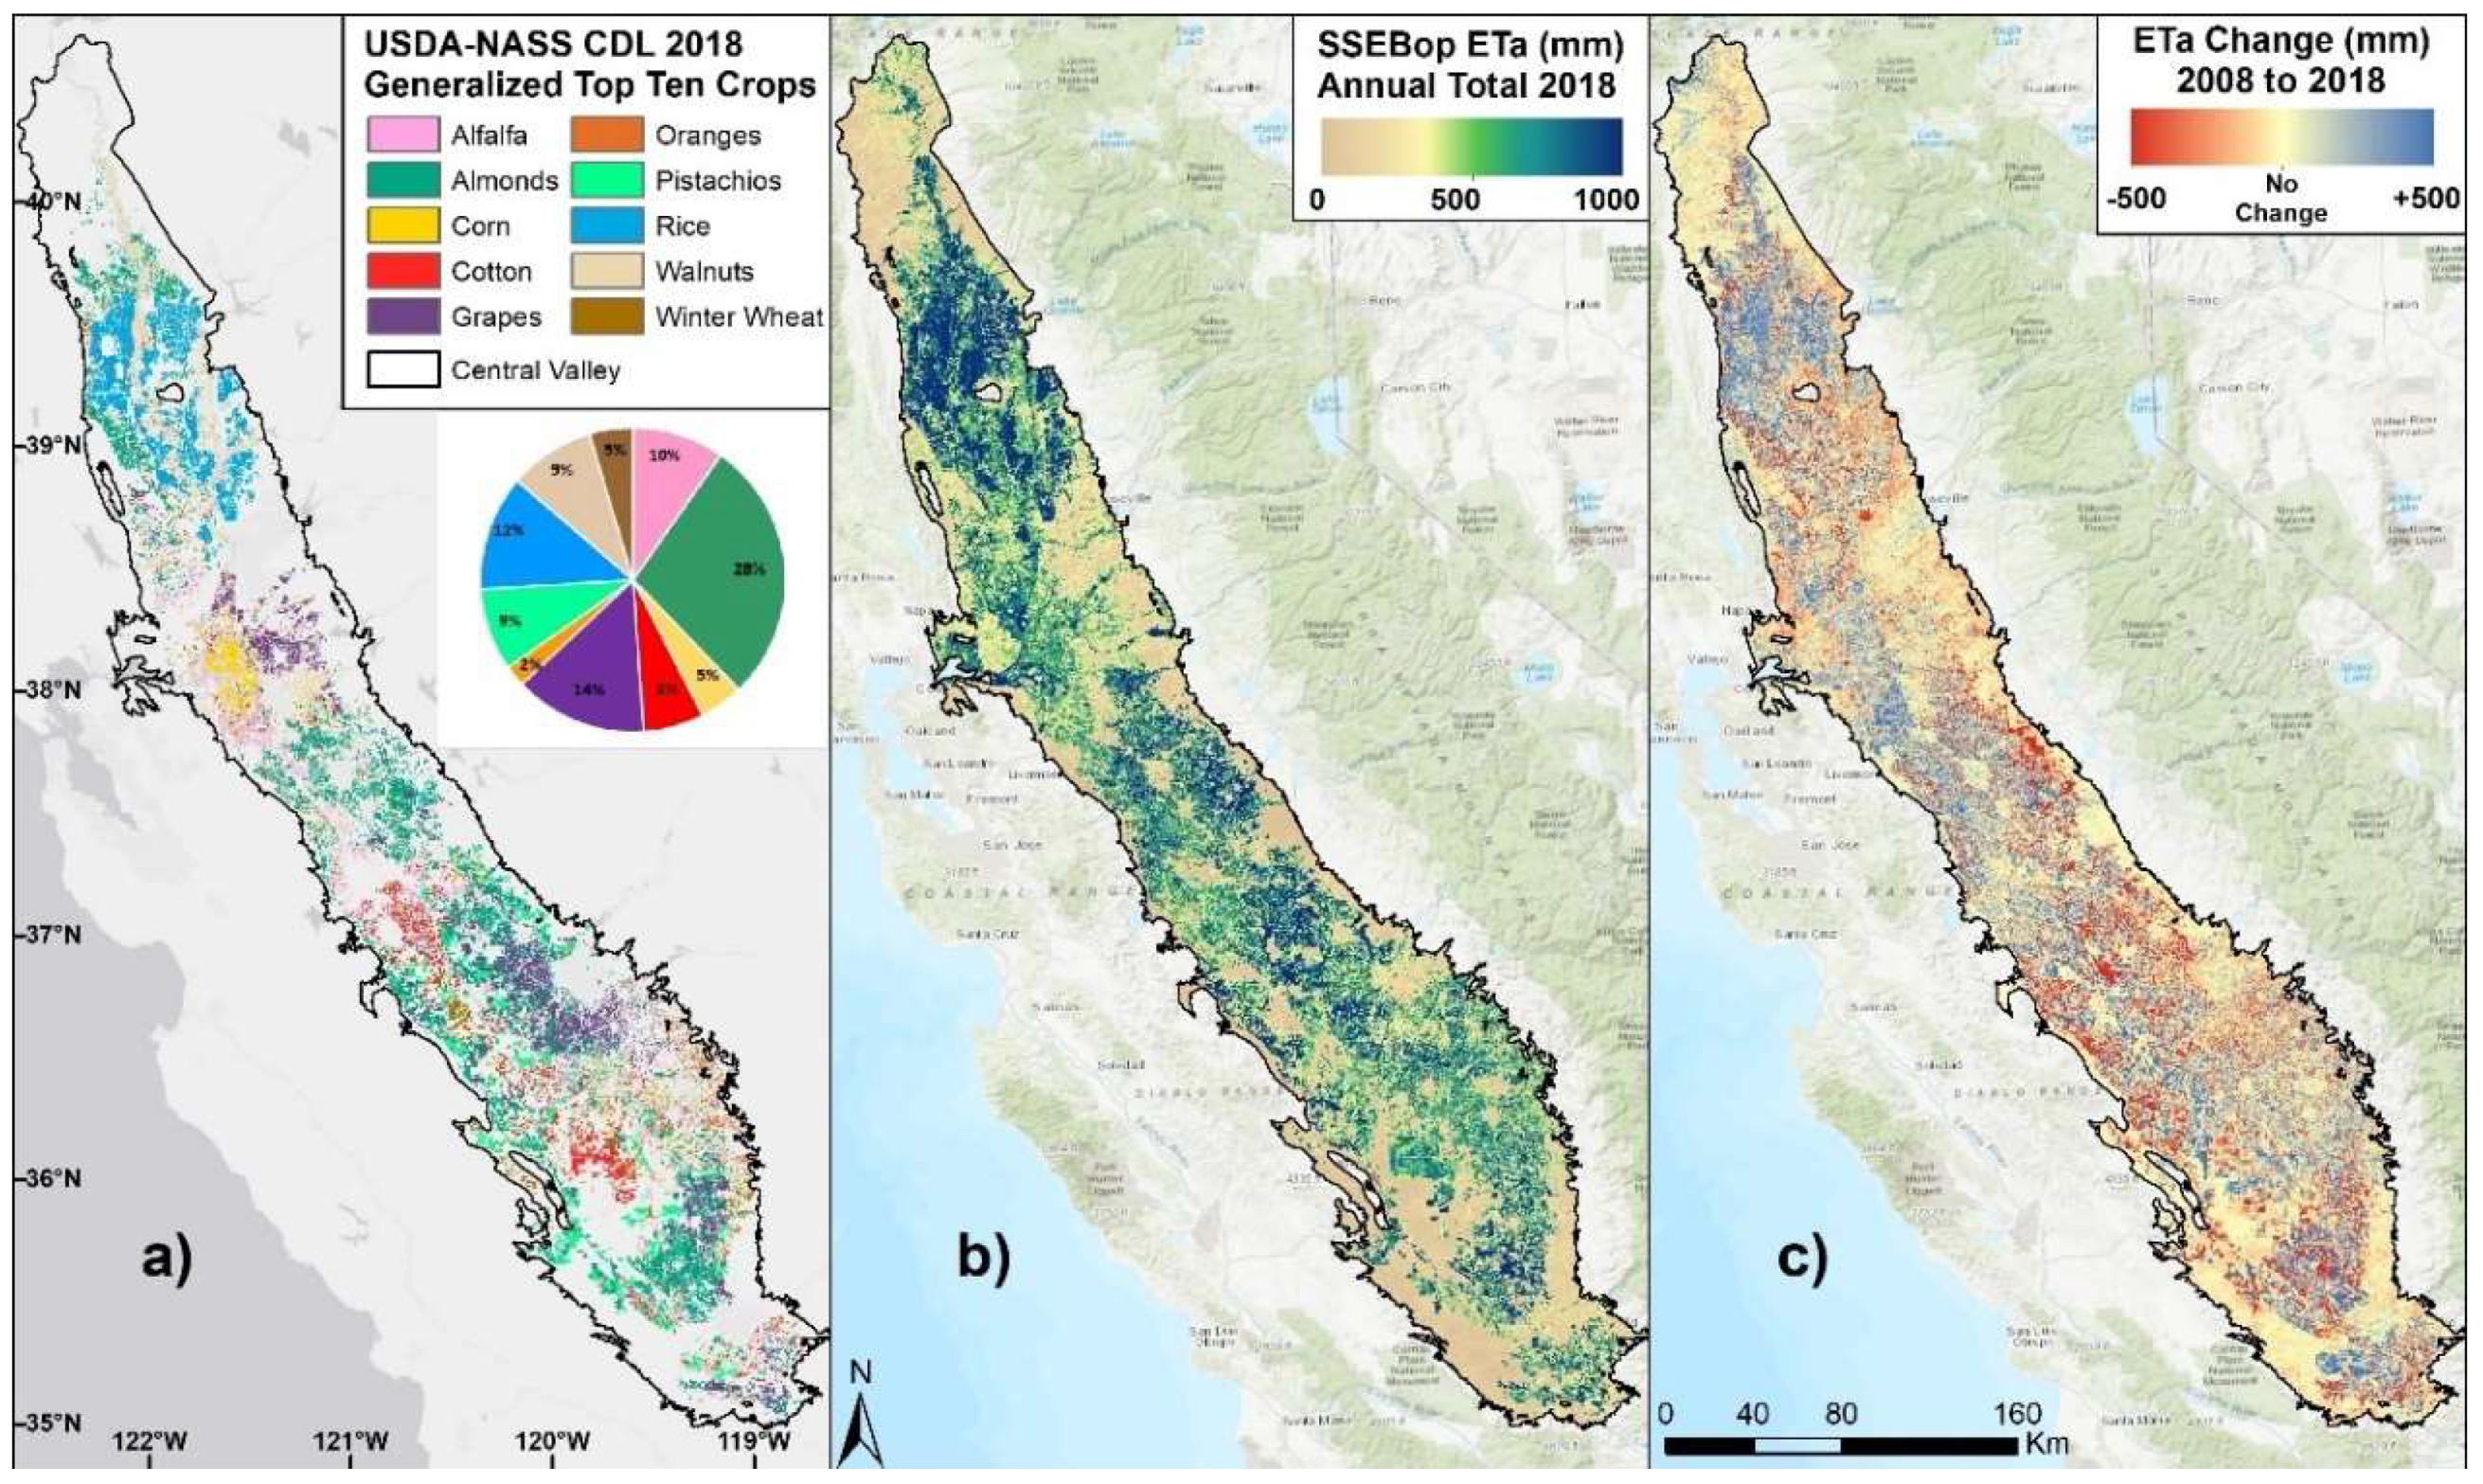
| Crop Type | CDL 1 | Crop Reports 1 | % Bias |
|---|---|---|---|
| Alfalfa | 285,164 | 247,669 | 15% |
| Almonds | 415,498 | 392,967 | 6% |
| Corn | 83,820 | 62,504 | 34% |
| Cotton | 111,169 | 108,328 | 3% |
| Grapes | 216,628 | 244,110 | −11% |
| Oranges | 57,601 | 65,721 | −12% |
| Pistachios | 75,978 | 90,929 | −16% |
| Rice | 215,794 | 208,871 | 3% |
| Walnuts | 121,829 | 126,944 | −4% |
| Winter Wheat | 155,343 | 129,594 | 20% |
| Crop Type | Mean Crop Area (ha) 1 | 2008 Crop Area (ha) 1 [%] | 2018 Crop Area (ha) 1 [%] | % Change | 2012–2016 Drought (ha) 1 [%] |
|---|---|---|---|---|---|
| Almonds | 395,204 | 343,695 [21%] | 445,249 [27%] | 30% | 417,652 [6%] |
| Grapes | 246,339 | 243,992 [15%] | 268,246 [16%] | 10% | 273,978 [11%] |
| Alfalfa | 235,705 | 283,905 [18%] | 141,768 [9%] | −50% | 223,405 [−5%] |
| Rice | 208,336 | 210,712 [13%] | 200,805 [12%] | −5% | 203,405 [−2%] |
| Walnuts | 130,527 | 92,920 [6%] | 161,005 [10%] | 73% | 129,912 [< −1%] |
| Winter Wheat | 118,101 | 146,169 [9%] | 62,256 [4%] | −57% | 108,738 [−8%] |
| Cotton | 109,195 | 104,663 [6%] | 107,219 [7%] | 2% | 99,718 [−9%] |
| Pistachios | 93,545 | 87,790 [5%] | 167,678 [10%] | 91% | 81,230 [−13%] |
| Corn | 62,738 | 69,604 [4%] | 59,031 [4%] | −15% | 59,411 [−5%] |
| Oranges | 27,152 | 26,837 [2%] | 18,619 [1%] | −31% | 26,810 [−1%] |
| Crop Type | MK Statistic | p-Value | Theil–Sen Slope (ha/yr) 1 | Trend 2 |
|---|---|---|---|---|
| Alfalfa | −39 | 0.003 | −12,429 | − |
| Almonds | 39 | 0.003 | 16,327 | + |
| Corn | −21 | 0.119 | −3543 | # |
| Cotton | −9 | 0.533 | −2038 | # |
| Grapes | 29 | 0.029 | 6119 | + |
| Oranges | −1 | 1.000 | −48 | # |
| Pistachios | 27 | 0.043 | 6635 | + |
| Rice | −23 | 0.087 | −3411 | # |
| Walnuts | 49 | 0.000 | 6668 | + |
| Winter Wheat | −37 | 0.005 | −7770 | − |
| Crop Type | Mean Water Use (ha-m) 1 | 2008 Water Use (ha-m) 1 [%] | 2018 Water Use (ha-m) 1 [%] | % Change | 2012–2016 Drought (ha-m) 1 [%] |
|---|---|---|---|---|---|
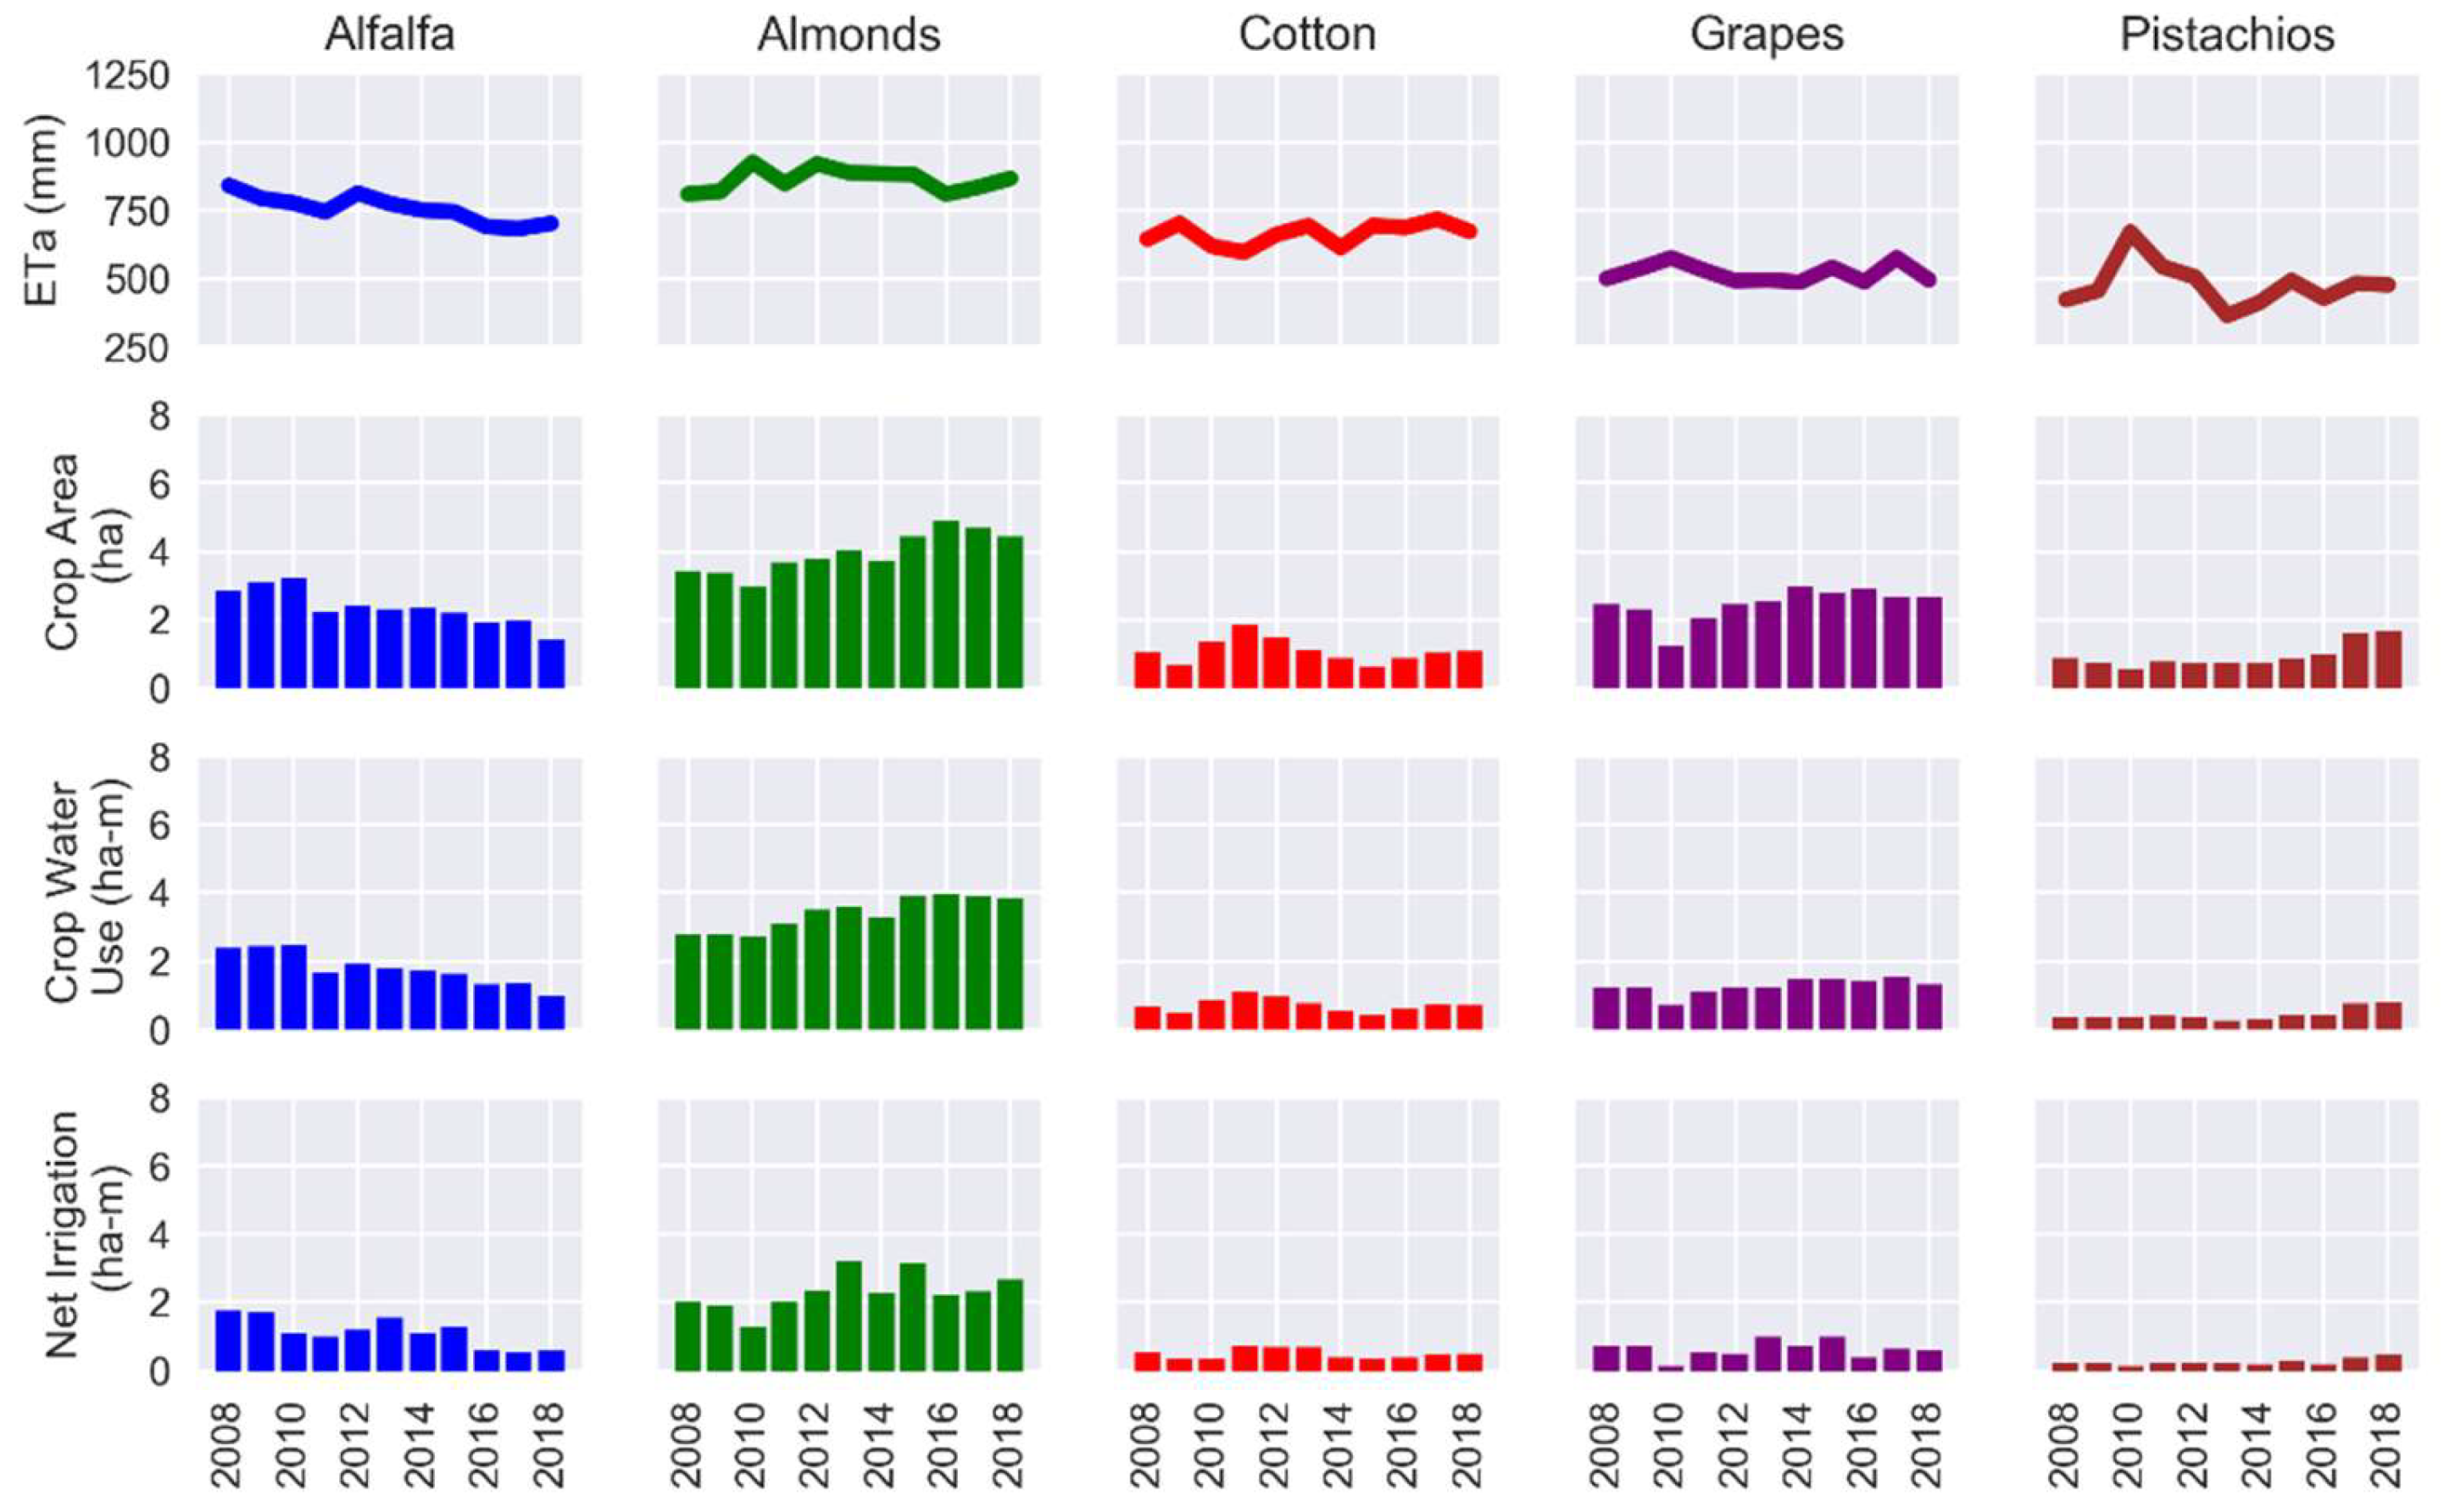
| Almonds | 339,506 | 277,707 [23%] | 385,230 [33%] | 39% | 364,074 [7%] |
| Rice | 218,544 | 247,717 [21%] | 197,711 [17%] | −20% | 213,144 [−2%] |
| Alfalfa | 179,606 | 238,316 [20%] | 99,308 [9%] | −58% | 168,856 [−6%] |
| Grapes | 126,840 | 121,819 [10%] | 132,561 [11%] | 9% | 136,772 [8%] |
| Walnuts | 111,442 | 89,498 [7%] | 130,072 [11%] | 45% | 110,900 [< −1%] |
| Cotton | 71,508 | 67,374 [6%] | 71,994 [6%] | 7% | 66,533 [−7%] |
| Winter Wheat | 47,386 | 64,842 [5%] | 18,601 [2%] | −71% | 40,980 [−14%] |
| Pistachios | 44,123 | 37,028 [3%] | 79,774 [7%] | 115% | 35,733 [−19%] |
| Corn | 40,023 | 46,284 [4%] | 34,039 [3%] | −26% | 38,042 [−5%] |
| Oranges | 17,913 | 17,714 [1%] | 10,940 [1%] | −38% | 16,825 [−6%] |
| Crop Type | MK Statistic | p-Value | Theil–Sen Slope (ha-m/yr) 1 | Trend 2 |
|---|---|---|---|---|
| Alfalfa | −41 | 0.002 | −13,901 | − |
| Almonds | 35 | 0.008 | 13,488 | + |
| Corn | −23 | 0.087 | −2756 | # |
| Cotton | −7 | 0.640 | −841 | # |
| Grapes | 31 | 0.020 | 4042 | + |
| Oranges | −13 | 0.350 | −382 | # |
| Pistachios | 25 | 0.062 | 1963 | # |
| Rice | −27 | 0.043 | −5433 | − |
| Walnuts | 43 | 0.001 | 4300 | + |
| Winter Wheat | −35 | 0.008 | −4086 | − |
| Crop Type | Mean Crop Area (ha) 1 | 1999 Crop Area (ha) 1 [%] | 2018 Crop Area (ha) 1 [%] | % Change | 2012–2016 Drought (ha) 1 [%] |
|---|---|---|---|---|---|
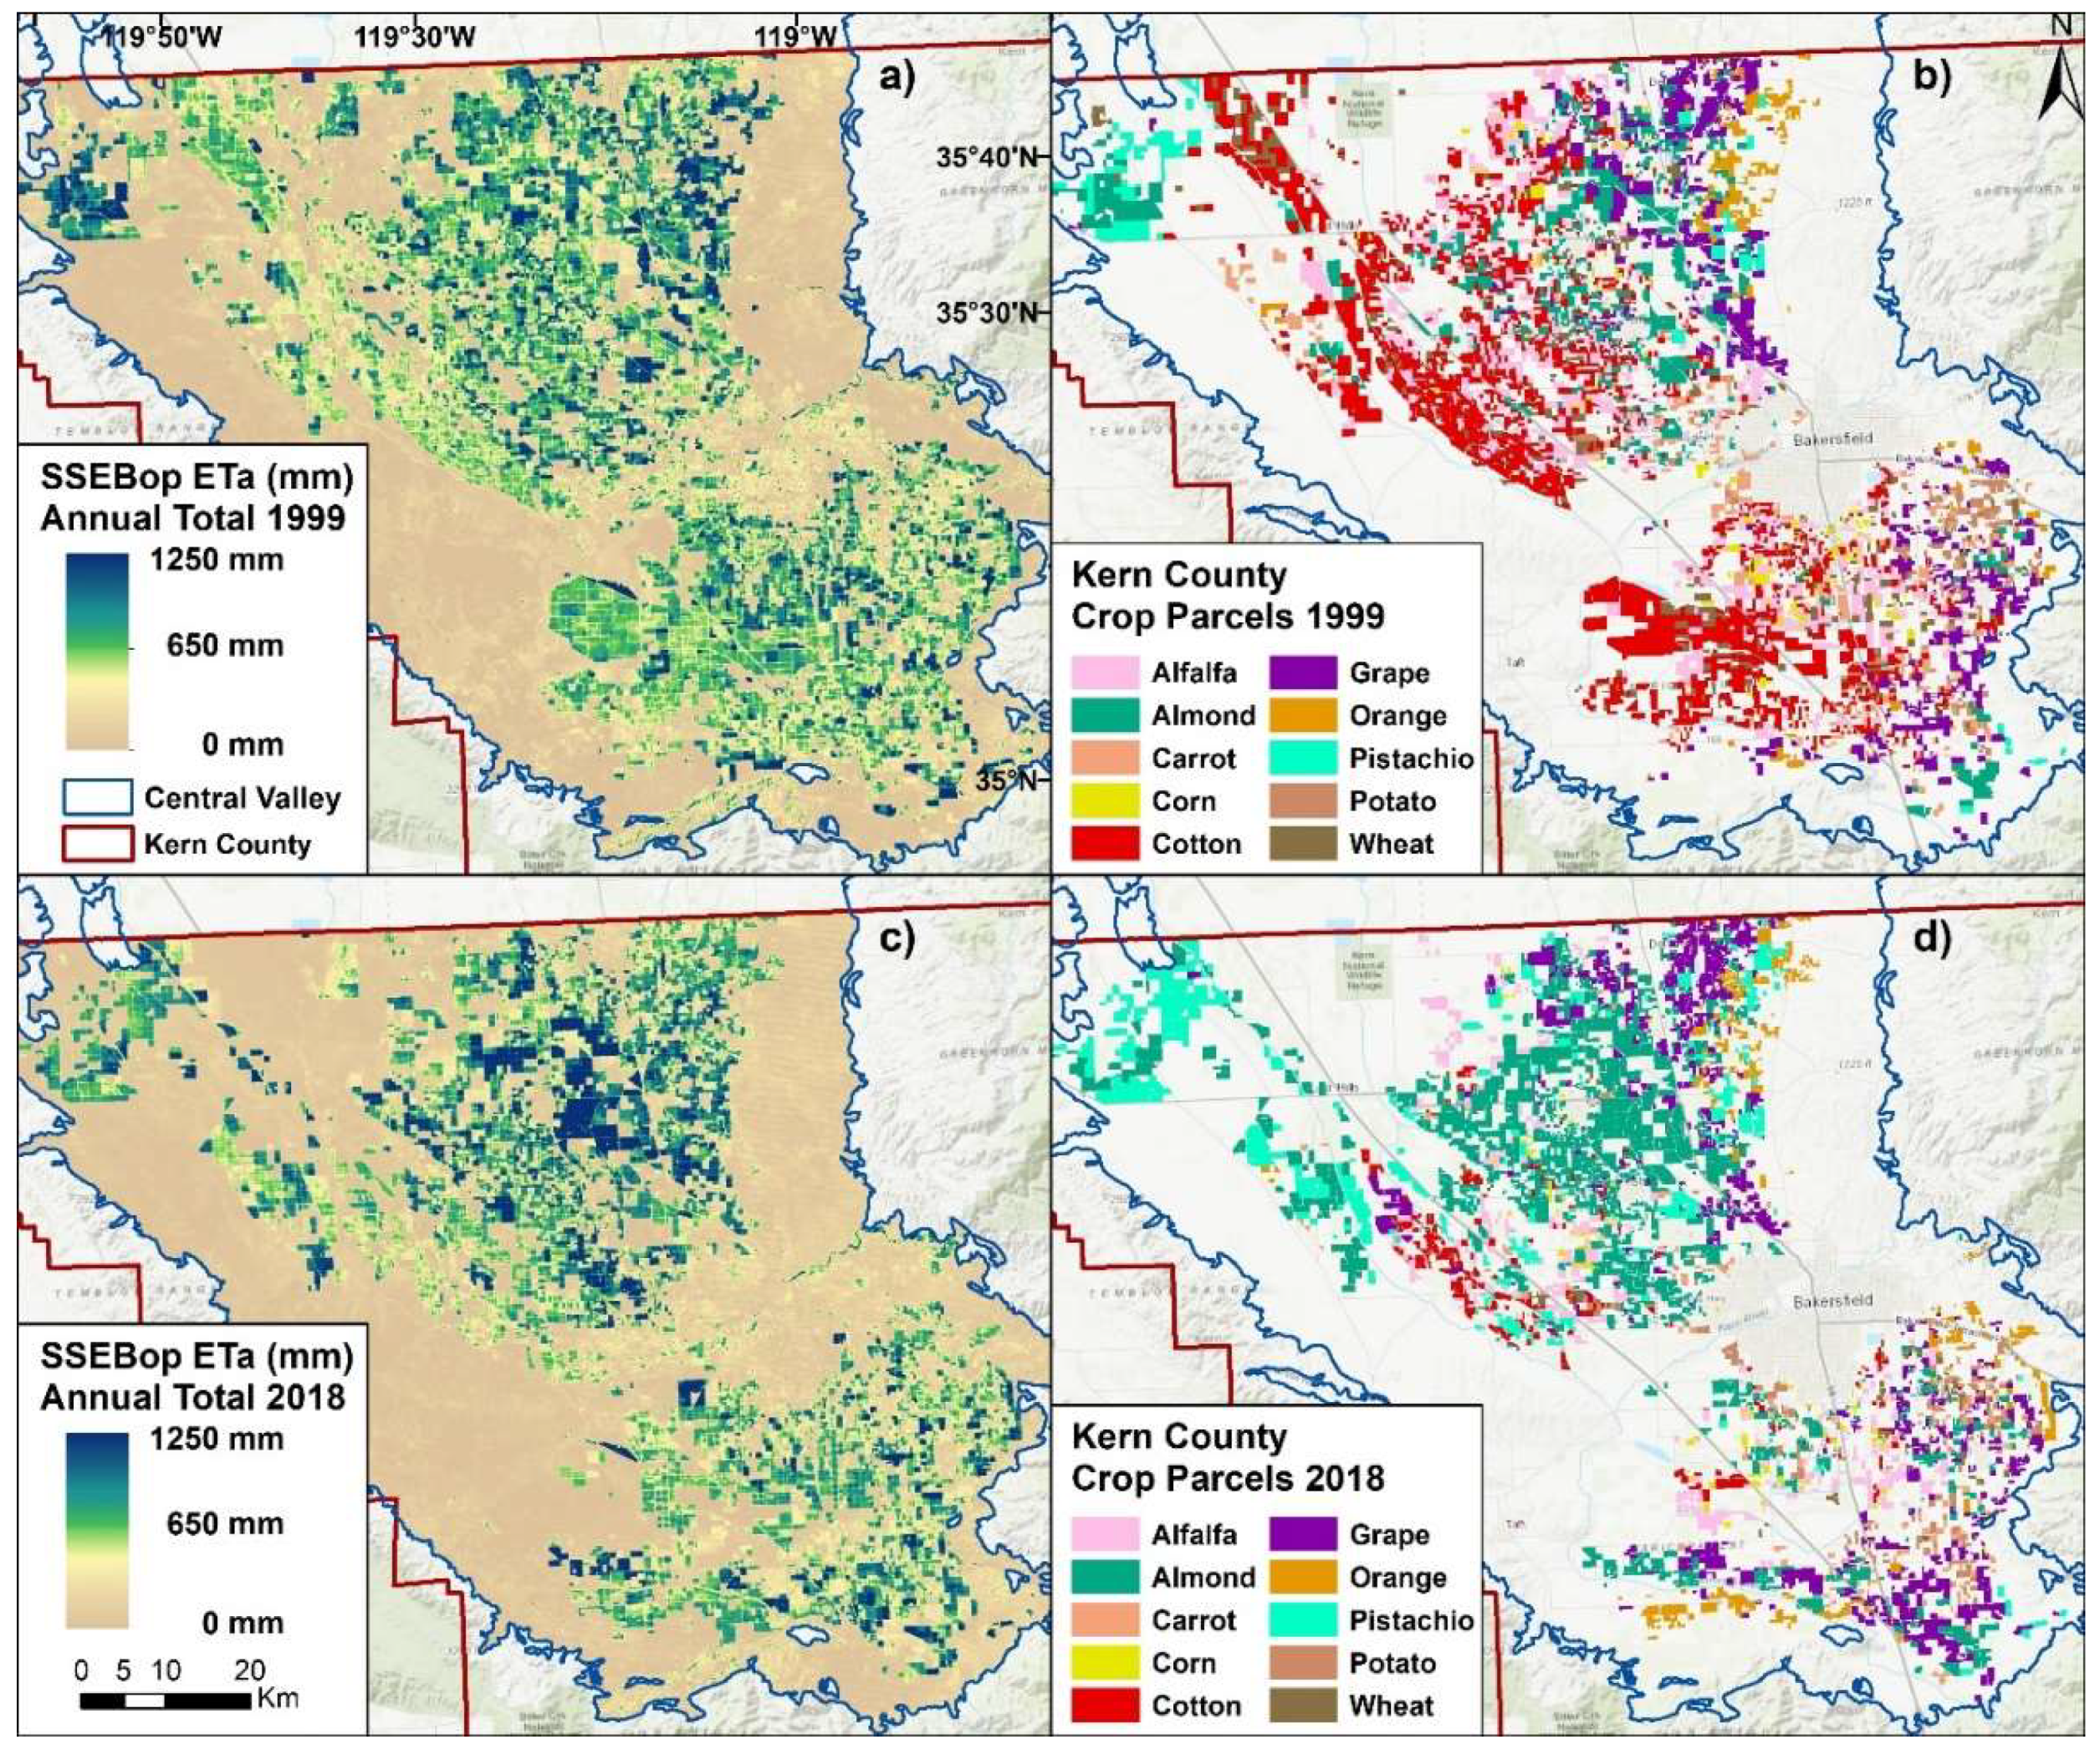
| Almonds | 53,126 | 31,213 [14%] | 70,924 [38%] | 127% | 69,662 [31%] |
| Cotton | 32,957 | 71,264 [32%] | 7,603 [4%] | −89% | 13,343 [−60%] |
| Grapes | 32,778 | 30,261 [13%] | 35,141 [19%] | 16% | 34,951 [7%] |
| Alfalfa | 31,652 | 37,568 [17%] | 16,438 [9%] | −56% | 27,922 [−12%] |
| Pistachios | 16,247 | 8536 [4%] | 27,908 [15%] | 227% | 22,693 [40%] |
| Oranges | 11,305 | 7861 [3%] | 11,484 [6%] | 46% | 12,565 [11%] |
| Wheat | 9247 | 16,391 [7%] | 2885 [2%] | −82% | 5566 [−40%] |
| Carrots | 8952 | 10,964 [5%] | 5537 [3%] | −49% | 8203 [−8%] |
| Corn | 5597 | 4633 [2%] | 2622 [1%] | −43% | 5398 [−4%] |
| Potatoes | 4913 | 7306 [3%] | 6293 [3%] | −14% | 4216 [−14%] |
| Crop Type | MK Statistic | p-Value | Theil–Sen Slope (ha/yr) 1 | Trend 2 |
|---|---|---|---|---|
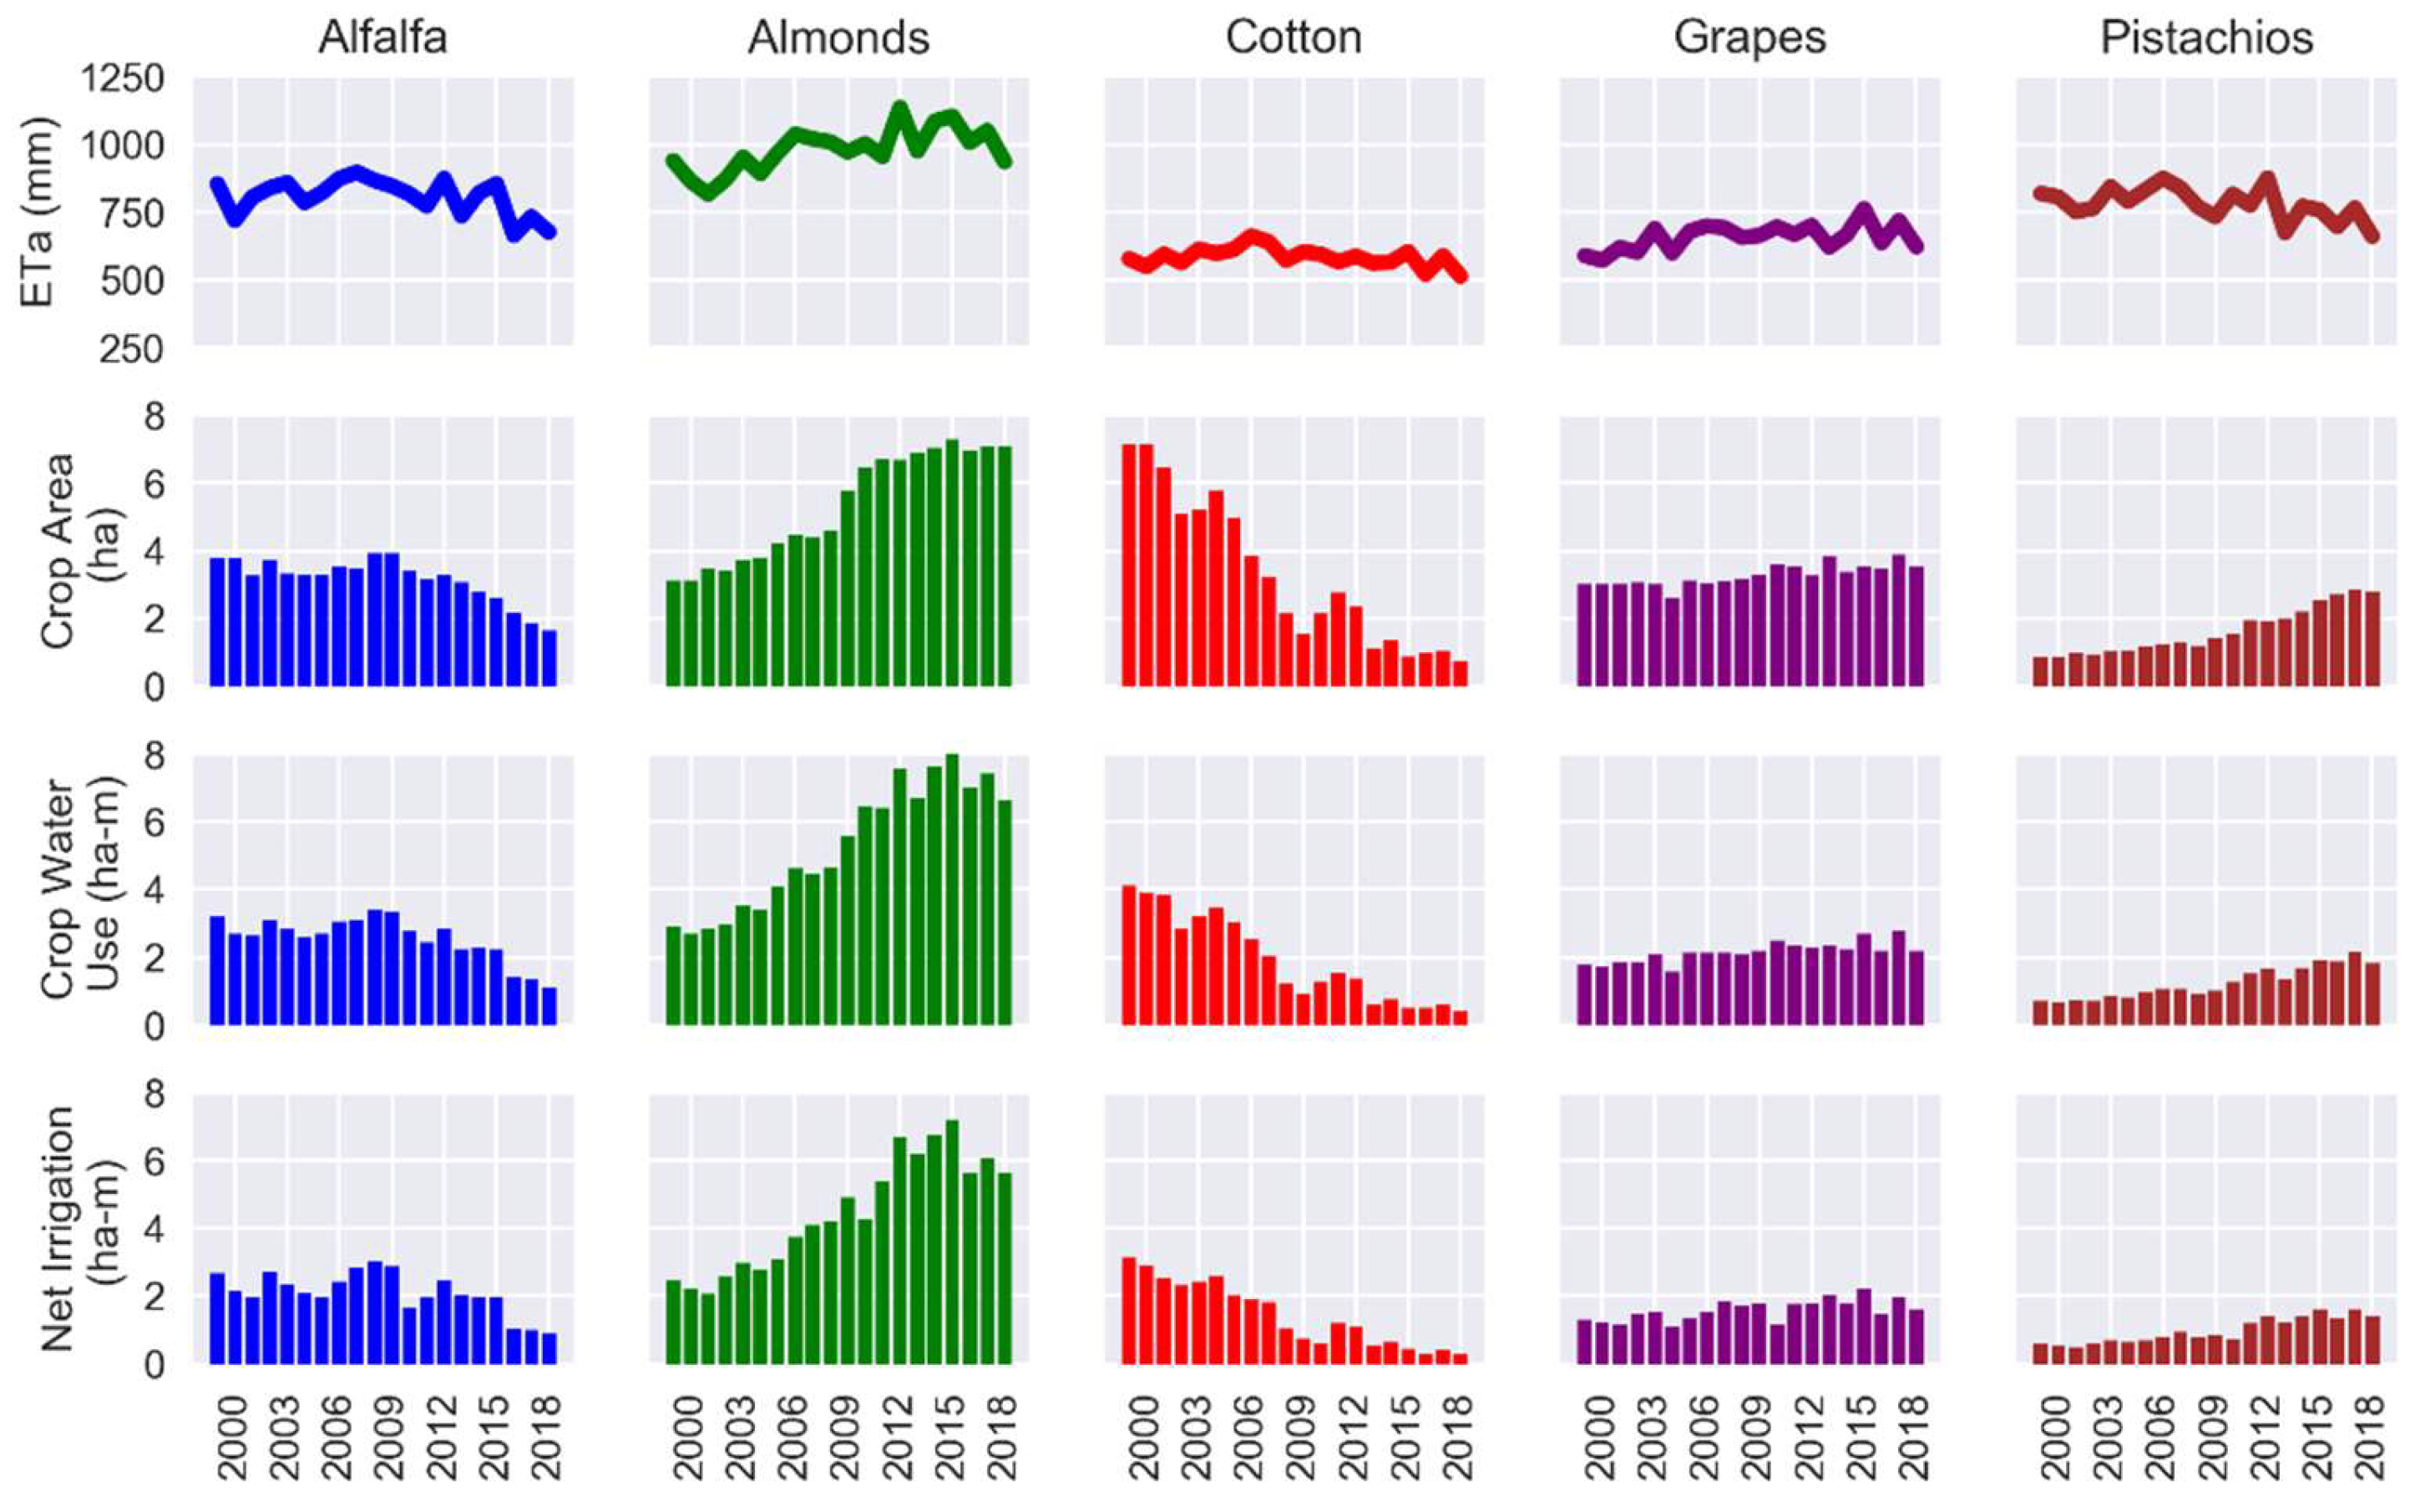
| Alfalfa | −113 | 0.000 | −758 | − |
| Almonds | 175 | 0.000 | 2465 | + |
| Carrots | −101 | 0.001 | −180 | − |
| Corn | −62 | 0.048 | −116 | − |
| Cotton | −159 | 0.000 | −3589 | − |
| Grapes | 123 | 0.000 | 358 | + |
| Oranges | 109 | 0.000 | 227 | + |
| Pistachios | 179 | 0.000 | 1095 | + |
| Potatoes | −71 | 0.023 | −165 | − |
| Wheat | −111 | 0.000 | −560 | − |
| Crop Type | Mean Water Use (ha-m) 1 | 1999 Water Use (ha-m) 1 [%] | 2018 Water Use (ha-m)1 [%] | % Change | 2012–2016 Drought (ha-m) 1 [%] |
|---|---|---|---|---|---|
| Almonds | 52,782 | 29,275 [18%] | 66,243 [48%] | 126% | 73,827 [40%] |
| Alfalfa | 25,735 | 32,015 [20%] | 11,095 [8%] | −65% | 22,203 [−14%] |
| Grapes | 21,574 | 17,790 [11%] | 21,823 [16%] | 23% | 23,605 [9%] |
| Cotton | 19,383 | 41,075 [26%] | 3,895 [3%] | −91% | 7,600 [−61%] |
| Pistachios | 12,451 | 6975 [4%] | 18,405 [13%] | 164% | 17,007 [37%] |
| Oranges | 9740 | 7820 [5%] | 8198 [6%] | 5% | 10,199 [5%] |
| Wheat | 5691 | 10,278 [6%] | 1411 [1%] | −86% | 3524 [−38%] |
| Carrots | 4989 | 6086 [4%] | 2652 [2%] | −56% | 4430 [−11%] |
| Corn | 3524 | 3047 [2%] | 1349 [1%] | −56% | 3451 [−2%] |
| Potatoes | 2444 | 3973 [3%] | 3134 [2%] | −21% | 2009 [−18%] |
| Crop Type | MK Statistic | p-Value | Theil–Sen Slope (ha-m/yr) 1 | Trend 2 |
|---|---|---|---|---|
| Alfalfa | −94 | 0.003 | −698 | − |
| Almonds | 154 | 0.000 | 3035 | + |
| Carrots | −58 | 0.064 | −81 | # |
| Corn | −48 | 0.127 | −65 | # |
| Cotton | −160 | 0.000 | −2107 | − |
| Grapes | 124 | 0.000 | 410 | + |
| Oranges | 68 | 0.030 | 115 | + |
| Pistachios | 162 | 0.000 | 744 | + |
| Potatoes | −88 | 0.005 | −82 | − |
| Wheat | −100 | 0.001 | −352 | − |
© 2019 by the authors. Licensee MDPI, Basel, Switzerland. This article is an open access article distributed under the terms and conditions of the Creative Commons Attribution (CC BY) license (http://creativecommons.org/licenses/by/4.0/).
Share and Cite
Schauer, M.; Senay, G.B. Characterizing Crop Water Use Dynamics in the Central Valley of California Using Landsat-Derived Evapotranspiration. Remote Sens. 2019, 11, 1782. https://doi.org/10.3390/rs11151782
Schauer M, Senay GB. Characterizing Crop Water Use Dynamics in the Central Valley of California Using Landsat-Derived Evapotranspiration. Remote Sensing. 2019; 11(15):1782. https://doi.org/10.3390/rs11151782
Chicago/Turabian StyleSchauer, Matthew, and Gabriel B. Senay. 2019. "Characterizing Crop Water Use Dynamics in the Central Valley of California Using Landsat-Derived Evapotranspiration" Remote Sensing 11, no. 15: 1782. https://doi.org/10.3390/rs11151782
APA StyleSchauer, M., & Senay, G. B. (2019). Characterizing Crop Water Use Dynamics in the Central Valley of California Using Landsat-Derived Evapotranspiration. Remote Sensing, 11(15), 1782. https://doi.org/10.3390/rs11151782


