Introducing WIW for Detecting the Presence of Water in Wetlands with Landsat and Sentinel Satellites

Abstract
:
1. Introduction
2. Materials and Methods
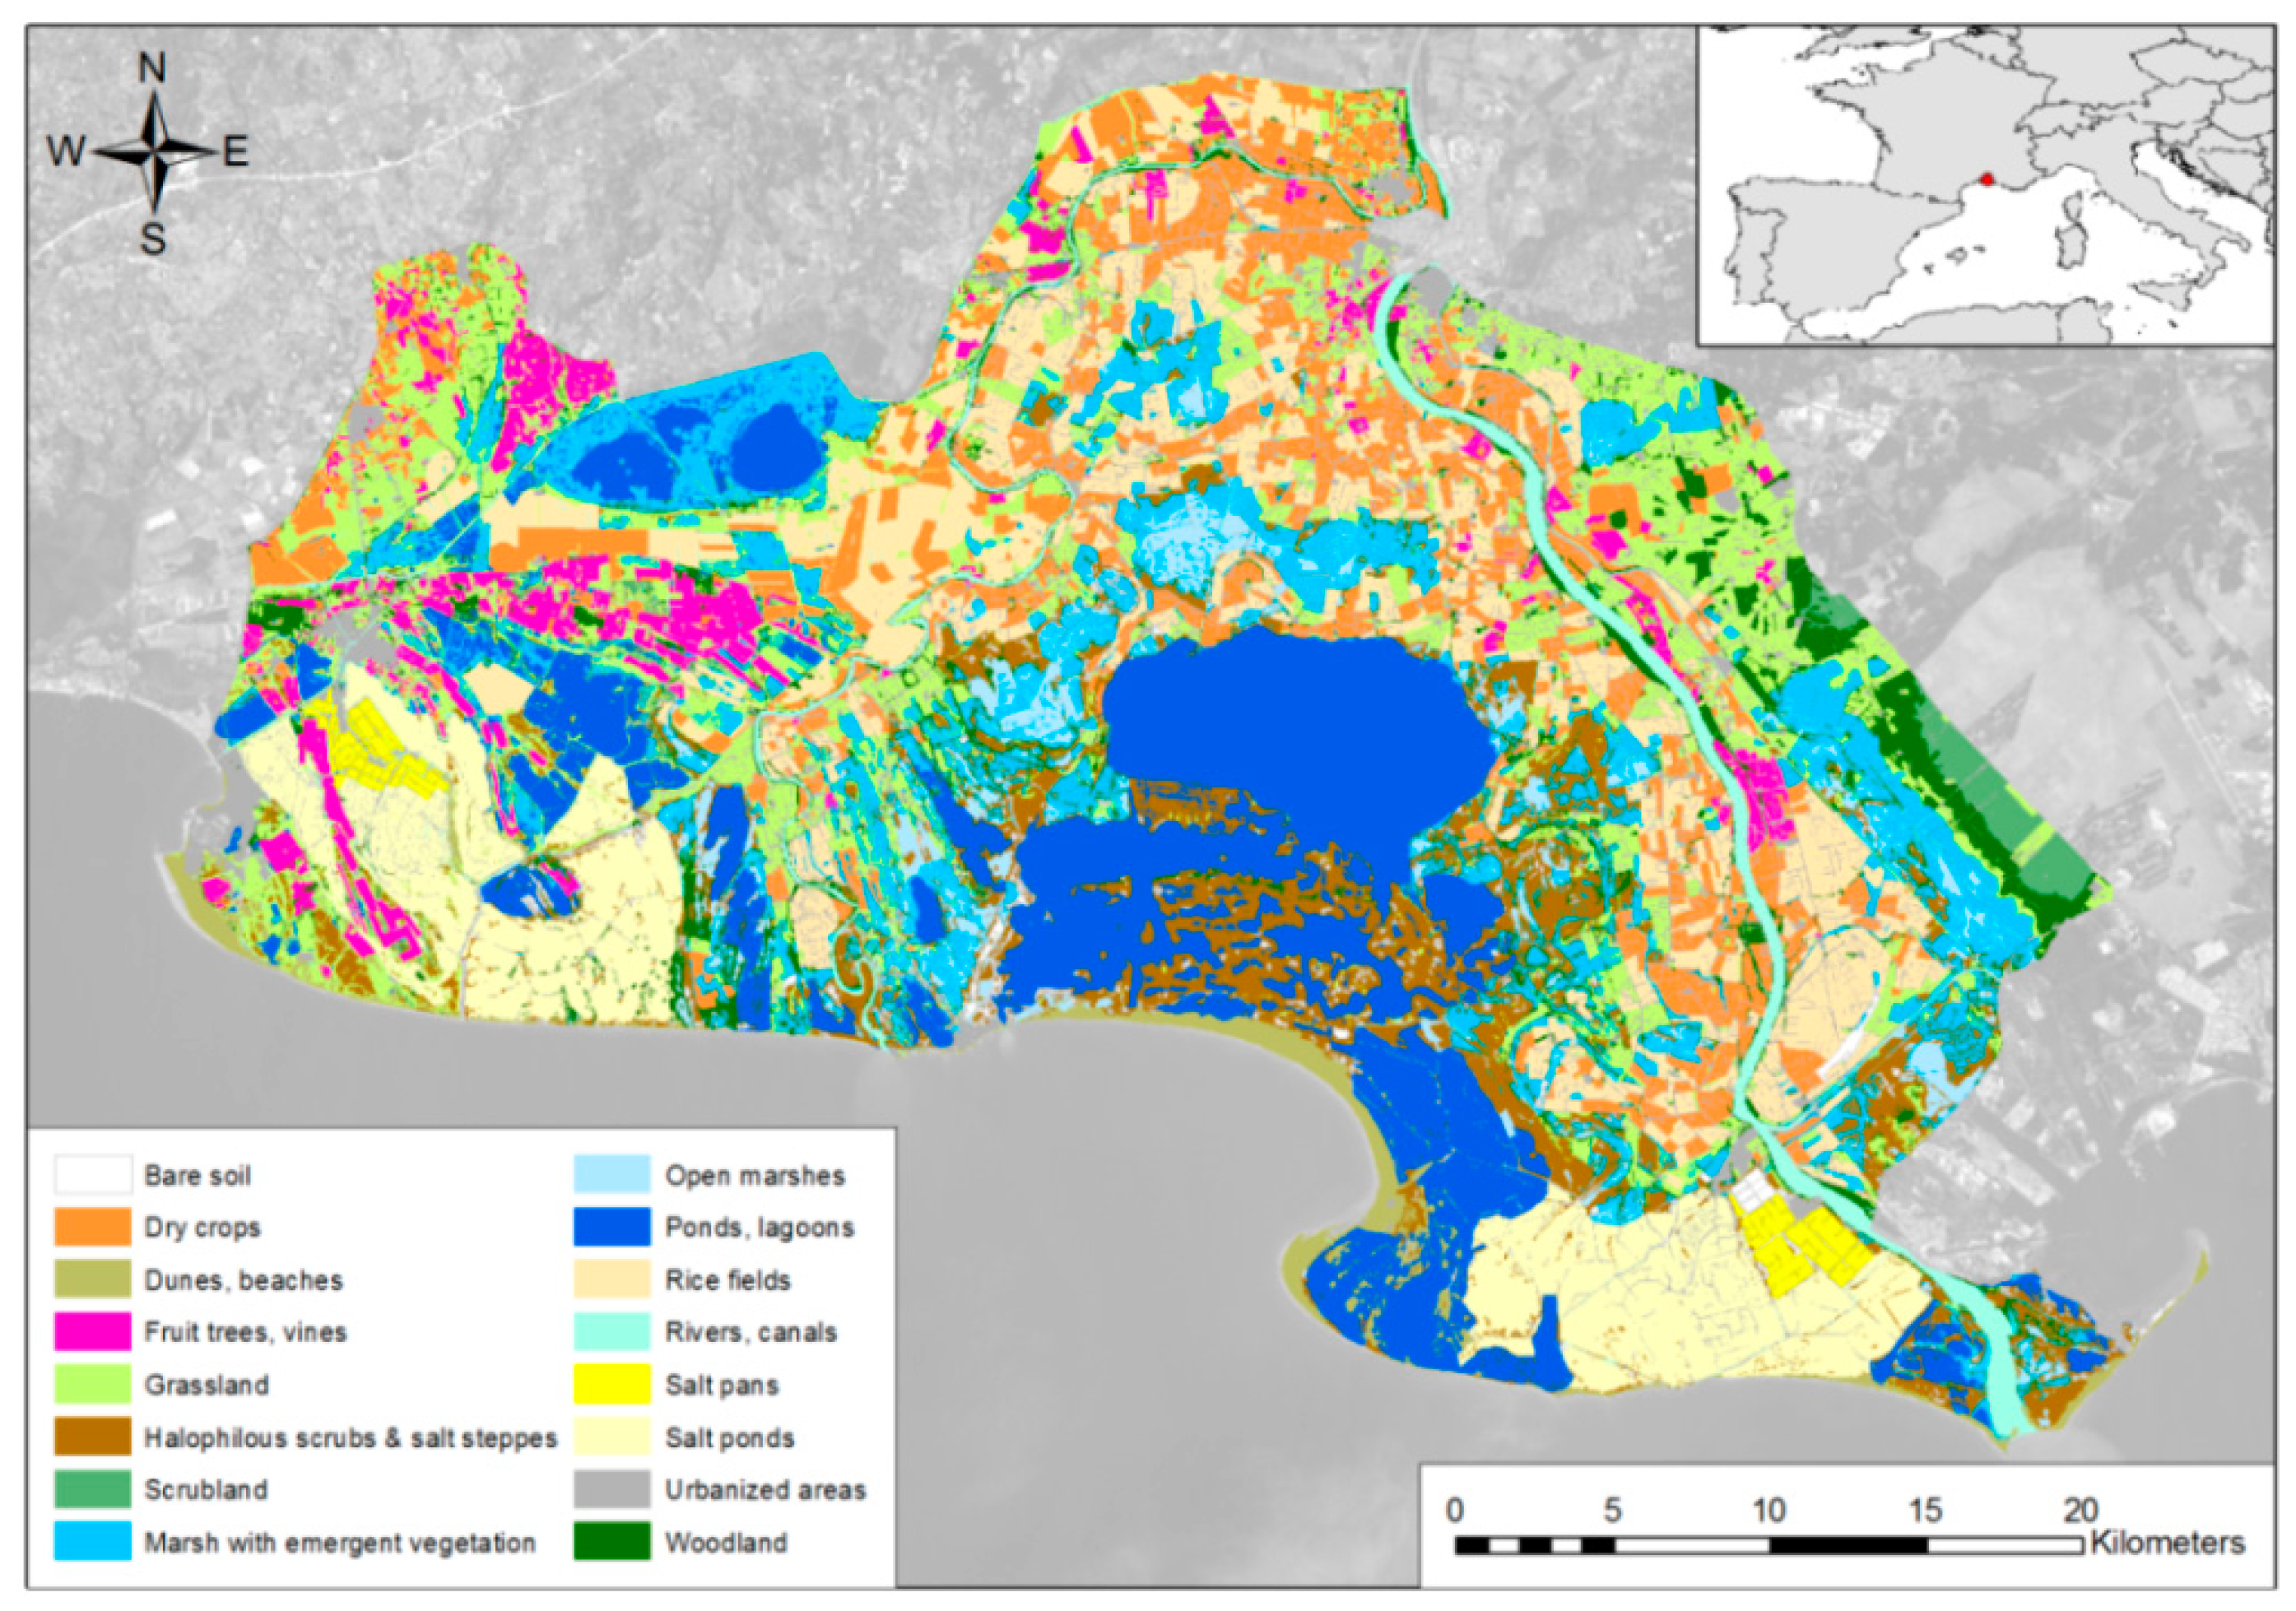
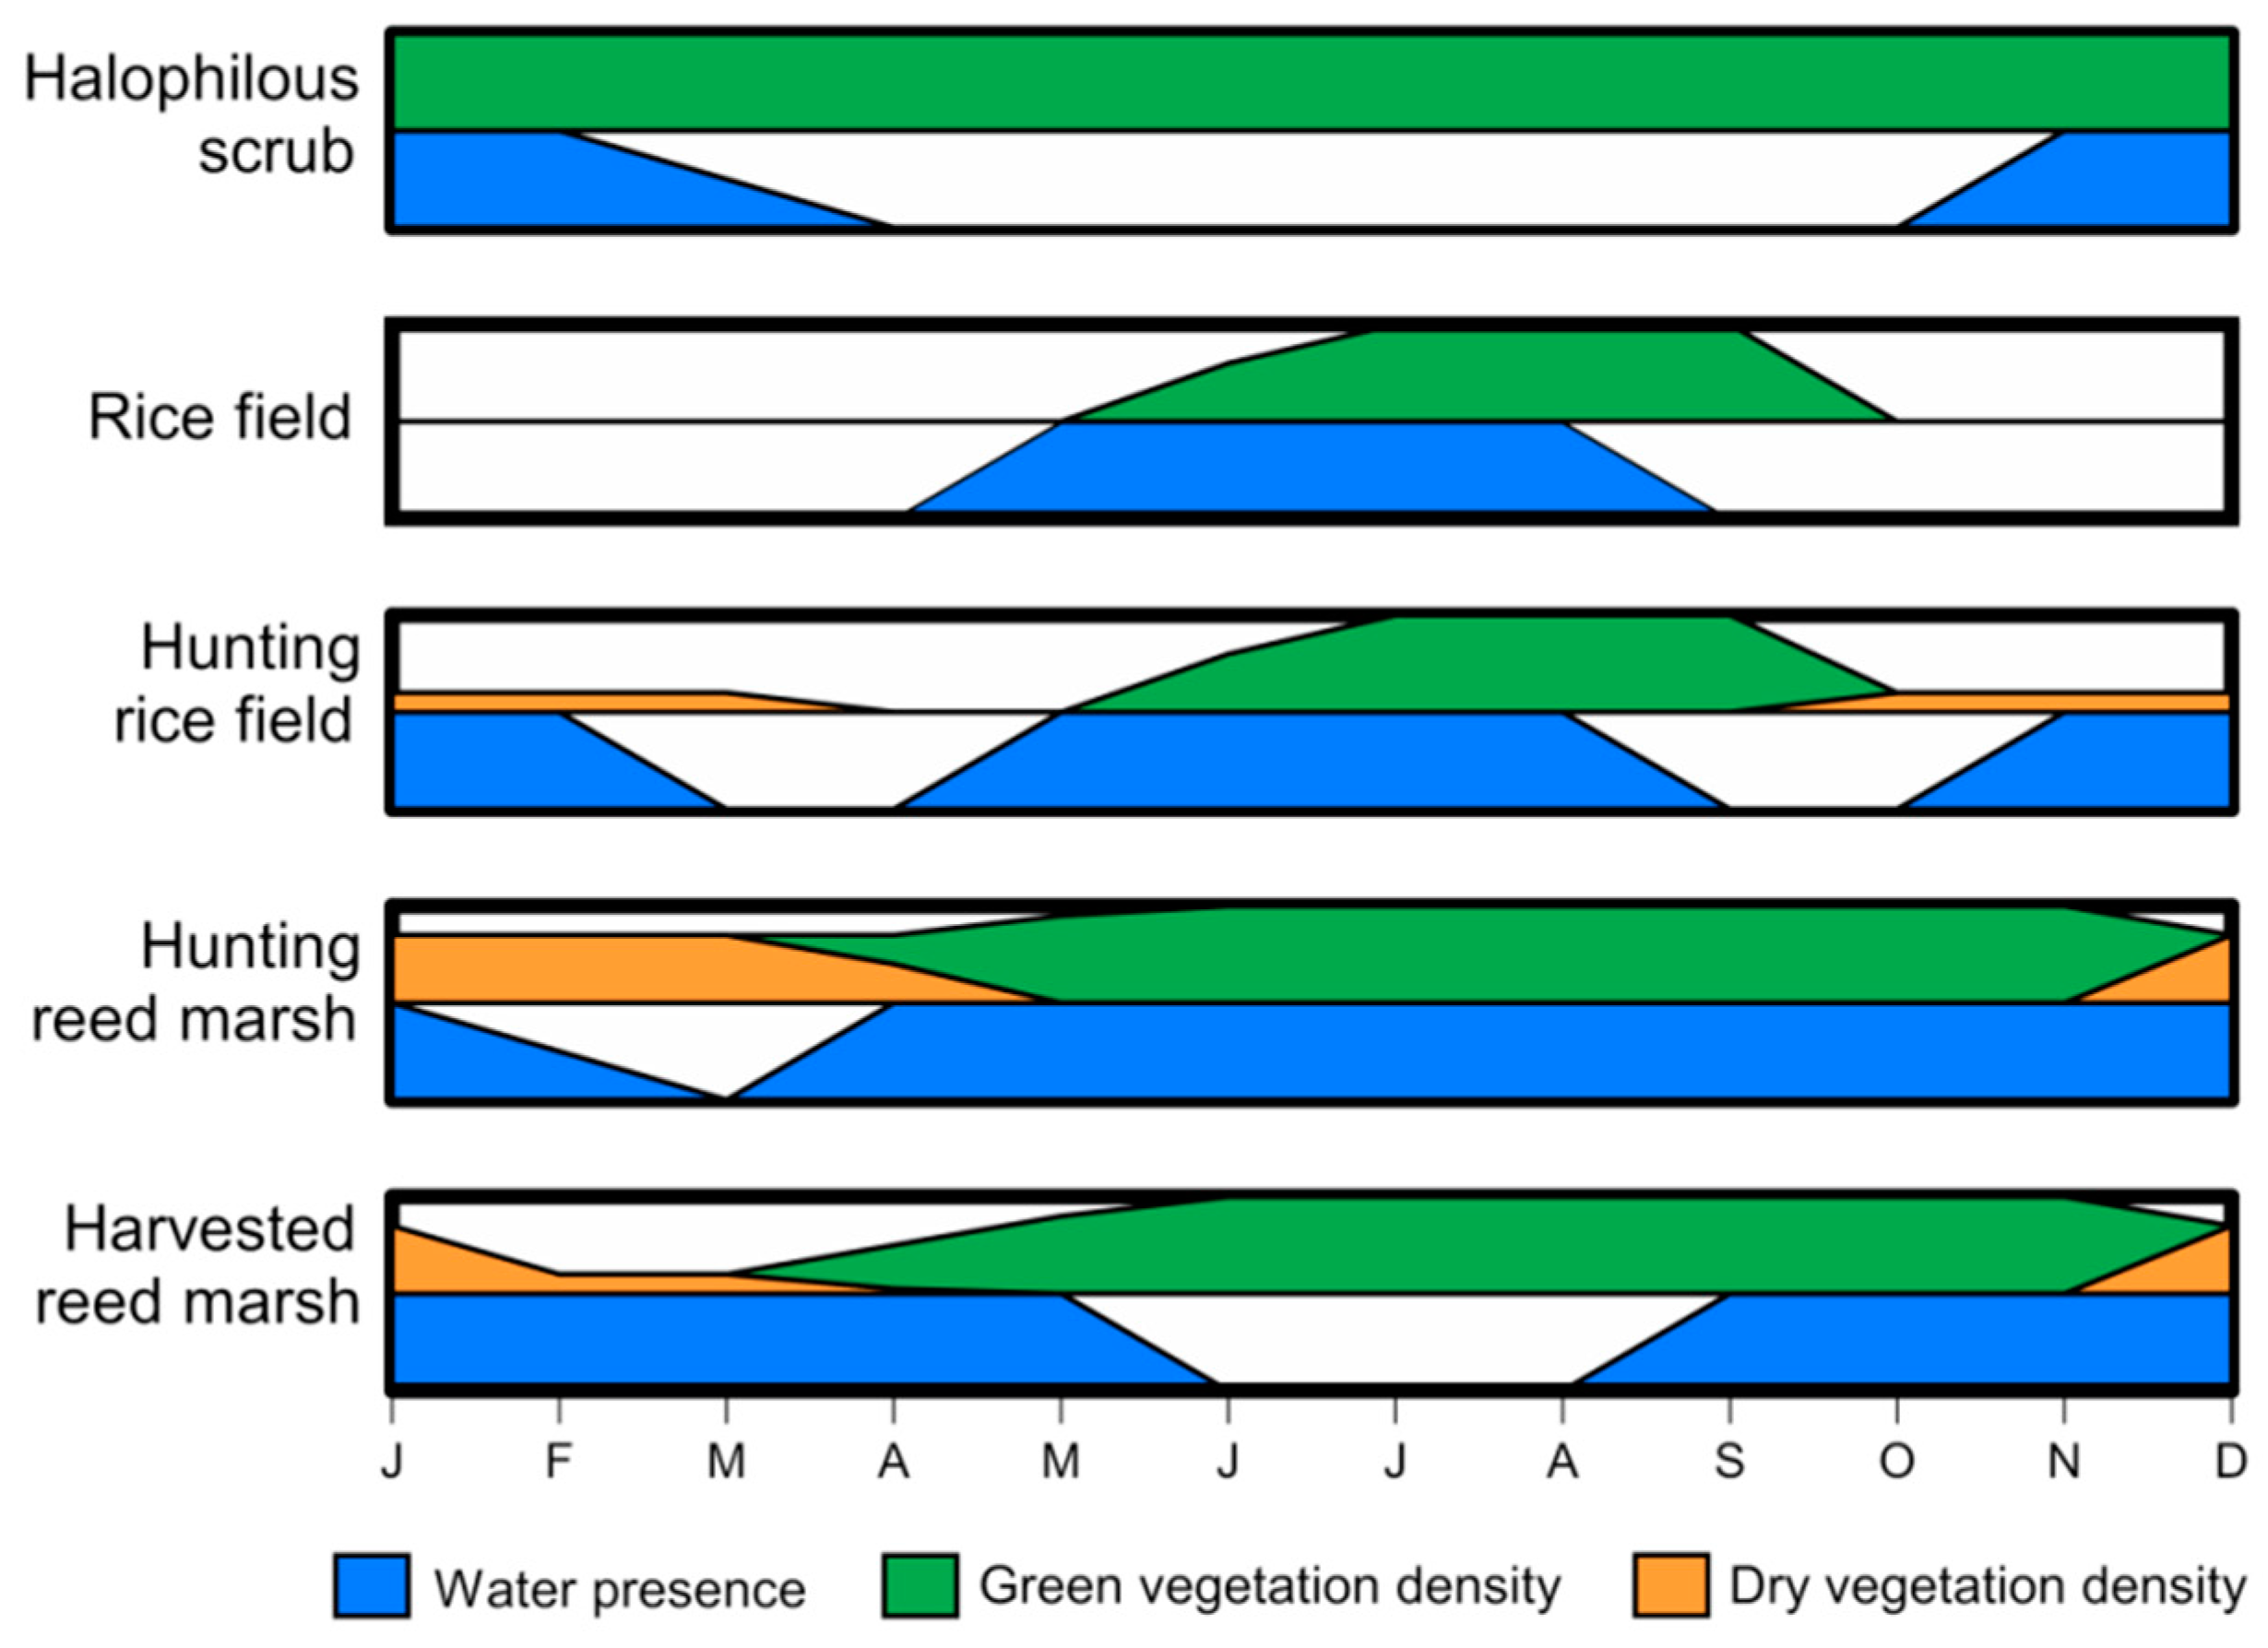
2.1. Ground-Truth Data
2.2. Optical Data
2.3. Development of the Water In Wetlands (WIW) Logical Rule
2.4. Validation of the Water In Wetlands (WIW) Logical Rule
3. Results
3.1. Optimal Classifiers for Detecting Water In Wetlands (WIW) According to Satellites
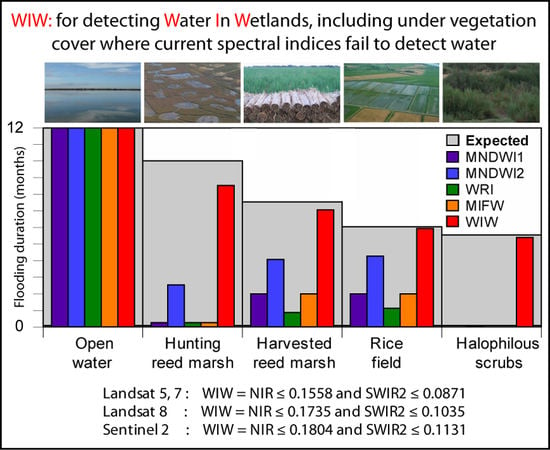
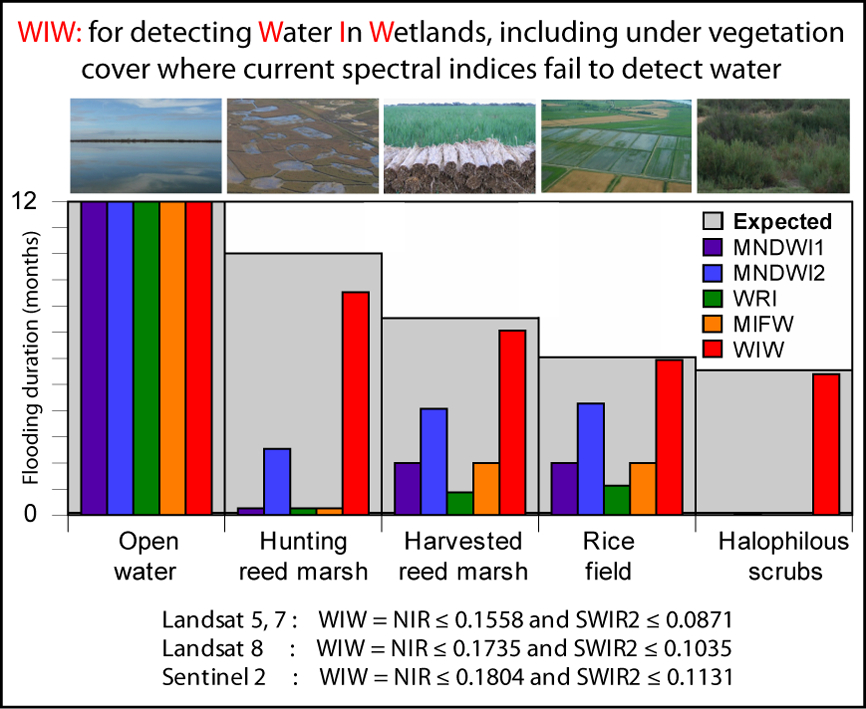
| Landsat 8 | : | WIW = NIR ≤ 0.1735 and SWIR2 ≤ 0.1035 |
| Landsat 5, 7 | : | WIW = NIR ≤ 0.1558 and SWIR2 ≤ 0.0871 |
| Sentinel 2 | : | WIW = NIR ≤ 0.1804 and SWIR2 ≤ 0.1131 |
3.2. Classification Accuracy According to Landcover Types
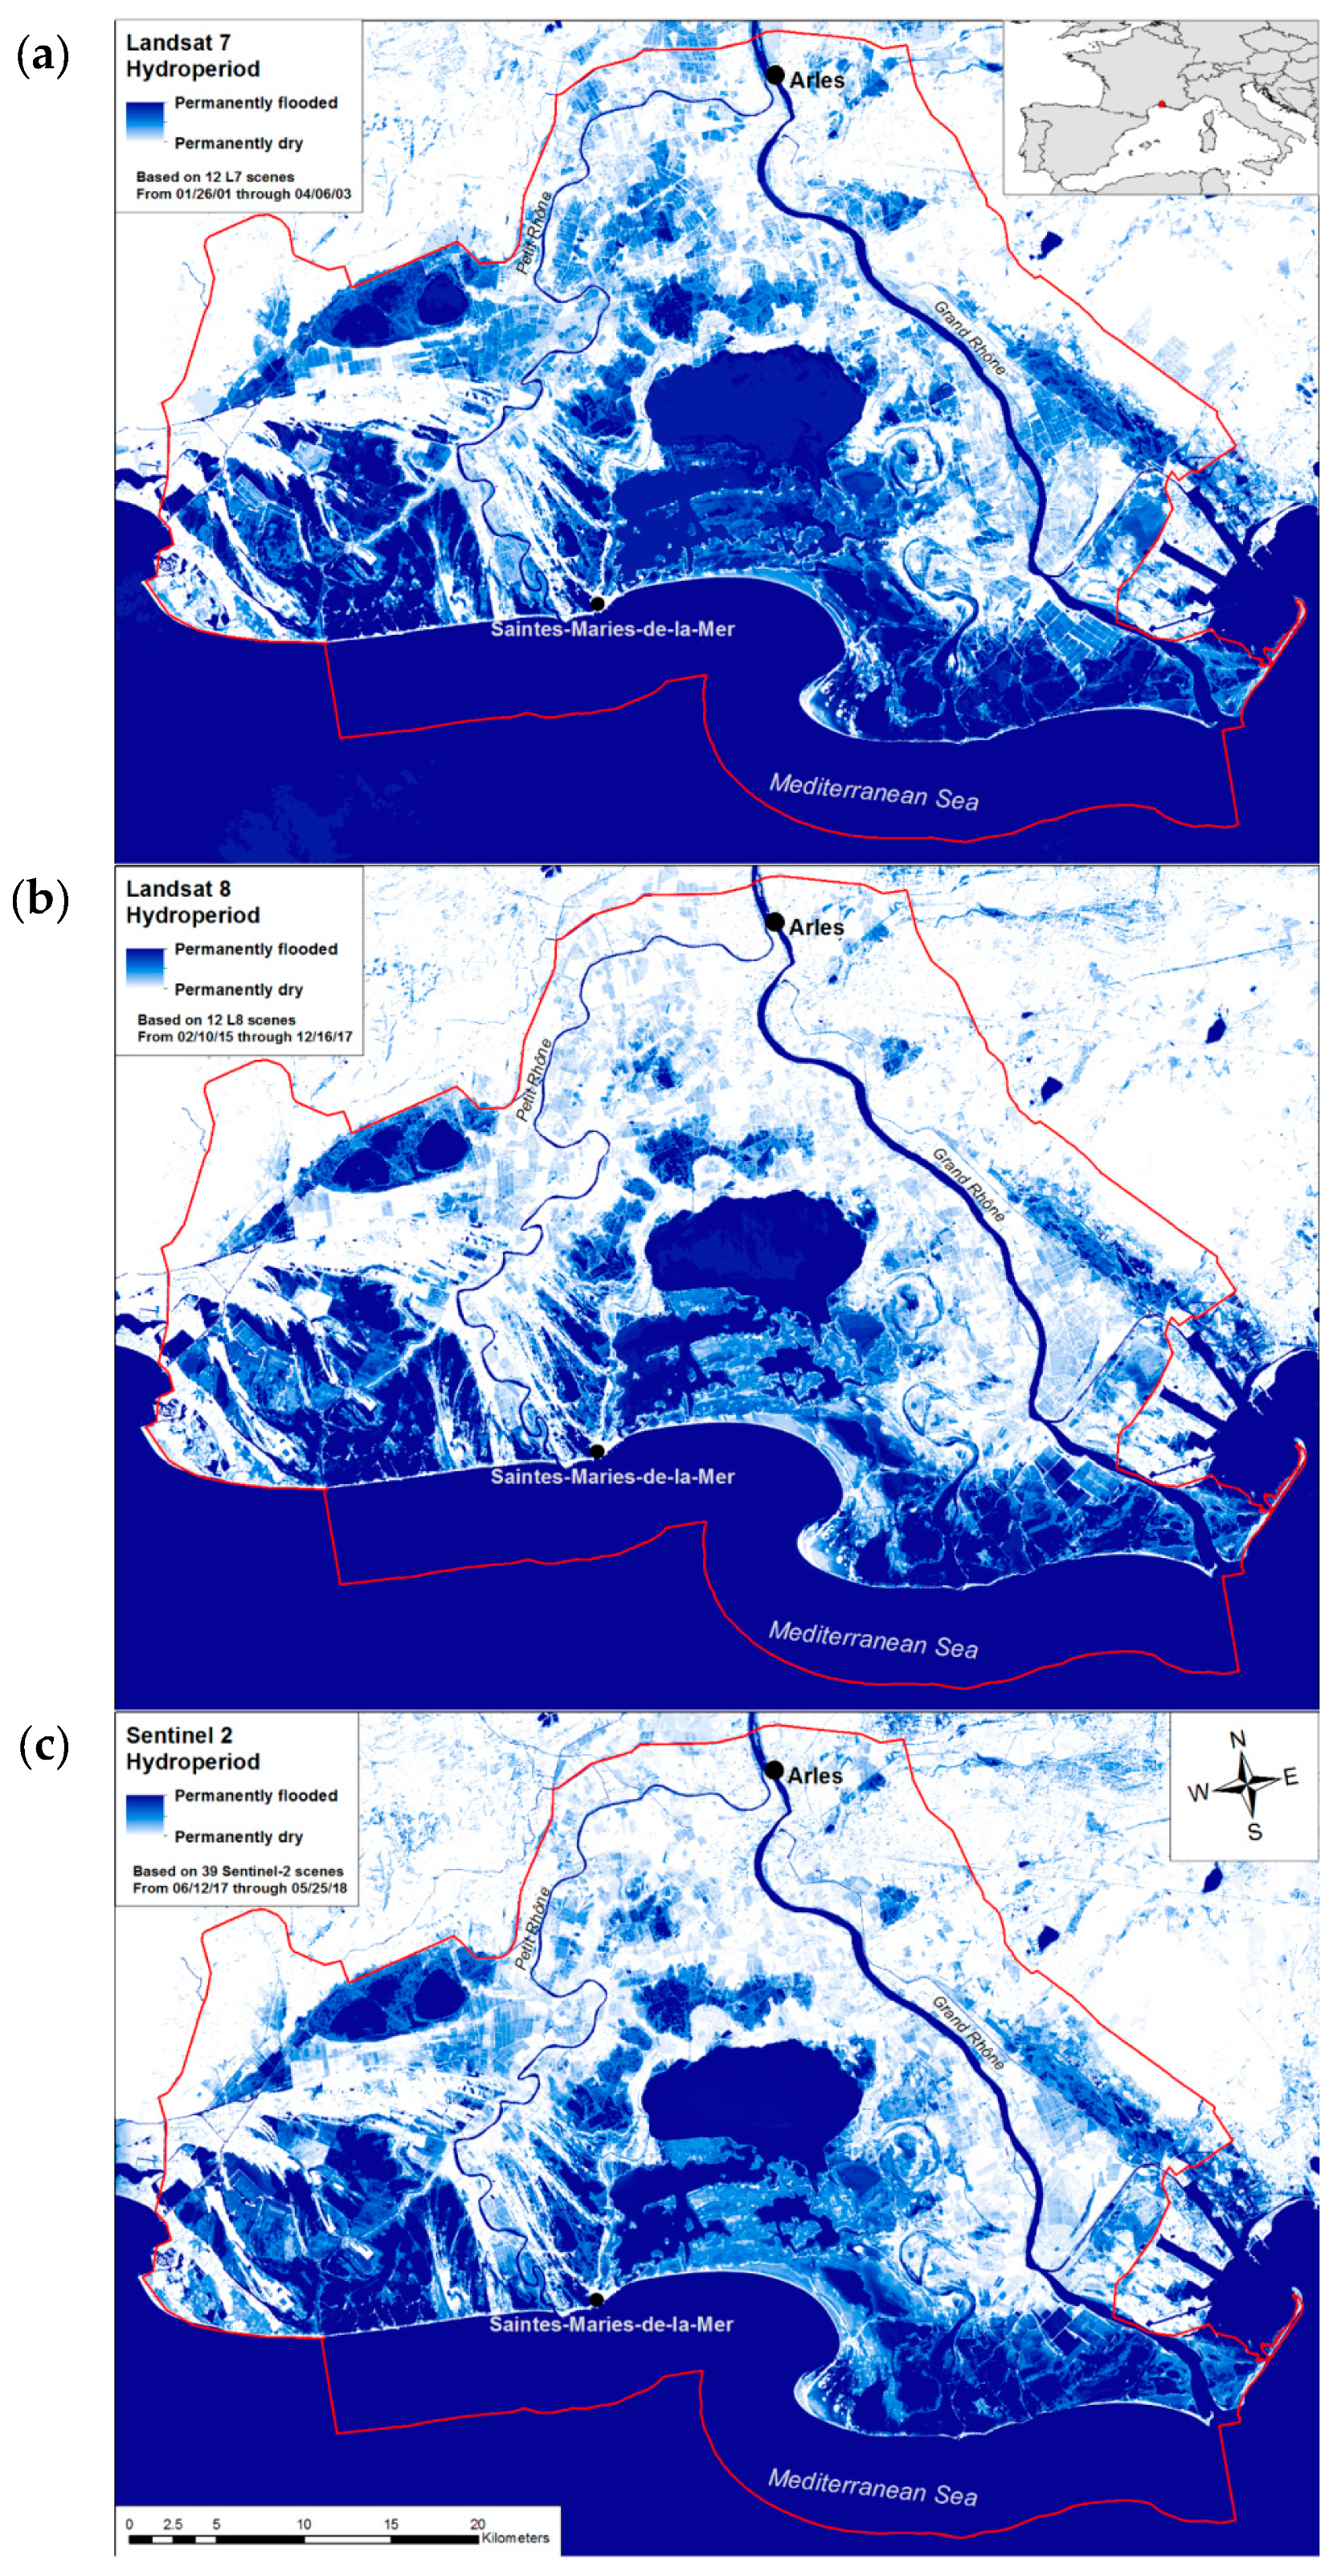
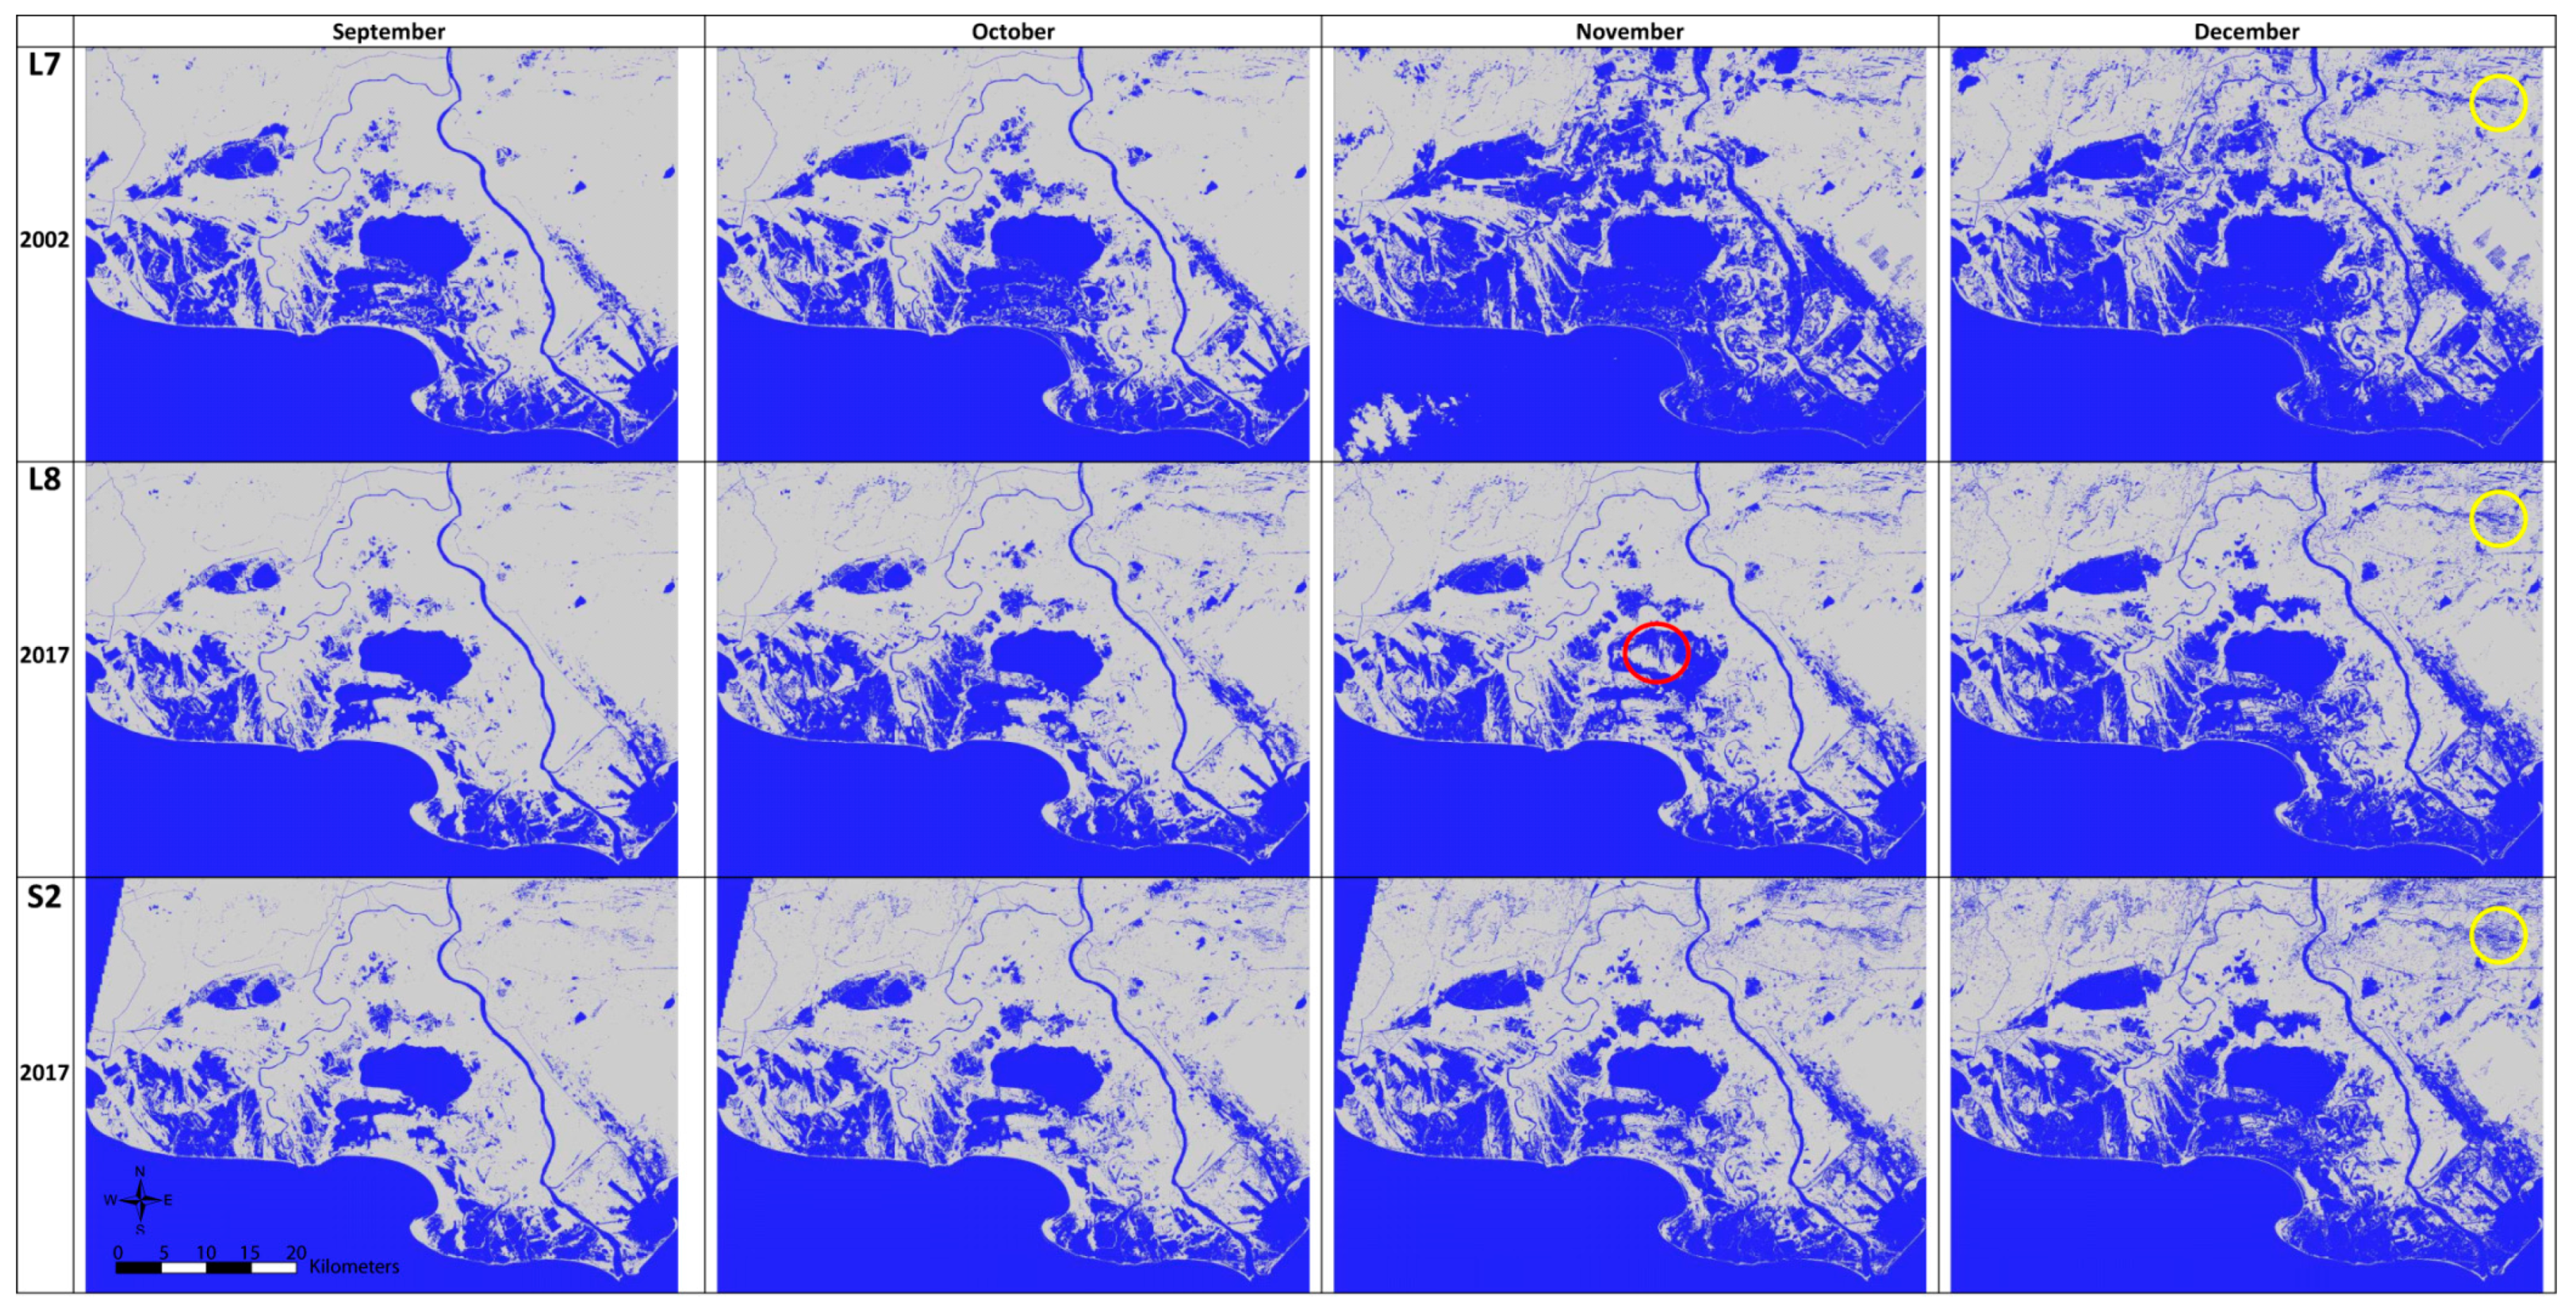
3.3. Coherence of Resulting Water Masks
3.4. Impact of Radiometric Corrections and Satellite Sensors on Classifier Accuracy
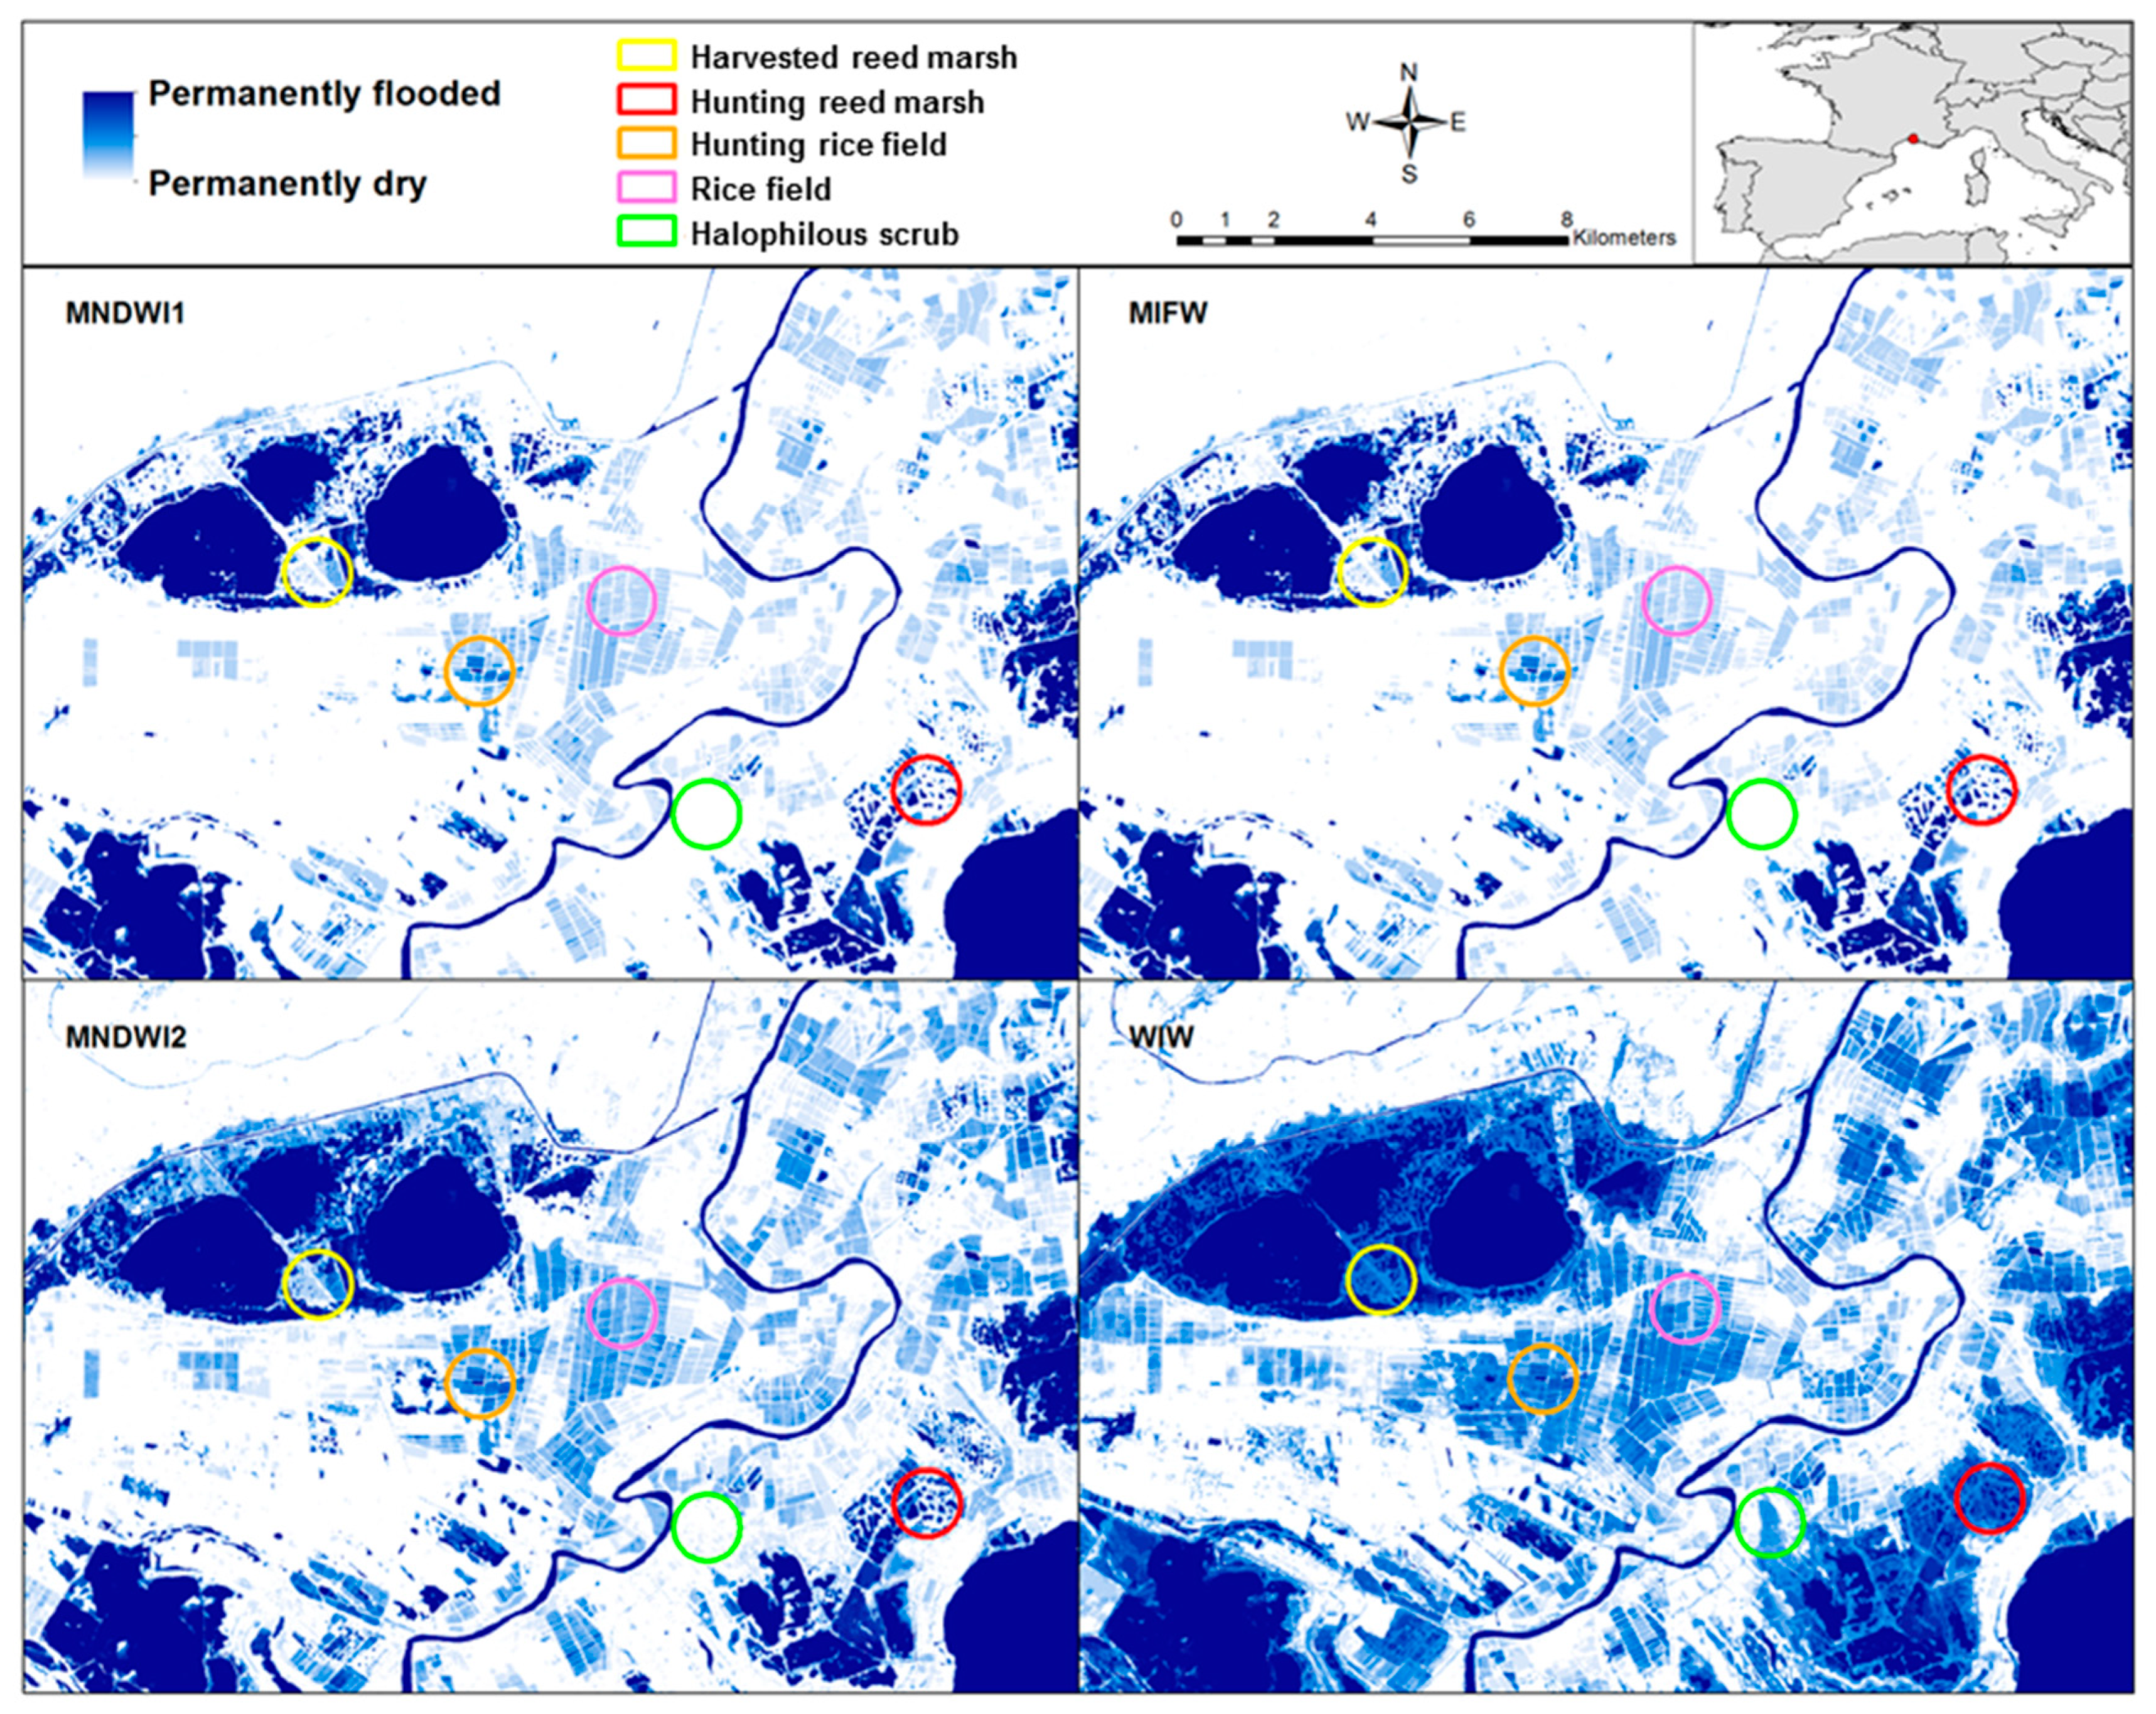
3.5. Performance of the WIW Logical Rule Relative to Other Water Indices
4. Discussion
5. Conclusions
Author Contributions
Funding
Acknowledgments
Conflicts of Interest
References
- Al-Azab, M.; El-Shorbagy, W.; Al-Ghais, S. Oil Pollution and its Environmental Impact in the Arabian Gulf Region, 1st ed.; Elsevier Science: Amsterdam, The Netherlands, 2005; Volume 3, ISBN 9780080457802. [Google Scholar]
- Aires, F.; Papa, F.; Prigent, C. A long-term, high-resolution wetland dataset over the Amazon Basin, downscaled from a multiwavelength retrieval using SAR data. J. Hydrometeorol. 2012, 14, 594–607. [Google Scholar] [CrossRef]
- Pettorelli, N.; Laurance, W.F.; O’Brien, T.G.; Wegmann, M.; Nagendra, H.; Turner, W. Satellite remote sensing for applied ecologists: Opportunities and challenges. J. Appl. Ecol. 2014, 51, 839–848. [Google Scholar] [CrossRef]
- Pekel, J.-F.; Cottam, A.; Gorelick, N.; Belward, A.S. High-resolution mapping of global surface water and its long-term changes. Nature 2016, 540, 418–422. [Google Scholar] [CrossRef] [PubMed]
- Ozesmi, S.L.; Bauer, M.E. Satellite remote sensing of wetlands. Wetl. Ecol. Manag. 2002, 10, 381–402. [Google Scholar] [CrossRef]
- Mahdavi, S.; Salehi, B.; Granger, J.; Amani, M.; Brisco, B.; Huang, W. Remote sensing for wetland classification: A comprehensive review. GIScience Remote Sens. 2018, 55, 623–658. [Google Scholar] [CrossRef]
- Amani, M.; Salehi, B.; Mahdavi, S.; Brisco, B. Spectral analysis of wetlands using multi-source optical satellite imagery. ISPRS J. Photogramm. Remote Sens. 2018, 144, 119–136. [Google Scholar] [CrossRef]
- Finlayson, C.M.; D’Cruz, R.; Davidson, N.; Millennium Ecosystem Assessment (Program); World Resources Institute. Ecosystems and Human Well-Being: Wetlands and Water: Synthesis; World Resources Institute: Washington, DC, USA, 2005; ISBN 978-1-56973-597-8. [Google Scholar]
- Davidson, N.C. How much wetland has the world lost? Long-term and recent trends in global wetland area. Mar. Freshw. Res. 2014, 65, 934. [Google Scholar] [CrossRef]
- Dronova, I. Object-based image analysis in wetland research: A review. Remote Sens. 2015, 7, 6380–6413. [Google Scholar] [CrossRef]
- Adam, E.; Mutanga, O.; Rugege, D. Multispectral and hyperspectral remote sensing for identification and mapping of wetland vegetation: A review. Wetl. Ecol. Manag. 2010, 18, 281–295. [Google Scholar] [CrossRef]
- Tiner, R.W.; Lang, M.W.; Klemas, V. Remote Sensing of Wetlands: Applications and Advances; CRC Press Taylor & Francis Group: Boca Raton, FL, USA, 2015; ISBN 978-1-4822-3735-1. [Google Scholar]
- Gallant, A. The challenges of remote monitoring of wetlands. Remote Sens. 2015, 7, 10938–10950. [Google Scholar] [CrossRef]
- Henderson, F.M.; Lewis, A.J. Radar detection of wetland ecosystems: A review. Int. J. Remote Sens. 2008, 29, 5809–5835. [Google Scholar] [CrossRef]
- Schmidt, K.S.; Skidmore, A.K. Spectral discrimination of vegetation types in a coastal wetland. Remote Sens. Env. 2003, 85, 92–108. [Google Scholar] [CrossRef]
- Mutanga, O.; Adam, E.; Cho, M.A. High density biomass estimation for wetland vegetation using WorldView-2 imagery and random forest regression algorithm. Int. J. Appl. Earth Obs. Geoinf. 2012, 18, 399–406. [Google Scholar] [CrossRef]
- Crist, E.P.; Cicone, R.C. A Physically-Based Transformation of Thematic Mapper Data—The TM Tasseled Cap. IEEE Trans. Geosci. Remote Sens. 1984, 3, 256–263. [Google Scholar] [CrossRef]
- Leblanc, M.; Lemoalle, J.; Bader, J.-C.; Tweed, S.; Mofor, L. Thermal remote sensing of water under flooded vegetation: New observations of inundation patterns for the ‘Small’ Lake Chad. J. Hydrol. 2011, 404, 87–98. [Google Scholar] [CrossRef]
- Perennou, C.; Guelmami, A.; Paganini, M.; Philipson, P.; Poulin, B.; Strauch, A.; Tottrup, C.; Truckenbrodt, J.; Geijzendorffer, I.R. Chapter Six—Mapping Mediterranean wetlands with remote sensing: A good-looking map is not always a good map. In Advances in Ecological Research; Bohan, D.A., Dumbrell, A.J., Woodward, G., Jackson, M., Eds.; Next Generation Biomonitoring: Part 1; Academic Press: Cambridge, MA, USA, 2018; Volume 58, pp. 243–277. [Google Scholar]
- Boavida, M.-J. Wetlands: Most relevant structural and functional aspects. Limnetica 1999, 17, 57–63. [Google Scholar]
- Coops, H.; Hosper, S.H. Water-level management as a tool for the restoration of shallow lakes in the Netherlands. Lake Reserv. Manag. 2002, 18, 293–298. [Google Scholar] [CrossRef]
- Acharya, T.D.; Subedi, A.; Lee, D.H. Evaluation of Water Indices for Surface Water Extraction in a Landsat 8 Scene of Nepal. Sensors 2018, 18, 2580. [Google Scholar] [CrossRef]
- Donchyts, G.; Schellekens, J.; Winsemius, H.; Eisemann, E.; van de Giesen, N. A 30 m Resolution Surface Water Mask Including Estimation of Positional and Thematic Differences Using Landsat 8, SRTM and OpenStreetMap: A Case Study in the Murray-Darling Basin, Australia. Remote Sens. 2016, 8, 386. [Google Scholar] [CrossRef]
- Bourgeau-Chavez, L.L.; Smith, K.B.; Brunzell, S.M.; Kasischke, E.S.; Romanowicz, E.A.; Richardson, C.J. Remote monitoring of regional inundation patterns and hydroperiod in the Greater Everglades using Synthetic Aperture Radar. Wetlands 2005, 25, 176. [Google Scholar] [CrossRef]
- Jones, J.W. Efficient Wetland Surface Water Detection and Monitoring via Landsat: Comparison with in situ Data from the Everglades Depth Estimation Network. Remote Sens. 2015, 7, 12503–12538. [Google Scholar] [CrossRef] [Green Version]
- Davranche, A.; Poulin, B.; Lefebvre, G. Mapping flooding regimes in Camargue wetlands using seasonal multispectral data. Remote Sens. Environ. 2013, 138, 165–171. [Google Scholar] [CrossRef] [Green Version]
- Beeri, O.; Phillips, R.L. Tracking palustrine water seasonal and annual variability in agricultural wetland landscapes using Landsat from 1997 to 2005. Glob. Chang. Biol. 2007, 13, 897–912. [Google Scholar] [CrossRef]
- Huang, C.; Chen, Y.; Wu, J. Mapping spatio-temporal flood inundation dynamics at large river basin scale using time-series flow data and MODIS imagery. Int. J. Appl. Earth Obs. Geoinf. 2014, 26, 350–362. [Google Scholar] [CrossRef]
- Aires, F.; Miolane, L.; Prigent, C.; Pham, B.; Fluet-Chouinard, E.; Lehner, B.; Papa, F. A global dynamic long-term inundation extent dataset at high spatial resolution derived through downscaling of satellite observations. J. Hydrometeorol. 2017, 18, 1305–1325. [Google Scholar] [CrossRef]
- Adell, C.; Puech, C. L’analyse spatiale des plans d’eau extraits par télédétection satellitale permet-elle de retrouver la marque cynégétique en Camargue? Bull. Société Fr. Photogrammétrie Télédétection 2003, 172, 76–86. [Google Scholar]
- Feyisa, G.L.; Meilby, H.; Fensholt, R.; Proud, S.R. Automated Water Extraction Index: A new technique for surface water mapping using Landsat imagery. Remote Sens. Environ. 2014, 140, 23–35. [Google Scholar] [CrossRef]
- Gao, B. NDWI—A normalized difference water index for remote sensing of vegetation liquid water from space. Remote Sens. Environ. 1996, 58, 257–266. [Google Scholar] [CrossRef]
- Kordelas, G.A.; Manakos, I.; Aragonés, D.; Díaz-Delgado, R.; Bustamante, J. Fast and Automatic Data-Driven Thresholding for Inundation Mapping with Sentinel-2 Data. Remote Sens. 2018, 10, 910. [Google Scholar] [CrossRef]
- Shen, L.; Li, C. Water body extraction from Landsat ETM+ imagery using adaboost algorithm. In Proceedings of the 2010 18th International Conference on Geoinformatics, Beijing, China, 18–20 June 2010; pp. 1–4. [Google Scholar]
- Singh, K.V.; Setia, R.; Sahoo, S.; Prasad, A.; Pateriya, B. Evaluation of NDWI and MNDWI for assessment of waterlogging by integrating digital elevation model and groundwater level. Geocarto Int. 2015, 30, 650–661. [Google Scholar] [CrossRef]
- Xu, H. Modification of normalised difference water index (NDWI) to enhance open water features in remotely sensed imagery. Int. J. Remote Sens. 2006, 27, 3025–3033. [Google Scholar] [CrossRef]
- McFeeters, S.K. The use of the Normalized Difference Water Index (NDWI) in the delineation of open water features. Int. J. Remote Sens. 1996, 17, 1425–1432. [Google Scholar] [CrossRef]
- Díaz-Delgado, R.; Aragonés, D.; Afán, I.; Bustamante, J. Long-Term Monitoring of the Flooding Regime and Hydroperiod of Doñana Marshes with Landsat Time Series (1974–2014). Remote Sens. 2016, 8, 775. [Google Scholar] [CrossRef]
- Sun, F.; Sun, W.; Chen, J.; Gong, P. Comparison and improvement of methods for identifying waterbodies in remotely sensed imagery. Int. J. Remote Sens. 2012, 33, 6854–6875. [Google Scholar] [CrossRef]
- Zhou, Y.; Dong, J.; Xiao, X.; Xiao, T.; Yang, Z.; Zhao, G.; Zou, Z.; Qin, Y. Open surface water mapping algorithms: A comparison of water-related spectral indices and sensors. Water 2017, 9, 256. [Google Scholar] [CrossRef]
- Fisher, A.; Flood, N.; Danaher, T. Comparing Landsat water index methods for automated water classification in eastern Australia. Remote Sens. Environ. 2016, 175, 167–182. [Google Scholar] [CrossRef]
- Acharya, T.; Lee, D.; Yang, I.; Lee, J. Identification of Water Bodies in a Landsat 8 OLI Image Using a J48 Decision Tree. Sensors 2016, 16, 1075. [Google Scholar] [CrossRef]
- Lefebvre, G.; Germain, C.; Poulin, B. Contribution of rainfall vs. water management to Mediterranean wetland hydrology: Development of an interactive simulation tool to foster adaptation to climate variability. Environ. Model. Softw. 2015, 74, 39–47. [Google Scholar] [CrossRef]
- Poulin, B. Reedbed management and conservation in Europe: Introduction. In Wildlife, Land and People: Priorities for the 21st Century; Field, R., Warren, R.J., Okarma, H., Sievert, P.R., Eds.; Wildlife Society: Bethesda, MD, USA, 2001; pp. 378–381. [Google Scholar]
- Russi, D.; ten Brink, P.; Farmer, A.; Badura, T.; Coates, D.; Förster, J.; Kumar, R.; Davidson, N. The Economics of Ecosystems and Biodiversity for Water and Wetlands; IEEP, Ramsar Secretariat: London, UK; Gland, Switzerland, 2013. [Google Scholar]
- Lefebvre, G.; Redmond, L.; Germain, C.; Palazzi, E.; Terzago, S.; Willm, L.; Poulin, B. Predicting the vulnerability of seasonally-flooded wetlands to climate change across the Mediterranean Basin. Sci. Total Environ. 2019, 692, 546–555. [Google Scholar] [CrossRef]
- Giorgi, F. Climate change hot-spots. Geophys. Res. Lett. 2006, 33, L08707. [Google Scholar] [CrossRef]
- Giorgi, F.; Lionello, P. Climate change projections for the Mediterranean region. Glob. Planet. Chang. 2008, 63, 90–104. [Google Scholar] [CrossRef]
- Dubrovský, M.; Hayes, M.; Duce, P.; Trnka, M.; Svoboda, M.; Zara, P. Multi-GCM projections of future drought and climate variability indicators for the Mediterranean region. Reg. Environ. Chang. 2014, 14, 1907–1919. [Google Scholar] [CrossRef]
- Postel, S.; Carpenter, S. Freshwater ecosystem services. In Nature’s Services: Societal Dependence on Natural Ecosystems; Island Press: Washington, DC, USA, 1997; pp. 195–214. ISBN 978-1-59726-775-5. [Google Scholar]
- TEEB. The Economics of Ecosystems and Biodiversity: Ecological and Economic Foundations, 1st ed.; Earthscan, Pushpam Kumar: London, UK; Washington, DC, USA, 2010; ISBN 978-1-84971-212-5. [Google Scholar]
- Poulin, B.; Davranche, A.; Lefebvre, G. Ecological assessment of Phragmites australis wetlands using multi-season SPOT-5 scenes. Remote Sens. Environ. 2010, 114, 1602–1609. [Google Scholar] [CrossRef] [Green Version]
- Horritt, M.S.; Mason, D.C.; Luckman, A.J. Flood boundary delineation from Synthetic Aperture Radar imagery using a statistical active contour model. Int. J. Remote Sens. 2001, 22, 2489–2507. [Google Scholar] [CrossRef]
- Cazals, C.; Rapinel, S.; Frison, P.-L.; Bonis, A.; Mercier, G.; Mallet, C.; Corgne, S.; Rudant, J.-P. Mapping and Characterization of Hydrological Dynamics in a Coastal Marsh Using High Temporal Resolution Sentinel-1A Images. Remote Sens. 2016, 8, 570. [Google Scholar] [CrossRef]
- Jensen, K.; McDonald, K.; Podest, E.; Rodriguez-Alvarez, N.; Horna, V.; Steiner, N. Assessing L-Band GNSS-Reflectometry and Imaging Radar for Detecting Sub-Canopy Inundation Dynamics in a Tropical Wetlands Complex. Remote Sens. 2018, 10, 1431. [Google Scholar] [CrossRef]
- Hess, L.L.; Melack, J.M.; Novo, E.M.L.M.; Barbosa, C.C.F.; Gastil, M. Dual-season mapping of wetland inundation and vegetation for the central Amazon basin. Remote Sens. Environ. 2003, 87, 404–428. [Google Scholar] [CrossRef]
- White, L.; Brisco, B.; Dabboor, M.; Schmitt, A.; Pratt, A. A collection of SAR methodologies for monitoring wetlands. Remote Sens. 2015, 7, 7615–7645. [Google Scholar] [CrossRef]
- Tsyganskaya, V.; Martinis, S.; Marzahn, P.; Ludwig, R. SAR-based detection of flooded vegetation—A review of characteristics and approaches. Int. J. Remote Sens. 2018, 39, 2255–2293. [Google Scholar] [CrossRef]
- Rokni, K.; Ahmad, A.; Selamat, A.; Hazini, S. Water feature extraction and change detection using multitemporal Landsat imagery. Remote Sens. 2014, 6, 4173–4189. [Google Scholar] [CrossRef]
- Poulin, B.; Lefebvre, G.; Allard, S.; Mathevet, R. Reed harvest and summer drawdown enhance bittern habitat in the Camargue. Biol. Conserv. 2009, 142, 689–695. [Google Scholar] [CrossRef]
- Therneau, T.M.; Atkinson, E.J. An Introduction to Recursive Partitioning Using the RPART Routines; Mayo Foundation: Scottsdale, AZ, USA, 2019; p. 60. [Google Scholar]
- Esposito, F.; Malerba, D.; Semeraro, G.; Tamma, V. The effects of pruning methods on the predictive accuracy of induced decision trees. Appl. Stoch. Models Bus. Ind. 1999, 15, 277–299. [Google Scholar] [CrossRef]
- Breiman, L. Classification and Regression Trees, 1st ed.; Routledge: New York, NY, USA, 1984; ISBN 978-1-315-13947-0. [Google Scholar]
- Rikimaru, A.; Roy, P.S.; Miyatake, S. Tropical forest cover density mapping. Trop. Ecol. 2002, 43, 39–47. [Google Scholar]
- Richardson, A.J.; Everitt, J.H. Using spectral vegetation indices to estimate rangeland productivity. Geocarto Int. 1992, 7, 63–69. [Google Scholar] [CrossRef]
- Gond, V.; Bartholomé, E.; Ouattara, F.; Nonguierma, A.; Bado, L. Surveillance et cartographie des plans d’eau et des zones humides et inondables en régions arides avec l’instrument VEGETATION embarqué sur SPOT-4. Int. J. Remote Sens. 2004, 25, 987–1004. [Google Scholar] [CrossRef]
- Crippen, R.E. Calculating the vegetation index faster. Remote Sens. Environ. 1990, 34, 71–73. [Google Scholar] [CrossRef]
- Huntjr, E.; Rock, B. Detection of changes in leaf water content using Near- and Middle-Infrared reflectances. Remote Sens. Environ. 1989, 30, 43–54. [Google Scholar] [CrossRef]
- Rouse, J., Jr.; Haas, R.H.; Schell, J.A.; Deering, D.W. Monitoring vegetation systems in the Great Plains with ERTS. In NASA Goddard Space Flight Center 3d ERTS-1 Symposium; NASA: Washington, DC, USA, 1974; Volume 1, pp. 309–317. [Google Scholar]
- Rondeaux, G.; Steven, M.; Baret, F. Optimization of soil-adjusted vegetation indices. Remote Sens. Environ. 1996, 55, 95–107. [Google Scholar] [CrossRef]
- Lillesand, T.M.; Kiefer, R.W. Remote Sensing and Image Interpretation, 2nd ed.; Wiley: New York, NY, USA, 1987; ISBN 978-0-471-84517-1. [Google Scholar]
- Huete, A.R. A soil-adjusted vegetation index (SAVI). Remote Sens. Environ. 1988, 25, 295–309. [Google Scholar] [CrossRef]
- Pearson, R.L.; Miller, L.D. Remote mapping of standing crop biomass for estimation of the productivity of the short-grass Prairie, Pawnee National Grasslands, Colorado. In Proceedings of the 8th International Symposium on Remote Sensing of Environment, Ann Arbor, MI, USA, 2–6 October 1972; pp. 1357–1381. [Google Scholar]
- Broge, N.H.; Leblanc, E. Comparing prediction power and stability of broadband and hyperspectral vegetation indices for estimation of green leaf area index and canopy chlorophyll density. Remote Sens. Environ. 2001, 76, 156–172. [Google Scholar] [CrossRef]
- Caillaud, L.; Guillaumont, B.; Manaud, F. Essai de discrimination des modes d’utilisation des marais maritimes par analyse multitemporelle d’images spot. Application aux marais maritimes du Centre Ouest. 1987. Available online: https://archimer.ifremer.fr/doc/00446/55728/ (accessed on 20 September 2019).
- Kameyama, S.; Yamagata, Y.; Nakamura, F.; Kaneko, M. Development of WTI and turbidity estimation model using SMA — application to Kushiro Mire, eastern Hokkaido. Jpn. Remote Sens. Environ. 2001, 77, 1–9. [Google Scholar] [CrossRef]
- Centre Français du Riz. Bilan de la campagne 2006 et résultats variétaux. 2007. [Google Scholar]
- Centre Français du Riz. Bilan de la Campagne 2017 et résultats variétaux. 2018. [Google Scholar]
- Kordelas, G.A.; Manakos, I.; Lefebvre, G.; Poulin, B. Automatic inundation mapping using Sentinel-2 data applicable to both Camargue and Doñana wetlands. Remote Sens.
- De Oliveira, G.A.; Bureau, S.; Renard, C.M.-G.C.; Pereira-Netto, A.B.; de Castilhos, F. Comparison of NIRS approach for prediction of internal quality traits in three fruit species. Food Chem. 2014, 143, 223–230. [Google Scholar] [CrossRef] [PubMed]
- Daffara, C.; Pampaloni, E.; Pezzati, L.; Barucci, M.; Fontana, R. Scanning multispectral IR reflectography SMIRR: An advanced tool for art diagnostics. Acc. Chem. Res. 2010, 43, 847–856. [Google Scholar] [CrossRef] [PubMed]
- Delaney, J.K.; Thoury, M.; Zeibel, J.G.; Ricciardi, P.; Morales, K.M.; Dooley, K.A. Visible and infrared imaging spectroscopy of paintings and improved reflectography. Herit. Sci. 2016, 4, 6. [Google Scholar] [CrossRef]
- van Asperen de Boer, J.R. Infrared reflectography: A method for the examination of paintings. Appl. Opt. 1968, 7, 1711–1714. [Google Scholar] [CrossRef]
- Tamisier, A.; Grillas, P. A review of habitat changes in the Camargue: An assessment of the effects of the loss of biological diversity on the wintering waterfowl community. Biol. Conserv. 1994, 70, 39–47. [Google Scholar] [CrossRef]
- Davis, T.J. The Ramsar Convention Manual: A Guide to the Convention on Wetlands; Ramsar Convention Bureau: Gland, Switzerland, 1997. [Google Scholar]
- Schlesinger, W.H.; Bernhardt, E.S. Biogeochemistry: An Analysis of Global Change, 3rd ed.; Elsevier, Academic Press: Amsterdam, The Netherlands; Boston, MA, USA, 2013; ISBN 978-0-12-385874-0. [Google Scholar]


| Spectral Band | Landsat 8 OLI | Landsat 7 ETM+ | Sentinel 2A, 2B | |||
|---|---|---|---|---|---|---|
| Band | Wavelength (µm) | Band | Wavelength (µm) | Band | Wavelength (µm) | |
| Blue (B1) | B1 | 0.43–0.45 | ||||
| Blue (B) | B2 | 0.45–0.51 | B1 | 0.45–0.52 | B2 | 0.46–0.52 |
| Green (G) | B3 | 0.53–0.59 | B2 | 0.52–0.60 | B3 | 0.54–0.58 |
| Red (R) | B4 | 0.64–0.67 | B3 | 0.63–0.69 | B4 | 0.65–0.68 |
| Red edge (RE1) | B5 | 0.698–0.712 | ||||
| Red edge (RE2) | B6 | 0.733–0.747 | ||||
| Red edge (RE3) | B7 | 0.773–0.793 | ||||
| Near Infrared (NIR) | B4 | 0.77–0.90 | B8 | 0.784–0.9 | ||
| Near Infrared (NIR) | B5 | 0.85–0.88 | B8A | 0.855–0.875 | ||
| Shortwave Infrared (SWIR1) | B6 | 1.57–1.67 | B5 | 1.55–1.75 | B11 | 1.565–1.655 |
| Shortwave Infrared (SWIR2) | B7 | 2.11–2.29 | B7 | 2.09–2.35 | B12 | 2.1–2.28 |
| Launched date | 11 February 2013 | 15 April 1999 | June 2015, March 2017 | |||
| Spatial resolution (m) | 30 | 30 | 10−20 | |||
| Frequency of data acquisition | 16 days | 16 days | 5 days | |||
| Index | Equation | Reference |
|---|---|---|
| AWEInsh—Automated Water Extraction Index with no shadow | 4 × (G − SWIR1) − (0.25 × NIR + 2.75 × SWIR1) | [31] |
| AWEIsh—Automated Water Extraction Index with shadow | B + 2.5 × G − 1.5 × (NIR + SWIR1) − 0.25 × SWIR2 | [31] |
| BI—Bare soil Index | ((SWIR1 + R) − (NIR + B))/((SWIR1 + R) + (NIR + B)) × 100 + 100 | [64] |
| DVI—Differential Vegetation Index | NIR − R | [65] |
| DVW—Difference between Vegetation and Water | NDVI − NDWI | [66] |
| IFW—Index of Free Water | NIR − G | [30] |
| IPVI—Infrared Percentage Vegetation Index | NIR/(NIR + R) | [67] |
| MIFW—Modified Index of Free Water | SWIR1 − G | [26] |
| MNDWI1—Modified Normalized Difference Water Index with SWIR1 | (G − SWIR1)/(G + SWIR1) | [36] |
| MNDWI2—Modified Normalized Difference Water Index with SWIR2 | (G − SWIR2)/(G + SWIR2) | [36] |
| MSI—Moisture Stress Index | SWIR/NIR | [68] |
| NDVI—Normalized Difference Vegetation Index | (NIR − R)/(NIR + R) | [69] |
| NDWI(F)—Normalized Difference Water Index of McFeeters | (G − NIR)/(G + NIR) | [37] |
| NDWI(G)—Normalized Difference Water Index of Gao | (NIR − SWIR1)/NIR + SWIR1) | [32] |
| OSAVI—Optimized SAVI | (NIR − R)/(NIR + R + 0.16) | [70] |
| RVI—Ratio Vegetation Index | NIR/R | [71] |
| SAVI—Soil Adjusted Vegetation Index | 1.5 × (NIR − R)/(NIR + R + 0.5) | [72] |
| SR—Simple Ratio | R/NIR | [73] |
| TVI—Triangular Vegetation Index | 0.5 × (120 × (NIR − G) − 200 × (R − G)) | [74] |
| WII—Water Impoundment Index | NIR2/R | [75] |
| WRI—Water Ratio Index | (G + R)/(NIR + SWIR1) | [34] |
| WTI—Water Turbidity Index | 0.91 × R + 0.43 × NIR | [76] |
| OLI Landsat 8 | ETM + Landsat 7 | Sentinel 2A, 2B | |||||||||||||
|---|---|---|---|---|---|---|---|---|---|---|---|---|---|---|---|
| Water Equation | B5 ≤ 0.1735 and B7 ≤ 0.1035 | B4 ≤ 0.1558 and B7 ≤ 0.0871 | B8a ≤ 0.1804 and B12 ≤ 0.1131 | ||||||||||||
| Observed => Predicted | 0 => 0 | 0 => 1 | 1 => 0 | 1 => 1 | %OA | 0 => 0 | 0 => 1 | 1 => 0 | 1 => 1 | %OA | 0 => 0 | 0 => 1 | 1 => 0 | 1 => 1 | %OA |
| Model building | |||||||||||||||
| Training data | 2157 | 232 | 84 | 361 | 88.8 | 1623 | 44 | 103 | 453 | 93.4 | 2052 | 81 | 79 | 471 | 94.0 |
| Validation data | 940 | 77 | 44 | 170 | 90.2 | 685 | 24 | 50 | 173 | 92.1 | 894 | 30 | 35 | 192 | 94.4 |
| Data source | |||||||||||||||
| Scenes | 2204 | 209 | 46 | 349 | 90.9 | 1158 | 28 | 89 | 328 | 92.7 | 1849 | 84 | 104 | 568 | 92.8 |
| Field | 893 | 100 | 82 | 182 | 85.5 | 1150 | 40 | 64 | 298 | 93.3 | 1097 | 27 | 10 | 95 | 97.0 |
| Land cover classes | |||||||||||||||
| Building | 139 | 0 | 4 | 0 | 97.2 | 91 | 0 | 4 | 0 | 95.8 | 74 | 0 | 1 | 0 | 98.7 |
| Road | 194 | 25 | 1 | 5 | 88.4 | 85 | 2 | 3 | 2 | 94.6 | 178 | 4 | 7 | 2 | 94.2 |
| Dry crop | 162 | 1 | 0 | 1 | 99.4 | 137 | 0 | 1 | 1 | 99.3 | 127 | 1 | 0 | 1 | 99.2 |
| Rice field | 185 | 25 | 8 | 20 | 86.1 | 97 | 0 | 2 | 1 | 98.0 | 163 | 7 | 1 | 2 | 95.4 |
| Grassland | 186 | 3 | 0 | 1 | 98.4 | 84 | 2 | 0 | 1 | 97.7 | 128 | 1 | 0 | 1 | 99.2 |
| Fallow land | 153 | 1 | 0 | 1 | 99.4 | 101 | 0 | 7 | 0 | 93.5 | 82 | 2 | 0 | 1 | 97.6 |
| Forest | 222 | 8 | 0 | 0 | 96.5 | 92 | 1 | 5 | 5 | 94.2 | 145 | 1 | 6 | 3 | 95.5 |
| Dune | 332 | 24 | 1 | 1 | 93.0 | 464 | 5 | 4 | 1 | 98.1 | 664 | 9 | 5 | 1 | 97.9 |
| Bare ground | 152 | 5 | 5 | 8 | 94.1 | 74 | 2 | 4 | 13 | 93.5 | 164 | 7 | 6 | 30 | 93.7 |
| Beach | 181 | 11 | 8 | 5 | 90.7 | 95 | 5 | 4 | 20 | 92.7 | 174 | 14 | 11 | 26 | 88.9 |
| Salt pans | 264 | 10 | 25 | 67 | 90.4 | 313 | 9 | 7 | 82 | 96.1 | 353 | 15 | 3 | 126 | 96.4 |
| Open-water marsh | 165 | 58 | 27 | 210 | 81.5 | 161 | 13 | 16 | 199 | 92.5 | 108 | 10 | 6 | 202 | 95.1 |
| Halophilous scrub | 221 | 28 | 1 | 0 | 88.4 | 110 | 3 | 9 | 13 | 91.1 | 175 | 17 | 15 | 14 | 85.5 |
| Canal, River | 26 | 39 | 11 | 123 | 74.9 | 13 | 7 | 1 | 65 | 90.7 | 3 | 3 | 2 | 121 | 96.1 |
| Reed marsh | 258 | 38 | 35 | 87 | 82.5 | 281 | 17 | 70 | 206 | 84.8 | 190 | 14 | 23 | 100 | 88.7 |
| Riverine forests | 122 | 16 | 1 | 0 | 87.8 | 45 | 1 | 10 | 1 | 80.7 | 90 | 4 | 16 | 13 | 83.7 |
| Salt meadows | 135 | 17 | 1 | 2 | 88.4 | 65 | 1 | 6 | 16 | 92.0 | 128 | 2 | 12 | 20 | 91.4 |
| Total | 3097 | 309 | 128 | 531 | 89.2 | 2308 | 68 | 153 | 626 | 93.0 | 2946 | 111 | 114 | 663 | 94.1 |
| Landsat 8 | Landsat 7 | Sentinel 2 | |||||||||
|---|---|---|---|---|---|---|---|---|---|---|---|
| Land Cover Class | L8 | ΔL7 | ΔS2 | L7 | ΔL8 | ΔS2 | S2 | ΔL8 | ΔL7 | ΔSCP | ΔPeps |
| Buildings | 97.2 | 0.0 | 0.0 | 95.8 | −1.1 | 0.0 | 98.7 | 0.0 | 0.0 | 0.0 | 0.0 |
| Roads | 88.4 | 2.7 | −1.3 | 94.6 | −6.5 | −6.5 | 94.2 | 0.0 | 1.0 | −0.5 | −0.5 |
| Dry crops | 99.4 | −0.6 | 0.0 | 99.3 | 0.0 | 0.0 | 99.2 | 0.0 | 0.8 | 0.0 | −0.8 |
| Rice fields | 86.1 | 0.4 | −0.8 | 98.0 | 0.0 | 0.0 | 95.4 | 0.0 | 0.0 | 0.0 | 0.0 |
| Grassland | 98.4 | 0.0 | 0.0 | 97.7 | −1.1 | −1.1 | 99.2 | 0.8 | 0.8 | 0.0 | −0.8 |
| Fallow land | 99.4 | 0.6 | 0.0 | 93.5 | 0.0 | 0.0 | 97.6 | 2.4 | 2.4 | 0.0 | 0.0 |
| Forests | 96.5 | 0.0 | 0.0 | 94.2 | −1.9 | −3.9 | 95.5 | 0.6 | 0.0 | 0.0 | 0.0 |
| Dunes | 93.0 | 2.5 | −1.7 | 98.1 | −0.6 | −0.8 | 97.9 | 0.3 | 1.2 | 0.0 | −0.7 |
| Bare ground | 94.1 | −1.2 | −1.8 | 93.5 | −4.3 | −10.8 | 93.7 | −0.5 | −1.4 | 0.0 | −0.5 |
| Sand | 90.7 | 2.0 | −0.5 | 92.7 | −4.0 | −4.0 | 88.9 | 1.8 | 1.3 | 0.0 | −5.3 |
| Salt works | 90.4 | −1.9 | −0.5 | 96.1 | −2.2 | −2.9 | 96.4 | −0.2 | −0.6 | 0.0 | −0.8 |
| Open marsh | 81.5 | 1.5 | −1.1 | 92.5 | −1.5 | −3.1 | 95.1 | −0.3 | −0.9 | −0.6 | −1.2 |
| Halophilous scrub | 88.4 | 2.4 | −2.8 | 91.1 | −3.7 | −10.4 | 85.5 | 0.9 | 0.9 | −0.5 | −3.6 |
| Canal, River | 74.9 | −0.5 | −1.0 | 90.7 | −1.2 | −1.2 | 96.1 | 0.0 | 0.0 | 0.0 | 0.0 |
| Reed marsh | 82.5 | −0.7 | −1.4 | 84.8 | 0.3 | −0.7 | 88.7 | 0.3 | −3.4 | −0.6 | −1.2 |
| Riparian vegetation | 87.8 | 2.2 | −2.2 | 80.7 | −2.3 | −9.5 | 83.7 | −2.4 | −3.3 | −0.8 | 0.0 |
| Salt meadows | 88.4 | 1.3 | −3.2 | 92.0 | −2.3 | −3.4 | 91.4 | −1.9 | −3.1 | −0.6 | 0.0 |
| Total | 89.2 | 0.6 | −1.1 | 93.0 | −1.4 | −2.5 | 94.1 | 0.1 | −0.3 | −0.2 | −1.1 |
| Water Index | Landsat 8 | Landsat 7 | Sentinel 2 |
|---|---|---|---|
| AWEIsh [31] | 0.64 | 0.61 | 0.57 |
| AWEInsh [31] | 0.63 | 0.60 | 0.56 |
| IFW [30] | 0.62 | 0.52 | 0.57 |
| NDWI (F) | 0.62 | 0.52 | 0.57 |
| MIFW [26] | 0.66 | 0.65 | 0.64 |
| MNDWI1 [36] | 0.63 | 0.65 | 0.61 |
| MNDWI2 [36] | 0.50 | 0.67 | 0.61 |
| WRI [34] | 0.64 | 0.62 | 0.58 |
| WIW [this study] | 0.68 | 0.77 | 0.82 |
© 2019 by the authors. Licensee MDPI, Basel, Switzerland. This article is an open access article distributed under the terms and conditions of the Creative Commons Attribution (CC BY) license (http://creativecommons.org/licenses/by/4.0/).
Share and Cite
Lefebvre, G.; Davranche, A.; Willm, L.; Campagna, J.; Redmond, L.; Merle, C.; Guelmami, A.; Poulin, B. Introducing WIW for Detecting the Presence of Water in Wetlands with Landsat and Sentinel Satellites. Remote Sens. 2019, 11, 2210. https://doi.org/10.3390/rs11192210
Lefebvre G, Davranche A, Willm L, Campagna J, Redmond L, Merle C, Guelmami A, Poulin B. Introducing WIW for Detecting the Presence of Water in Wetlands with Landsat and Sentinel Satellites. Remote Sensing. 2019; 11(19):2210. https://doi.org/10.3390/rs11192210
Chicago/Turabian StyleLefebvre, Gaëtan, Aurélie Davranche, Loïc Willm, Julie Campagna, Lauren Redmond, Clément Merle, Anis Guelmami, and Brigitte Poulin. 2019. "Introducing WIW for Detecting the Presence of Water in Wetlands with Landsat and Sentinel Satellites" Remote Sensing 11, no. 19: 2210. https://doi.org/10.3390/rs11192210
APA StyleLefebvre, G., Davranche, A., Willm, L., Campagna, J., Redmond, L., Merle, C., Guelmami, A., & Poulin, B. (2019). Introducing WIW for Detecting the Presence of Water in Wetlands with Landsat and Sentinel Satellites. Remote Sensing, 11(19), 2210. https://doi.org/10.3390/rs11192210