Retrieval of 500 m Aerosol Optical Depths from MODIS Measurements over Urban Surfaces under Heavy Aerosol Loading Conditions in Winter

 ,
, 
 ,
,
Abstract
:1. Introduction
2. Data, Measurements, and Methods
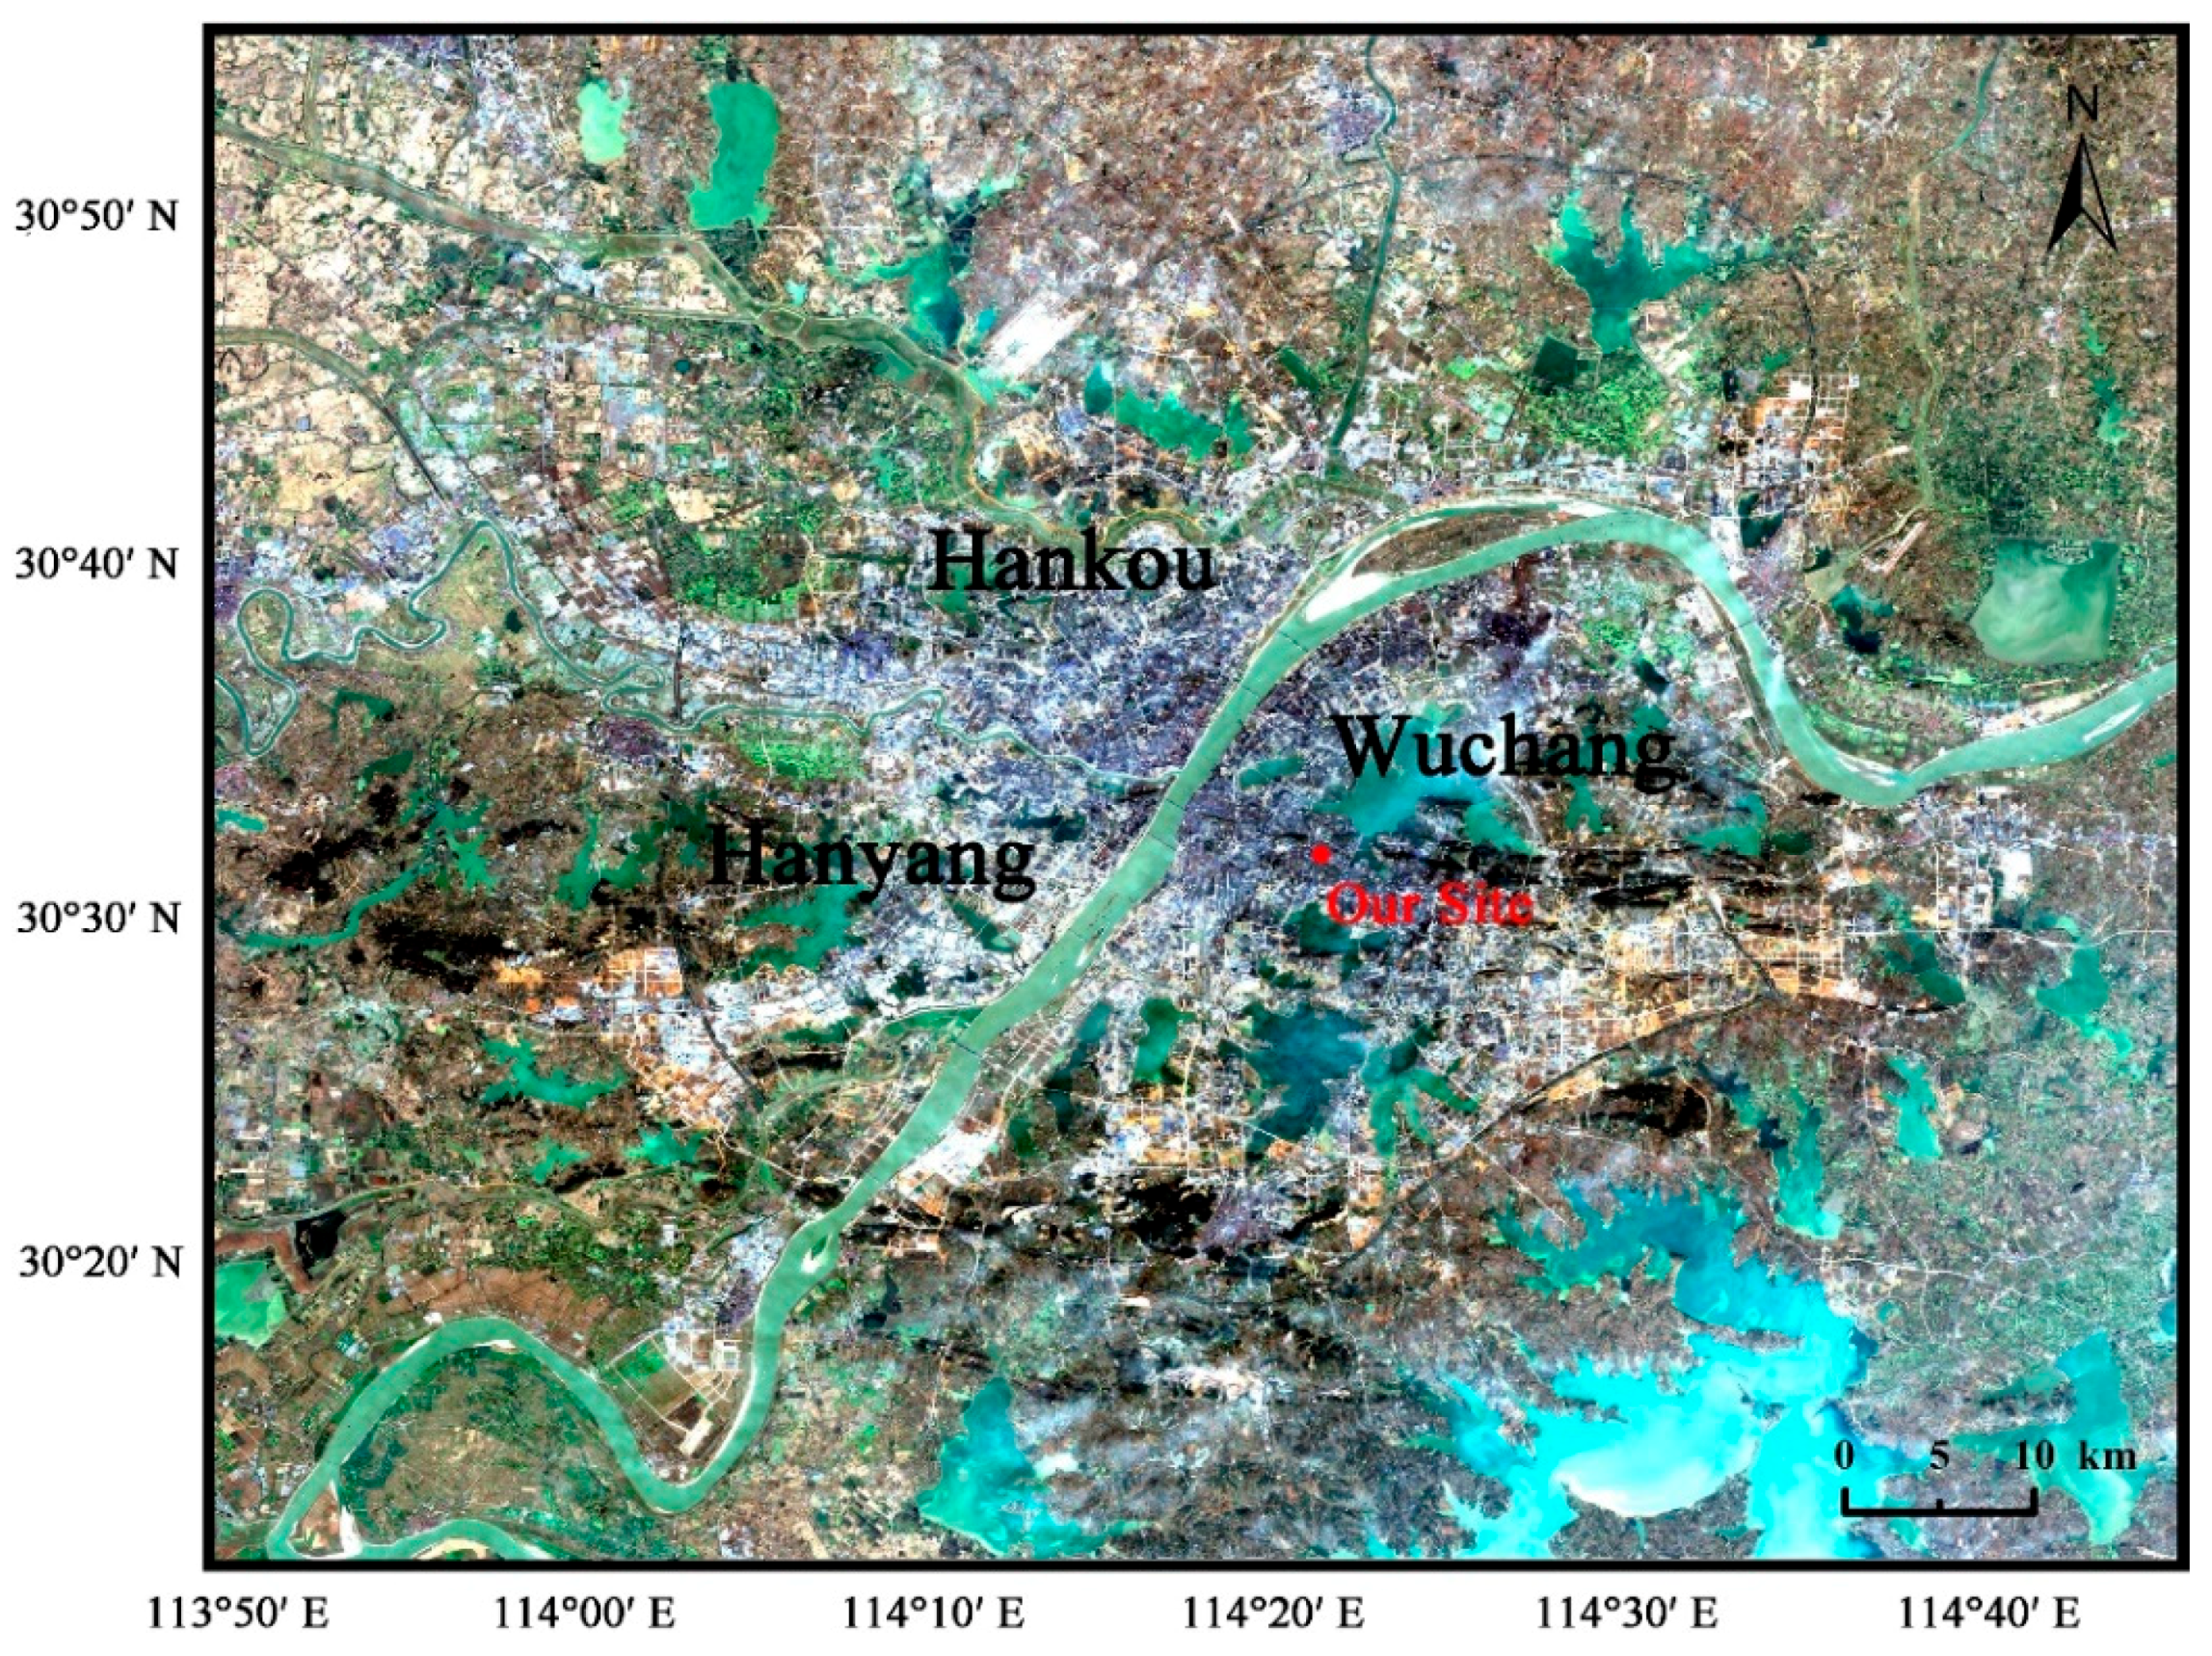
2.1. Site and Satellite Data
2.2. Aerosol Model
2.3. Surface Reflectance
2.4. Retrieval Strategy
3. Results and Discussions
3.1. Retrieval Results
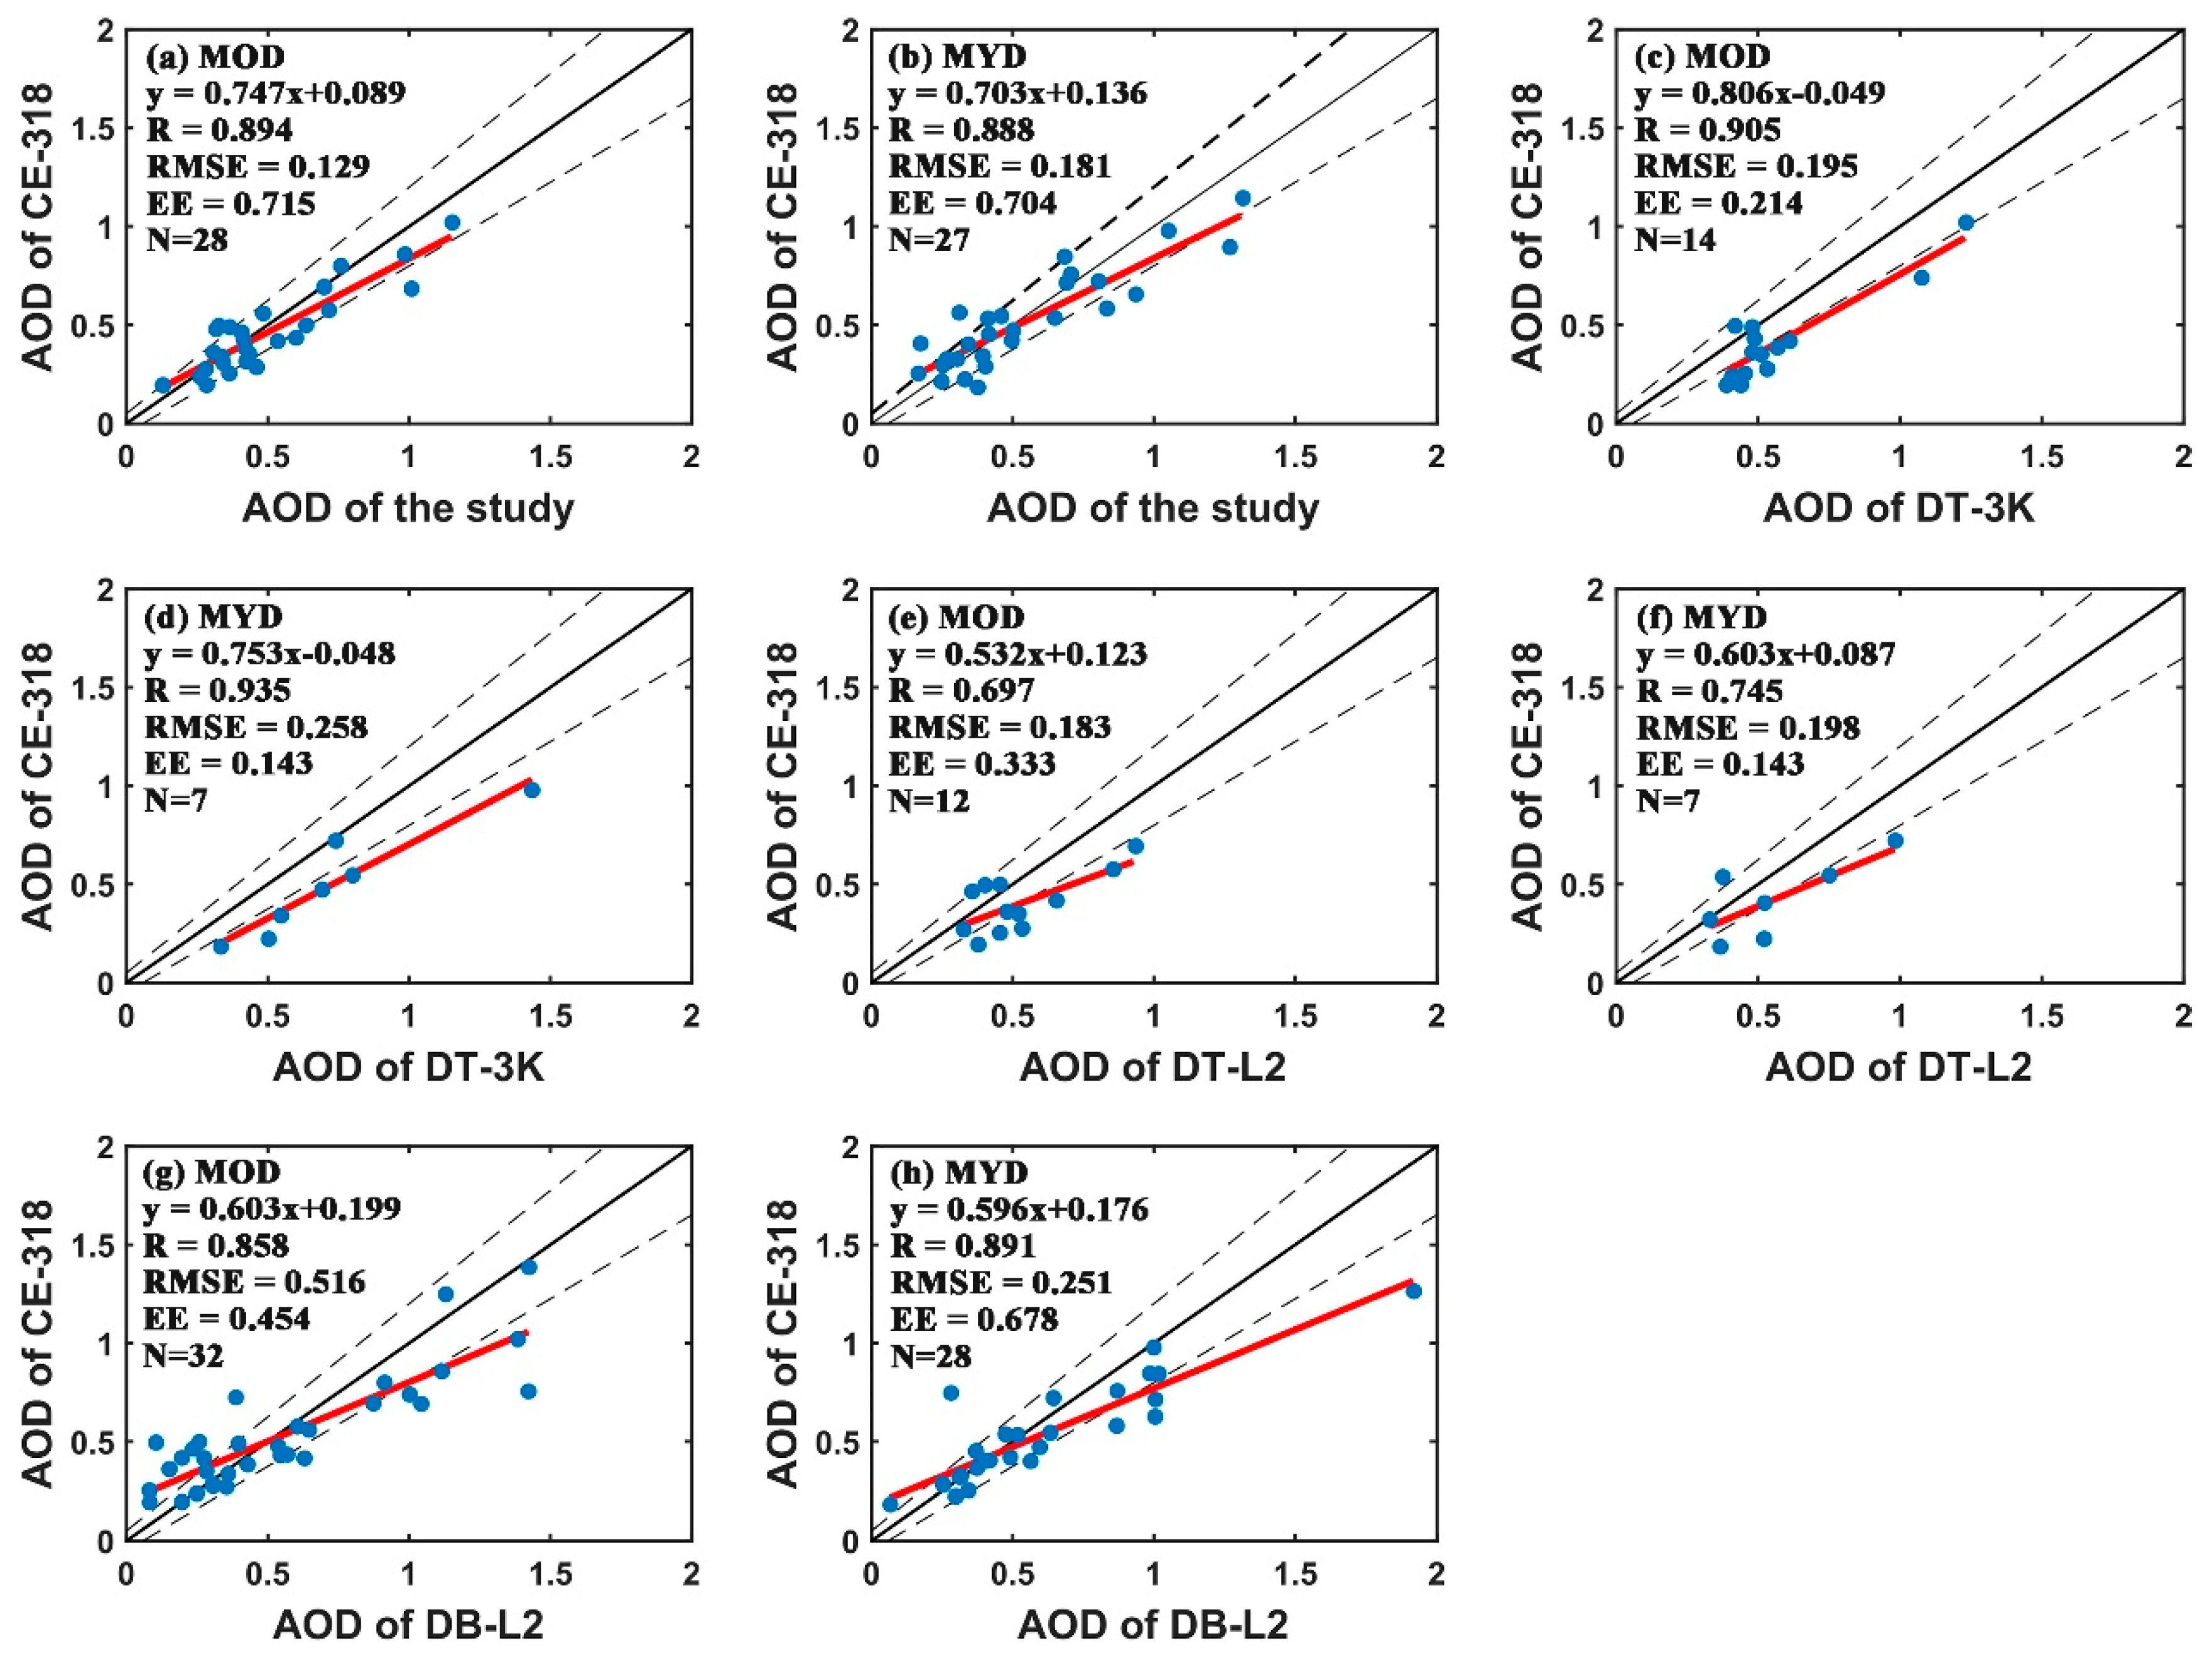
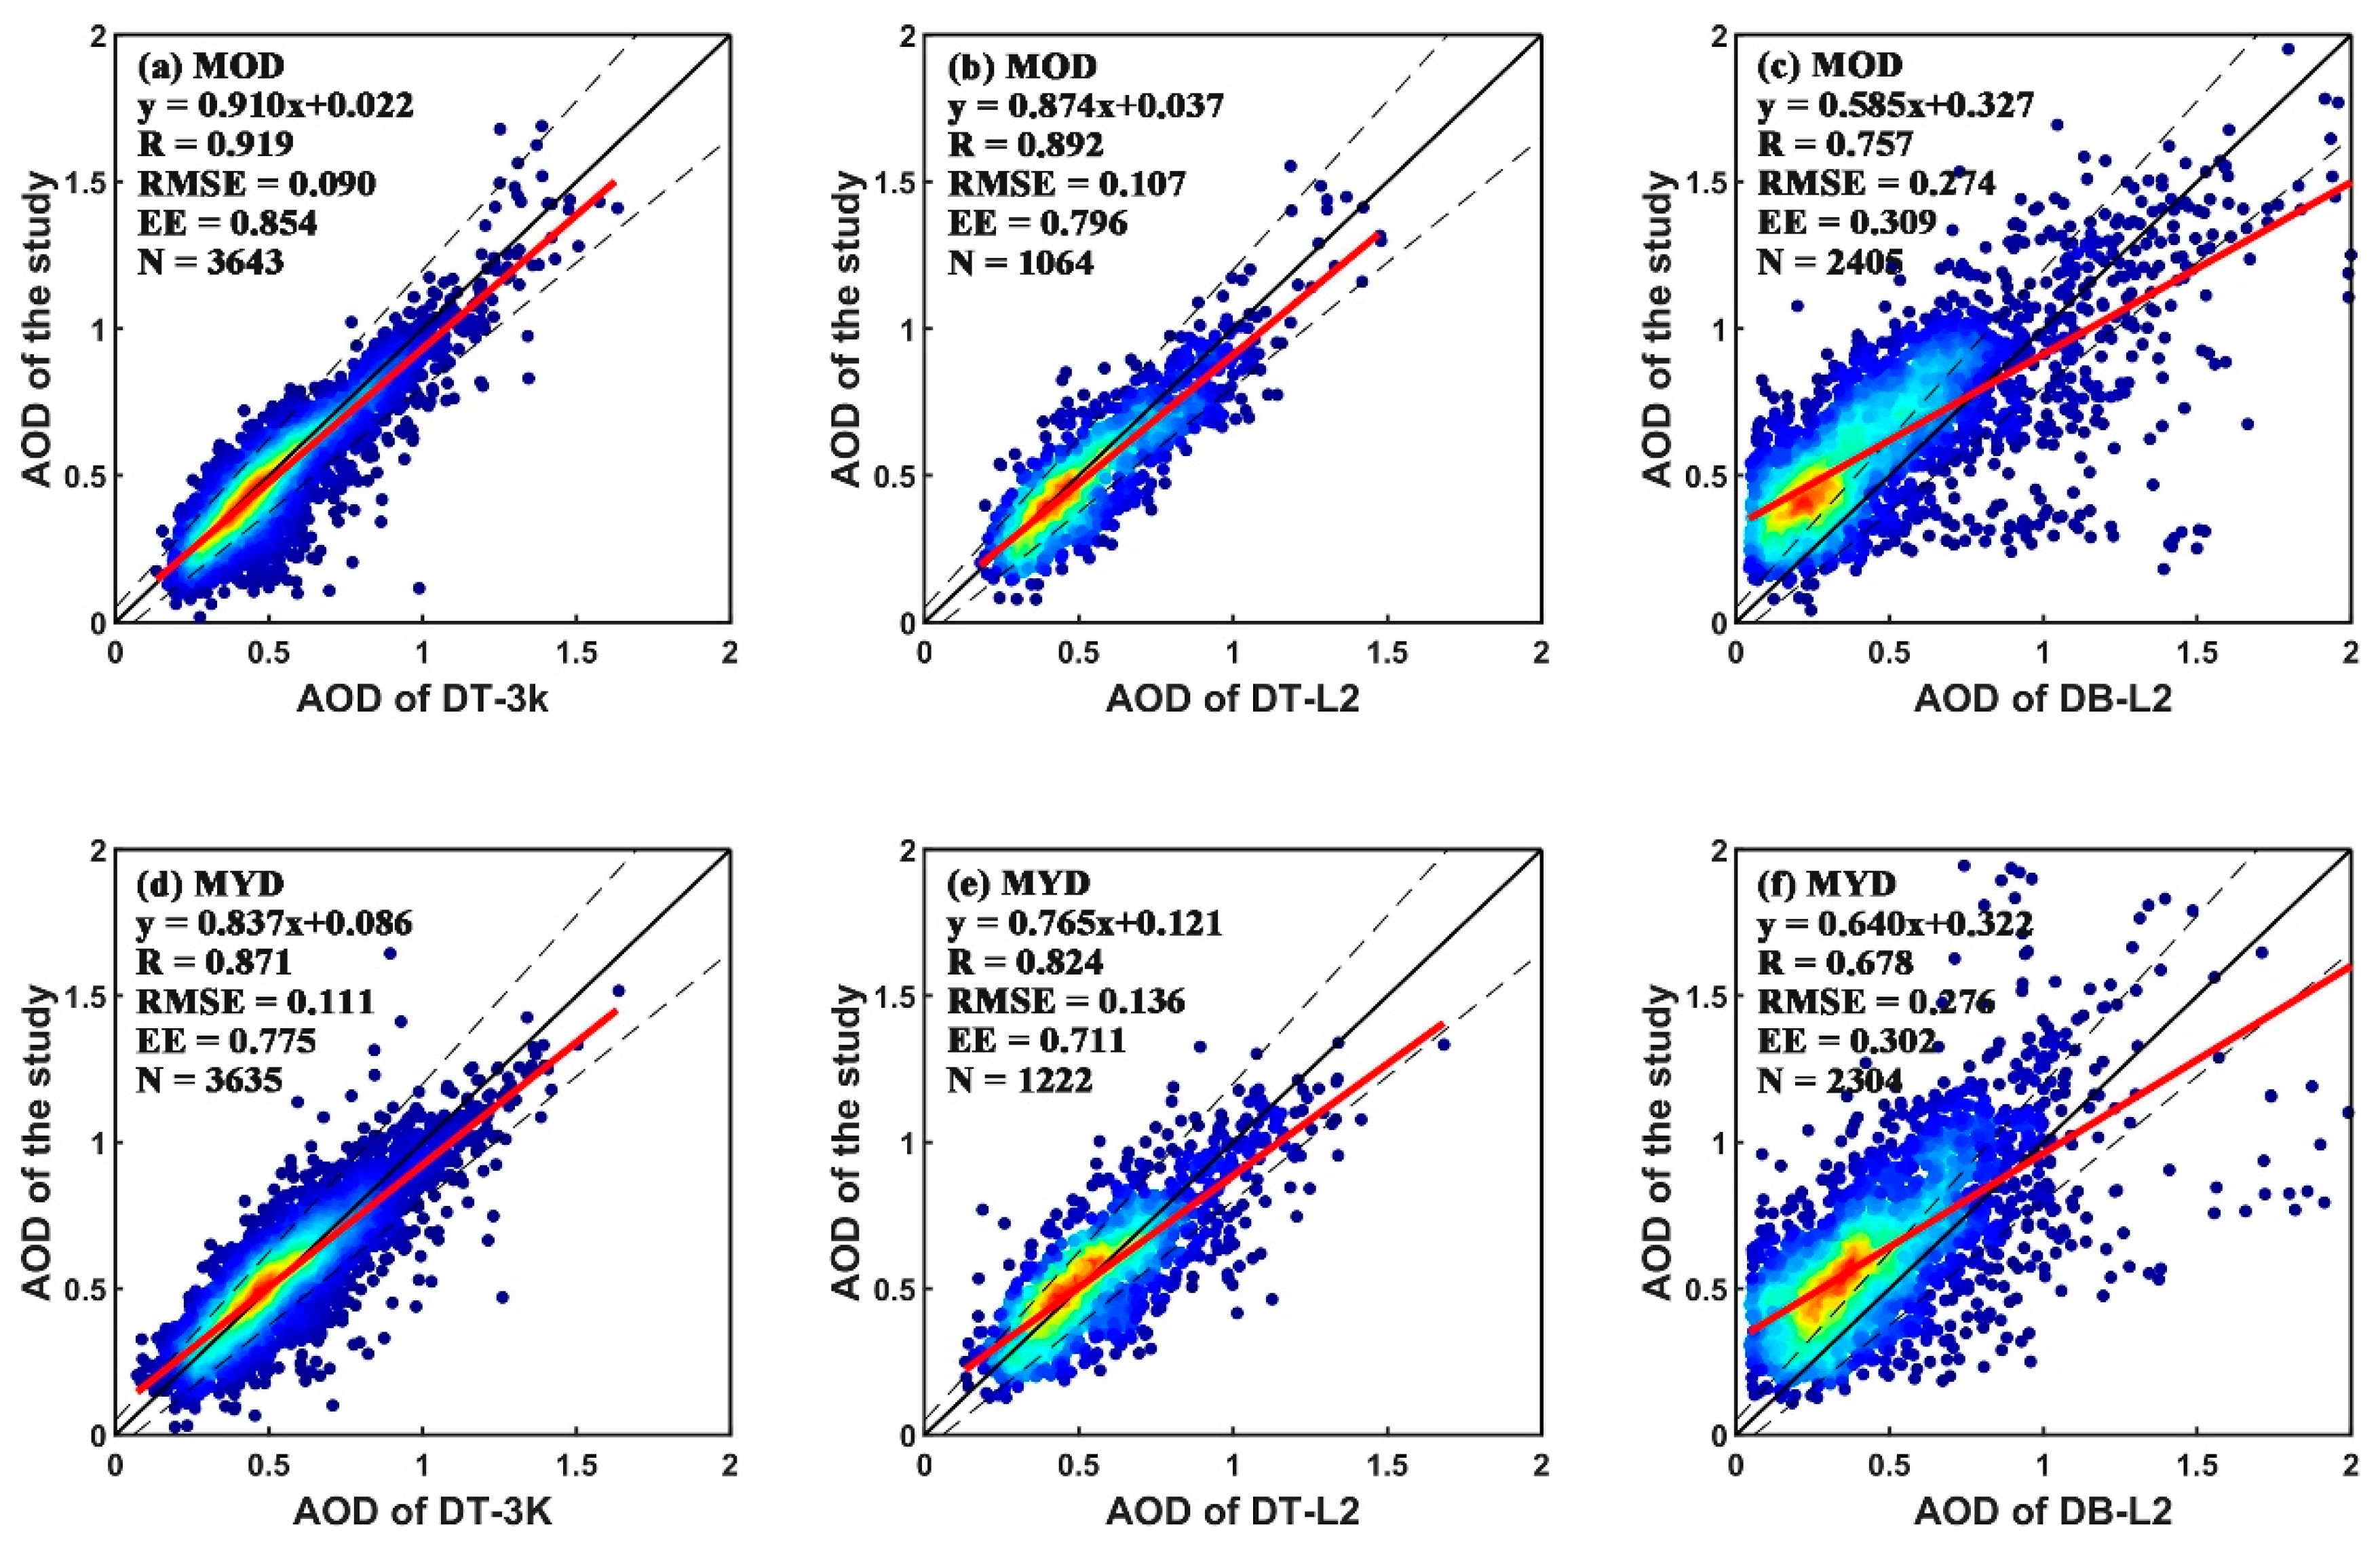
3.2. Validation
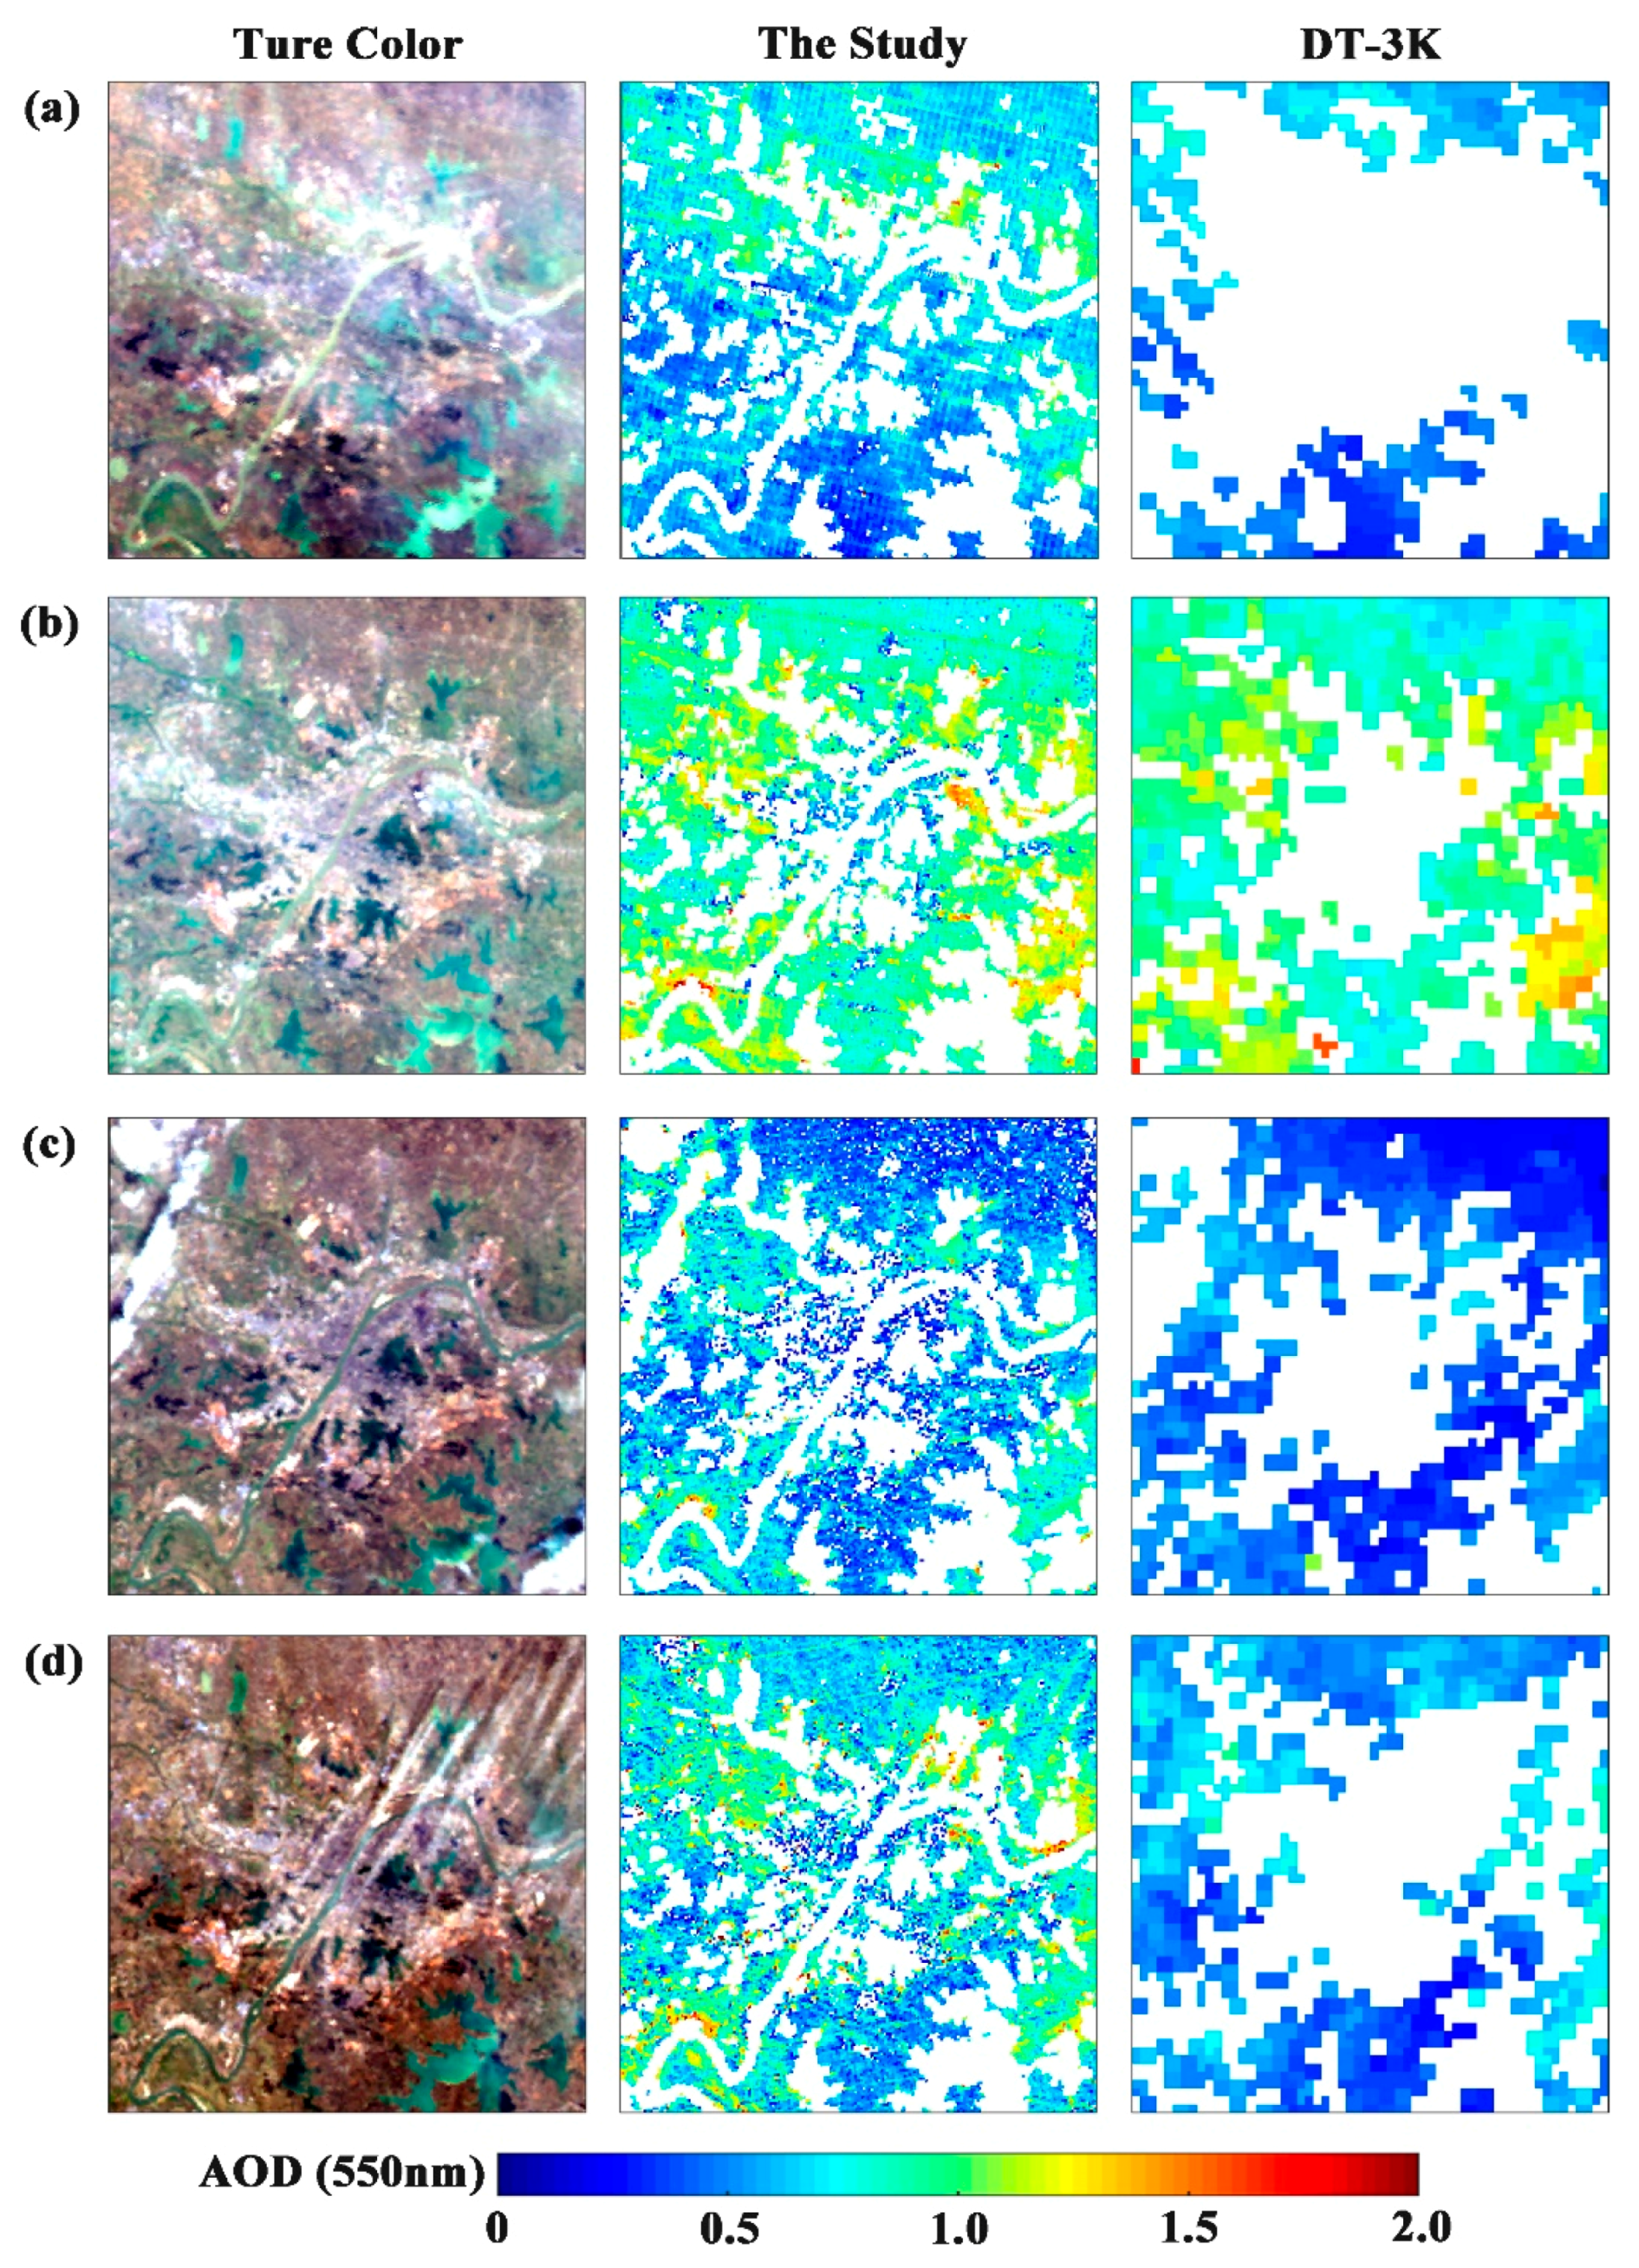
3.3. Case Analysis
4. Conclusions
Author Contributions
Funding
Acknowledgments
Conflicts of Interest
References
- Hansen, J.; Sato, M.; Ruedy, R. Radiative forcing and climate response. J. Geophys. Res. 1997, 102, 6831–6864. [Google Scholar] [CrossRef]
- Kaufman, Y.J.; Nakajima, T. Effect of amazon smoke on cloud microphysics and albedo—Analysis from satellite imagery. J. Appl. Meteorol. 1993, 32, 729–744. [Google Scholar] [CrossRef]
- Haywood, J.; Boucher, O. Estimates of the direct and indirect radiative forcing due to tropospheric aerosols: A review. Rev. Geophys. 2000, 38, 513–543. [Google Scholar] [CrossRef]
- Rosenfeld, D.; Lohmann, U.; Raga, G.B.; O’Dowd, C.D.; Kulmala, M.; Fuzzi, S.; Reissell, A.; Andreae, M.O. Flood or drought: How do aerosols affect precipitation? Science 2008, 321, 1309–1313. [Google Scholar] [CrossRef] [PubMed]
- Li, J.M.; Jian, B.D.; Huang, J.P.; Hu, Y.X.; Zhao, C.F.; Kawamoto, K.; Liao, S.J.; Wu, M. Long-term variation of cloud droplet number concentrations from space-based lidar. Remote Sens. Environ. 2018, 213, 144–161. [Google Scholar] [CrossRef]
- Che, H.; Zhang, X.; Li, Y.; Zhou, Z.; Qu, J.J. Horizontal visibility trends in china 1981–2005. Geophys. Res. Lett. 2007, 34, 497–507. [Google Scholar] [CrossRef]
- Tie, X.X.; Wu, D.; Brasseur, G. Lung cancer mortality and exposure to atmospheric aerosol particles in Guangzhou, china. Atmos. Environ. 2009, 43, 2375–2377. [Google Scholar] [CrossRef]
- King, M.D.; Kaufman, Y.J.; Menzel, W.P.; Tanre, D. Remote-sensing of cloud, aerosol, and water-vapor properties from the moderate resolution imaging spectrometer (modis). IEEE Trans. Geosci. Remote Sens. 1992, 30, 2–27. [Google Scholar] [CrossRef]
- Hsu, N.C.; Tsay, S.C.; King, M.D.; Herman, J.R. Aerosol properties over bright-reflecting source regions. IEEE Trans. Geosci. Remote Sens. 2004, 42, 557–569. [Google Scholar] [CrossRef]
- Remer, L.A.; Kaufman, Y.J.; Tanré, D.; Mattoo, S.; Chu, D.A.; Martins, J.V.; Li, R.R.; Ichoku, C.; Levy, R.C.; Kleidman, R.G.; et al. The modis aerosol algorithm, products, and validation. J. Atmos. Sci. 2005, 62, 947–973. [Google Scholar] [CrossRef]
- Levy, R.C.; Mattoo, S.; Munchak, L.A.; Remer, L.A.; Sayer, A.M.; Patadia, F.; Hsu, N.C. The collection 6 modis aerosol products over land and ocean. Atmos. Meas. Tech. 2013, 6, 2989–3034. [Google Scholar] [CrossRef]
- Higurashi, A. Development of a two-channel aerosol retrieval algorithm on a global scale using noaa avhrr. J. Atmos. Sci. 1999, 56, 924–941. [Google Scholar] [CrossRef]
- Chimot, J.; Veefkind, J.P.; Vlemmix, T.; de Haan, J.F.; Amiridis, V.; Proestakis, E.; Marinou, E.; Levelt, P.F. An exploratory study on the aerosol height retrieval from omi measurements of the 477 nm o-2-o-2 spectral band using a neural network approach. Atmos. Meas. Tech. 2017, 10, 783–809. [Google Scholar] [CrossRef]
- Ge, B.; Li, Z.; Liu, L.; Yang, L.; Chen, X.; Hou, W.; Zhang, Y.; Li, D.; Li, L.; Qie, L. A dark target method for himawari-8/ahi aerosol retrieval: Application and validation. IEEE Trans. Geosci. Remote Sens. 2018, 57, 381–394. [Google Scholar] [CrossRef]
- Zhang, Z.Y.; Fan, M.; Wu, W.L.; Wang, Z.F.; Tao, M.H.; Wei, J.; Wang, Q. A simplified aerosol retrieval algorithm for himawari-8 advanced himawari imager over beijing. Atmos. Environ. 2019, 199, 127–135. [Google Scholar] [CrossRef]
- Levy, R.C.; Remer, L.A.; Mattoo, S.; Vermote, E.F.; Kaufman, Y.J. Second-generation operational algorithm: Retrieval of aerosol properties over land from inversion of moderate resolution imaging spectroradiometer spectral reflectance. J. Geophys. Res. Atmos. 2007, 112. [Google Scholar] [CrossRef]
- Gupta, P.; Remer, L.A.; Levy, R.C.; Mattoo, S. Validation of modis 3 km land aerosol optical depth from nasa’s eos terra and aqua missions. Atmos. Meas. Tech. 2018, 11, 3145–3159. [Google Scholar] [CrossRef]
- Huang, R.J.; Zhang, Y.; Bozzetti, C.; Ho, K.F.; Cao, J.J.; Han, Y.; Daellenbach, K.R.; Slowik, J.G.; Platt, S.M.; Canonaco, F. High secondary aerosol contribution to particulate pollution during haze events in china. Nature 2014, 514, 218–222. [Google Scholar] [CrossRef] [PubMed]
- Wang, Y.; Chen, L.F.; Li, S.S.; Wang, X.H.; Yu, C.; Si, Y.D.; Zhang, Z.L. Interference of heavy aerosol loading on the viirs aerosol optical depth (aod) retrieval algorithm. Remote Sens. 2017, 9, 397. [Google Scholar] [CrossRef]
- Li, S.; Chen, L.; Xiong, X.; Tao, J.; Su, L.; Han, D.; Liu, Y. Retrieval of the haze optical thickness in north china plain using modis data. IEEE Trans. Geosci. Remote Sens. 2013, 51, 2528–2540. [Google Scholar] [CrossRef]
- Yan, X.; Shi, W.Z.; Luo, N.N.; Zhao, W.J. A new method of satellite-based haze aerosol monitoring over the north china plain and a comparison with modis collection 6 aerosol products. Atmos. Res. 2016, 171, 31–40. [Google Scholar] [CrossRef]
- Tao, M.H.; Chen, L.F.; Su, L.; Tao, J.H. Satellite observation of regional haze pollution over the north china plain. J. Geophys. Res. Atmos. 2012, 117. [Google Scholar] [CrossRef]
- Yang, Y.; Liu, X.; Qu, Y.; Wang, J.; An, J.; Zhang, Y.; Zhang, F. Formation mechanism of continuous extreme haze episodes in the megacity Beijing, China, in January 2013. Atmos. Res. 2015, 155, 192–203. [Google Scholar] [CrossRef]
- Zhang, M.; Ma, Y.; Gong, W.; Wang, L.; Xia, X.; Che, H.; Hu, B.; Liu, B. Aerosol radiative effect in uv, vis, nir, and sw spectra under haze and high-humidity urban conditions. Atmos. Environ. 2017, 166, 9–21. [Google Scholar] [CrossRef]
- Liu, B.; Ma, Y.; Gong, W.; Zhang, M.; Yang, J. Study of continuous air pollution in winter over wuhan based on ground-based and satellite observations. Atmos. Pollut. Res. 2018, 9, 156–165. [Google Scholar] [CrossRef]
- Li, C.C.; Lau, A.K.H.; Mao, J.T.; Chu, D.A. Retrieval, validation, and application of the 1-km aerosol optical depth from modis measurements over Hong Kong. IEEE Trans. Geosci. Remote Sens. 2005, 43, 2650–2658. [Google Scholar]
- Xu, N.; Niu, X.H.; Hu, X.Q.; Wang, X.H.; Wu, R.H.; Chen, S.S.; Chen, L.; Sun, L.; Ding, L.; Yang, Z.D.; et al. Prelaunch calibration and radiometric performance of the advanced mersi ii on fengyun-3d. IEEE Trans. Geosci. Remote Sens. 2018, 56, 4866–4875. [Google Scholar] [CrossRef]
- Dubovik, O.; King, M.D. A flexible inversion algorithm for retrieval of aerosol optical properties from sun and sky radiance measurements. J. Geophys. Res. Atmos. 2000, 105, 20673–20696. [Google Scholar] [CrossRef]
- Dubovik, O.; Holben, B.; Eck, T.F.; Smirnov, A.; Kaufman, Y.J.; King, M.D.; Tanre, D.; Slutsker, I. Variability of absorption and optical properties of key aerosol types observed in worldwide locations. J. Atmos. Sci. 2002, 59, 590–608. [Google Scholar] [CrossRef]
- Che, H.Z.; Zhang, X.Y.; Chen, H.B.; Damiri, B.; Goloub, P.; Li, Z.Q.; Zhang, X.C.; Wei, Y.; Zhou, H.G.; Dong, F.; et al. Instrument calibration and aerosol optical depth validation of the china aerosol remote sensing network. J. Geophys. Res. Atmos. 2009, 114. [Google Scholar] [CrossRef]
- Eck, T.F.; Holben, B.N.; Sinyuk, A.; Pinker, R.T.; Goloub, P.; Chen, H.; Chatenet, B.; Li, Z.; Singh, R.P.; Tripathi, S.N.; et al. Climatological aspects of the optical properties of fine/coarse mode aerosol mixtures. J. Geophys. Res. Atmos. 2010, 115. [Google Scholar] [CrossRef] [Green Version]
- Zhang, M.; Ma, Y.; Gong, W.; Liu, B.; Shi, Y.; Chen, Z. Aerosol optical properties and radiative effects: Assessment of urban aerosols in central china using 10-year observations. Atmos. Environ. 2018, 182, 275–285. [Google Scholar] [CrossRef]
- Levy, R.C.; Remer, L.A.; Dubovik, O. Global aerosol optical properties and application to moderate resolution imaging spectroradiometer aerosol retrieval over land. J. Geophys. Res. Atmos. 2007, 112. [Google Scholar] [CrossRef]
- Li, Z.; Zhang, Y.; Xu, H.; Li, K.; Dubovik, O.; Goloub, P. The fundamental aerosol models over china region: A cluster analysis of the ground-based remote sensing measurements of total columnar atmosphere. Geophys. Res. Lett. 2019, 46, 4924–4932. [Google Scholar] [CrossRef]
- D’Almeida, G.A.; Koepke, P.; Shettle, E.P. Atmospheric aerosols: Global climatology and radiative characteristics. J. Med. Microbiol. 1991, 54, 55–61. [Google Scholar]
- Kaufman, Y.J.; Tanre, D.; Remer, L.A.; Vermote, E.F.; Chu, A.; Holben, B.N. Operational remote sensing of tropospheric aerosol over land from eos moderate resolution imaging spectroradiometer. J. Geophys. Res. Atmos. 1997, 102, 17051–17067. [Google Scholar] [CrossRef]
- Gupta, P.; Levy, R.C.; Mattoo, S.; Remer, L.A.; Munchak, L.A. A surface reflectance scheme for retrieving aerosol optical depth over urban surfaces in modis dark target retrieval algorithm. Atmos. Meas. Tech. 2016, 9, 3293–3308. [Google Scholar] [CrossRef]
- Friedl, M.A.; Sulla-Menashe, D.; Tan, B.; Schneider, A.; Ramankutty, N.; Sibley, A.; Huang, X. Modis collection 5 global land cover: Algorithm refinements and characterization of new datasets. Remote Sens. Environ. 2010, 114, 168–182. [Google Scholar] [CrossRef]
- Vermote, E.F.; ElSaleous, N.; Justice, C.O.; Kaufman, Y.J.; Privette, J.L.; Remer, L.; Roger, J.C.; Tanre, D. Atmospheric correction of visible to middle-infrared eos-modis data over land surfaces: Background, operational algorithm and validation. J. Geophys. Res. Atmos. 1997, 102, 17131–17141. [Google Scholar] [CrossRef]
- Vermote, E.F.; Tanre, D.; Deuze, J.L.; Herman, M. Second simulation of the satellite signal in the solar spectrum, 6s: An overview. IEEE Trans. Geosci. Remote Sens. 1997, 35, 675–686. [Google Scholar] [CrossRef]
- Kotchenova, S.Y.; Vermote, E.F.; Matarrese, R.; Klemm, F.J. Validation of a vector version of the 6s radiative transfer code for atmospheric correction of satellite data. Part i: Path radiance. Appl. Opt. 2006, 45, 6762–6774. [Google Scholar] [CrossRef] [PubMed]
- Kotchenova, S.Y.; Vermote, E.F.; Levy, R.; Lyapustin, A. Radiative transfer codes for atmospheric correction and aerosol retrieval: Intercomparison study. Appl. Opt. 2008, 47, 2215–2226. [Google Scholar] [CrossRef] [PubMed]
- Levy, R.C.; Remer, L.A.; Kaufman, Y.J. Effects of neglecting polarization on the modis aerosol retrieval over land. IEEE Trans. Geosci. Remote Sens. 2004, 42, 2576–2583. [Google Scholar] [CrossRef]
- Ackerman, S.A.; Strabala, K.I.; Menzel, W.P.; Frey, R.A.; Moeller, C.C.; Gumley, L.E. Discriminating clear sky from clouds with modis. J. Geophys. Res. Atmos. 1998, 103, 32141–32157. [Google Scholar] [CrossRef]
- Hall, D.K.; Riggs, G.A.; Salomonson, V.V.; DiGirolamo, N.E.; Bayr, K.J. Modis snow-cover products. Remote Sens. Environ. 2002, 83, 181–194. [Google Scholar] [CrossRef]
- Zhu, Z.; Wang, S.X.; Woodcock, C.E. Improvement and expansion of the fmask algorithm: Cloud, cloud shadow, and snow detection for landsats 4-7, 8, and sentinel 2 images. Remote Sens. Environ. 2015, 159, 269–277. [Google Scholar] [CrossRef]
- Patadia, F.; Levy, R.C.; Mattoo, S. Correcting for trace gas absorption when retrieving aerosol optical depth from satellite observations of reflected shortwave radiation. Atmos. Meas. Tech. 2018, 11, 3205–3219. [Google Scholar] [CrossRef] [Green Version]
- Chu, D.A.; Kaufman, Y.J.; Ichoku, C.; Remer, L.A.; Tanre, D.; Holben, B.N. Validation of modis aerosol optical depth retrieval over land. Geophys. Res. Lett. 2002, 29, MOD2:1–MOD2:4. [Google Scholar] [CrossRef]


| Model | rf | rc | vf | vc | σf | σc | Refractive Index | |
|---|---|---|---|---|---|---|---|---|
| This study | SAM | 0.159 | 2.188 | 0.072 | 0.114 | 0.494 | 0.631 | 1.495–0.007i |
| AAM | 0.144 | 2.210 | 0.074 | 0.113 | 0.482 | 0.644 | 1.501–0.012i | |
| MODIS DT algorithm | Developing | 0.155 | 3.269 | 0.096 | 0.092 | 0.442 | 0.778 | 1.430–0.007i |
| Smoke | 0.139 | 3.922 | 0.094 | 0.065 | 0.423 | 0.763 | 1.510–0.020i | |
| Urban-Ind | 0.162 | 3.396 | 0.097 | 0.060 | 0.440 | 0.841 | 1.420–0.006i | |
| Dust | 0.147 | 2.200 | 0.043 | 0.326 | 0.682 | 0.574 | 1.502–0.002i | |
| Continental | WATE | 0.180 | 3.050 | 1.090 | 1.530–0.006i | |||
| DUST | 17.600 | 7.360 | 1.090 | 1.530–0.008i | ||||
| SOOT | 0.050 | 0.105 | 0.690 | 1.750–0.430i |
© 2019 by the authors. Licensee MDPI, Basel, Switzerland. This article is an open access article distributed under the terms and conditions of the Creative Commons Attribution (CC BY) license (http://creativecommons.org/licenses/by/4.0/).
Share and Cite
Jin, S.; Ma, Y.; Zhang, M.; Gong, W.; Dubovik, O.; Liu, B.; Shi, Y.; Yang, C. Retrieval of 500 m Aerosol Optical Depths from MODIS Measurements over Urban Surfaces under Heavy Aerosol Loading Conditions in Winter. Remote Sens. 2019, 11, 2218. https://doi.org/10.3390/rs11192218
Jin S, Ma Y, Zhang M, Gong W, Dubovik O, Liu B, Shi Y, Yang C. Retrieval of 500 m Aerosol Optical Depths from MODIS Measurements over Urban Surfaces under Heavy Aerosol Loading Conditions in Winter. Remote Sensing. 2019; 11(19):2218. https://doi.org/10.3390/rs11192218
Chicago/Turabian StyleJin, Shikuan, Yingying Ma, Ming Zhang, Wei Gong, Oleg Dubovik, Boming Liu, Yifan Shi, and Changlan Yang. 2019. "Retrieval of 500 m Aerosol Optical Depths from MODIS Measurements over Urban Surfaces under Heavy Aerosol Loading Conditions in Winter" Remote Sensing 11, no. 19: 2218. https://doi.org/10.3390/rs11192218