2.2. Lake Surface Area
The process used to estimate lake surface area was based upon that described in [
7]. For this study, the MODIS MOD13Q1/MYD13Q1 16-day composite product (hereafter “MOD13”) was used, rather than the Level-1B imagery of [
7]. MOD13 includes two vegetation indices, the normalized difference vegetation index (NDVI) and the enhanced vegetation index (EVI; [
61]), as well as surface reflectance in selected MODIS bands, data quality flags, and other data. Two lake indices were derived from MOD13, the aforementioned NDLI [
18,
23] and the new ELI.
NDLI is given by Equation (1):
where
RRED and
RNIR are the spectral reflectance or spectral radiance in red and near-infrared wavelength bands, respectively. Note that NDLI is equivalent to a sign-reversed version of NDVI; i.e., values of NDLI >0 are increasingly likely to be water, and are equivalent to NDVI <0. Due to the high correlation between visible wavelength spectral bands, NDLI is generally very similar to the NDWI [
20,
21] but does not require the use of a green-wavelength band.
Similarly, the new index ELI (Equation 2) is a sign-reversed version of EVI:
where
RNIR,
RRED, and
RBLUE are the near-infrared, red, and blue wavelength bands,
C1 and
C2 are wavelength-specific aerosol resistance terms (6 and 7.5, respectively, for MODIS, [
61]), and G is a gain factor of −2.5 (versus +2.5 for EVI). High values of ELI (= low values of EVI) are increasingly likely to represent water.
For this study, NDLI and ELI were each used to map lake surface area, using the same methodology. Firstly, the data were reprojected to the Universal Transverse Mercator (UTM) zone 36 North coordinate system and subset to the study region. Secondly, a constant threshold value (0 for NDLI, −0.04 for ELI) was used to create a binary land/water mask for each date. Thirdly, the binary-mask time series was smoothed by comparing each pixel on date
t to its value on dates
t-8 and
t+8 days (i.e., the previous and subsequent MOD13 dataset; prior to the first Aqua image in mid-2002, with only Terra imagery available, this was
t-16 and
t+16). If the pixel’s land/water value differed on both the comparison dates, it was switched. Finally, the fractional extent of water for mixed pixels along shorelines (i.e., the boundaries between land and water) was estimated using a linear mixture model [
7].
This produced two time series (nFrac and eFrac, derived from NDLI and ELI, respectively) of maps showing the fractional (0.0 to 1.0) extent of water within each pixel. Summing up the fractions for each pixel of a lake and multiplying by the pixel area (based on the sensor’s spatial resolution) yielded the surface area for each lake on each date.
For the period prior to the first Terra MODIS image (February 2000), the coarser-resolution AVHRR sensor was used in a similar process. Due to the lack of a blue-wavelength band on AVHRR, only an NDLI-based AVHRR dataset could be constructed, and it was used with both the NDLI and ELI versions of the MODIS time series. The same process was used to derive much finer-scale maps of lake area from a series of Landsat images. These data (30 m resolution, or nearly two orders of magnitude finer in resolution than MODIS) were used to validate the coarser-resolution lake area measurements. Likewise, the same process was used with two dates of even higher resolution (10 m) SPOT-5 multispectral images (2006-11-07 and 2008-04-20) to determine the appropriate threshold (-0.04) for the MODIS ELI land/water mask, by comparing MODIS land/water masks with a variety of different thresholds to area measurements from the two SPOT-5 images.
The AVHRR (1998–2000) and MODIS (2000–2017) lake surface area time-series were merged using a nonparametric locally estimated scatterplot smoothing (LOESS) model, interpolating area to a daily timestep using the minimal value of α = 5 data points (nominally 40 days in the post-2002 era when both Terra and Aqua were available) to minimize smoothing.
Figure 5 shows this LOESS model for the period of the transition from AVHRR to MODIS (1999-01-01 to 1992-01-01). While the AVHRR data are coarser-resolution and noisier, the alignment between it and MODIS is very close.
The NDLI- and ELI-derived lake area time series (nFrac and eFrac) were compared based on their detrended residuals, i.e., the individual observations minus the LOESS model, which are here considered to represent noise. Because the magnitude of this noise increases as the lake circumference (and zone of mixed pixels along the shoreline) increases, the residuals were normalized by dividing them by the square root of lake area, giving units of km
2/km. These normalized residuals were used to evaluate the relative performance of NDLI and ELI as sources in the lake area algorithm. The results are presented in more detail in
Section 3, but are shown and discussed briefly here because the choice between NDLI and ELI affected the subsequent methods.
Examination of the residuals showed three extreme outliers among the 750 MODIS image dates: Julian days 161 and 169 in 2012, and day 353 of 2007. Visual examination of these images confirmed that these should be excluded from the analysis due to artifacts in the MOD13 source data. In addition, the lake area values from both NDLI and ELI for Aqua MODIS day 361 were anomalously noisy, yielding larger residuals in many years than other dates (
Figure 6), potentially as a result of the 16-day compositing process. (The NASA Land Processes Distributed Active Archive Center (LP DAAC) reported a known issue with the MODIS MYD13Q1 v6.0 16-day composite product, resulting in “unexpected missing data in the last cycles of each year”. The issue is being addressed in the reprocessed v6.1.) All the day 361 images were thus removed as well, and the nFrac and eFrac time series were recalculated.
As shown in
Figure 6, the eFrac time series (derived from ELI rather than NDLI) had generally smaller residuals relative to its LOESS model. Thus, eFrac was used as the definitive lake surface area dataset for all subsequent analyses.
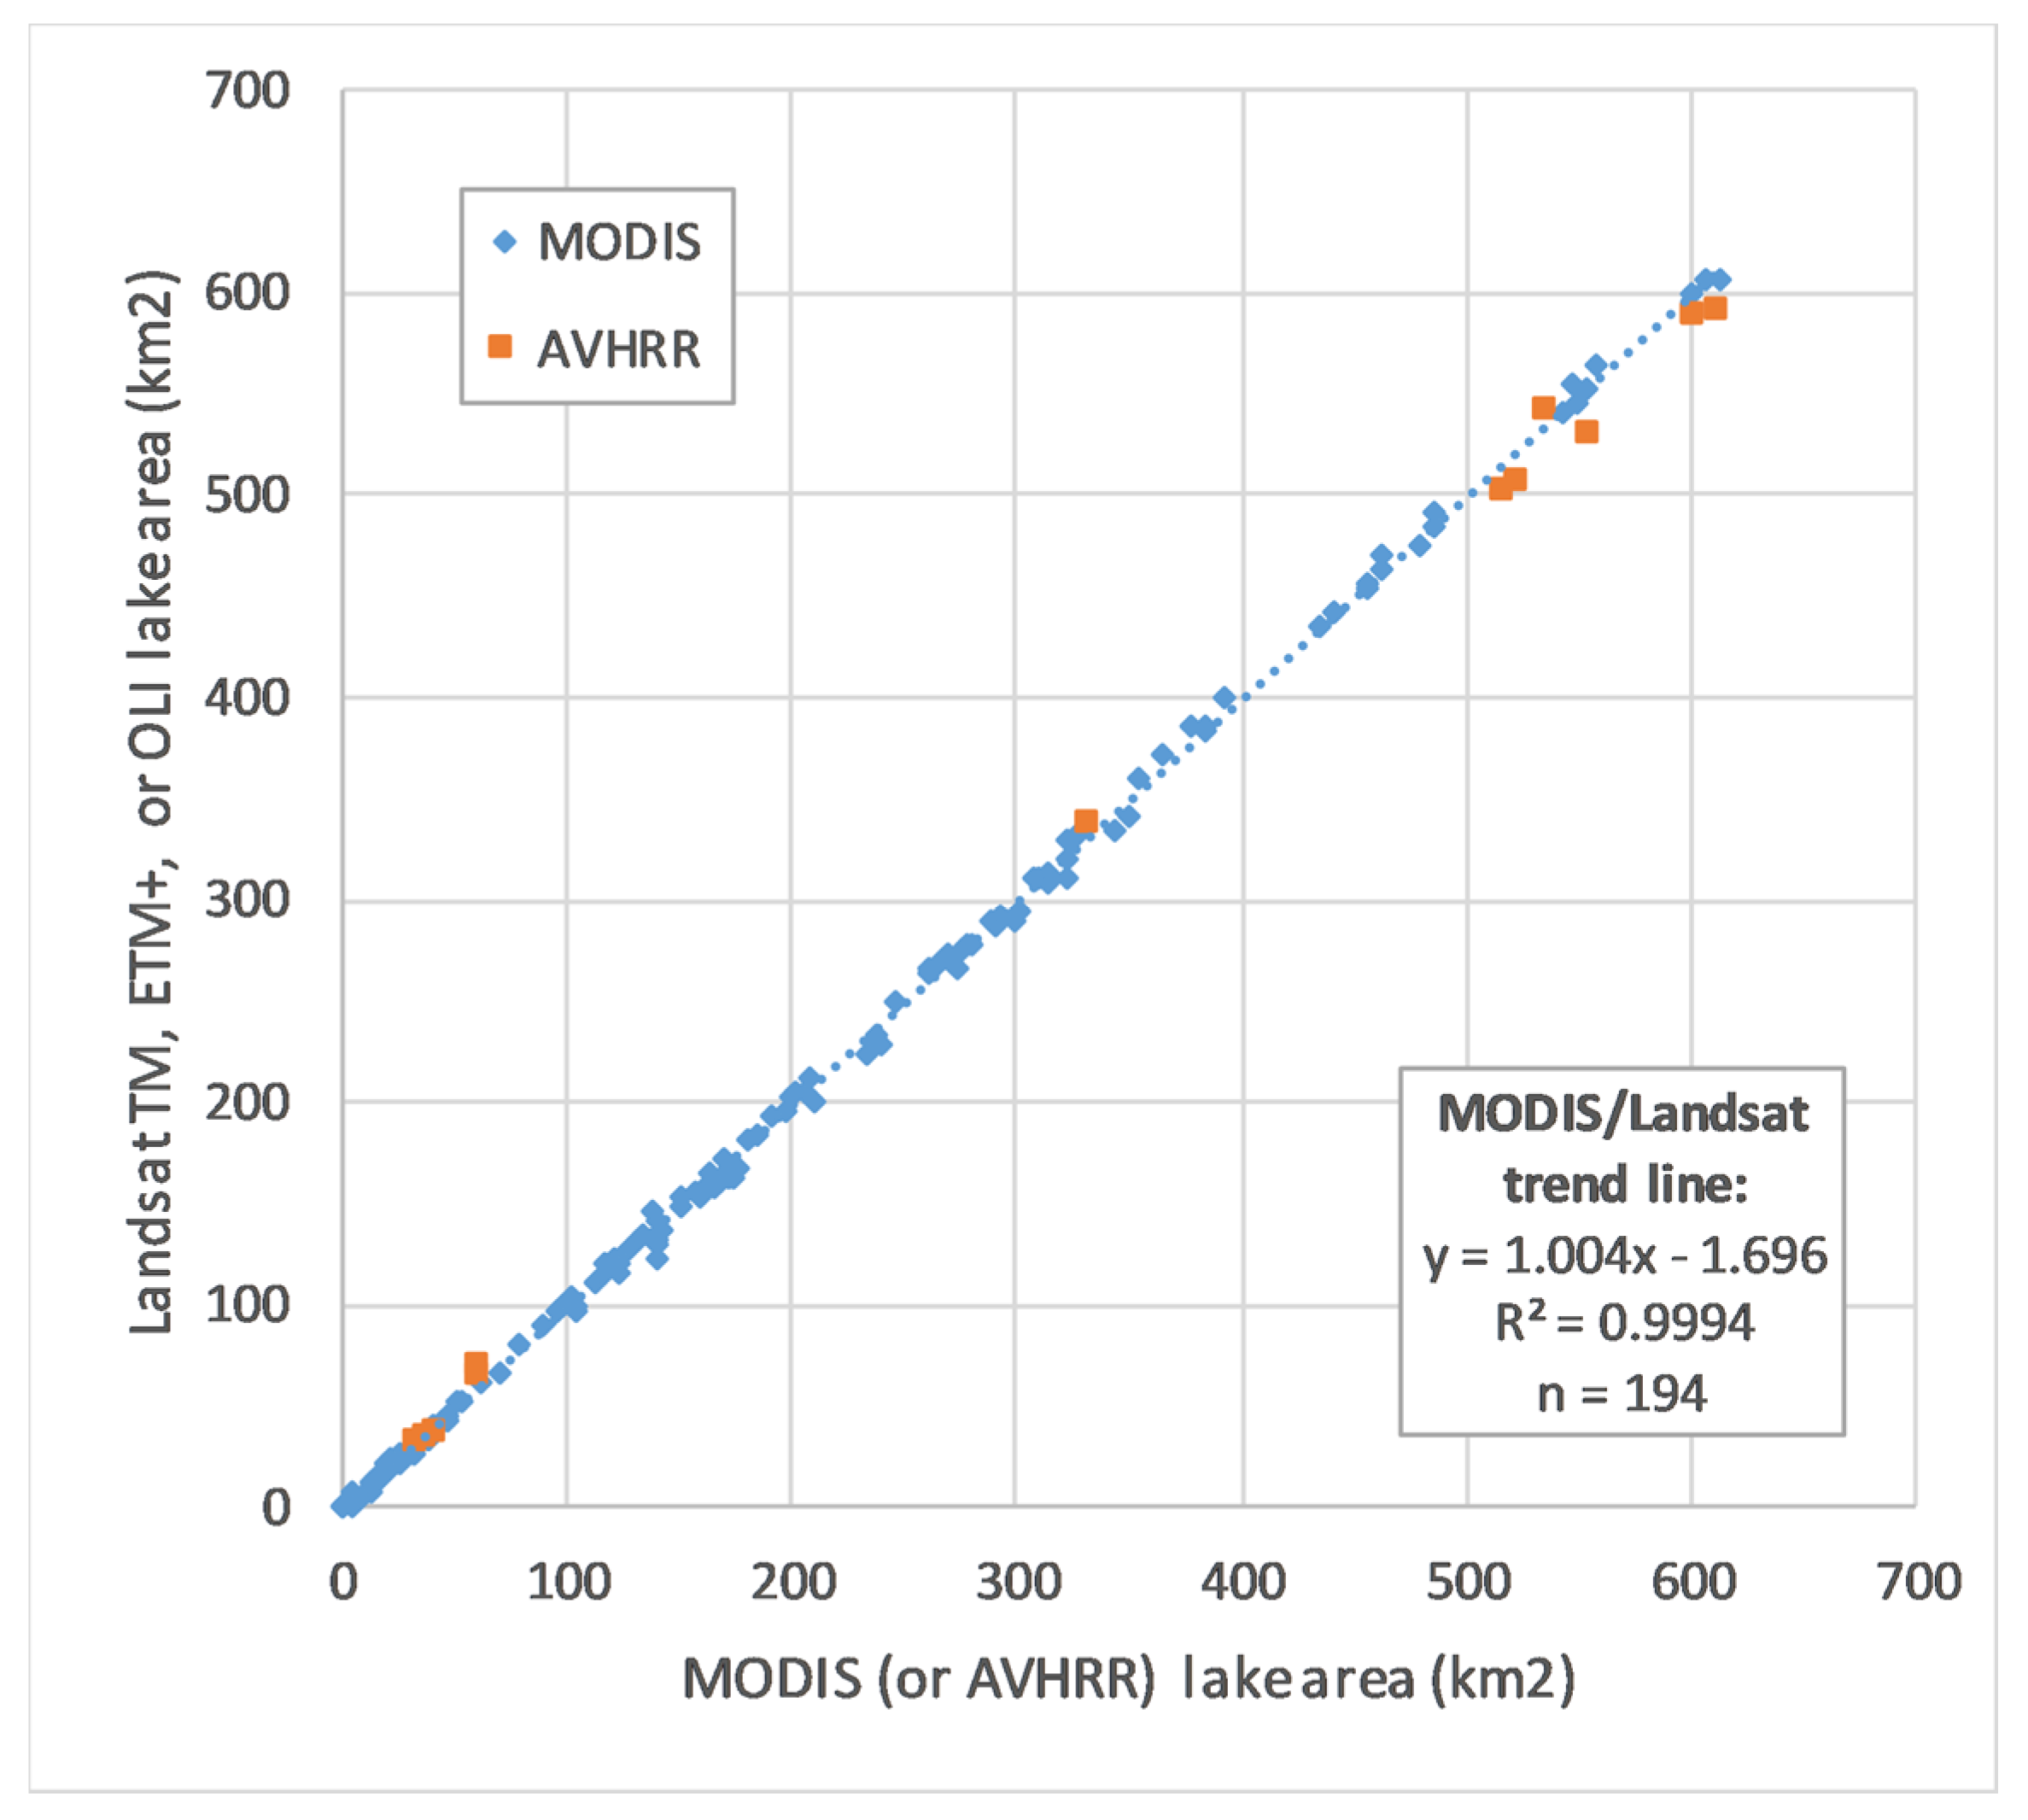
The final step in the lake surface area process involved validation of area measurements by comparison to higher-resolution Landsat images. Two Landsat path/row combinations were needed to cover the area (paths 175 and 176, row 44) with Lakes 1 and 2 in path 175 and the remaining lakes in path 176. For each Landsat image, the areas of each lake were compared to the corresponding daily LOESS-interpolated AVHRR/MODIS eFrac lake area measurement. Because each Landsat pixel covers an area only 1/69th as large as a 250 m resolution MODIS pixel, the Landsat images provided a more precise estimate of lake area.
2.3. Water Level, Mean Depth, and Volume
Water level was derived by cross-referencing the lake surface area dataset (
Section 2.2 above) with a digital elevation model (DEM). Based on the water level, mean and maximum depths were calculated on each date, hypsographic curves were computed for each lake, and lake volumes were estimated. Two different methods were used for the water level analysis, and the results were validated using ICESat-1 GLAS laser altimetry data, which were completely independent of the DEM-based methods.
The first DEM for the study region was obtained from the SRTM [
62] dataset. This DEM was produced using interferometric analysis of synthetic aperture radar (SAR) data from 11–22 February 2000. The basins for Lakes 1-4 had already filled by this date, so the bathymetry of those lakes could not be determined from SRTM.
A second DEM was developed from photogrammetric analysis of stereoscopic ASTER bands 3N and 3B. Twelve individual ASTER DEMs were used, from images in 2014–2017 when all lakes except Lake 4 had dried up, thus allowing the bathymetry of each lake basin (except Lake 4) to be mapped directly. The ASTER DEMs had large vertical offsets relative to SRTM (and to each other), and various other artifacts. The cause of these offsets is undetermined, but they are reflective of the fact that the relative accuracy of these DEMs (i.e., the reported difference in elevation between any two points within a single DEM, compared to their true difference in elevation) is better than their absolute accuracy (the absolute elevations of points in the DEM compared to their true elevations); the latter are expected to be better than 25 m root mean squared error (RMSE) [
59]. To prepare these DEMs for use, the following process was followed:
Calculate each ASTER tile’s mean and standard deviation of elevation differences from the SRTM DEM, using a subset of the area with no visible artifacts.
Adjust the ASTER DEMs to match the SRTM DEM by adding each tile’s mean elevation difference, excluding areas that are more than three standard deviations from the SRTM elevation and were not covered by water at the time of the SRTM mission.
In the ASTER tile covering the (small) remaining water in the Lake 4 basin, exclude ASTER DEM pixels falling within the extent of the water area.
Create an initial mosaic of all ASTER DEM tiles, averaging elevation values in areas of overlap.
Aggregate to 150 m spatial resolution, and convert grid cells to points.
Delete points in no-data areas (areas where the ASTER DEM was more than three standard deviations from SRTM, or within the remaining Lake 4 water area).
Perform a “tension” spline interpolation (weight = 0.1, 100 points per region for local approximation) to fill in the gaps.
The result was an ASTER DEM mosaic for the entire area, with artifacts removed and the small residual area covered by water in Lake 4 modeled by spline interpolation. This ASTER DEM was used to calculate elevation, depth, and volume for all lakes on all dates, while the SRTM DEM was used as a comparison on Lake 5 only.
Table 3 lists the ASTER DEM tiles used in the DEM mosaic.
Two different methods were used to estimate water levels from the lake surface area maps and the DEMs. In Method 1, the shoreline (where pixel fractional water extent crossed 0.5) was identified from the eFrac surface area maps, and the mean elevation of this line was found in the DEM(s). In Method 2, the area of pixels at or below each increment of elevation was calculated directly from the ASTER DEM, and then the observed area on a given date (from eFrac) was used to look up the corresponding water level that would produce that observed area.
For each lake, the water levels derived from these two methods were compared to the ICESat-1 GLAS laser altimeter measurements of water level on the corresponding dates, averaging all 70 m-diameter GLAS footprints that fell on each lake surface on each orbit (
Figure 7). A total of 2390 laser spots on 54 separate orbit tracks were used. Some orbit tracks crossed more than one lake, resulting in 76 combinations of lake and orbit track. An additional 644 laser spots on 16 orbit tracks were not used due to abnormally high noise levels in the GLAS data; these noisy tracks (also discussed in [
7]) had standard deviations of the GLAS measurements for individual lakes from 0.1 to 0.7 m, and were identified and removed based on that basis.
Hypsographic curves [
63,
64] for each lake were constructed, for use in estimating lake volumes on each date. These curves relate lake area (on the X axis) to depth (Y axis). Using the lake area vs. water level data from Method 2, points representing the measured values of these two variables on each date were plotted, and then a LOESS model was used to interpolate values for water level at 0.1 km
2 increments of lake area, from 0.1 km
2 to the maximum areal extent of each lake. This hypsographic curve was then used as a look-up table, to determine the mean depth and total volume for each lake on each date, based on its surface area, in increments of 0.1 km
2.


