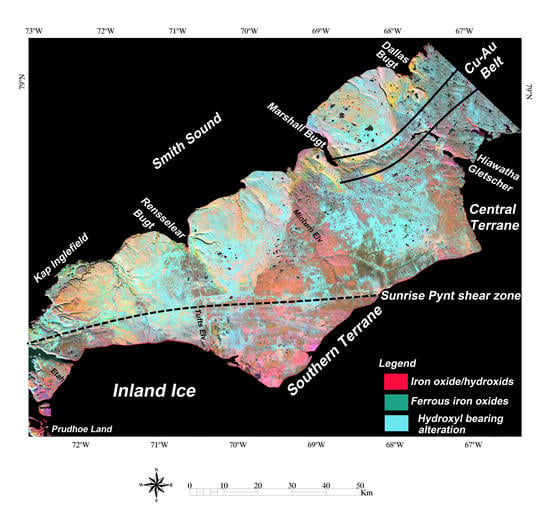
Landsat-8, Advanced Spaceborne Thermal Emission and Reflection Radiometer, and WorldView-3 Multispectral Satellite Imagery for Prospecting Copper-Gold Mineralization in the Northeastern Inglefield Mobile Belt (IMB), Northwest Greenland
Abstract
:1. Introduction
2. Geological Setting of Inglefield Mobile Belt (IMB)
3. Materials and Methods
3.1. Satellite Remote Sensing Data and Characteristics
3.2. Pre-Processing of the Datasets
3.3. Image Processing Algorithms
3.3.1. Directed Principal Components Analysis (DPCA) Technique
3.3.2. Linear Spectral Unmixing (LSU)
3.3.3. Adaptive Coherence Estimator (ACE)
4. Results
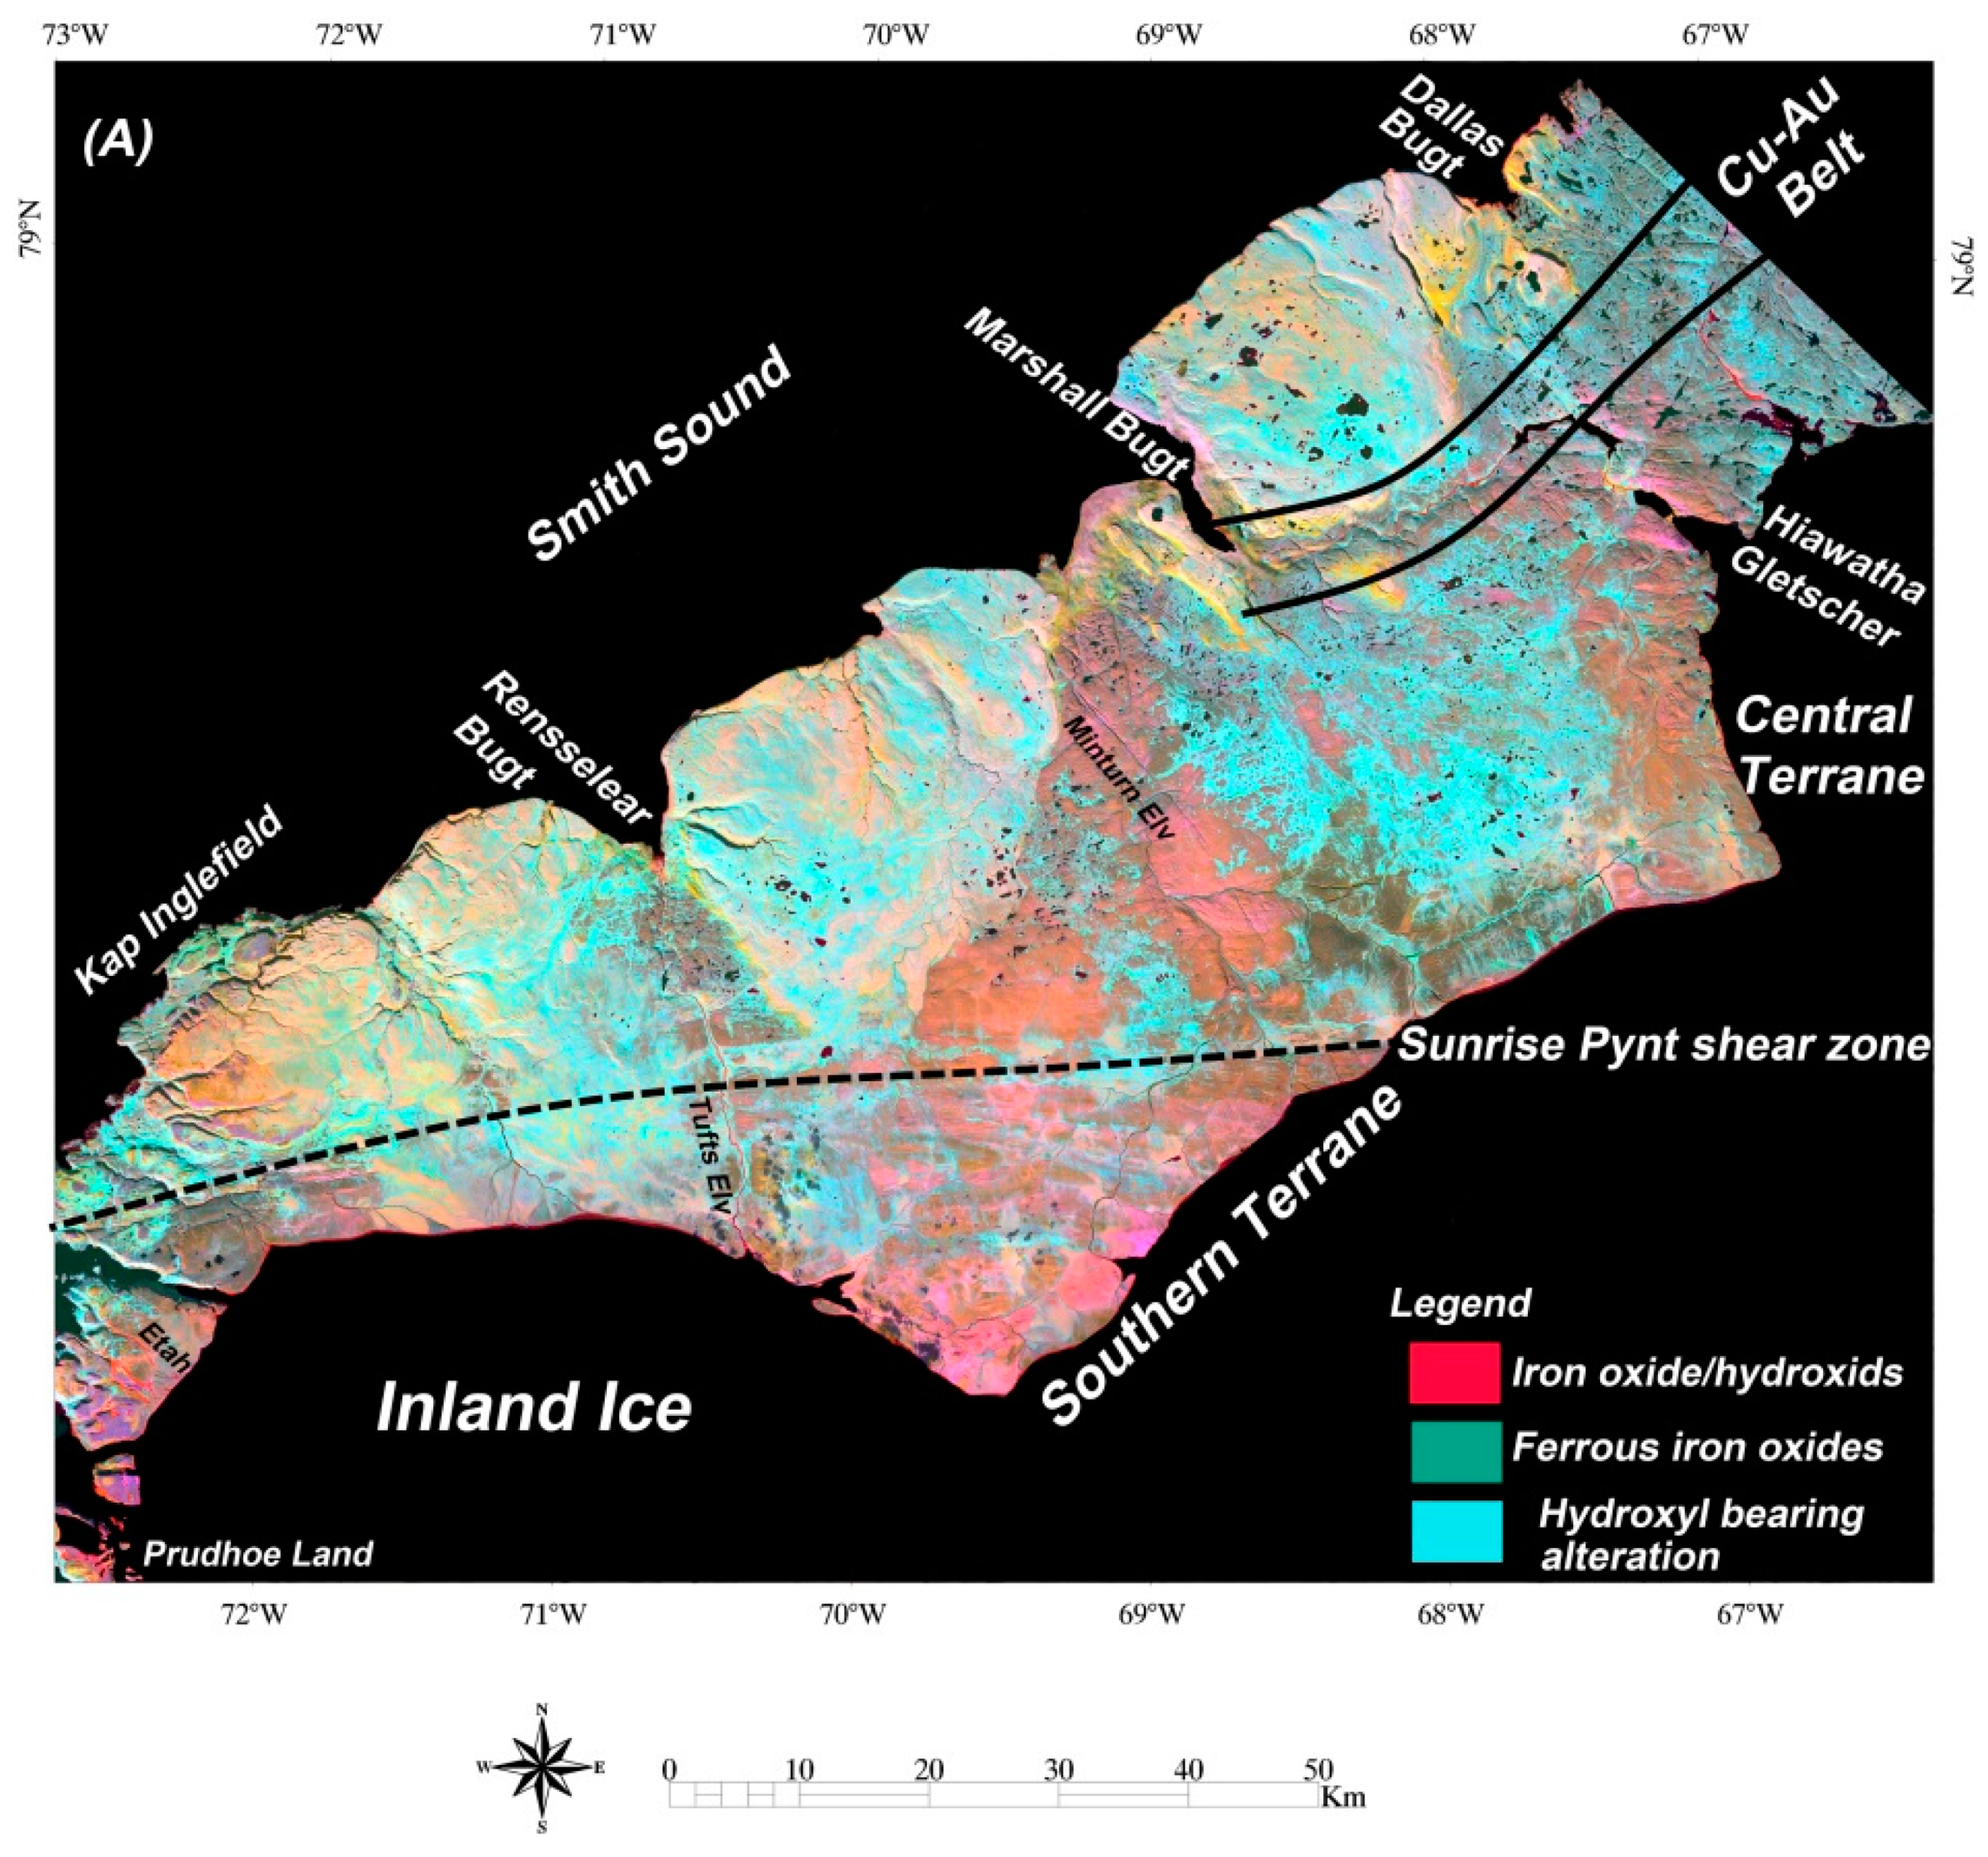
4.1. Regional Lithological-Mineralogical Mapping in Inglefield Land Using Lansat-8 Data
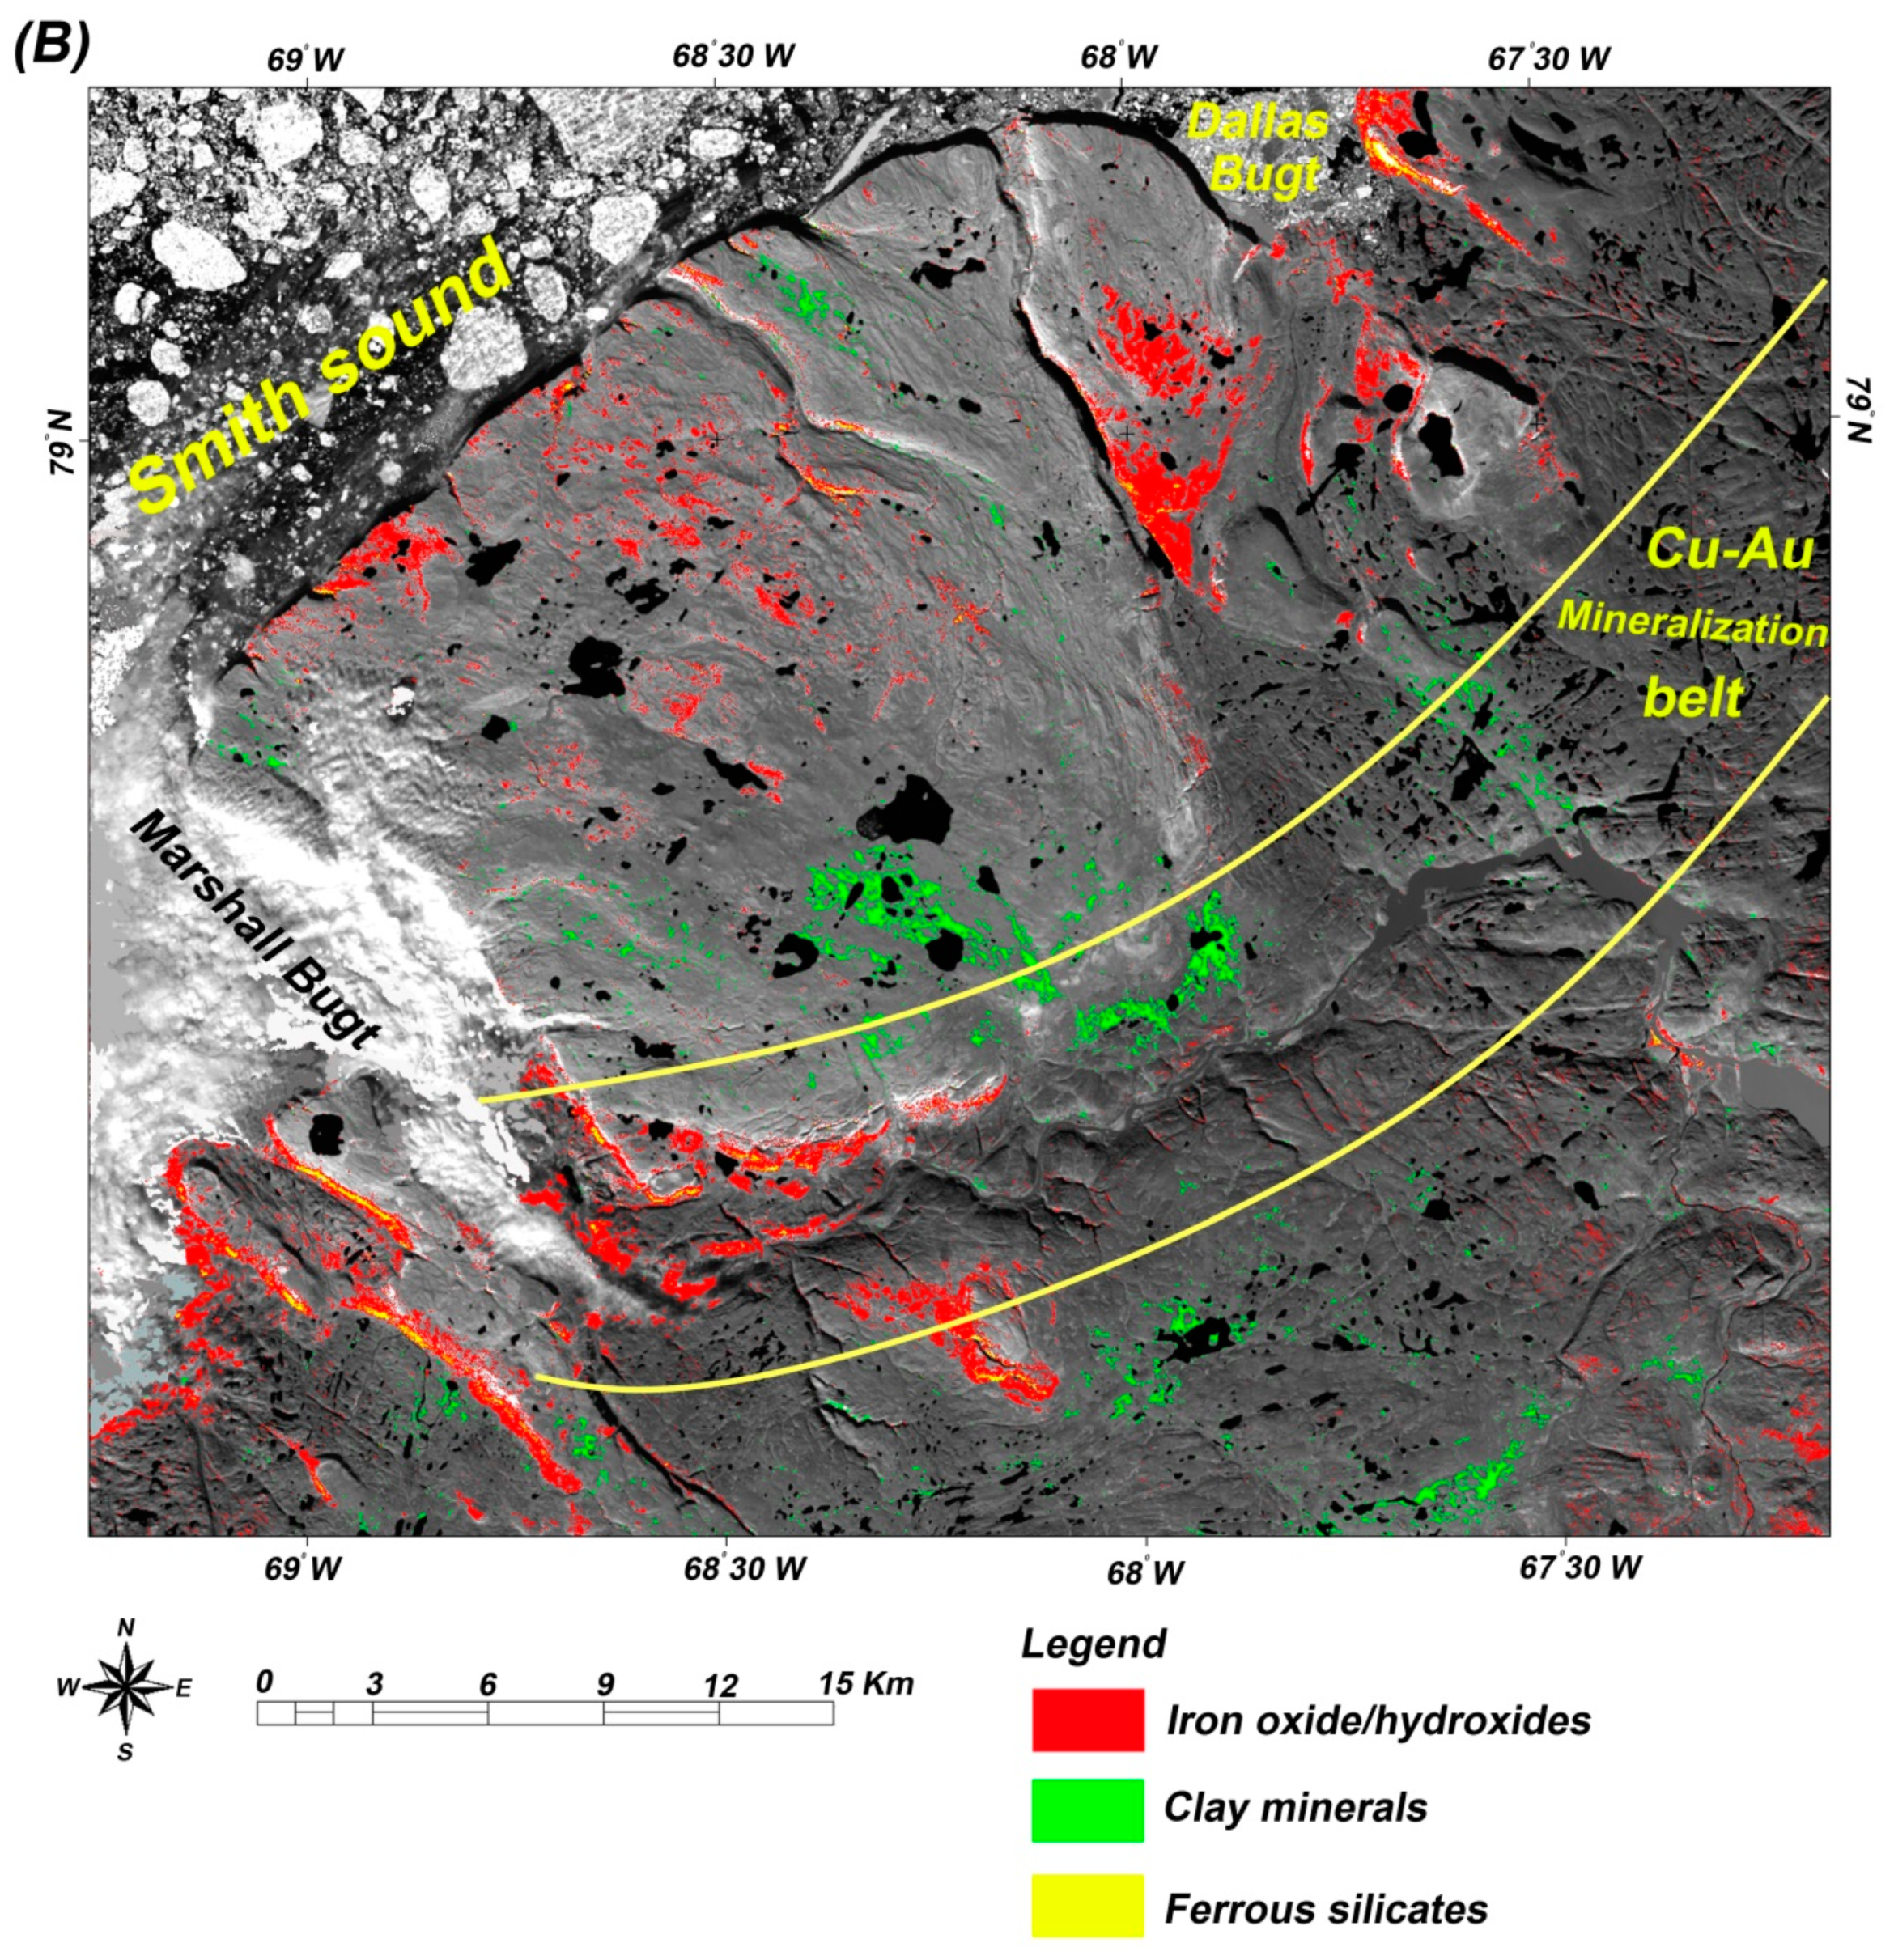
4.2. Hydrothermal Alteration Mapping in the Northeastern IMB Using ASTER Data
4.3. Mapping Iron Oxide/Hydroxide Minerals in the Southern Part of the Cu-Au Mineralization Belt Using WV-3 Data
4.4. ACE Analysis for Detecting End-Member Minerals Using VINR + SWIR Bands of ASTER
4.5. Virtual Verification Assessment
5. Discussion
6. Conclusions
Author Contributions
Funding
Acknowledgments
Conflicts of Interest
References
- Pirajno, F.; Thomassen, B.; Iannelli, T.R.; Dawes, P.R. Copper—Gold mineralisation in Inglefield Land, NW Greenland. Newsl. Int. Liaison Group Gold Miner. 2000, 30, 49–53. [Google Scholar]
- Pirajno, P.; Thomassen, B.; Dawes, P.R. Copper–gold occurrences in the Palaeoproterozoic Inglefield mobile belt, northwest Greenland: A new mineralisation style? Ore Geol. Rev. 2003, 22, 225–249. [Google Scholar] [CrossRef]
- Kolb, J.; Keiding, J.K.; Steenfelt, A.; Secher, K.; Keulen, N.; Rosa, D.; Stengaard, B.M. Metallogeny of Greenland. Ore Geol. Rev. 2016, 78, 493–555. [Google Scholar] [CrossRef]
- Gabr, S.S.; Hassan, S.M.; Sadek, M.F. Prospecting for new gold-bearing alteration zones at El-Hoteib area, South Eastern Desert, Egypt, using remote sensing data analysis. Ore Geol. Rev. 2015, 71, 1–13. [Google Scholar] [CrossRef]
- Amer, R.; El Mezayen, A.; Hasanein, M. ASTER spectral analysis for alteration minerals associated with gold mineralization. Ore Geol. Rev. 2016, 75, 239–251. [Google Scholar] [CrossRef]
- Pour, A.B.; Park, Y.; Park, T.S.; Hong, J.K.; Hashim, M.; Woo, J.; Ayoobi, I. Evaluation of ICA and CEM algorithms with Landsat-8/ASTER data for geological mapping in inaccessible regions. Geocarto Int. 2018. [Google Scholar] [CrossRef]
- Pour, A.B.; Park, Y.; Park, T.S.; Hong, J.K.; Hashim, M.; Woo, J.; Ayoobi, I. Regional geology mapping using satellite-based remote sensing approach in Northern Victoria Land, Antarctica. Polar Sci. 2018, 16, 23–46. [Google Scholar] [CrossRef]
- Pour, A.B.; Park, T.S.; Park, Y.; Hong, J.K.; Zoheir, B.; Pradhan, B.; Ayoobi, I.; Hashim, M. Application of multi-sensor satellite data for exploration of Zn-Pb sulfide mineralization in the Franklinian Basin, North Greenland. Remote Sens. 2018, 10, 1186. [Google Scholar] [CrossRef]
- Pour, A.B.; Hashim, M.; Park, Y.; Hong, J.K. Mapping alteration mineral zones and lithological units in Antarctic regions using spectral bands of ASTER remote sensing data. Geocarto Int. 2018, 33, 1281–1306. [Google Scholar] [CrossRef]
- Testa, F.J.; Villanueva, C.; Cooke, D.R.; Zhang, L. Lithological and hydrothermal alteration mapping of epithermal, porphyry and tourmaline breccia districts in the Argentine Andes using ASTER imagery. Remote Sens. 2018, 10, 203. [Google Scholar] [CrossRef]
- Sheikhrahimi, A.; Pour, B.A.; Pradhan, B.; Zoheir, B. Mapping hydrothermal alteration zones and lineaments associated with orogenic gold mineralization using ASTER remote sensing data: A case study from the Sanandaj-Sirjan Zone, Iran. Adv. Space Res. 2019, 63, 3315–3332. [Google Scholar] [CrossRef]
- Noori, L.; Pour, B.A.; Askari, G.; Taghipour, N.; Pradhan, B.; Lee, C.-W.; Honarmand, M. Comparison of Different Algorithms to Map Hydrothermal Alteration Zones Using ASTER Remote Sensing Data for Polymetallic Vein-Type Ore Exploration: Toroud–Chahshirin Magmatic Belt (TCMB), North Iran. Remote Sens. 2019, 11, 495. [Google Scholar] [CrossRef]
- Rajendran, S.; Nasir, S. Characterization of ASTER spectral bands for mapping of alteration zones of volcanogenic massive sulphide deposits. Ore Geol. Rev. 2017, 88, 317–335. [Google Scholar] [CrossRef]
- Salehi, T.; Tangestani, M.H. Large-scale mapping of iron oxide and hydroxide minerals of Zefreh porphyry copper deposit, using Worldview-3 VNIR data in the Northeastern Isfahan, Iran. Int. J. Appl. Earth Obs. Geoinf. 2018, 73, 156–169. [Google Scholar] [CrossRef]
- Pour, A.B.; Hashim, M.; Hong, J.K.; Park, Y. Lithological and alteration mineral mapping in poorly exposed lithologies using Landsat-8 and ASTER satellite data: North-eastern Graham Land, Antarctic Peninsula. Ore Geol. Rev. 2019, 108, 112–133. [Google Scholar] [CrossRef]
- Pour, A.B.; Park, Y.; Crispini, L.; Läufer, A.; Hong, J.K.; Park, T.-Y.S.; Zoheir, B.; Pradhan, B.; Muslim, A.M.; Hossain, M.S.; et al. Mapping Listvenite Occurrences in the Damage Zones of Northern Victoria Land, Antarctica Using ASTER Satellite Remote Sensing Data. Remote Sens. 2019, 11, 1408. [Google Scholar] [CrossRef]
- Safari, M.; Maghsodi, A.; Pour, A.B. Application of Landsat-8 and ASTER satellite remote sensing data for porphyry copper exploration: A case study from Shahr-e-Babak, Kerman, south of Iran. Geocarto Int. 2018, 33, 1186–1201. [Google Scholar] [CrossRef]
- Ninomiya, Y.; Fu, B. Thermal infrared multispectral remote sensing of lithology and mineralogy based on spectral properties of materials. Ore Geol. Rev. 2019, 108, 54–72. [Google Scholar] [CrossRef]
- Bedini, E. Application of WorldView-3 imagery and ASTER TIR data to map alteration minerals associated with the Rodalquilar gold deposits, southeast Spain. Adv. Space Res. 2019, 63, 3346–3357. [Google Scholar] [CrossRef]
- Sun, L.; Khan, S.; Shabestari, P. Integrated Hyperspectral and Geochemical Study of Sediment-Hosted Disseminated Gold at the Goldstrike District, Utah. Remote Sens. 2019, 11, 1987. [Google Scholar] [CrossRef]
- Zoheir, B.; Emam, A.; Abdel-Wahed, M.; Soliman, N. Multispectral and Radar Data for the Setting of Gold Mineralization in the South Eastern Desert, Egypt. Remote Sens. 2019, 11, 1450. [Google Scholar] [CrossRef]
- Zoheir, B.; El-Wahed, M.A.; Pour, A.B.; Abdelnasser, A. Orogenic Gold in Transpression and Transtension Zones: Field and Remote Sensing Studies of the Barramiya–Mueilha Sector, Egypt. Remote Sens. 2019, 11, 2122. [Google Scholar] [CrossRef]
- Leverington, D.W.; Moon, W.M. Landsat-TM-Based discrimination of Lithological units associated with the Purtuniq ophiolite, Quebec, Canada. Remote Sens. 2012, 4, 1208–1231. [Google Scholar] [CrossRef]
- He, J.; Harris, J.R.; Sawada, M.; Behnia, P. A comparison of classification algorithms using Landsat-7 and Landsat-8 data for mapping lithology in Canada’s Arctic. Int. J. Remote Sens. 2015, 36, 2252–2276. [Google Scholar] [CrossRef]
- Pour, B.A.; Hashim, M.; Marghany, M. Exploration of gold mineralization in a tropical region using Earth Observing-1 (EO1) and JERS-1 SAR data: A case study from Bau gold field, Sarawak, Malaysia. Arabian J. Geosci. 2014, 7, 2393–2406. [Google Scholar] [CrossRef]
- Pour, B.A.; Hashim, M.; van Genderen, J. Detection of hydrothermal alteration zones in a tropical region using satellite remote sensing data: Bau gold field, Sarawak, Malaysia. Ore Geol. Rev. 2013, 54, 181–196. [Google Scholar] [CrossRef]
- Askari, G.; Pour, A.B.; Pradhan, B.; Sarfi, M.; Nazemnejad, F. Band Ratios Matrix Transformation (BRMT): A Sedimentary Lithology Mapping Approach Using ASTER Satellite Sensor. Sensors 2018, 18, 3213. [Google Scholar] [CrossRef]
- Kurata, K.; Yamaguchi, Y. Integration and Visualization of Mineralogical and Topographical Information Derived from ASTER and DEM data. Remote Sens. 2019, 11, 162. [Google Scholar] [CrossRef]
- Guha, A.; Yamaguchi, Y.; Chatterjee, S.; Rani, K.; Vinod Kumar, K. Emittance Spectroscopy and Broadband Thermal Remote Sensing Applied to Phosphorite and Its Utility in Geoexploration: A Study in the Parts of Rajasthan, India. Remote Sens. 2019, 11, 1003. [Google Scholar] [CrossRef]
- Irons, J.R.; Dwyer, J.L.; Barsi, J.A. The next Landsat satellite: The Landsat Data Continuity Mission. Remote Sens. Environ. 2012, 145, 154–172. [Google Scholar] [CrossRef]
- Roy, D.P.; Wulder, M.A.; Loveland, T.A.; Woodcock, C.E.; Allen, R.G.; Anderson, M.C.; Helder, D.; Irons, J.R.; Johnson, D.M.; Kennedy, R.; et al. Landsat-8: Science and product vision for terrestrial global change research. Remote Sens. Environ. 2014, 145, 154–172. [Google Scholar] [CrossRef] [Green Version]
- Bhambri, R.; Bolch, T.; Chaujar, R.K. Mapping of debris-covered glaciers in the Garhwal Himalayas using ASTER DEMs and thermal data. Int. J. Remote Sens. 2011, 32, 8095–8119. [Google Scholar] [CrossRef] [Green Version]
- Shukla, A.; Arora, M.K.; Gupta, R.P. Synergistic approach for mapping debris-covered glaciers using optical–thermal remote sensing data with inputs from geomorphometric parameters. Remote Sens. Environ. 2010, 114, 1378–1387. [Google Scholar] [CrossRef]
- Abrams, M.; Hook, S.J. Simulated ASTER data for geologic studies. IEEE Trans. Geosci. Remote Sens. 1995, 33, 692–699. [Google Scholar] [CrossRef]
- Hunt, G.R.; Ashley, R.P. Spectra of altered rocks in the visible and near-infrared. Econ. Geol. 1979, 74, 1613–1629. [Google Scholar] [CrossRef]
- Clark, R.N. Spectroscopy of rocks and minerals, and principles of spectroscopy. In Manual of Remote Sensing; Rencz, A., Ed.; Wiley and Sons Inc.: New York, NY, USA, 1999; Volume 3, pp. 3–58. [Google Scholar]
- Cloutis, E.A.; Hawthorne, F.C.; Mertzman, S.A.; Krenn, K.; Craig, M.A.; Marcino, D.; Methot, M.; Strong, J.; Mustard, J.F.; Blaney, D.L. Detection and discrimination of sulfate minerals using reflectance spectroscopy. Icarus 2006, 184, 121–157. [Google Scholar] [CrossRef]
- Salisbury, J.W.; D’Aria, D.M. Emissivity of terrestrial material in the 8–14 μm atmospheric window. Remote Sens. Environ. 1992, 42, 83–106. [Google Scholar] [CrossRef]
- Salisbury, J.W.; Walter, L.S. Thermal infrared (2.5–13.5 μm) spectroscopic remote sensing of igneous rock types on particulate planetary surfaces. J. Geophys. Res. 1989, 94, 9192–9202. [Google Scholar] [CrossRef]
- Ninomiya, Y. Quantitative estimation of SiO2 content in igneous rocks using thermal infrared spectra with a neural network approach. IEEE TGRS 1995, 33, 684–691. [Google Scholar]
- Ninomiya, Y.; Fu, B. Regional lithological mapping using ASTER-TIR data: Case study for the Tibetan Plateau and the surrounding area. Geosciences 2016, 6, 39. [Google Scholar] [CrossRef]
- DigitalGlobe. WorldView-3 Datasheet. 2014. Available online: https://www.digitalglobe.com/sites/default/files/DG_WorldView3_DS_forWeb_0.pdf (accessed on 7 September 2019).
- Kruse, F.; Perry, S. Mineral mapping using simulated Worldview-3 short-wave infrared imagery. Remote Sens. 2013, 5, 2688–2703. [Google Scholar] [CrossRef]
- Kruse, F.A.; Baugh, M.W.; Perry, S.L. Validation of DigitalGlobe Worldview-3 earth imaging satellite shortwave infrared bands for mineral mapping. J. Appl. Remote Sens. 2015, 9, 1–18. [Google Scholar] [CrossRef]
- Asadzadeh, S.; Filho, C.R.S. Investigating the capability of WorldView-3 superspectral data for direct hydrocarbon detection. Remote Sens. Environ. 2016, 173, 162–173. [Google Scholar] [CrossRef]
- Mars, J.C. Mineral and Lithologic Mapping Capability of WorldView 3 Data at Mountain Pass, California, Using True- and False-Color Composite Images, Band Ratios, and Logical Operator Algorithms. Econ. Geol. 2018, 113, 1587–1601. [Google Scholar] [CrossRef] [Green Version]
- Sun, Y.; Tian, S.; Di, B. Extracting mineral alteration information using Worldview-3 data. Geosci. Front. 2017, 8, 1051–1062. [Google Scholar] [CrossRef]
- Ye, B.; Tian, S.H.; Ge, J.; Sun, Y. Assessment of WorldView-3 data for lithological mapping. Remote Sens. 2017, 9, 1132. [Google Scholar] [CrossRef]
- Dawes, P.R.; Frisch, T.; Garde, A.A.; Iannelli, T.R.; Ineson, J.R.; Pirajno, F.; Sønderholm, M.; Stemmerik, L.; Stouge, S.; Thomassen, B.; et al. Kane Basin 1999: Mapping, stratigraphic studies and economic assessment of Precambrian and Lower Palaeozoic provinces in North-West Greenland. Geol. Greenl. Survey Bull. 2000, 186, 11–28. [Google Scholar]
- Thomassen, B.; Dawes, P.R.; Iannelli, T.R.; Pirajno, F. Gold Indications in Northern Inglefield Land, North-West Greenland: A Preliminary Report from Project Kane Basin 1999; the Geological Survey of Denmark and Greenland (GEUS): Copenhagen, Denmark, 2000; 14p. [Google Scholar]
- Thomassen, B.; Pirajno, F.; Iannelli, T.R.; Dawes, P.R.; Jensen, S.M. Economic Geology Investigations in Inglefield Land, North–West Greenland: Part of the Project Kane Basin 1999; the Geological Survey of Denmark and Greenland (GEUS): Copenhagen, Denmark, 2000; 98p. [Google Scholar]
- Schjøth, F.; Steenfelt, A.; Thorning, L. (Eds.) Regional Compilations of Geoscience Data from Inglefield Land, North-West Greenland; the Geological Survey of Denmark and Greenland (GEUS): Copenhagen, Denmark, 1996; 35p. [Google Scholar]
- Schjøth, F.; Thorning, L. GIS Compilation of Geoscience Data: An ArcView GIS Version of Previously Published Thematic Maps from Inglefield Land; the Geological Survey of Denmark and Greenland (GEUS): Copenhagen, Denmark, 1998; 59p. [Google Scholar]
- Dawes, P.R. Explanatory Notes to the Geological Map of Greenland, 1:500,000, Thule, Sheet 5, Map Series 2; Geological Survey of Denmark and Greenland: Copenhagen, Denmark, 2006. [Google Scholar]
- Dawes, P.R. Explanatory Notes to the Geological Map of Greenland, 1:500,000, Humboldt Gletscher, Sheet 6, Map Series 1; Geological Survey of Denmark and Greenland: Copenhagen, Denmark, 2004. [Google Scholar]
- Nutman, A.P.; Dawes, P.R.; Kalsbeek, F.; Hamilton, M.A. Palaeoproterozoic and Archaean gneiss complexes in northern Greenland: Palaeoproterozoic terrane assembly in the High Arctic. Precambrian Res. 2008, 161, 419–451. [Google Scholar] [CrossRef] [Green Version]
- Dawes, P.R.; Larsen, O.; Kalsbeek, F. Archaean and Proterozoic crust in North-West Greenland: Evidence from Rb–Sr whole-rock age determinations. Can. J. Earth Sci. 1988, 25, 1365–1373. [Google Scholar] [CrossRef]
- Dawes, P.R. A Review of Geoscientific Exploration and Geology in the Kane Basin Region of Greenland, Central Nares Strait; the Geological Survey of Denmark and Greenland (GEUS): Copenhagen, Denmark, 1999; 63p. [Google Scholar]
- Henriksen, N.; Higgins, A.K.; Kalsbeek, F.; Pulvertaft, T.C.R. Greenland from Archaean to Quaternary: Descriptive text to the geological map of Greenland 1:2,500,000. Geol. Greenl. Survey Bull. 2000, 185, 93. [Google Scholar]
- Higgins, A.K.; Ineson, J.R.; Peel, J.S.; Surlyk, F.; Sønderholm, M. Lower Palaeozoic Franklinian Basin of North Greenland. In Sedimentary Basins of North Greenland; Peel, J.S., Sønderholm, M., Eds.; Bulletin-Grønlands Geologiske Undersøgelse; the Geological Survey of Denmark and Greenland (GEUS): Copenhagen, Denmark, 1991; Volume 160, pp. 71–139. [Google Scholar]
- Thomassen, B.; Appel, P.W. Ground Check of Airborne Anomalies and Regional Rust Zones in Inglefield Land, North-West Greenland; Rapport-Danmarks og Grønlands Geologiske Undersøgelse; the Geological Survey of Denmark and Greenland (GEUS): Copenhagen, Denmark, 1997; 43p. [Google Scholar]
- Thompson, A.B. Some aspects of fluid motion during metamorphism. J. Geol. Soc. 1987, 144, 309–312. [Google Scholar] [CrossRef]
- Abrams, M.; Hook, S.; Ramachandran, B. ASTER User Handbook; Version 2; Jet Propulsion Laboratory, California Institute of Technology: La Cañada Flintridge, CA, USA, 2004. Available online: http://asterweb.jpl.nasa.gov/content/03_data/04_Documents/aster_guide_v2.pdf (accessed on 7 September 2019).
- Kuester, M. Radiometric Use of WV-3 Imagery; Technical Note; DigitalGlobe: Westminster, CO, USA, 2016; p. 12. [Google Scholar]
- Kuester, M.A.; Ochoa, M.; Dayer, A.; Levin, J.; Aaron, D.; Helder, D.L.; Leigh, L.; Czapla-Meyers, J.; Anderson, N.; Bader, B.; et al. Absolute Radiometric Calibration of the DigitalGlobe Fleet and Updates on the New WV-3 Sensor Suite; Technical Note; DigitalGlobe: Westminster, CO, USA, 2015; p. 16. [Google Scholar]
- Iwasaki, A.; Tonooka, H. Validation of a crosstalk correction algorithm for ASTER/SWIR. IEEE Trans. Geosci. Remote Sens. 2005, 43, 2747–2751. [Google Scholar] [CrossRef]
- Cooley, T.; Anderson, G.P.; Felde, G.W.; Hoke, M.L.; Ratkowski, A.J.; Chetwynd, J.H.; Gardner, J.A.; Adler-Golden, S.M.; Matthew, M.W.; Berk, A.; et al. FLAASH, a MODTRAN4-based atmospheric correction algorithm, its application and validation. In Proceedings of the IEEE International on Geoscience and Remote Sensing Symposium, Toronto, ON, Canada, 24–28 June 2002; Volume 3, pp. 1414–1418. [Google Scholar]
- Research Systems, Inc. ENVI Tutorials; Research Systems, Inc.: Boulder, CO, USA, 2008. [Google Scholar]
- Fraser, S.J.; Green, A.A. A software defoliant for geological analysis of band ratios. Int. J. Remote Sens. 1987, 8, 525–532. [Google Scholar] [CrossRef]
- Crosta, A.; Moore, J. Enhancement of Landsat Thematic Mapper imagery for residual soil mapping in SW Minais Gerais State, Brazil: A prospecting case history in Greenstone belt terrain. In Proceedings of the 7th ERIM Thematic Conference: Remote Sensing for Exploration Geology, Calgary, AB, Canada, 2–6 October 1989; pp. 1173–1187. [Google Scholar]
- Crosta, A.P.; Souza Filho, C.R.; Azevedo, F.; Brodie, C. Targeting key alteration minerals in epithermal deposits in Patagonia, Argentina, Using ASTER imagery and principal component analysis. Int. J. Remote Sens. 2003, 24, 4233–4240. [Google Scholar] [CrossRef]
- Loughlin, W.P. Principal components analysis for alteration mapping. Photogramm. Eng. Remote Sens. 1991, 57, 1163–1169. [Google Scholar]
- Kokaly, R.F.; Clark, R.N.; Swayze, G.A.; Livo, K.E.; Hoefen, T.M.; Pearson, N.C.; Wise, R.A.; Benzel, W.M.; Lowers, H.A.; Driscoll, R.L.; et al. USGS Spectral Library Version 7; U.S. Geological Survey Data Series 1035; USGS Crustal Geophysics and Geochemistry Science Center: Denver, CO, USA, 2017; 61p. [Google Scholar] [CrossRef]
- Van der Werff, H.; van der Meer, F. Sentinel-2A MSI and Landsat 8 OLI Provide Data Continuity for Geological Remote Sensing. Remote Sens. 2016, 8, 883. [Google Scholar] [CrossRef]
- Clark, R.N.; Swayze, G.A.; Gallagher, A.; King, T.V.V.; Calvin, W.M. The U.S. Geological Survey, Digital Spectral Library: Version 1: 0.2 to 3.0 Microns: U.S. Geological Survey Open File Report 93-592; 1993; 1340p. Available online: http://speclab.cr.usgs.gov (accessed on 24 August 1999).
- Clark, R.N.; Swayze, G.A. Mapping minerals, amorphous materials, environmental materials, vegetation, water, ice, and snow, and other materials. In Proceedings of the USGS Tricorder Algorithm, Summaries of the Fifth Annual JPL Airborne Earth Science Workshop, The United States Geological Survey, Reston, VA, USA, 3 August 1995. [Google Scholar]
- Kalinowski, A.; Oliver, S. ASTER Mineral Index Processing Manual; Technical Report; Geoscience Australia: Canberra, Australia, 2004. Available online: http://www.ga.gov.au/image_cache/GA7833.pdf (accessed on 12 August 2018).
- Crowley, J.K.; Brickey, D.W.; Rowan, L.C. Airborne imaging spectrometer data of the Ruby Mountains, Montana: Mineral discrimination using relative absorption band-depth images. Remote Sens. Environ. 1989, 29, 121–134. [Google Scholar] [CrossRef]
- Ninomiya, Y.; Fu, B.; Cudahy, T.J. Detecting lithology with Advanced Spaceborne Thermal Emission and Reflection Radiometer (ASTER) multispectral thermal infrared radiance-at-sensor data. Remote Sens. Environ. 2005, 99, 127–139. [Google Scholar] [CrossRef]
- Boardman, J.W. Inversion of imaging spectrometry data using singular value decomposition. In Proceedings of the IGARSS’89, 12th Canadian Symposium on Remote Sensing, Vancouver, BC, Canada, 10–14 July 1989; Volume 4, pp. 2069–2072. [Google Scholar]
- Boardman, J.W. Sedimentary Facies Analysis Using Imaging Spectrometry: A Geophysical Inverse Problem. Ph. D. Thesis, University of Colorado, Boulder, CO, USA, 1992; p. 212. [Google Scholar]
- Adams, J.B.; Smith, M.O.; Gillespie, A.R. Imaging spectroscopy: Interpretation based on spectral mixture analysis. In Remote Geochemical Analysis: Elemental and Mineralogical Composition; Pieters, C.M., Englert, P.A.J., Eds.; Cambridge University Press: New York, NY, USA, 1993; pp. 145–166. [Google Scholar]
- Adams, J.B.; Sabol, D.E.; Kapos, V.; Filho, R.A.; Roberts, D.A.; Smith, M.O.; Gillespie, A.R. Classification of multispectral images based on fractions of endmembers: Application to land-cover change in the Brazilian Amazon. Remote Sens. Environ. 1995, 52, 137–154. [Google Scholar] [CrossRef]
- Kruse, F.A.; Bordman, J.W.; Huntington, J.F. Comparison of airborne hyperspectral data and EO-1 Hyperion for mineral mapping. IEEE Trans. Geosci. Remote Sens. 2003, 41, 1388–1400. [Google Scholar] [CrossRef]
- Kruse, F.A.; Perry, S.L. Regional mineral mapping by extending hyperspectral signatures using multispectral data. IEEE Trans. Geosci. Remote Sens. 2007, 4, 154–172. [Google Scholar]
- Boardman, J.W.; Kruse, F.A. Automated spectral analysis: A geologic example using AVIRIS data, north Grapevine Mountains, Nevada. In Proceedings of the Tenth Thematic Conference on Geologic Remote Sensing, Environmental Research Institute of Michigan, Ann Arbor, MI, USA, 9 June 1994; pp. I-407–I-418. [Google Scholar]
- Boardman, J.W.; Kruse, F.A.; Green, R.O. Mapping target signatures via partial unmixing of AVIRIS data. In Proceedings of the Fifth JPL Airborne Earth Science Workshop, Pasadena, CA, USA, 12 March 1995; Volume 1, pp. 23–26. [Google Scholar]
- Manolakis, D.; Marden, D.; Shaw, G.A. Hyperspectral Image Processing for Automatic Target Detection Applications. Linc. Lab. J. 2003, 14, 79–116. [Google Scholar]
- Kraut, S.; Scharf, L.L.; Butler, R.W. The adaptive coherence estimator: A uniformly most-powerful-invariant adaptive detection statistic. IEEE Trans. Signal Process. 2005, 53, 427–438. [Google Scholar] [CrossRef]
- Bidon, S.; Besson, O.; Tourneret, J.Y. The Adaptive Coherence Estimator is the Generalized Likelihood Ratio Test for a Class of Heterogeneous Environments. IEEE Signal Process. Lett. 2008, 15, 281–284. [Google Scholar] [CrossRef]
- Kraut, S.; Scharf, L.L.; McWhorter, L.T. Adaptive subspace detectors. IEEE Trans. Signal Process. 2001, 49, 1–16. [Google Scholar] [CrossRef]
- Alvey, B.; Zare, A.; Cook, M.; Ho, D.K.C. Adaptive coherence estimator (ACE) for explosive hazard detection using wideband electromagnetic induction (WEMI). In Proceedings of the SPIE 9823, Detection and Sensing of Mines, Explosive Objects, and Obscured Targets XXI, Baltimore, MA, USA, 3 May 2016. [Google Scholar] [CrossRef]
- Warren, S.G. Optical properties of snow. Rev. Geophys. Space Phys. 1982, 20, 67–89. [Google Scholar] [CrossRef]
- Hall, D.K.; Riggs, G.A.; Salomonson, V.V.; DiGirolamo, N.E.; Bayr, K. MODIS snow-cover products. Remote Sens. Environ. 2002, 83, 181–1194. [Google Scholar] [CrossRef]
- Gupta, R.P.; Haritashya, U.K.; Singh, P. Mapping dry/wet snow cover in the Indian Himalayas using IRS multispectral imagery. Remote Sens. Environ. 2005, 97, 458–469. [Google Scholar] [CrossRef]
- Pour, B.A.; Hashim, M. Identification of hydrothermal alteration minerals for exploring of porphyry copper deposit using ASTER data, SE Iran. J. Asian Earth Sci. 2011, 42, 1309–1323. [Google Scholar] [CrossRef]
- Velosky, J.C.; Stern, R.J.; Johnson, P.R. Geological control of massive sulfide mineralization in the Neoproterozoic Wadi Bidah shear zone, southwestern Saudi Arabia, inferences from orbital remote sensing and field studies. Precambrian Res. 2003, 123, 235–247. [Google Scholar] [CrossRef]
- Bishop, J.L.; Lane, M.D.; Dyar, M.D.; Brwon, A.J. Reflectance and emission spectroscopy study of four groups of phyllosilicates: Smectites, kaolinite-serpentines, chlorites and micas. Clay Min. 2008, 43, 35–54. [Google Scholar] [CrossRef]
- Sherman, D.M.; Waite, T.D. Electronic spectra of Fe3+ oxides and oxide-hydroxides in the near IR to near UV. Am. Mineral. 1985, 70, 1262–1269. [Google Scholar]
- Morris, R.V.; Lauer, H.V.; Lawson, C.A.; Girson, E.K.; Nace, G.A.; Stewart, C. Spectral and other physicochemical properties of submicron powders of hematite (á-Fe2O3), maghemite (ã-Fe2O3), magnetite (Fe3O4), goethite (á-FeOOH), and lepidocrocite (ã-FeOOH). J. Geophys. Res. 1985, 90, 3126–3144. [Google Scholar] [CrossRef] [PubMed]
- Story, M.; Congalton, R. Accuracy assessment: A user’s perspective. Photogramm. Eng. Remote Sens. 1986, 52, 397–399. [Google Scholar]
- Congalton, R.G. A review of assessing the accuracy of classification of remotely sensed data. Remote Sens. Environ. 1991, 37, 35–46. [Google Scholar] [CrossRef]
- Lillesand, T.; Kiefer, R. Remote Sensing and Image Interpretation; John Wiley & Sons, Inc.: New York, NY, USA, 1994; Chapter 7. [Google Scholar]
- Steenfelt, A.; Dam, E. Reconnaissance Geochemical Mapping of Inglefield Land, North-West Greenland; Rapport-Danmarks og Grønlands Geologiske Undersøgelse; the Geological Survey of Denmark and Greenland (GEUS): Copenhagen, Denmark, 1996; 27p. [Google Scholar]
- Bedini, E. Mapping lithology of the Sarfartoq carbonatite complex, southern West Greenland, using HyMap imaging spectrometer data. Remote Sens. Environ. 2009, 113, 1208–1219. [Google Scholar] [CrossRef]
- Bedini, E.; Rasmussen, T.M. Use of airborne hyperspectral and gamma-ray spectroscopy data for mineral exploration at the Sarfartoq carbonatite complex, southern West Greenland. Geosci. J. 2018, 22, 641–651. [Google Scholar] [CrossRef]
- Bedini, E. Mineral mapping in the Kap Simpson complex, central East Greenland, using HyMap and ASTER remote sensing data. Adv. Space Res. 2011, 47, 60–73. [Google Scholar] [CrossRef]

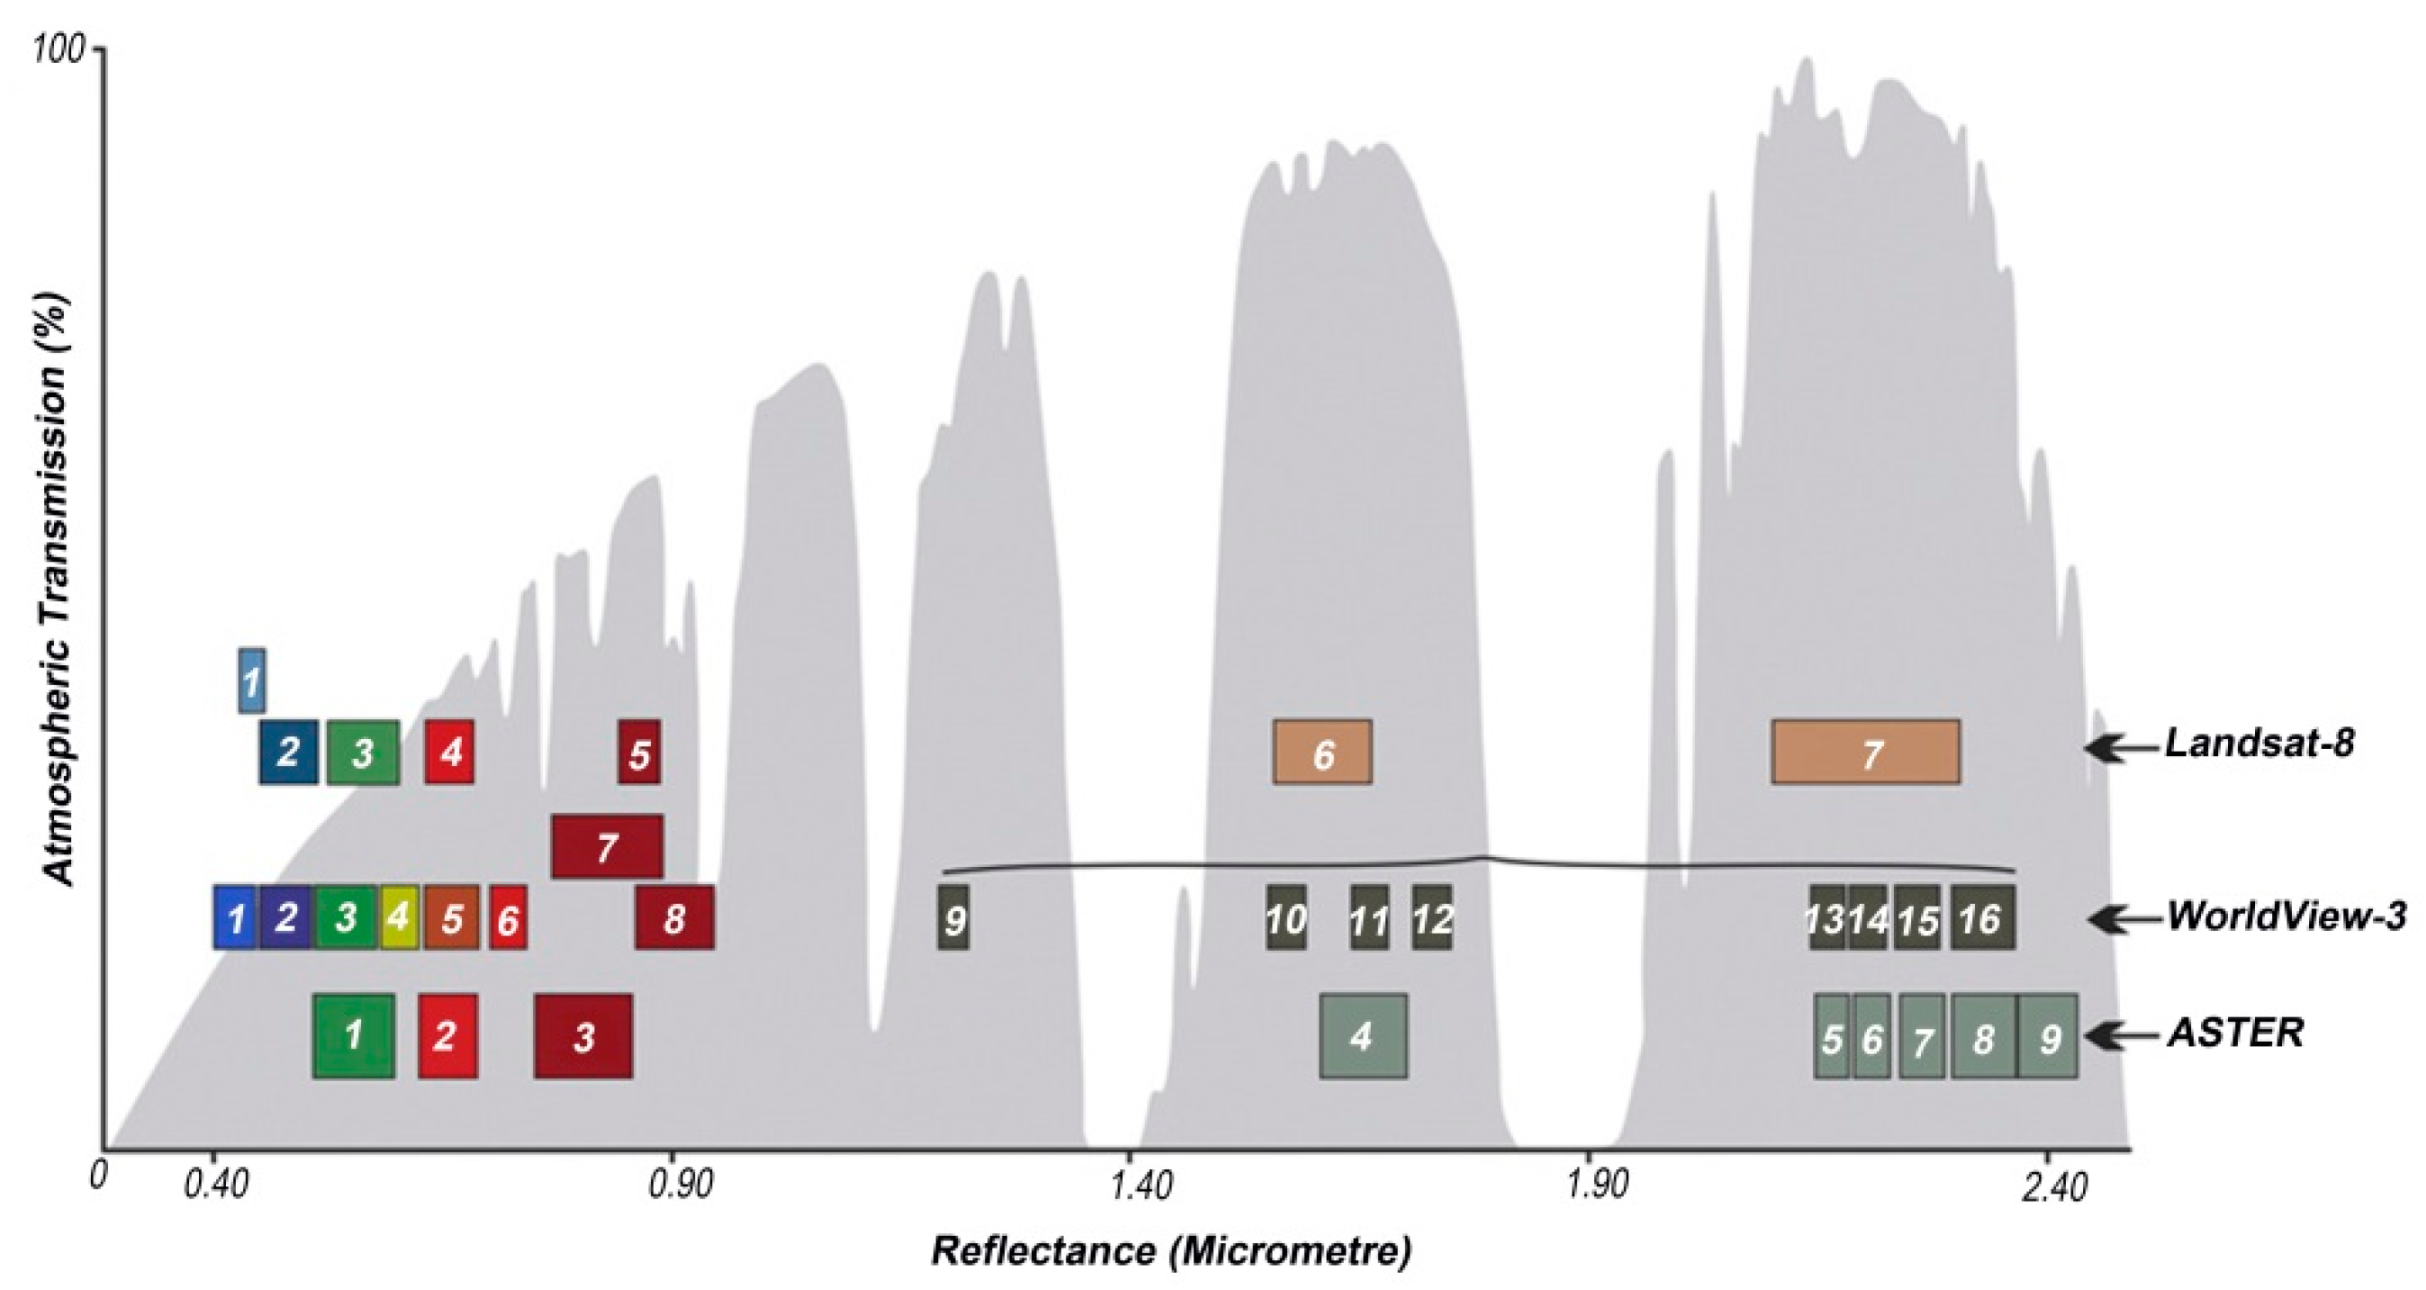









| Sensors | Subsystem | Band Number | Spectral Range (μm) | Ground Resolution (m) | Swath Width(m) |
|---|---|---|---|---|---|
| Landsat-8 | VNIR | 1 | 0.433–0.453 | 30 | 185 |
| 2 | 0.450–0.515 | ||||
| 3 | 0.525–0.600 | ||||
| 4 | 0.630–0.680 | ||||
| 5 | 0.845–0.885 | ||||
| SWIR | 6 | 1.560–1.660 | 15 | ||
| 7 | 2.100–2.300 | ||||
| Pan | 0.500–0.680 | ||||
| TIR | 9 | 1.360–1.390 | 100 | ||
| 10 | 10.30–11.30 | ||||
| 11 | 11.50–12.50 | ||||
| ASTER | VNIR | 1 | 0.520–0.600 | 15 | 60 |
| 2 | 0.630–0.690 | ||||
| 3 | 0.780–0.860 | ||||
| SWIR | 4 | 1.600–1.700 | 30 | ||
| 5 | 2.145–2.185 | ||||
| 6 | 2.185–2.225 | ||||
| 7 | 2.235–2.285 | ||||
| 8 | 2.295–2.365 | ||||
| 9 | 2.360–2430 | ||||
| TIR | 10 | 8.125–8.475 | 90 | ||
| 11 | 8.475–8.825 | ||||
| 12 | 8.925–9.275 | ||||
| 13 | 10.25–10.95 | ||||
| 14 | 10.95–11.65 | ||||
| WV3 | VNIR | Costal (1) | 0.400–0.450 | 1.24 | 13.1 |
| Blue (2) | 0.450–0.510 | ||||
| Green (3) | 0.510–0.580 | ||||
| Yellow (4) | 0.585–0.625 | ||||
| Red (5) | 0.630–0.690 | ||||
| Red edge (6) | 0.705–0.745 | ||||
| Near-IR1 (7) | 0.770–0.895 | ||||
| Near-IR2 (8) | 0.860–1.040 | ||||
| SWIR | SWIR-1 (9) | 1.195–1.225 | 3.70 | ||
| SWIR-1 (10) | 1.550–1590 | ||||
| SWIR-1 (11) | 1.640–1.680 | ||||
| SWIR-1 (12) | 1.710–1.750 | ||||
| SWIR-1 (13) | 2.145–2.185 | ||||
| SWIR-1 (14) | 2.185–2.225 | ||||
| SWIR-1 (15) | 2.235–2.285 | ||||
| SWIR-1 (16) | 2.295–2.365 |
| Eigenvector | B4/B2 | B6/B4 | B6/B5 | B6/B7 |
|---|---|---|---|---|
| DPCA 1 | 0.412529 | 0.470934 | 0.624086 | 0.467501 |
| DPCA 2 | 0.459849 | 0.282028 | −0.770751 | 0.339030 |
| DPCA 3 | 0.686248 | 0.714648 | −0.124892 | −0.052382 |
| DPCA 4 | −0.383955 | −0.433543 | −0.029349 | 0.814713 |
| Eigenvector | B2/B1 | B4/B2 | B5 + B7/B6 | B7 + B9/B8 | B6 + B8/B7 |
|---|---|---|---|---|---|
| DPCA 1 | −0.219557 | −0.347765 | −0.900627 | −0.123124 | −0.067567 |
| DPCA 2 | −0.547623 | 0.589087 | −0.177962 | −0.235635 | −0.434915 |
| DPCA 3 | 0.263209 | 0.141891 | −0.759215 | 0.418035 | 0.399283 |
| DPCA 4 | −0.027870 | −0.119071 | 0.531229 | 0.709489 | −0.288482 |
| DPCA 5 | −0.568874 | 0.044535 | 0.108190 | 0.314737 | −0.750756 |
| Eigenvector | QI | CI | MI |
|---|---|---|---|
| DPCA 1 | −0.596505 | −0.527385 | −0.605018 |
| DPCA 2 | 0.792423 | −0.302209 | −0.097008 |
| DPCA 3 | −0.106481 | 0.790280 | −0.530590 |
| Eigenvector | B4 + B2/B3 | B6 + B8/B7 | B3 + B5/B4 | B5 + B7/B6 |
|---|---|---|---|---|
| DPCA 1 | −0.155644 | −0.927722 | −0.174958 | −0.290683 |
| DPCA 2 | 0.762743 | −0.369967 | 0.461865 | 0.262084 |
| DPCA 3 | 0.049338 | −0.949469 | 0.090503 | 0.396450 |
| DPCA 4 | 0.496839 | −0.004738 | −0.864801 | 0.072448 |
| LSU Classification Map Landsat-8 | Detected Pixel Spectra by the ACE Algorithm | ||||
|---|---|---|---|---|---|
| Iron Oxide/Hydroxides | Clay Minerals | Ferrous Silicates | Totals | User’s Accuracy | |
| Iron oxide/hydroxides | 46 | 2 | 8 | 56 | 82% |
| Clay minerals | 2 | 48 | 4 | 54 | 88% |
| Ferrous silicates | 12 | 10 | 28 | 50 | 56% |
| Totals | 60 | 60 | 40 | 160 | |
| Producer’s Accuracy | 76% | 80% | 70% | ||
| Overall accuracy = 76.25% | Kappa Coefficient = 0.64 | ||||
| LSU Classification Map ASTER | Detected Pixel Spectra by the ACE Algorithm | ||||||
|---|---|---|---|---|---|---|---|
| Hematite/Jarosite | Chlorite/Epidote | Muscovite/Kaolinite | Chalcedony/Opal | Biotite | Totals | User’s Accuracy | |
| Hematite/jarosite | 42 | 8 | 3 | 10 | 8 | 71 | 59% |
| Chlorite/epidote | 6 | 39 | 1 | 7 | 6 | 59 | 66% |
| Muscovite/kaolinite | 0 | 1 | 43 | 2 | 5 | 51 | 84% |
| Chalcedony/opal | 7 | 8 | 8 | 38 | 6 | 67 | 56% |
| Biotite | 5 | 4 | 5 | 3 | 35 | 52 | 67% |
| Totals | 60 | 60 | 60 | 60 | 60 | 300 | |
| Producer’s Accuracy | 70% | 65% | 71% | 63% | 58% | ||
| Overall accuracy = 65.66% | Kappa Coefficient = 0.57 | ||||||
| LSU Classification Map WV-3 | Detected Pixel Spectra by the ACE Algorithm | |||||
|---|---|---|---|---|---|---|
| Hematite | Jarosite | Ferric Silictes | Ferrous Silicates | Totals | User’s Accuracy | |
| Hematite | 39 | 6 | 5 | 1 | 51 | 76% |
| Jarosite | 7 | 40 | 4 | 3 | 54 | 74% |
| Ferric Silictes | 3 | 4 | 38 | 9 | 54 | 70% |
| Ferrous Silicates | 1 | 0 | 3 | 37 | 41 | 90% |
| Totals | 50 | 50 | 50 | 50 | 200 | |
| Producer’s Accuracy | 78% | 80% | 76% | 74% | ||
| Overall accuracy = 77% | Kappa Coefficient = 0.69 | |||||
© 2019 by the authors. Licensee MDPI, Basel, Switzerland. This article is an open access article distributed under the terms and conditions of the Creative Commons Attribution (CC BY) license (http://creativecommons.org/licenses/by/4.0/).
Share and Cite
Beiranvand Pour, A.; S. Park, T.-Y.; Park, Y.; Hong, J.K.; M Muslim, A.; Läufer, A.; Crispini, L.; Pradhan, B.; Zoheir, B.; Rahmani, O.; et al. Landsat-8, Advanced Spaceborne Thermal Emission and Reflection Radiometer, and WorldView-3 Multispectral Satellite Imagery for Prospecting Copper-Gold Mineralization in the Northeastern Inglefield Mobile Belt (IMB), Northwest Greenland. Remote Sens. 2019, 11, 2430. https://doi.org/10.3390/rs11202430
Beiranvand Pour A, S. Park T-Y, Park Y, Hong JK, M Muslim A, Läufer A, Crispini L, Pradhan B, Zoheir B, Rahmani O, et al. Landsat-8, Advanced Spaceborne Thermal Emission and Reflection Radiometer, and WorldView-3 Multispectral Satellite Imagery for Prospecting Copper-Gold Mineralization in the Northeastern Inglefield Mobile Belt (IMB), Northwest Greenland. Remote Sensing. 2019; 11(20):2430. https://doi.org/10.3390/rs11202430
Chicago/Turabian StyleBeiranvand Pour, Amin, Tae-Yoon S. Park, Yongcheol Park, Jong Kuk Hong, Aidy M Muslim, Andreas Läufer, Laura Crispini, Biswajeet Pradhan, Basem Zoheir, Omeid Rahmani, and et al. 2019. "Landsat-8, Advanced Spaceborne Thermal Emission and Reflection Radiometer, and WorldView-3 Multispectral Satellite Imagery for Prospecting Copper-Gold Mineralization in the Northeastern Inglefield Mobile Belt (IMB), Northwest Greenland" Remote Sensing 11, no. 20: 2430. https://doi.org/10.3390/rs11202430
APA StyleBeiranvand Pour, A., S. Park, T.-Y., Park, Y., Hong, J. K., M Muslim, A., Läufer, A., Crispini, L., Pradhan, B., Zoheir, B., Rahmani, O., Hashim, M., & Hossain, M. S. (2019). Landsat-8, Advanced Spaceborne Thermal Emission and Reflection Radiometer, and WorldView-3 Multispectral Satellite Imagery for Prospecting Copper-Gold Mineralization in the Northeastern Inglefield Mobile Belt (IMB), Northwest Greenland. Remote Sensing, 11(20), 2430. https://doi.org/10.3390/rs11202430


