1. Introduction
Vicarious calibration (VicCal) is one methodology by which the ratio of incident radiance to output digital numbers (DN) can be determined for an on-orbit sensor. This conversion scalar is then used to create future radiance data products. VicCal makes use of surface reflectance and atmospheric transmittance measurements in conjunction with a radiative-transfer code. A preferred test site is Railroad Valley (RRV), Nevada. This dry lakebed is approximately 10 km in width, homogeneous, and devoid of structures and other developments. The VicCal procedure has been used to establish the absolute radiometric scale of a number of sensors, including the Earth Observing System (EOS)/Multi-angle Imaging SpectroRadiometer (MISR) [
1]. MISR is a global surveyor that images mid-latitude targets three times per 16-day repeat cycle. It can view RRV at a nadir angle for one of the three paths, and within 10° for the other two. This is ideal in that the surface reflectance measurements are taken at a nadir-view angle. When the orbital sensor views at the same angle as the surface measurements, there is no need to correct the field observations for an off-nadir view angle. Conversely, calibration of Orbiting Carbon Observatory-2 (OCO-2) is more challenging [
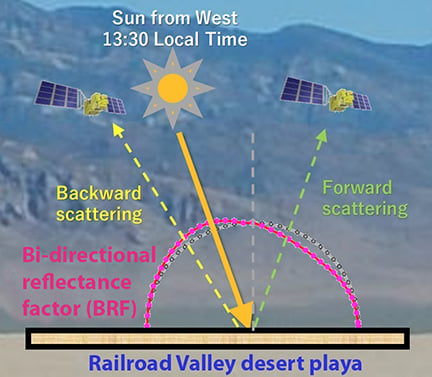
2], due to both the need to schedule observations, and the large view angles that often accompany these observations. View zenith angles range up to 20°, for which the surface reflectance changes by as much as 6% compared to the nadir-view value. Likewise, Japan’s Greenhouse gasses Observing SATellite (GOSAT) views at large off-nadir angles. Specifically, the view from Path 36 is from the East at 20° zenith (20 E), the forward-scattering direction, and from the West at 30° zenith (30 W) for Path 37, the backscatter direction. The overpass times for both OCO-2 and GOSAT is early afternoon, at approximately 21:00 (Coordinated Universal Time (UTC) (14:00 Pacific Daylight Time (PDT)).
The off-nadir deviation in reflectance can be determined by a number of ground and orbital instruments. Ground instruments include the Portable Apparatus for Rapid Acquisition of Bidirectional Observation of the Land and Atmosphere (PARABOLA), the University of Lethbridge Goniometer System-2 (ULGS-2), and Analytical Spectral Devices (ASD) FieldSpecPro field spectrometers (Longmont, CO, USA). Orbital sensors with relevant datasets are from Multi-angle SpectroRadiometer (MISR) and MODerate resolution Imaging Spectroradiometer (MODIS). Historically, the OCO and GOSAT communities have relied upon the MODIS surface product. This is because of its global coverage, and the fact that the product is updated daily using data from a morning and an afternoon sensor. As we will show, this standard product fails to retrieve surface reflectances over our desert test sites. This is due to a data quality flag confusing the bright service with a hazy atmosphere. The research reported here validates better alternatives. Both MISR data, with new data available three times in 16 days, or the PARABOLA model reported here are appropriate datasets.
RRV is a valued VicCal test site, due to its size and lack of development. It is under Bureau of Land Management (BLM) stewardship, a Federal agency whose mission is to coordinate shared usage of public land. Both National Aeronautics and Space Administration/Jet Propulsion Laboratory (NASA/JPL) and the University of Arizona, Tucson, have land rights-of-way with the BLM, in order to place network sensors on the playa. The surface of the RRV playa is spatially and spectrally homogenous, with slight variations on the scale of several hundreds of meters extent. The surface optical characteristics are largely determined by three factors: surface mineral composition, surface fine structure, and soil moisture. Mineralogically, the surface composition is dominated by a mixture of clay minerals (tan colors), fine grained quartz crystals (white blotches), rock microlites (black spots, mostly an artifact of from surface road engineering), and coarse sand-sized quartz. Salts are less common but have been found to form clusters at 10–20 cm depth. The compositional endmembers of these components vary across the playa, as does the surface structure, including mud cracks and greater angular variability in softer substrate locations. Frequent winds during summer afternoon campaigns tend to concentrate in the eastern part of the playa, and, in some years, higher surface concentrations of sand-sized quartz grains have been found at some locations, like M03, likely affecting the overall optical characteristics of the surface. After rain events, surface albedo has been found to stabilize after approximately 1–2 weeks of dry conditions. Being a desert playa in a locally arid environment, sabkha processes dominate soil moisture [
3] including evaporative pumping, which causes a dryer surface during the day at the same time experiencing a higher evaporative throughput of water from below. The combination of these compositional, hydrological, and structural effects could cause differences in the apparent bi-directional reflectance factor (BRF), but the off-nadir reflectance, normalized to its value at nadir, is shown here to have minimal variability in time and location within the playa.
Off-nadir BRF is also of interest to those making sensor cross-comparisons, where two sensors are likely be looking at an unvegetated Pseudo-Invariant Calibration Sites (PICS) target at different view and/or sun angles. In this application, a correction is needed to adjust the radiances measured by the reference sensor into effective radiances that would have been seen at the view angles of the sensor to be calibrated. This technology is not specific to RRV, but the validation of the MISR BRF data product over desert sites, as shown here, is relevant to those making these cross-sensor comparisons.
2. Vicarious Calibration
The calibration of a nadir-viewing on-orbit sensor is performed by having it record data over a test site, such as RRV, simultaneous to making in situ measurements. At RRV, an Aerosol Robotic Network (AERONET) Cimel instrument records aerosol optical depth (AOD) and its slope with wavelength. If the experiment is done with use of a staffed field-campaign, then surface reflectance measurements are made with a spectrometer, typically an ASD FieldSpecPro. These data are collected with a nadir-viewing optic, as it would difficult to collect data at all possible sensor view angles. Hundreds of data samples are collected, all within a half hour of the satellite overpass. The time window is necessary in that the reflectance will change with a change in the incident sun angle. Periodically, the spectrometer is used to collect data over a reflectance standard, including a measurement at the start and end of the window. Preferred is a Spectralon reflectance standard, which approaches 100% reflectance in the visible and near-infrared, and is near Lambertian (diffuse). The spectrometer need not be calibrated for this application, as traceability to an International System of Units (SI) is via the reflectance standard. The reflectance is computed by correcting the Spectralon data for its spectral reflectance and BRF, interpolating to a data value at the time sample of the target (playa), then taking the ratio of target to adjusted Spectralon. These are averaged to obtain a reflectance representative of an area within the flight-sensors field-of-view. All inputs (including AOD, reflectance) are input into a radiative transfer code, such as MODTRAN, and used to derive the top-of-atmosphere (TOA) radiance incident at the sensor. Radiometric calibration coefficients are determined from this TOA radiance and the sensor’s digital number output. The calibration equation used is specific to the sensor under test.
In the absence of a field team, network data can be used to determine surface reflectance. Data derived from the in situ instruments at RRV are accessible to the public via the on-line RadCalNet portal [
4,
5]. TOA radiances are available at a nadir-view angle, as well as the bottom-of-atmosphere reflectances. These are reported at 10 nm sampling, from 400 to 1000 nm, and from 9:00 UTC. to 15:00 UTC. local time. With these, calibration scientists have access to datasets that can be used to calibrate nadir-viewing sensors. For sensors that view off-nadir, RadCalNet data alone are not sufficient.
For vicarious calibration of off-nadir sensors, the absolute BRF (reflectance with angle) is not required, but rather a relative factor normalized to the nadir view. Mathematically, we write:
In Equation (1), we see that the surface reflectance used in the vicarious calibration analysis contains the parameter, which is measured by the field team using an ASD. These data are taken at a nadir view, hence the term , where the function varies with Ssun, the solar zenith, and azimuth angle (Equation (2)). This is multiplied by normBRF, derived from PARABOLA or other source. In Equation (3), we define the normalized BRF, normBRF, as the off-nadir BRF, at the solar-incident and view angles of interest, divided by the nadir BRF. This parameter has a value of 1 for a nadir viewing sensor, and otherwise describes the deviation with view angle, compared to a nadir view. For sensors that view close to nadir, the normBRF correction term is small. However, it can be large for the GOSAT and OCO sensors. Once the normBRF is determined, it multiplies the ASD measured (or RadCalNet) surface reflectance. A radiative transfer code is then used to compute the TOA radiance incident on the flight sensor, and the calibration is completed.
VicCal measurements of top-of-atmosphere radiance are typically quoted as having an uncertainty of 3% (1σ) for nadir-viewing sensors [
6]. We require that VicCal for the OCO and GOSAT sensors to have an uncertainty no larger than 5%, for views as large as 30° off-nadir [
7,
8]. This drives the need to determine the uncertainties in the off-nadir datasets.
3. PARABOLA
The PARABOLA [
9],
Figure 1, is a fully automated sphere-scanning radiometer consisting of eight spectral channels. Four of these (444, 551, 650, and 860 nm) provide data with MISR passbands. Additionally, one channel exists for the characterization of water vapor (944 nm), and two for characterization of aerosol optical depth at longer wavelengths (1028 and 1650 nm). The latter channel is also used for vegetation studies. Finally, a broad-band channel (400–700 nm, centered at 581 nm) provides measurement of photosynthetic active solar radiation (PAR). PARABOLA’s azimuth and zenith drives allow sampling at 5° steps in both the upper and lower hemispheres, with 5° fields-of-view. This generates 2664 samples (37 zenith by 72 azimuth) during the scan repeat time of 3.3 minutes. The silicon and germanium detectors, the latter for the 1028 and 1650 nm channels, are all thermoelectrically cooled to −10° C. As we are interested in surface reflectance, only data from surface-leaving, upwelling light, are discussed here. The downwelling light is used in the analysis to orient the data product to North for a 0° azimuth angle.
In total, 34 PARABOLA datasets have been collected at RRV between 2011 and 2019. Beginning in 2013, the locations have been set at four sites: M03 (38.4839 N, 115.6849 W), M20 (38.4530 N, 115.6440 W), MDN (38.4991 N, 115.6917 W), and H14 (38.4396 N, 115.6687 W), all at a surface elevation of 1437 m. The distance from MDN, to the North, and H14, the furthest to the south, is 7.1 km (4.4 mi). At each of these sites, a permanently installed telescoping mast allows easy installation and repeatability of location. The instrument is telescoped up to a height of roughly 4.6 m (15 ft). Surface images from two of these sites are shown in
Figure 2. The northern most sites, MDN and M03, are soft. Footprints at these locations sink to several centimeters or so in depth. The southern two sites are hard and flat. No footprints are left at these locations.
The instrument is set up in the morning, and taken down late afternoon, unless high winds or clouds call for an early termination for the day.
Figure 3 (left) shows the raw data for the 581 nm channel. The center of this polar plot represents the nadir view. Moving out in radius from here are views from nadir to the horizon (at 90°), with dotted lines at 30° and 60° view zeniths. The solar azimuth for this scan (taken at 21:05 UTC) was at 23° zenith and 233° azimuth. The blue/green line appearing opposite the solar azimuth (at 53°) and originating from the center is the mast shadow. It is observed that there is a “hotspot” retroreflection, shown in red, in the backscatter direction. This hotspot is due to the small-scale topography, and the fact that the illumination of surfaces facing the sun are brighter than those that are inclined at a different angle. The bright (red) pixels from azimuth 180° to 225° and extending to about 20° zenith are due to the presence of a Spectralon reflectance standard.
In this paper, we refer interchangeably to either the surface bi-directional reflectance factor (BRF) or bi-directional reflectance distribution function (BRDF). These functions are reported by projects as a means to describe land surface reflectance anisotropy. They are used to determine leaf-area index, surface roughness, snow grain size, land surface albedo, and more. The first is the ratio of upwelling radiance to that from to an ideal (100% reflecting, perfectly diffuse) standard, under the same illumination and viewing conditions. The latter is the ratio of reflected radiance to downwelling irradiance. As the Lambertian reference target is ideal, the light reflected from it is scattered equally into π steradians, hence it can be shown that BRF=π*BRDF. Because BRF is a ratio of two fluxes, it is a unitless quantity, unlike BRDF. Aside from the factor of π, the BRF and the BRDF are essentially identical descriptions of the scattering properties of a surface, and the two terms can be used interchangeably. A discussion of this and reflectance terminology in general can be found in [
10]. Those familiar with these terms might also clarify that it is the hemispheric-directional reflectance factor (HDRF) that is measured here. This is because light strikes the surface from all angles, an effect due to atmospheric scattering. The difference between BRF and HDRF has been shown to be small for clear sky desert conditions, as is found at RRV. Thus, here we approximate BRF from the measured HDRF, and do not refer to HDRF further.
The first processing step is to rotate the data such that a view azimuth of 0° refers to a sensor looking from the North. This is done by comparing the location of the sun, in the upwelling observations, to that expected from a solar ephemeris look-up. An offset clocking value is determined in this step, and applied as a geometric calibration scalar. Next, the data at all view angles are ratioed to the data at nadir, which is the Spectralon view. This produces a BRF, except at view angle locations that are not viewing the target of interest. For these samples, such as those containing the Spectralon and mast shadow, the BRF is approximated with values extrapolated from a polynomial fit along zenith slices. The data are then smoothed by fitting to the modified Rahman–Pinty–Verstraete (mRPV) surface model [
11], with results shown in
Figure 3 (right). The model has three free parameters, r
0, k, and b, and is given in Equations (4)–(7). Here,
is the solar zenith angle, θ the view zenith, and φ the view azimuth relative to the sun. The function h is a factor to account for the hot spot. The function
depends only on scattering angle, the angle between the directions of the incident, and reflected radiances. This model is physically based, and the description of the hot spot is derived from the transmission of radiation in a porous medium, and it has been widely used and validated for a variety of soil and vegetation surfaces [
12]:
We wish to explore this normalized function, normBRF, as a function of view angle, wavelength, location, and time. We focus on the 21:00 UTC (14:00 PDT) overpass time, with a solar zenith—23° in summer, and the 30 W, 20 E view angles, as these of interest to the OCO and GOSAT communities. For the above plot, the normBRF value are respectively 1.05 and 0.91 for the backscatter and forescatter directions, respectively, in the West–East azimuthal scan. These numbers are invariant over the PARABOLA bands, except for the water band where there is a 1.9% deviation from these values.
We next look at the deviation in normBRF over time for each of our four RRV sites.
Table 1 gives the r
0,k,b coefficients for a typical collect at each of the four test sites—the campaign date was chosen as that representing an average profile over several different field campaign dates. Here, the normBRF values at the GOSAT angles of 30 W and 20 E are reported. The agreement at 30 W is within 0.01 and at 20E within 0.02. This suggests that a fixed parameter set, such as that from 20180628/MDN, might represent the playa within the area covered by our four test sites. The largest percentage deviation from the average is reported in parentheses for a given site. For example, at MDN, there were nine full data datasets acquired between 2013 and 2019. Using the data from each day where the solar zenith angle is closest that of 28 June 2018 (23° zenith), the r
0, k, and b coefficients were computed. These were then used to calculate normBRF at 30 W and 20 E. The largest deviation, from the value at 28 June 2018, among these nine data sets was 2% at 30 W and 1.3% at 20 E. Assuming these deviations are due to surface changes, using the model derived from 28 June 2019 would be acceptable, allowing us to meet our VicCal uncertainty requirement.
Also included in
Table 1 is a retrieval over Frenchman Flat (36.8093° N, 115.9348° W, 940 m), a hard, small playa on the Nevada Test Site (NTS). This surface is seen to be brighter (as shown by the r
0 coefficient) and more Lambertian. It has a normBRF that is 4% lower than Railroad Valley at 30 W and 7% higher at 20 E, in both cases implying it is closer to Lambertian. As expected, these harder, flatter surfaces have less variation with angle at these high sun angles. At low sun angles, we see a specular term not seen at RRV.
In looking at normBRF retrievals, from the PARABOLA, we note that data from the 444 nm channel are suspect, due to a low SNR. Additionally, we see that the 650 nm channel is no longer operational, beginning in 2018.
4. University of Lethbridge Goniometer System (ULGS)
From 1–5 May 2018, a group of scientists gathered at RRV, in order to intercompare methods and measurements. In addition to the PARABOLA, the ULGS-2 was present for the campaign. The ULGS system consists of two Ocean Optics USB4000 spectrometers: one mounted to a goniometric arm and the second measuring downwelling light. The standard data collection mode for the ULGS-2 involves averaging the signal over the 400–1000 nm range into 10 nm spectral bands for analysis. An ASD FieldSpecPro additionally measures nadir reflectances from 350–2500 nm, using an 8° FOV at 1 m height above ground.
To process the data, the first bad samples are removed. For example, the goniometer arc creates a shadow in the solar principal plane and must be removed. The goniometer data are scaled such that they agree with the ASD data at nadir. A figure of the instrument, and a polar plot of the data are shown in
Figure 4.
The so-called “Golden Day” for this campaign was 3 May 2018. On this day, the skies cleared, in an otherwise cloudy campaign week. The aerosol optical depth was 0.07 at 500 nm, 20:00 UTC, as recorded by the Aerosol Robotic Network (AERONET) Cimel. This is slightly higher than the clearest summer days, were values are as low as 0.04, but not hazy enough to compromise the retrieval. Nineteen goniometric scans were made on this day, from 14:30–22:27 UTC (7:30–15:00 PDT). A comparison of the ULGS results with PARABOLA is shown in
Figure 5. The two instruments were separated by 0.9 km (0.5 mi). The figure shows that the ULGS and PARABOLA normBRF values are roughly comparable. For a relative azimuth of 80°, simulating GOSAT overpass conditions, the fractional difference between the two normBRF reports are 0.06 at 30 W and 0.005 at 20 E, at 580 nm. At wavelengths above 900 nm, the Ocean Optics USB4000 spectrometer suffers from a low signal-to-noise ratio (SNR), and thus the data are not reported.
7. MODIS
The MODIS instrument images from both a morning and an afternoon platform, Terra, and Aqua, respectively. With its swath width of 2330 km (1448 mi), it can view a given location at a large range of view angles. A BRDF model is retrieved for each single day by combining observations from the two platforms over a 16-day period, which yields a sampling over the viewing hemisphere. The kernel-based RossThick-LiSparse Reciprocal model is used to produce the coefficients f_iso, f_vol, f_geo, which relate to isotropic, volumetric scattering, and geometric-optical scattering kernels, respectively. These are reported in the land surface BRDF product, MCD43A1. The associated data quality product, MCD43A2, indicates whether the full, high quality BRDF inversion was performed for a given pixel, or whether a lower quality magnitude inversion was performed instead, due to an insufficient number and inadequate angular sampling of observations. Note that a very similar BRDF product is generated using data from the Visible Infrared Imaging Radiometer Suite (VIIRS) sensor for both the imaging bands (VNP43IA1) and the moderate resolution bands (VNP43MA1). This product relies on the single VIIRS instrument currently available aboard the SNPP platform, which has afternoon overpasses similar to Aqua. BRDF retrievals for both MCD43A1 and VNP43M/IA1 are reported over a 16-day sliding window, with the heavily weighted day of interest being the 9th day in the window. The data quality flag has a range of 0–4, with increasing uncertainty. A value of 0 indicates that a high-quality full retrieval was possible; 4 indicates a failed retrieval, with a fill value replacing the data product. Furthermore, extensive quality flags are also available on a per band basis. In attempting to use the standard MODIS product over RRV, it became clear that the retrieval algorithm had difficulties in using the surface reflectance values (MO/YD09) due to the bright playa surface. This resulted in a misclassification of the scene as cloudy or having an aerosol haze. Of the 32 overpass dates investigated, all associated with field campaigns where clear-sky conditions prevailed, the MCD43A1 product frequently failed to provide the BRDF coefficients. Results are shown in
Figure 12. Specifically, H14 reported fill values (a non-retrieval) for all but one overpass date; sites M03 and M20 had valid data for only 20% of the dates.
As an alternative to the standard product, the University of Massachusetts Boston team has produced a special product, relaxing the aerosol flag from the input surface reflectance observations (MO/YD09), thereby avoiding the misclassification, and providing valid data for all four sites. An example of this retrieval, as compared to PARABOLA, is shown in
Figure 13 and
Table 4.
8. Conclusions
Vicarious calibration using Railroad Valley has an uncertainty of 3% for nadir-viewing sensors, under ideal clear-sky conditions. The uncertainty grows for sensors that view the test site at off-nadir view angles. If a nadir-measured surface reflectance is used in the calibration, without correction for BRF with view angle, an error of up to 10% can be incurred for sensors that view up to 30° off-nadir. Data from eight years of field measurements using the PARABOLA instrument show that the BRF, normalized to its nadir value (normBRF), is stable across the playa and from one year to the next to with a few percent at the GOSAT view angles of 30° from the West and 20° from the East. The off-nadir correction term can also be obtained from the MISR Level 2 Surface product, where the normBRF agree with PARABOLA to within 1%. The excellent agreement between these two sensors may be partially attributed to the fact that they use the same empirical model to fit the measurements. MISR BRF data may be of interest to those using other desert sites, such as the Saharan desert, for cross-sensor comparisons. The MODIS surface BRF product is most likely to fail over the bright RRV playa. However, a special MODIS product, which is produced ignoring the aerosol QA flag, is found to agree with PARABOLA to within 4%. In comparing PARABOLA data to the ULGS-2 instrument, we note neither measure the hotspot directly, but both instruments showed similar results. This similarity is significant as the instruments are measuring in opposite modes: one at a fixed location scanning the surrounding area and the other moving on a goniometer frame looking at a fixed location. This provides further confirmation of the consistency of the RRV BRF. As PARABOLA analysis fits the data to a model that retrieves the hotspot, the missing data are provided. We postulate that the PARABOLA r0, b, and k coefficients reported here can be used to compute normBRF for an arbitrary sun and view geometry at RRV, and that these are good to within a few percent, provided the surface conditions are dry (no rain within the past week, and no snow melt). That is, the “typical” coefficient set is representative of the playa under dry-soil conditions, irrespective of location on the playa, but is likely to be invalid following rain or snow. Making use of the off-nadir correction term, the VicCal can be obtained for OCO and GOSAT sensors to within their uncertainty budget of 5%.

 ,
, 


