Article

GPS-PWV Based Improved Long-Term Rainfall Prediction Algorithm for Tropical Regions

1
School of Electrical and Electronic Engineering, Nanyang Technological University, 50 Nanyang Avenue, Singapore 639798, Singapore
2
National Metrology Centre, Agency for Science, Technology and Research (A*STAR), 1 Science Park Drive, Singapore 118221, Singapore
*
Author to whom correspondence should be addressed.
Remote Sens. 2019, 11(22), 2643; https://doi.org/10.3390/rs11222643
Submission received: 21 August 2019 / Revised: 6 November 2019 / Accepted: 7 November 2019 / Published: 12 November 2019
(This article belongs to the Special Issue Weather Forecasting and Modeling Using Satellite Data)

Abstract

:
Global positioning system (GPS) satellite delay is extensively used in deriving the precipitable water vapor (PWV) with high spatio–temporal resolution. One of the recent applications of GPS derived PWV values are to predict rainfall events. In the literature, there are rainfall prediction algorithms based on GPS-PWV values. Most of the algorithms are developed using data from temperate and sub-tropical regions. Mostly these algorithms use maximum PWV rate, maximum PWV variation and monthly PWV values as a criterion to predict the rain events. This paper examines these algorithms using data from the tropical stations and proposes the use of maximum PWV value for better prediction. When maximum PWV value and maximum rate of increment criteria are implemented on the data from the tropical stations, the false alarm ( F A ) rate is reduced by almost 17% as compared to the results from the literature. There is a significant reduction in F A rates while maintaining the true detection ( T D ) rates as high as that of the literature. A study done on the varying historical length of data and lead time values shows that almost 80% of the rainfall can be predicted with a false alarm of 26.4 % for a historical data length of 2 hours and a lead time of 45 min to 1 hour.

1. Introduction

Precipitable water vapor (PWV) is a measure of total moisture content in a vertical column of unit cross-section. PWV is strongly linked to hydrological cycle and dynamical processes and therefore is an important indicator of water vapor climatology and variability in the lower troposphere and related climate processes [1,2]. Radiosondes and microwave-radiometers are a few conventional technologies that can measure PWV. PWV measured by radiosondes have a poor temporal resolution with low spatial coverage. The microwave radiometers are expensive and not available everywhere. Both the radiosonde and microwave radiometer readings are affected by severe weather events like heavy rain and thunderstorms. The radiosonde balloons are generally not released during major weather phenomena like thunderstorms, hurricanes, and heavy rain. Therefore, radiosonde data might be limited for studying different severe weather phenomena [3]. Similarly, PWV observations from microwave radiometers are still of limited value in climate studies particularly in predicting and tracking heavy rainfall cases [3]. Microwave radiometers can provide reliable PWV readings only under no rainfall conditions [4]. They are not able to give accurate readings for all-weather conditions [5]. It might even require site or season-specific calibrations [6,7]. PWV values can also be measured using satellite-based instruments like moderate resolution imaging spectroradiometer (MODIS) and from sun photometer based stations like aerosol robotic network (AERONET). PWV values from these sources have been validated by comparing to PWV values from GPS [8,9]. However, the temporal resolution of satellite-based measurements is very low and the accuracy is only useful for cloud-free conditions [10]. With the rapid deployment of GPS CORS (Continuously Operating Reference Stations) stations, GPS signal delays are extensively being used in deriving the PWV values. GPS has an advantage over other instruments as it has higher spatio–temporal resolution and is also an all-weather instrument.
In general, for the initiation of a rainfall event, the moisture content of the atmosphere should be high enough such that it exceeds the saturation threshold value. The saturation threshold value depends on temperature. For lower temperatures, saturation values are smaller and for higher temperatures, the saturation values are higher. This is because hotter air can hold more water vapor. Therefore, more moisture content is needed in a warm environment for a rainfall event to initiate. This shows that the PWV values can be useful for rainfall prediction. Therefore, many researchers have studied the GPS-PWV values and its usefulness in monitoring a rainfall event. Singh et al. [11] reported that the weekly and monthly variations of total precipitable water vapor over the Arabian Sea and the Indian Ocean are well correlated with onset day of monsoon over the Indian sub-continent. Barindelli et al. [12] reported a peak in the PWV values in response to a heavy precipitation event, followed by a steep decrease (5–10 mm in about 1 h) in the observed PWV values as the rain clouds moved past the station using data from a temperate station (of Italy). Shi et al. [13] presented some severe rainfall cases and a series of moderate rainfall cases to indicate the feasibility of GPS-PWV values for rainfall monitoring using data from the sub-tropical stations (of China). Similarly, Yeh et al. [4] reported different values of GPS-PWV threshold under different rainfall strengths; no rain, light rain, moderate rain, and heavy rain conditions, using data from a sub-tropical station (Taiwan). Benevides et al. [14] proposed a simple algorithm to forecast rainfall within six hours after the steep increase in PWV values using data from a temperate station (of Lisbon). Following up, Yao et al. [15] introduced a new algorithm to improve the success rate of rainfall prediction reported by Benevides et al. [14], using data from the sub-tropical stations (of China). GPS-PWV values are also widely used in many remote sensing applications like the analysis of severe weather conditions [16] such as storms, thunderstorms [17], flash-floods [18], heavy rainfall events monitoring [13], rainfall forecasting [7,14,15,19,20], cloud microphysics and dynamics studies [21,22].
Most of the GPS-based rainfall prediction algorithms reported in the literature use data from the temperate and sub-tropical regions. As the weather conditions and rainfall patterns of the tropical region can be very different compared to the other regions, using the algorithms from temperate and sub-tropical regions for the tropical data might not give an optimum result. Therefore, in this paper, we study the behavior of GPS-PWV values and rain specific to the tropical region. We propose the use of some of the important parameters for rainfall prediction for the tropical region, which are found to be different than those of the temperate and sub-tropical regions. Moreover, we analyze the effect of different historical data lengths and lead time values on rainfall prediction results and propose an optimum time window.

2. Methodology

In this section, we review the methods to derive PWV values from GPS signals and we describe the rainfall prediction algorithms.

2.1. Derivation of GPS-PWV Values

GPS signal delays, generally referred to as the zenith total delay (ZTD), can be broadly classified into zenith wet delays (ZWD) and zenith dry delays (or hydrostatic delay) (ZHD). Out of these delays, ZHD contributes about 90% of the total zenith delay and is dependent on the surface pressure, temperature and refractive index of the troposphere [23]. In contrast, ZWD contributes only 10% of the total zenith delay and is a function of atmospheric water vapor profile and temperature.
There are different empirical models that can be used to derive the ZHD values. ZHD values are commonly derived using the Saastamonien equation, Vienna Mapping Function I (VMF1) model, or the static model. On the other hand, it is relatively difficult to calculate the ZWD values as there are no empirical models for it. In this paper, the ZWD values are processed using the GPS Inferred Positioning System Orbit Analysis Simulation Software (GIPSY-OASIS) package and its recommended scripts. The GIPSY processing was done using the default ZHD model of the software (static ZHD model) with an elevation cut off angle of 10 and the Niell mapping function.
Once the ZWD (δL w o ) values are estimated using the software, the PWV values are calculated using Equation (1), as follows:
PWV = P I · δ L w o ρ l ,
where ρ l is the density of liquid water (1000 kg / m 3 ). P I is a dimensionless factor determined by using Equation (2), which was derived using radiosonde data from 174 stations in our previous paper [24]:
P I = [ sgn ( L a ) · 1.7 · 10 5 | L a | h f a c 0.0001 ] · cos 2 π ( D o Y 28 ) 365.25 + 0.165 1.7 · 10 5 | L a | 1.65 + f ,
where L a is the latitude, D o Y is day-of-year, h f a c = 1.48 for stations from northern hemisphere and 1.25 for stations from southern hemisphere. f = 2.38 · 10 6 H , where H is the station height, which can be ignored for stations below than 1000 m. The Equation (2) was validated by comparing the PWV values obtained by using it, to the PWV values from databases namely; Global Geodetic Observing System (GGOS), International GNSS Service (IGS) and Very-Long-Baseline Interferometry (VLBI), which used weighted mean temperature ( T m ) and surface temperature ( T s ) dependent T m T s equations or T m values from the database itself. 2 years of data from a total of 384 GGOS stations, 24 IGS stations and 15 VLBI stations were used for the validation. The validation results reported in [24] showed that the differences between PWV values when calculated using Equation (2) and from different databases are in between ± 1 mm, which is accurate enough for different geodetic applications [25].

2.2. Rainfall Prediction Algorithms

In this section, we review two algorithms; developed using data from the temperate region [14] and developed using data from the sub-tropical region [15]. Both of these algorithms use the PWV data from a six-hour time period to predict the rain within the next six hours.

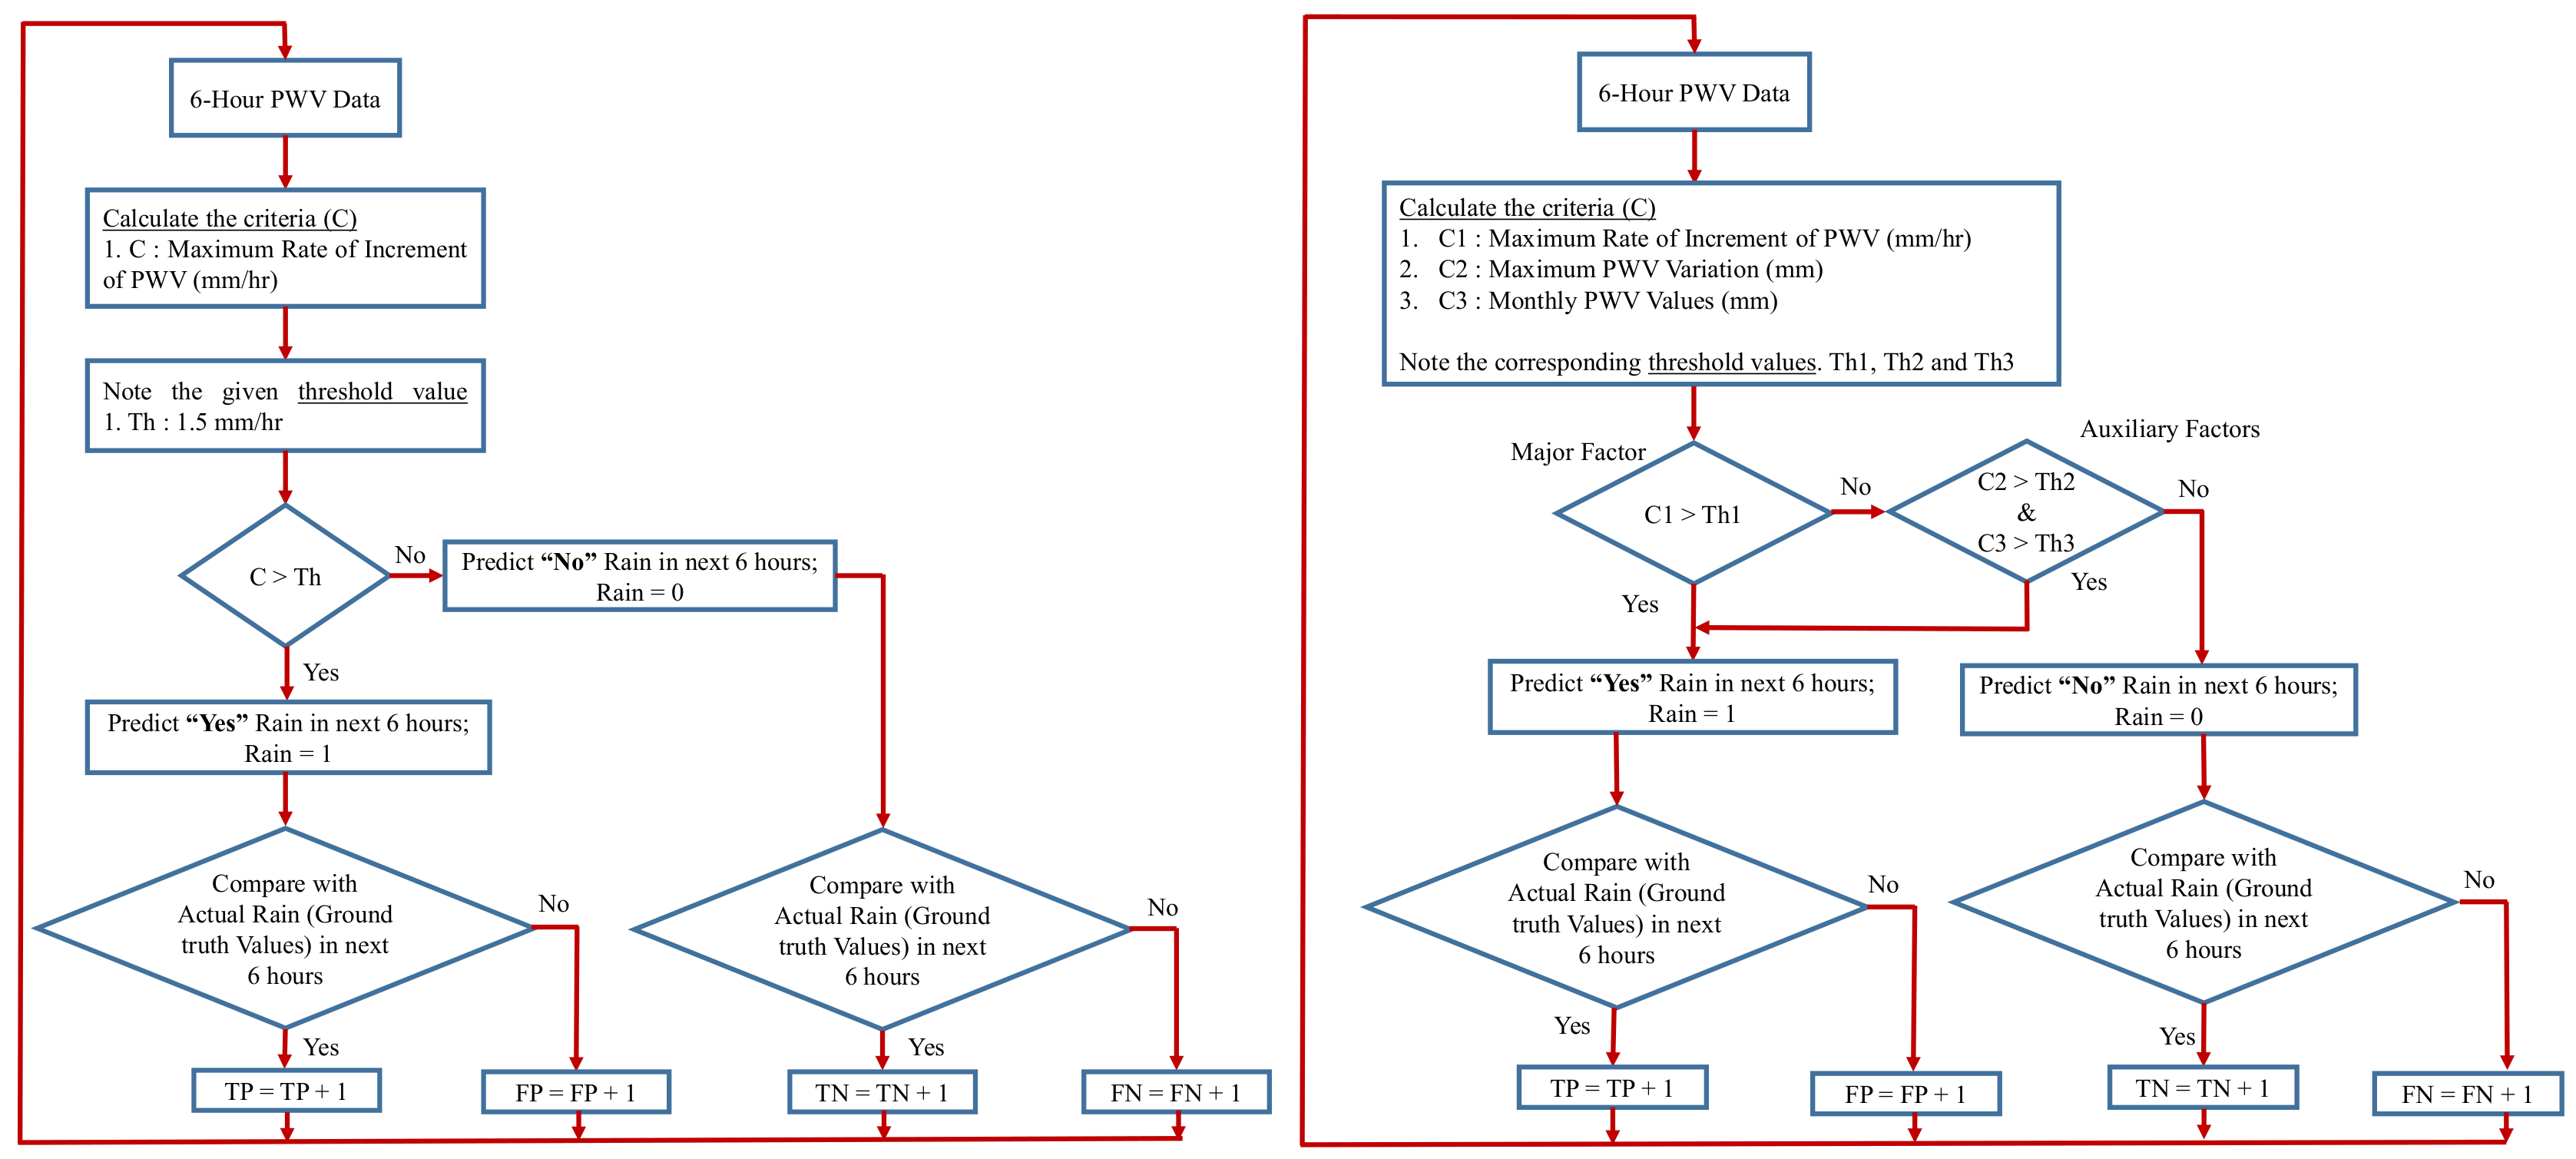
2.2.1. Rainfall Prediction Algorithm from the Temperate Region

Benevides et al. [14] proposed a rainfall prediction algorithm using data from a temperate region ( 38.40 N, 9.0 E) of Lisbon. The algorithm is developed using one year (2012) of hourly GPS and rain data. Figure 1a shows the flowchart of the algorithm. As shown by the flowchart, the algorithm first takes the hourly GPS-PWV values from a six-hour window. The maximum rate of increment of PWV values (mm/hr) are then calculated. The algorithm uses this increment rate as the evaluating criteria. Then the calculated rate is compared to a pre-defined threshold value. The threshold value (Th) proposed in [14] is 1.5 mm/hr based on a year’s data. This threshold value changes based on different locations and seasons. Now, if the calculated rate exceeds the threshold value, a rainfall is predicted in next six-hour time else no rain is predicted. The predicted results are then compared to the actual rainfall data and four different combinations of actual and predicted cases are reached; true positive ( T P ), false positive ( F P ), true negative ( T N ) and false negative ( F N ). Generally, the rainfall prediction results are expressed in terms of true detection ( T D ) and false alarm ( F A ) which can be calculated by using Equation (3). The T D values indicate the cases when rainfall events are correctly predicted and the F A values indicate the cases whereby rain is predicted but in actual no rainfall is recorded. We expect the T D values to be as high as possible (with 100% being the best) and F A values to be as low as possible (with 0% being the best). Benevides. et al reported the true detection and false alarm rates to be 75% and 60%, respectively, [14].
T D = T P T P + F N & F A = F P T N + F P

2.2.2. Three-Factor Rainfall Prediction Algorithm from the Sub-Tropical Region

Yao et al. [15] proposed a rainfall prediction algorithm using data from the sub-tropical region. This algorithm is proposed using one year data (2015) from five sub-tropical stations ( 28.2 N– 36.8 N) of China. Figure 1b shows the flowchart for this algorithm. It can be observed that the flowchart for the three-factor algorithm is similar to the general algorithm. The main differences between the two are the criteria used for the rainfall prediction and the respective threshold values. Three-factor method uses three criteria (a) threshold of maximum rate of increment of PWV values, Th1 ( 0.6 0.8 mm/hr), (b) threshold of maximum variation in PWV values, Th2 ( 1.8 –6 mm) and c) threshold of monthly PWV values, Th3 (23–59 mm) for the prediction.
Out of these three criteria, the threshold of the maximum rate of increment of PWV values is used as the major factor and the other two criteria are used as the auxiliary factors. It can be observed from the flowchart (Figure 1b) that firstly the major factor is used to predict the cases of rain or no rain and then the auxiliary factors are used to reduce the probability of omission of a rainfall event. Hence, the auxiliary factors help to improve the true detection rate only. After the rainfall predictions are made, the predicted values are compared to the ground truth and the true detection and false alarm rates are calculated using Equation (3), as discussed earlier. Yao et al. reported an improvement of 7% in true detection rate compared to the results of the Benevides et al. algorithm when the three-factor method was implemented. However, the false alarm rate was found to be 66% which is comparable to the results of the Benevides et al. algorithm.

3. Database Description

3.1. GPS-PWV Data

GPS-PWV data are processed for five GPS stations using Equations (1) and (2). Out of these, four GPS stations namely NTUS, SALU, RECF, and IISC are under International GNSS Service (IGS) and one station SNUS is under Singapore Satellite Positioning Reference Network (SiReNT). The receiver independent exchange (RINEX) files for the IGS stations can be downloaded from [26]. The SiReNT GPS station is under the Singapore Land Authority (SLA) [27]. The location details and data availability for these stations are mentioned in Table 1.
The GPS-PWV values calculated using GIPSY-OASIS software were compared against the IGS GPS products. An average correlation coefficient between the two sets of PWV values was found to be 0.99 with an absolute difference of only 1.15 mm. This observation validated the accuracy of the PWV values processed using GIPSY-OASIS software.

3.2. Weather Station Data

We use data from the weather stations that are collocated to the GPS stations. The details about the weather stations are given in Table 1. The weather station at NTUS records data at an interval of 1 minute and the rain data is recorded by the tipping-bucket rain gauge with a resolution of 0.2 mm/tip. The weather station data at SNUS are recorded at an interval of five minutes and the rain data are recorded by the tipping-bucket rain gauge with a resolution of 0.2 mm/tip. The weather station data from SNUS are accessible from the given link [28]. For stations from Brazil (SALU and RECF), the rainfall rate data are made available by the Cemaden’s observational network for natural disaster risk monitoring, Brazil [29]. The rain gauge has a resolution of 0.1 mm/tip and the data are informed in every 10-minute slot if the rain is registered else the data are recorded in an hour’s interval [29]. For the IISC station in India, the rainfall data was purchased from the National Data Center, Indian Meteorological Department (NDC-IMD). Hourly rainfall data is made available from NDC-IMD.
For this paper, we processed the PWV values for five GPS stations from the tropical region. The main limitation of the number of stations chosen is the availability of the rainfall data. The GPS-PWV values can be calculated for a large number of GPS stations using GIPSY-OASIS. However, not every GPS station has the rainfall data. Not every station makes it easily available. As of now, these five stations are the best we could find in the tropical region, which has the rainfall data and good GPS data availability as well.

4. Implementation of Existing Algorithms using Tropical Data

In this section, we implement the existing algorithms using data from the tropical region. We also present a time-series analysis of the GPS-PWV and rainfall data to analyze the importance of different criteria.

4.1. Time Series Analysis

Figure 2 shows the time series of PWV and rainfall data for a whole year and also for a few days in the zoomed-in plots. The information on stations and years of data used is mentioned in the figure caption. The time-series of PWV and rainfall data for a whole year shows some interesting seasonal behaviors. For NTUS station, which is the closest to the equator, the PWV values are relatively always high. It can be seen that this station experiences rain throughout the year and there are not many inter-seasonal PWV variations. For SALU station, which is a little farther from the equator, the PWV values show variations according to rainy seasons. There are very few rain events for D O Y 240–350, therefore the PWV values are also relatively lower. Similarly, for IISC station which is the farthest from the equator, variations in PWV values according to the rainy seasons can be clearly observed. The absolute PWV values for the IISC station are relatively lower than the others as this station is at a higher altitude compared to the rest.
The zoomed-in plots for the respective stations show the trend of PWV values with rainfall rates for fewer days. The plots show that generally the PWV values have a rising trend before the start of a rainfall event. Therefore, as discussed in Section 2.2, the existing rainfall algorithms [14,15] use the increment rate of PWV as one of the factors to predict rain. Similarly, for these tropical stations, the PWV values seem to increase beyond a threshold PWV value before it rains. Therefore, an absolute PWV value threshold can be a factor for rainfall prediction. This is also clearly seen in whole year time series plots of stations like SALU and IISC, whereby a fixed PWV threshold value can clearly differentiate rainy and non-rainy seasons. In the three-factor algorithm [15], PWV variation is also used as one of the factors for rainfall prediction. From Figure 2, we observe that the variations in PWV values are prominent for stations located at higher latitudes. For most of the tropical stations, the PWV values do not show significant variation in a given time frame (six hours) for rainfall prediction. Therefore, PWV variation might not be the best factor for rainfall prediction in the tropical region. In the following these different criteria will be implemented and analyzed for the tropical data.

4.2. Results for Maximum Rate of Increment of PWV Values (mm/hr)

This is the common threshold criterion that is used in both the algorithms from temperate and sub-tropical regions [14,15]. Table 2 reports the results after applying the threshold of maximum rate of increment of PWV for the tropical data. Table 2 also shows results for temperate and sub-tropical stations. For both temperate and sub-tropical regions, the results were obtained for hourly PWV and rain data. Therefore, for a fair comparison, the five-minute PWV data from the tropical stations are also sampled in an hourly format by taking the PWV data at the end of each hour. The rainfall values were also integrated hourly.
A trend in threshold values can be observed from Table 2. A similar range of T D and F A results can be achieved for the data from the tropical region and sub-tropical region at a lower threshold values of PWV rate. For the temperate station, the results were obtained when using a threshold value of 1.5 mm/hr where as for the tropical and sub-tropical stations, the threshold values are around 0.3 0.4 mm/hr and 0.6 0.8 mm/hr, respectively.
This is mainly because the daily variations of the PWV values are highest for the temperate stations. For the temperate and sub-tropical stations, a clear change in PWV values can be observed within certain hours before rain. It was observed that the daily variation in PWV values can even be higher than 20 mm for the temperate stations [14]. Whereas for the tropical stations, the PWV values are generally very high and the values change slightly, only within a few hours before the rain. This can also be observed from the time series plot of Figure 2. On average, the daily variation is found to be less than 10 mm. Therefore, given the same time frame of six hours, the threshold of maximum variation is highest in the temperate and lowest in the tropical region.

4.3. Results for the Three-Factor Method

As proposed by the three-factor algorithm [15], the maximum rate of increment of PWV is taken as the major factor and maximum PWV variation and monthly averaged PWV values are taken as the auxiliary factors. The three-factor method is then applied to the data from the tropical stations. The results are reported in Table 3. From these results, it can be seen that the use of the three-factor method improves the true detection rate for the tropical stations but the improvement is less compared to the sub-tropical stations. As can be seen from the table, for the sub-tropical stations, the maximum improvement is around 8.5 % and on average the T D rates improve by 5.7 %. Whereas for the tropical stations, the maximum improvement is around 2.9 % and in average the improvement is less than 2%. Therefore, for the sub-tropical stations use of both the maximum variation and monthly averaged PWV values complements each other and improves the true detection rates. But for the tropical stations, with hourly sampled PWV values, the maximum variation does not contribute much in improving the T D rates. Hence when using both the maximum variation and monthly PWV values the improvement in the T D rate is not as high as for the sub-tropical stations.

5. Proposal of an Improved Long-Term Rainfall Prediction Algorithm for the Tropical Region

When the proposed parameters from the three-factor method were implemented individually on the data from the tropical region, we found that the factors like maximum rate of increment and monthly averaged PWV values ensure good detection rate with lower false alarms compared to the maximum PWV variation. Here, it should be noted that the sampling of the PWV values is done at an hour’s interval. This might result in the loss of important information w.r.t rainfall events. Especially for the tropical region as the PWV values show important fluctuations near the start of a rainfall event. Therefore, in this section, we use the GPS-PWV values sampled at a five-minute interval and analyze the T D and F A rates.

5.1. Determination of Optimum Threshold Criteria for the Tropical Region

In this section, the T D and F A rates are evaluated for the six-hour rainfall prediction using GPS-PWV data with a temporal resolution of five minutes for the tropical region. Figure 3 shows the T D and F A rates when the individual parameters are used i.e., only one parameter is used at a time. The first column of Figure 3 shows the results for maximum PWV rate criteria, the second column shows the results for maximum PWV variation criteria and the last column shows the results for maximum PWV value in a six-hour period for GPS stations NTUS, SNUS, SALU, RECF, and IISC, respectively, in a row. Note that here we use the maximum PWV values of the given time frame instead of the monthly averaged PWV values.
Maximum rate of increment of PWV values (mm/hr): previously, when hourly data was used, the maximum rate increment of PWV was at around 0.3 mm/hr (ref. Table 2) for tropical stations. Now when the 5 min data is used, similar results are obtained at higher threshold values of around 0.5 0.6 mm/hr.
Maximum variation of PWV values (mm): Figure 3 shows the plot when maximum variation of PWV values are used. Here it can be noted that when 5 minute PWV values are used, the T D rates can go beyond 90% at a PWV variation threshold of greater than 0. When hourly-sampled data are used, the T D rates are lower. Since for the tropical region, significant variations in PWV values lie closer to the start of the rain event [19], the hourly sampling of the PWV data can miss the significant PWV variations. Whereas for the sub-tropical region the PWV increment is observed from a few hours to tens of hours before a rainfall event. Therefore hourly data is still sufficient to capture the significant PWV variations in the sub-tropical region. Moreover, rainfall events that are observed in the tropical region are mostly convective, which have higher rainfall rate and smaller duration. The convective rain sometimes can last for a duration of less than 30 min [30]. In such cases, the hourly samples can even miss a whole rainfall event in the tropical region.
Maximum PWV values (mm): the absolute PWV threshold values can be significant in predicting a rainfall event in the tropical region. It has also been discussed that the PWV values increase within a few hours before the start of a rain event [19]. Therefore, in this section, instead of using a monthly averaged PWV threshold value, a maximum PWV value of the given six-hour period is used in predicting the rainfall within the next six hours. The T D and F A rates plotted in Figure 3 for maximum PWV value shows a very good separation between the true detection and the false alarm rates for the different tropical stations. Table 4 lists the T D and F A rates for the tropical stations at a particular maximum PWV threshold value. The values in Table 4 are chosen such that the T D rates are as high as possible (higher than 80%) with a good difference between T D and F A rates.
Here, a clear trend can be observed in the maximum PWV threshold values. The PWV threshold values of the respective GPS stations show a variation based on its location within the tropical region. It can be seen that the stations; NTUS and SNUS from Singapore have the highest threshold values amongst all. As these stations are located on a small tropical island (Singapore), the PWV values are relatively higher. The station SALU from Brazil has higher PWV values compared to the station RECF from Brazil, as SALU is closer to the coast. The station IISC from India has the lowest PWV values as it is located in the main-land area and is also from a higher altitude (see Table 1 for reference).
These results outperform the results that were reported earlier (ref. Table 3). These results are also better compared to the results when the threshold for maximum rate or maximum variation is used individually. Therefore, these results suggest that the threshold of maximum PWV value contributes the most for rainfall prediction in the tropical region unlike the temperate and sub-tropical regions where the threshold of maximum rate of increment of PWV is the main factor.

5.2. Rainfall Detection Criteria for Tropical Region

For the tropical region, we have analyzed that the threshold of maximum PWV values is the most contributing factor for rainfall prediction. The threshold of maximum rate of increment of PWV and the threshold of maximum PWV variation show almost similar characteristics. Therefore, for the tropical region, we use the threshold of maximum PWV values and the threshold of maximum rate of increment of PWV values for rainfall prediction. Both the criteria are used at the same time with no segregation as main and auxiliary factors. From Figure 3 it can be observed that the maximum PWV threshold criteria and maximum rate of increment criteria have different significance w.r.t T D and F A rates. The maximum rate of increment criteria is good to ensure a high T D rate whilst maximum PWV value criteria can ensure a high T D rate with a good difference between T D and F A rates. Therefore, in the following, the threshold values for each criteria are chosen accordingly using the plots in Figure 3.
The evaluation results are reported in Table 5. The T D and F A rates for three-factor method and the proposed method are tabulated in Table 5. From the table, it can be clearly observed that for the proposed method the F A rates decrease significantly with very less effect on the T D rates. There is even an enhancement in the T D rates for a few tropical stations. The decrement in T D rates is lower compared to the F A rates. On average, for all tropical stations, the F A rates decrease by 16.9 % with a negligible effect on T D rates. Therefore, for the tropical region, the threshold of maximum PWV values and the threshold of a maximum rate of increment in PWV values are the optimum criteria and better results are obtained for GPS-PWV values with higher temporal resolution (five minutes).

6. Analysis of Effects of Different Lead Time and Historical Time Values on Rainfall Prediction

The rainfall prediction results discussed till now are for prediction within the given six hours time. In such a case, we are not sure whether we are predicting a rain event that will occur after five minutes or after an hour or after four hours within the given six hours time frame. Therefore in this section, statistical results are presented to show how far ahead of time a rainfall event can be predicted by using the GPS-PWV values. It is interesting to present and discuss these results as it helps to explore the usefulness of GPS-PWV values in predicting a rainfall event with long lead-time values. Such ideas have seldom been discussed in the literature.
Firstly, a rainfall event is defined. Any number of rainfall events that occur within a duration of six hours or less is considered as a single rain event. Therefore, a minimum separation time between two rain events is six hours. For e.g., the total number of rainfall events for NTUS station with this criteria are 154, 133, 155, 180, 156 and 154 for years 2010–2015, respectively.

6.1. Varying Historical Length of Data

The time frame of the PWV data considered to predict a single rainfall event is varied. Previously, a constant time frame of six hours was used, now the time frame varies from 10 minutes to up to six hours. For each time frame, the maximum rate of increment of PWV value (mm/hr) and the maximum PWV value (mm) are recorded. These values are then compared to the respective threshold values derived in the earlier section (ref. Table 5) and rainfall is predicted if the conditions are satisfied. The predicted rainfall events are then compared to the ground truth and a true detection rate is calculated. The T D rates are then plotted against the length of data considered as shown in Figure 4a. The minimum length that can be considered is 10 minutes as the resolution of GPS-PWV is five minutes and to calculate the increment rate at least two data points are needed.
In Figure 4a, the first point corresponds to a time frame of 10 minutes, which includes two GPS-PWV data points before the start of the rain event, the second point corresponds to a time frame of 15 minutes, which includes three GPS-PWV data points before the start of the rain event. Similarly, the time frame corresponding to one hour indicates the use of twelve GPS-PWV data points before the start of the rain event. It can be observed from the figure, that the T D rate corresponding to the 10 minutes length of data (first point) is less than 40%. The T D rate gradually increases as the length increases from 10 minutes to 1.5 to 2 hours after which, the T D rates saturate. This analysis shows that a time frame of 2 hours is an optimum value and adding in more PWV values does not contribute much to improve the detection rate.

6.2. Varying Lead Time Length

Lead time is defined as the interval before the start of the rainfall event whose corresponding PWV values are not used in the analysis. A lead time value of 10 minutes indicates that the PWV values corresponding to the 10 minutes interval before the start of the rainfall event are not used for the analysis; the PWV values before this lead time value are used for the prediction. For each lead time value, the length of the data used for prediction is held fixed at 2 hours. The T D rates are then calculated based on the two criteria of maximum rate of increment and maximum PWV values. The T D rates are plotted in Figure 4b. From Figure 4b, it can be clearly observed that on average over different years, more than 80% of the total rainfall events can be successfully predicted with lead time value of up to 45 minutes to one hour. As the lead time values increase beyond an hour, the true detection rates decrease. For NTUS station, on average (2010–2015) 26.4 % of F A rate is experienced when an optimum historical data length of two hours and a lead time of one hour are used.
Similarly, the experiment was done on the two-year data from the SALU station. For SALU station, the total number of rainfall events with six hours as the separation time is 150 and 122 for years 2016 and 2017, respectively. The T D rates for different length of data and different lead time values are shown in Figure 5a,b, respectively. Similar conclusions can be drawn for SALU station as well. The optimum length for historical data is around two hours and more than 85% of the total rainfall events can be successfully predicted with lead time value of up to 45 minutes to 1 hour. For SALU station, on average (2016–2017) 14% of F A rate is experienced when an optimum historical data length of 2 hours and a lead time of 1 hour are used.

7. Conclusions

In this paper, we proposed a rainfall prediction algorithm for the tropical region. In the temperate and sub-tropical regions, the maximum rate of increment of PWV values played an important role in rainfall prediction [14,15]. Whereas in this paper, it was concluded that for the tropical region, the threshold of maximum PWV values plays the most important role in the prediction. Moreover, the analysis of the results also show that the hourly samples of data are not good for the tropical region as most of the convective rain in the tropical region has a lesser duration (less than 30 min). Five-minute GPS-PWV values are suggested to be used for the tropical region. Overall, the use of the proposed method results in the reduction of the false alarm rates by almost 17% while maintaining the same true detection rates as compared to the results when the existing algorithms are used.
One of the contributions of this paper is also to analyze the effects of varying length of historical data and varying lead time values. Such observations have not been reported in the existing literature. Initial findings show that almost 80% of the total rainfall events can be predicted with a false alarm rate of 26.4 % for a historical data length of two hours and lead time of 45 min to 1 hour. As a future work, we will enrich our database with data from the temperate and sub-tropical regions and further examine the length of historical data and lead time in order to propose a global model for rainfall prediction.

Author Contributions

Conceptualization, S.M. and Y.H.L.; methodology, S.M. and Y.H.L.; software, S.M.; validation, S.M., Y.H.L. and Y.S.M.; formal analysis, S.M., Y.H.L. and Y.S.M.; investigation, S.M. and Y.H.L.; resources, S.M. and Y.H.L.; data curation, S.M.; writing—original draft preparation, S.M.; writing—review and editing, S.M., Y.H.L. and Y.S.M.; visualization, S.M.; supervision, Y.H.L. and Y.S.M.; project administration, Y.H.L.

Conflicts of Interest

The authors declare no conflict of interest.

References

  1. Jin, S.G.; Park, J.; Cho, J.; Park, P.H. Seasonal variability of GPS-derived Zenith Tropospheric Delay (1994-2006) and climate implications. J. Geophys. Res. 2007, 112. [Google Scholar] [CrossRef]
  2. Wang, J.; Zhang, L.; Dai, A.; Hove, T.V.; Baelen, J. A near-global, 2-hourly data set of atmospheric Precipitable water from ground-based GPS measurements. J. Geophys. Res. 2007, 112. [Google Scholar] [CrossRef]
  3. Wang, Z.; Zhou, X.; Liu, Y.; Zhou, D.; Zhang, H.; Sun, W. Precipitable water vapor characterization in the coastal regions of China based on ground-based GPS. Adv. Space Res. 2017, 60, 2368–2378. [Google Scholar] [CrossRef]
  4. Yeh, T.; Shih, H.; Wang, C.; Choy, S.; Chen, C.; Hong, J. Determining the precipitable water vapor thresholds under different rainfall strengths in Taiwan. Adv. Space Res. 2018, 61, 941–950. [Google Scholar] [CrossRef]
  5. Hu, P.; Huang, G.; Zhang, Q.; Wang, X.; Mao, M. Algorithm and Performance of Precipitable Water Vapor Retrieval Using Multiple GNSS Precise Point Positioning Technology. China Satell. Navig. Conf. (CSNC) 2018, 497, 139–151. [Google Scholar]
  6. Ansari, K.; Corumluoglu, O.; Panda, S.K.; Verma, P. Spatiotemporal variability of water vapor over Turkey from GNSS observations during 2009-2017 and predictability of ERA-Interim and ARMA model. J. Glob. Position. Syst. 2018, 16, 8. [Google Scholar] [CrossRef]
  7. Zhao, Q.; Yao, Y.; Yao, W. GPS-based PWV for precipitation forecasting and its application to a typhoon event. J. Atmospheric Sol.-Terr. Phys. 2018, 167, 124–133. [Google Scholar] [CrossRef]
  8. Prasad, A.K.; Singh, R.P. Validation of MODIS Terra, AIRS, NCEP/DOE AMIP-II Reanalysis-2, and AERONET Sun photometer derived integrated precipitable water vapor using ground-based GPS receivers over India. J. Geophy. Res. Atmos. 2009, 114. [Google Scholar] [CrossRef]
  9. Kumar, S.; Singh, A.K.; Prasad, A.K.; Singh, R.P. Variability of GPS derived water vapor and comparison with MODIS data over the Indo-Gangetic plains. Phy. Chem. Earth, Parts A/B/C 2013, 55, 11–18. [Google Scholar] [CrossRef]
  10. Gui, K.; Che, H.; Chen, Q.; Zeng, Z.; Liu, H.; Wang, Y.; Zhang, X. Evaluation of radiosonde, MODIS-NIR-Clear, and AERONET precipitable water vapor using IGS ground-based GPS measurements over China. Atmos. Res. 2017, 197, 461–473. [Google Scholar] [CrossRef]
  11. Singh, R.P.; Dey, S.; Sahoo, A.K.; Kafatos, M. Retrieval of water vapor using SSM/I and its relation with the onset of monsoon. Ann. Geophys. 2004, 22, 3079–3083. [Google Scholar] [CrossRef]
  12. Barindelli, S.; Realini, E.; Venuti, G.; Fermi, A.; Gatti, A. Detection of water vapor time variations associated with heavy rain in northern Italy by geodetic and low-cost GNSS receivers. Earth Planets Space 2018, 70. [Google Scholar] [CrossRef]
  13. Shi, J.; Xu, C.; Guo, J.; Gao, Y. Real-Time GPS precise point positioning-based precipitable water vapor estimation for rainfall monitoring and forecasting. IEEE Trans. Geosci. Remote Sens. 2015, 53, 3452–3459. [Google Scholar]
  14. Benevides, P.; Catalao, J.; Miranda, P.M.A. On the inclusion of GPS Precipitable water vapour in the nowcasting of rainfall. Nat. Hazards Easrth Syst. Sci. 2015, 15, 2605–2616. [Google Scholar] [CrossRef]
  15. Yao, Y.; Shan, L.; Zhao, Q. Establishing a method of short term rainfall forecasting based on GNSS-derived PWV and its application. Sci. Rep. 2017, 7, 3452–3459. [Google Scholar] [CrossRef] [PubMed]
  16. Manning, T.; Zhang, K.; Rohm, W.; Choy, S.; Hurter, F. Detecting Severe Weather using GPS Tomography: An Australian Case Study. J. Glob. Pos. Sys. 2012, 11, 58–70. [Google Scholar] [CrossRef]
  17. Suparta, W.; Zulkeple, S.K.; Putro, W.S. Estimation of Thunderstorm Activity in Tawau, Sabah Using GPS Data. Adv. Sci. Lett. 2017, 23, 1370–1373. [Google Scholar] [CrossRef]
  18. Zhang, K.; Manning, T.; Wu, S.; Rohm, W.; Silcock, D.; Choy, S. Capturing the signature of severe weather events in Australia using GPS measurements. IEEE Trans. Geosci. Remote Sens. 2015, 8, 1839–1847. [Google Scholar] [CrossRef]
  19. Manandhar, S.; Lee, Y.H.; Meng, Y.S.; Yuan, F.; Ong, J.T. GPS Derived PWV for Rainfall Nowcasting in Tropical Region. IEEE Trans. Geosci. Remote Sens. 2018, 56, 4835–4844. [Google Scholar] [CrossRef]
  20. Manandhar, S.; Dev, S.; Lee, Y.H.; Meng, Y.S.; Winkler, S. A Data-Driven Approach For Accurate Rainfall Prediction. IEEE Trans. Geosci. Remote Sens. 2019, 57, 9323–9331. [Google Scholar] [CrossRef]
  21. Kumar, L.S.; Manandhar, S.; Lee, Y.H.; Meng, Y.S. GPS derived PWV for monitoring cloud evolution. In Proceedings of the 2017 Progress in Electromagnetics Research Symposium—Fall (PIERS—FALL), Singapore, 19–22 November 2017; pp. 1421–1423. [Google Scholar] [CrossRef]
  22. Wang, Z.; French, J.; Vali, G.; Wechsler, P.; Haimov, S.; Rodi, A.; Deng, M.; Leon, D.; Snider, J.; Peng, L.; et al. Single aircraft integration of remote sensing and in situ sampling for the study of cloud microphysics and dynamics. Bull. Amer. Meteor. Soc. 2012, 93, 653–668. [Google Scholar] [CrossRef]
  23. Elgered, G.; Davis, J.L.; Herring, T.A.; Shapiro, I.I. Geodesy by radio interferometry: water vapor radiometry for estimation of the wet delay. J. Geophys. Res. 1991, 96, 6541–6555. [Google Scholar] [CrossRef]
  24. Manandhar, S.; Lee, Y.H.; Meng, Y.S.; Ong, J.T. A Simplified Model for the Retrieval of Precipitable Water Vapor from GPS Signal. IEEE Trans. Geosci. Remote Sens. 2017, 55, 6245–6253. [Google Scholar] [CrossRef]
  25. Alshawaff, F.; Fuhrmann, T.; Knopfler, A.; Luo, X.; Mayer, M.; Hinz, S.; Heck, B. Accurate estimation of atmospheric water vapor using GNSS observations and surface meteorological data. IEEE Trans. Geosci. Remote Sens. 2015, 53, 3764–3771. [Google Scholar] [CrossRef]
  26. Crustal Dynamics Data Information System: NASA’s Archive of Space Geodesy Data. Available online: ftp://cddis.gsfc.nasa.gov/pub/gps/data/ (accessed on 30 June 2018).
  27. SiReNT Station Network. Available online: https://sirent.inlis.gov.sg/ (accessed on 30 June 2018).
  28. National University of Singapore, Singapore. Geography Weather Station. Available online: https://inetapps.nus.edu.sg/fas/geog/ (accessed on 30 June 2018).
  29. Cemaden’s Observational Network for Natural Disaster Risk Monitoring. Available online: http://www.cemaden.gov.br/mapainterativo/ (accessed on 30 June 2018).
  30. Yeo, J.X.; Lee, Y.H.; Ong, J.T. Performance of site diversity investigated through Radar derived results. IEEE Trans. Antennas Prop. 2000, 59, 3890–3898. [Google Scholar] [CrossRef]
Figure 1. Flowchart of the rainfall prediction algorithm. (a) General algorithm with Th = 1.5 mm/hr. (b) Three-factor method with TH1 = 0.6 0.8 mm/hr, Th2 = 1.8 –6 mm, Th3 has 12 different values ranging from 23–59 mm (as it is the monthly averaged precipitable water vapor (PWV) threshold value).
Remotesensing 11 02643 g001
Figure 2. Time series of GPS-PWV values and rainfall for (a) NTUS station (b) SALU station and (c) IISC station for years 2015, 2017 and 2010, respectively. The smaller figures on the right show the zoomed in view of the highlighted portion (highlighted by the dashed box) for respective figures. The x-axis for all the figures are the day-of-year, left y-axis is the PWV values (mm) and right y-axis is the rainfall rate (mm/hr).
Remotesensing 11 02643 g002
Figure 3. T D and F A rates when using different criteria for the Tropical stations.
Remotesensing 11 02643 g003
Figure 4. T D rates for NTUS for (a) different historical length of data used (b) for different lead time values.
Remotesensing 11 02643 g004
Figure 5. T D rates for SLAU for (a) different historical length of data used (b) for different lead time values.
Remotesensing 11 02643 g005
Table 1. Database.
Table 1. Database.
CountryGPS Station IDlocationProviderStation Height (m)Years
SingaporeNTUS( 01.34 N, 103.67 E)IGS 79.0 2010–2015
SingaporeSNUS( 01.29 N, 103.77 E)SiReNT 63.0 2016
BrazilSALU( 02.59 S, 044.21 W)IGS 18.9 2016–2017
BrazilRECF( 08.05 S, 034.92 W)IGS 25.6 2017
IndiaIISC( 13.02 N, 077.57 E)IGS 843.0 2010
Table 2. True detection ( T D ) and false alarm ( F A ) rates when using threshold of maximum rate of increment of PWV values (mm/hr).
RegionStationYearMaximum PWV Rate
(mm/hr)
TD
(%)
FA
(%)
TropicalNTUS2010 0.3 78.4 63.2
2011 0.3 79.7 60.1
2012 0.3 77.4 61.0
2013 0.3 79.3 59.3
2014 0.3 82.7 62.1
2015 0.3 82.3 62.7
SNUS2016 0.3 74.3 66.5
SALU2016 0.4 76.1 64.4
2017 0.3 76.7 66.7
RECF2017 0.3 74.4 63.3
IISC2010 0.3 76.8 60.7
Sub-Tropical [15]LJSL2015 0.6 76.2 65.2
ZHOS2015 0.8 71.8 66.1
ZJPH2015 0.6 74.3 68.3
ZJXC2015 0.6 79.4 65.2
ZJYH2015 0.6 71.6 66.1
Temperate [14]Lisbon2012 1.5 75 66.22
Table 3. T D and F A rates when the three-factor algorithm is implemented for the tropical and sub-tropical stations.
RegionStationYearTD (%)FA (%)
Major Factor Only (mm/hr)Three-Factors
TropicalNTUS2010 78.4 80.5 63.2
2011 79.7 81.9 60.1
2012 77.4 80.3 61.0
2013 79.3 81.6 59.3
2014 80.7 82.9 62.1
2015 82.3 83.6 62.7
SNUS2016 74.3 76.0 66.5
SALU2016 76.1 77.9 64.4
2017 76.7 77.6 66.7
RECF2017 74.4 75.3 63.3
IISC2010 76.8 78.4 60.7
Sub-Tropical [15]LJSL2015 76.2 82.3 65.2
ZHOS2015 71.8 80.3 66.1
ZJPH2015 74.3 77.7 68.3
ZJXC2015 79.4 81.5 65.2
ZJYH2015 71.6 80.4 66.1
Table 4. T D and F A rates when threshold of maximum PWV values are used on data from the tropical stations.
StationYearMax PWV Value (mm)TD (%)FA (%)
NTUS2010–201555 87.6 60.2
SNUS201656 85.7 58.6
SALU2016–201750 83.8 46.2
RECF201740 84.1 58.8
IISC201039 89.1 39.5
Table 5. Comparison of T D and F A rates when the three-factor method and the proposed methods are implemented for the tropical stations.
StationYearThree-factor MethodProposed Method
TD (%)FA (%)Max PWV (mm)Max Rate (mm/hr)TD (%)FA (%)
NTUS2010 80.5 63.2 55 0.3 80.8 56.3
2011 81.9 60.1 55 0.3 79.4 46.9
2012 80.3 61.0 55 0.2 80.6 51.1
2013 81.6 59.3 55 0.3 79.3 52.0
2014 82.9 62.1 55 0.3 79.4 45.8
2015 83.6 62.7 55 0.3 80.2 43.5
SNUS2016 76.0 66.5 56 0.3 79.3 51.5
SALU2016 77.9 64.4 50 0.3 81.9 40.3
2017 77.6 66.7 50 0.3 85.6 37.4
RECF2017 75.3 63.3 40 0.3 73.2 48.5
IISC2010 78.4 60.7 39 0.2 70.8 31.0

