1. Introduction
Wheat (Triticum Aestivum L.) is the third-largest food crop in terms of production globally [
1], providing a large number of nutritional sources for those suffering from nutrient deficiency. China is one of the major wheat-producing areas. In 2017, the wheat planting area in China reached 24,510
kha ranking third in the world, and more than 98% of the total acreage is winter wheat [
2]. Therefore, it is of great significance for the government to obtain accurate information on the planting area, growth and yield of winter wheat for formulating agricultural policies, estimating crop yield and ensuring food security [
3]. The traditional method to acquire the planting area of winter wheat is mainly a manual sampling survey [
4], which is not only labor-intensive, time-consuming and expensive but also susceptible to subjective factors. Remote-sensing technology has been widely used in the field of crop identification and mapping [
5,
6,
7] due to its spatial coverage, temporal resolution, availability at near real-time and low cost.
The development of various satellites makes it possible to monitor cropping areas at fine spectral, temporal and spatial scales [
8]. Moderate-resolution imaging spectroradiometer (MODIS) can provide a large amount of observation data that are both valuable and obligatory for global vegetation monitoring. It is sufficient to map large scale cropping areas [
9,
10], however, it is challenged by mixed pixels when the medium-spatial-resolution satellite data were used for crop characterization in finer-scale land distribution, such as southern China [
11]. Recently, high-spatial-resolution satellites such as QuickBird and SPOT5 have become available and provide new opportunities for more accurate mapping of crops [
12,
13]. High-resolution data can provide more details of land tenure system, and improve accuracy of mapping [
14]. However, the cost of high-spatial-resolution data limits their general use. With the successful launch of the second Sentinel-2 satellite in March 2017, Sentinel-2 mission proposed by European Space Agency is generating unprecedented volumes of data at high spatial (up to 10 m), spectral (13 bands) and temporal resolutions (minimum five day), which makes it used widely in crop identification and mapping [
15,
16,
17].
Using remote-sensing data to monitor crop is mainly based on spectral and crop phenological difference, so the identification methods can be divided into spectral methods, such as remote-sensing-based classification [
13,
18], mixed pixel decomposition [
19], multi-source information integration [
7] and phenological method, such as time series analysis [
8,
20,
21,
22]. There are some other methods like remote-sensing sampling [
23], random forest and support vector machine [
24]. With the development of remote-sensing technology, more algorithms have been applied to crop identification. However, such study on winter wheat extraction is still limited in the areas which have difficulties and challenges such as [
11]: unfavorable weather conditions; frequent cloud cover; complex terrain surface; high degree of fragmentation of cultivated land; and significant difference in crop planting structure between regions. Existing studies on winter wheat extraction in the areas with such conditions still have some shortcomings: 1) the methods were simple and the accuracy was not high; 2) few have focused on the remote-sensing mapping of wheat in the areas due to the high degree of surface fragmentation; and 3) few have discussed the differences of extraction methods under different planting conditions.
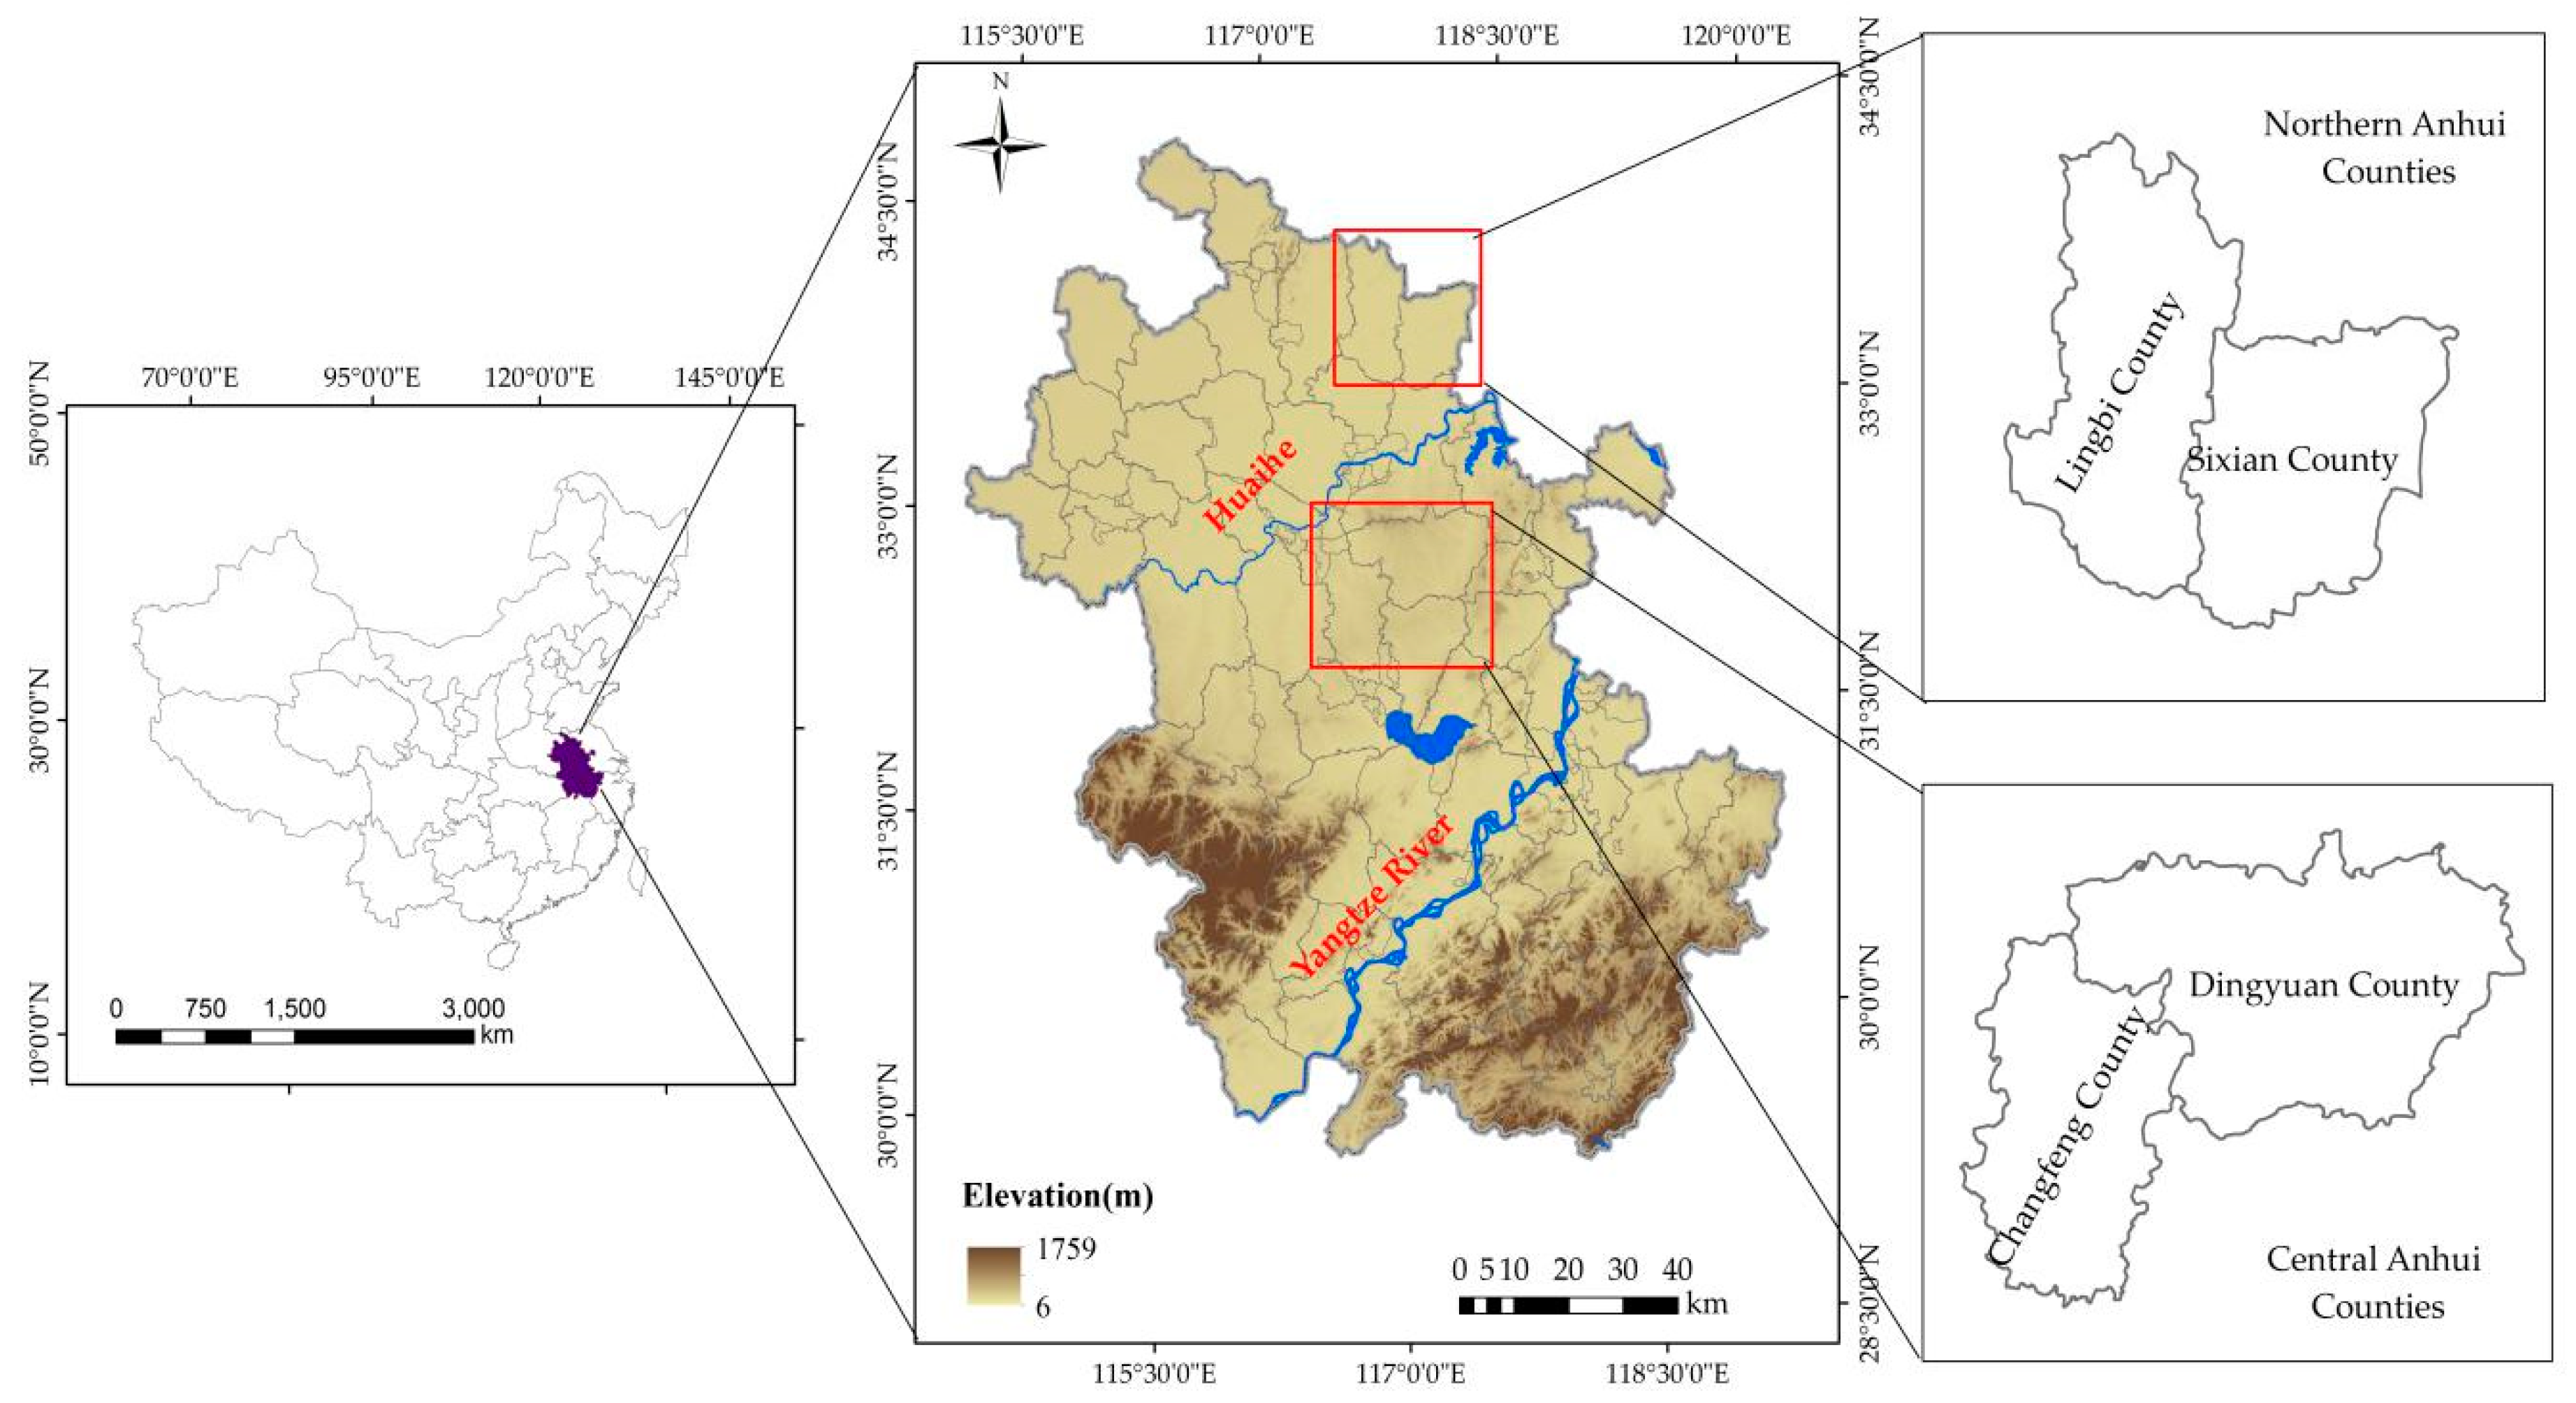
In 2017, the planting area of winter wheat in Anhui province reached 2822.2
kha, ranking the third in China after Henan and Shandong provinces [
2]. However, the application of remote-sensing technology in Anhui agricultural production is relatively insufficient compared with other provinces due to the difficulties mentioned above. In view of the important role of Anhui province in China’s wheat production and the problems in the remote-sensing extraction of winter wheat, it is urgent to explore better methods for winter wheat mapping using remote-sensing imagery.
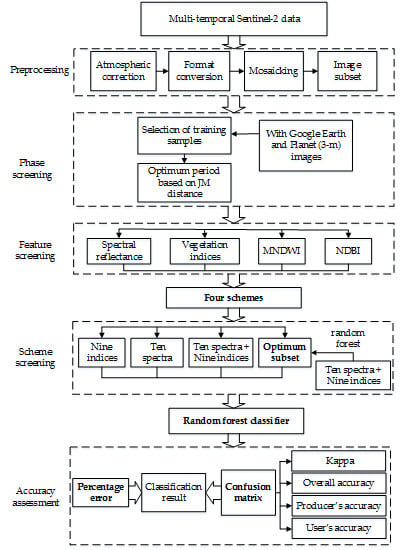
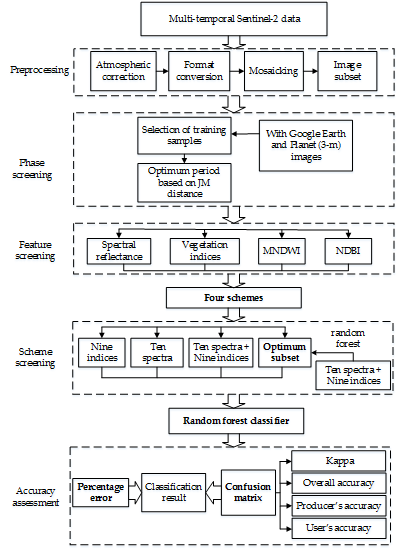
Therefore, the objective of the study was to explore the effect of different planting conditions (climate, scale, fragmentation) on the accuracy of winter wheat mapping using remote-sensing data. The specific goals were to (1) select the optimum phenological phase for extracting winter wheat from Sentinel-2 images based on key phenological periods; (2) acquire the optimum remote-sensing screening features of winter wheat the data acquired in the optimum phenological period; (3) get the optimum scheme for winter wheat mapping in the areas of interest; and (4) identify the uncertainties and future needs in winter wheat mapping.
5. Discussion
A range of winter wheat mapping approaches has been developed in previous studies based on remote-sensing imagery [
4,
7,
8,
10]. However, many of them have left problems in their research that need to be solved in the future. For example, Zhang et al. paid attention to the influence of features generated from different period images on extraction results, and the lack of discussion on the difference of periods, which was the focus of their later work [
56]. Some researchers employed multi-spectral data, vegetation indices and phenological metrics to enrich the information available for crop mapping, which may increase computation time with little improvement in accuracy [
57,
58]. The method we demonstrated can solve the problems and achieve the goal of giving consideration to both periods and features and also can be applied to the problems associated with large volumes of data.
5.1. Winter Wheat Mapping in Heterogeneous Planting Conditions
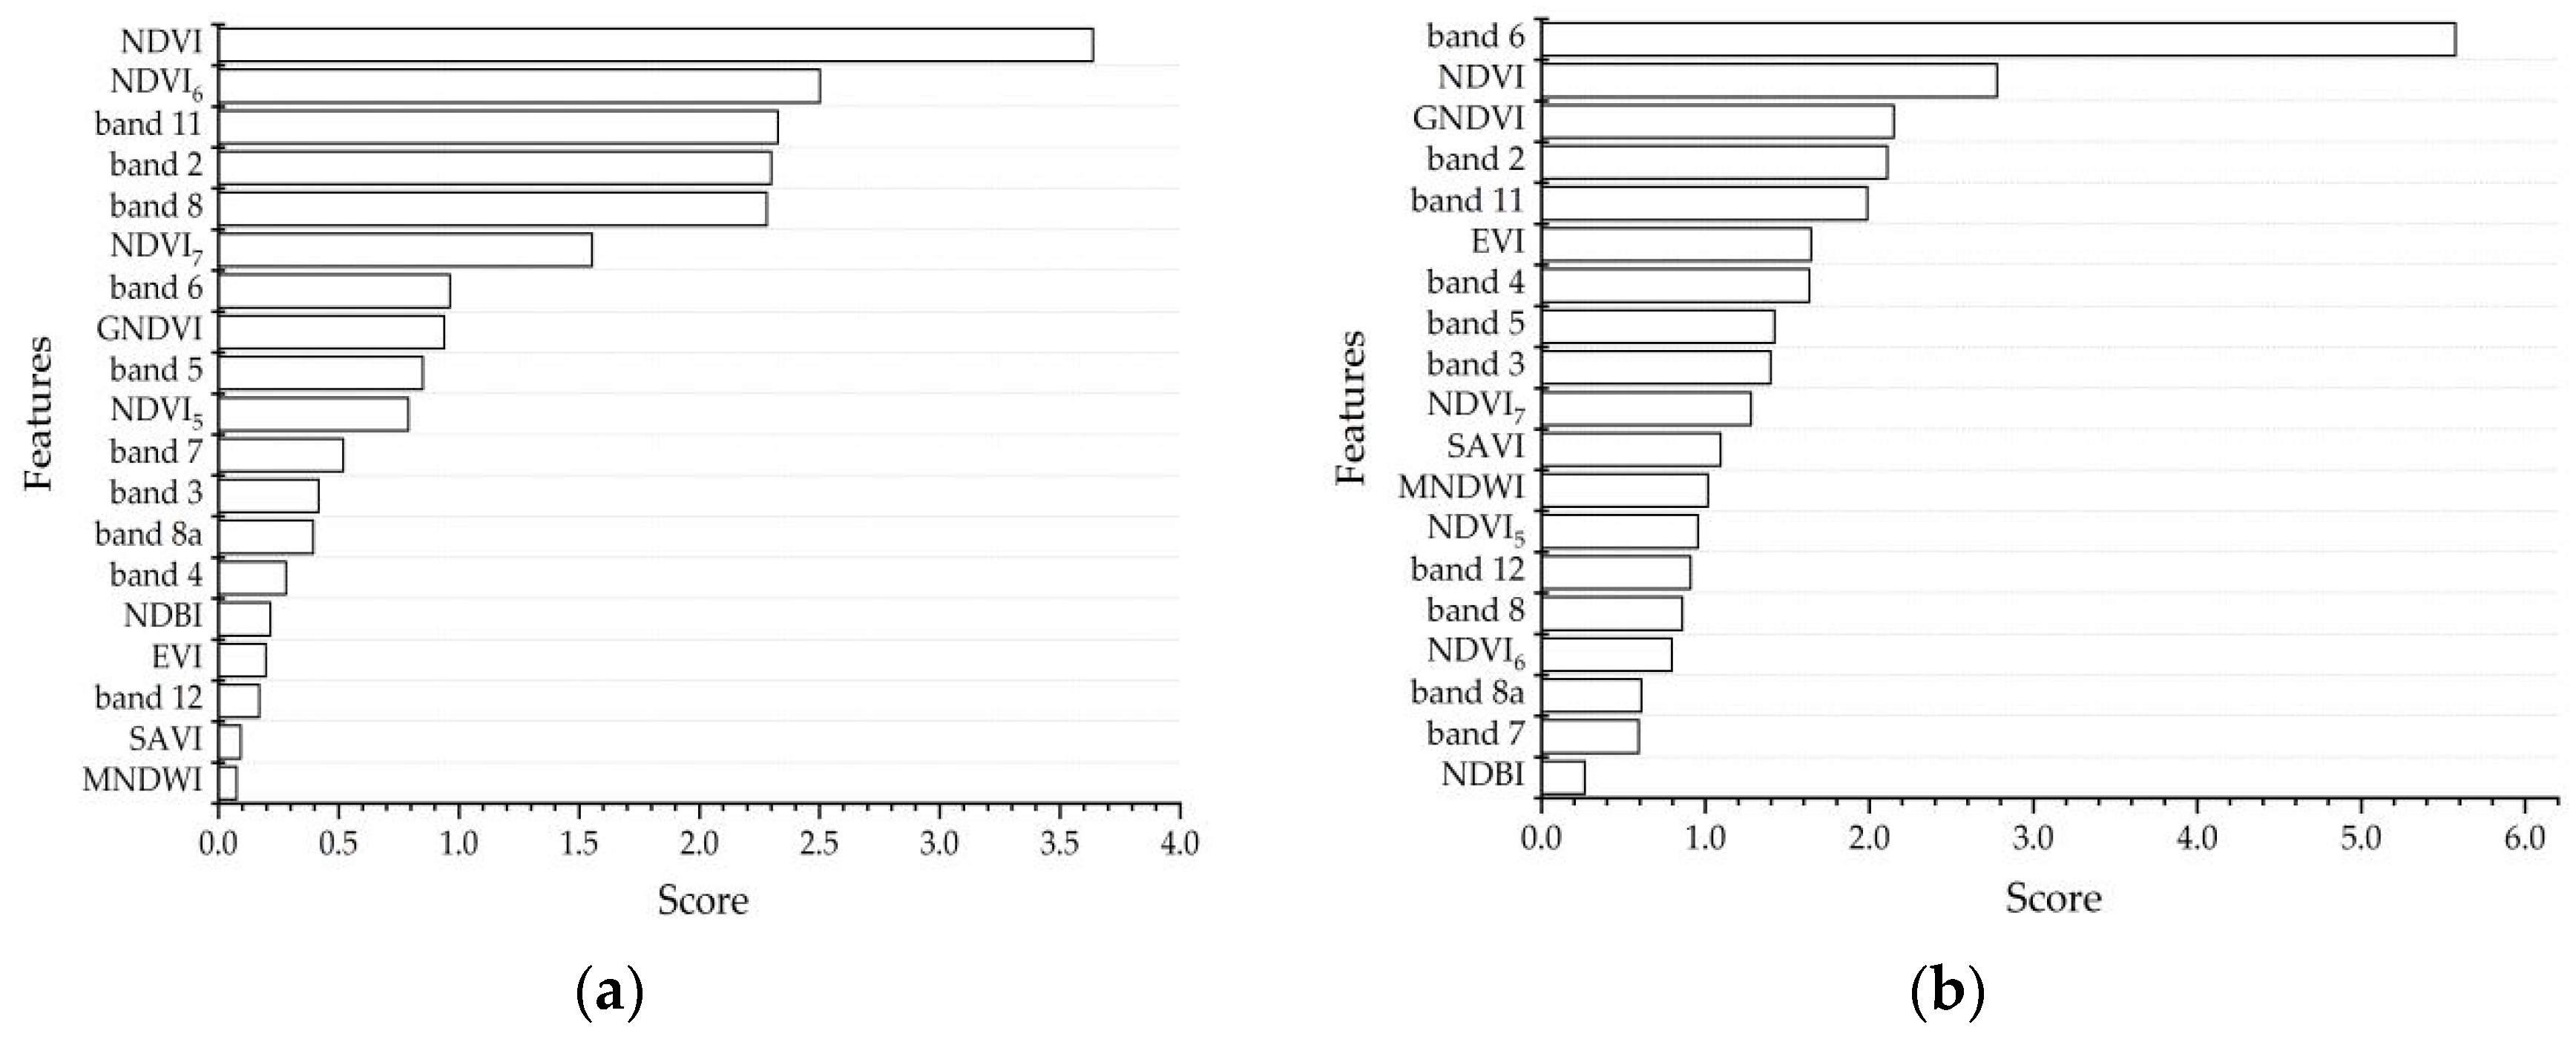
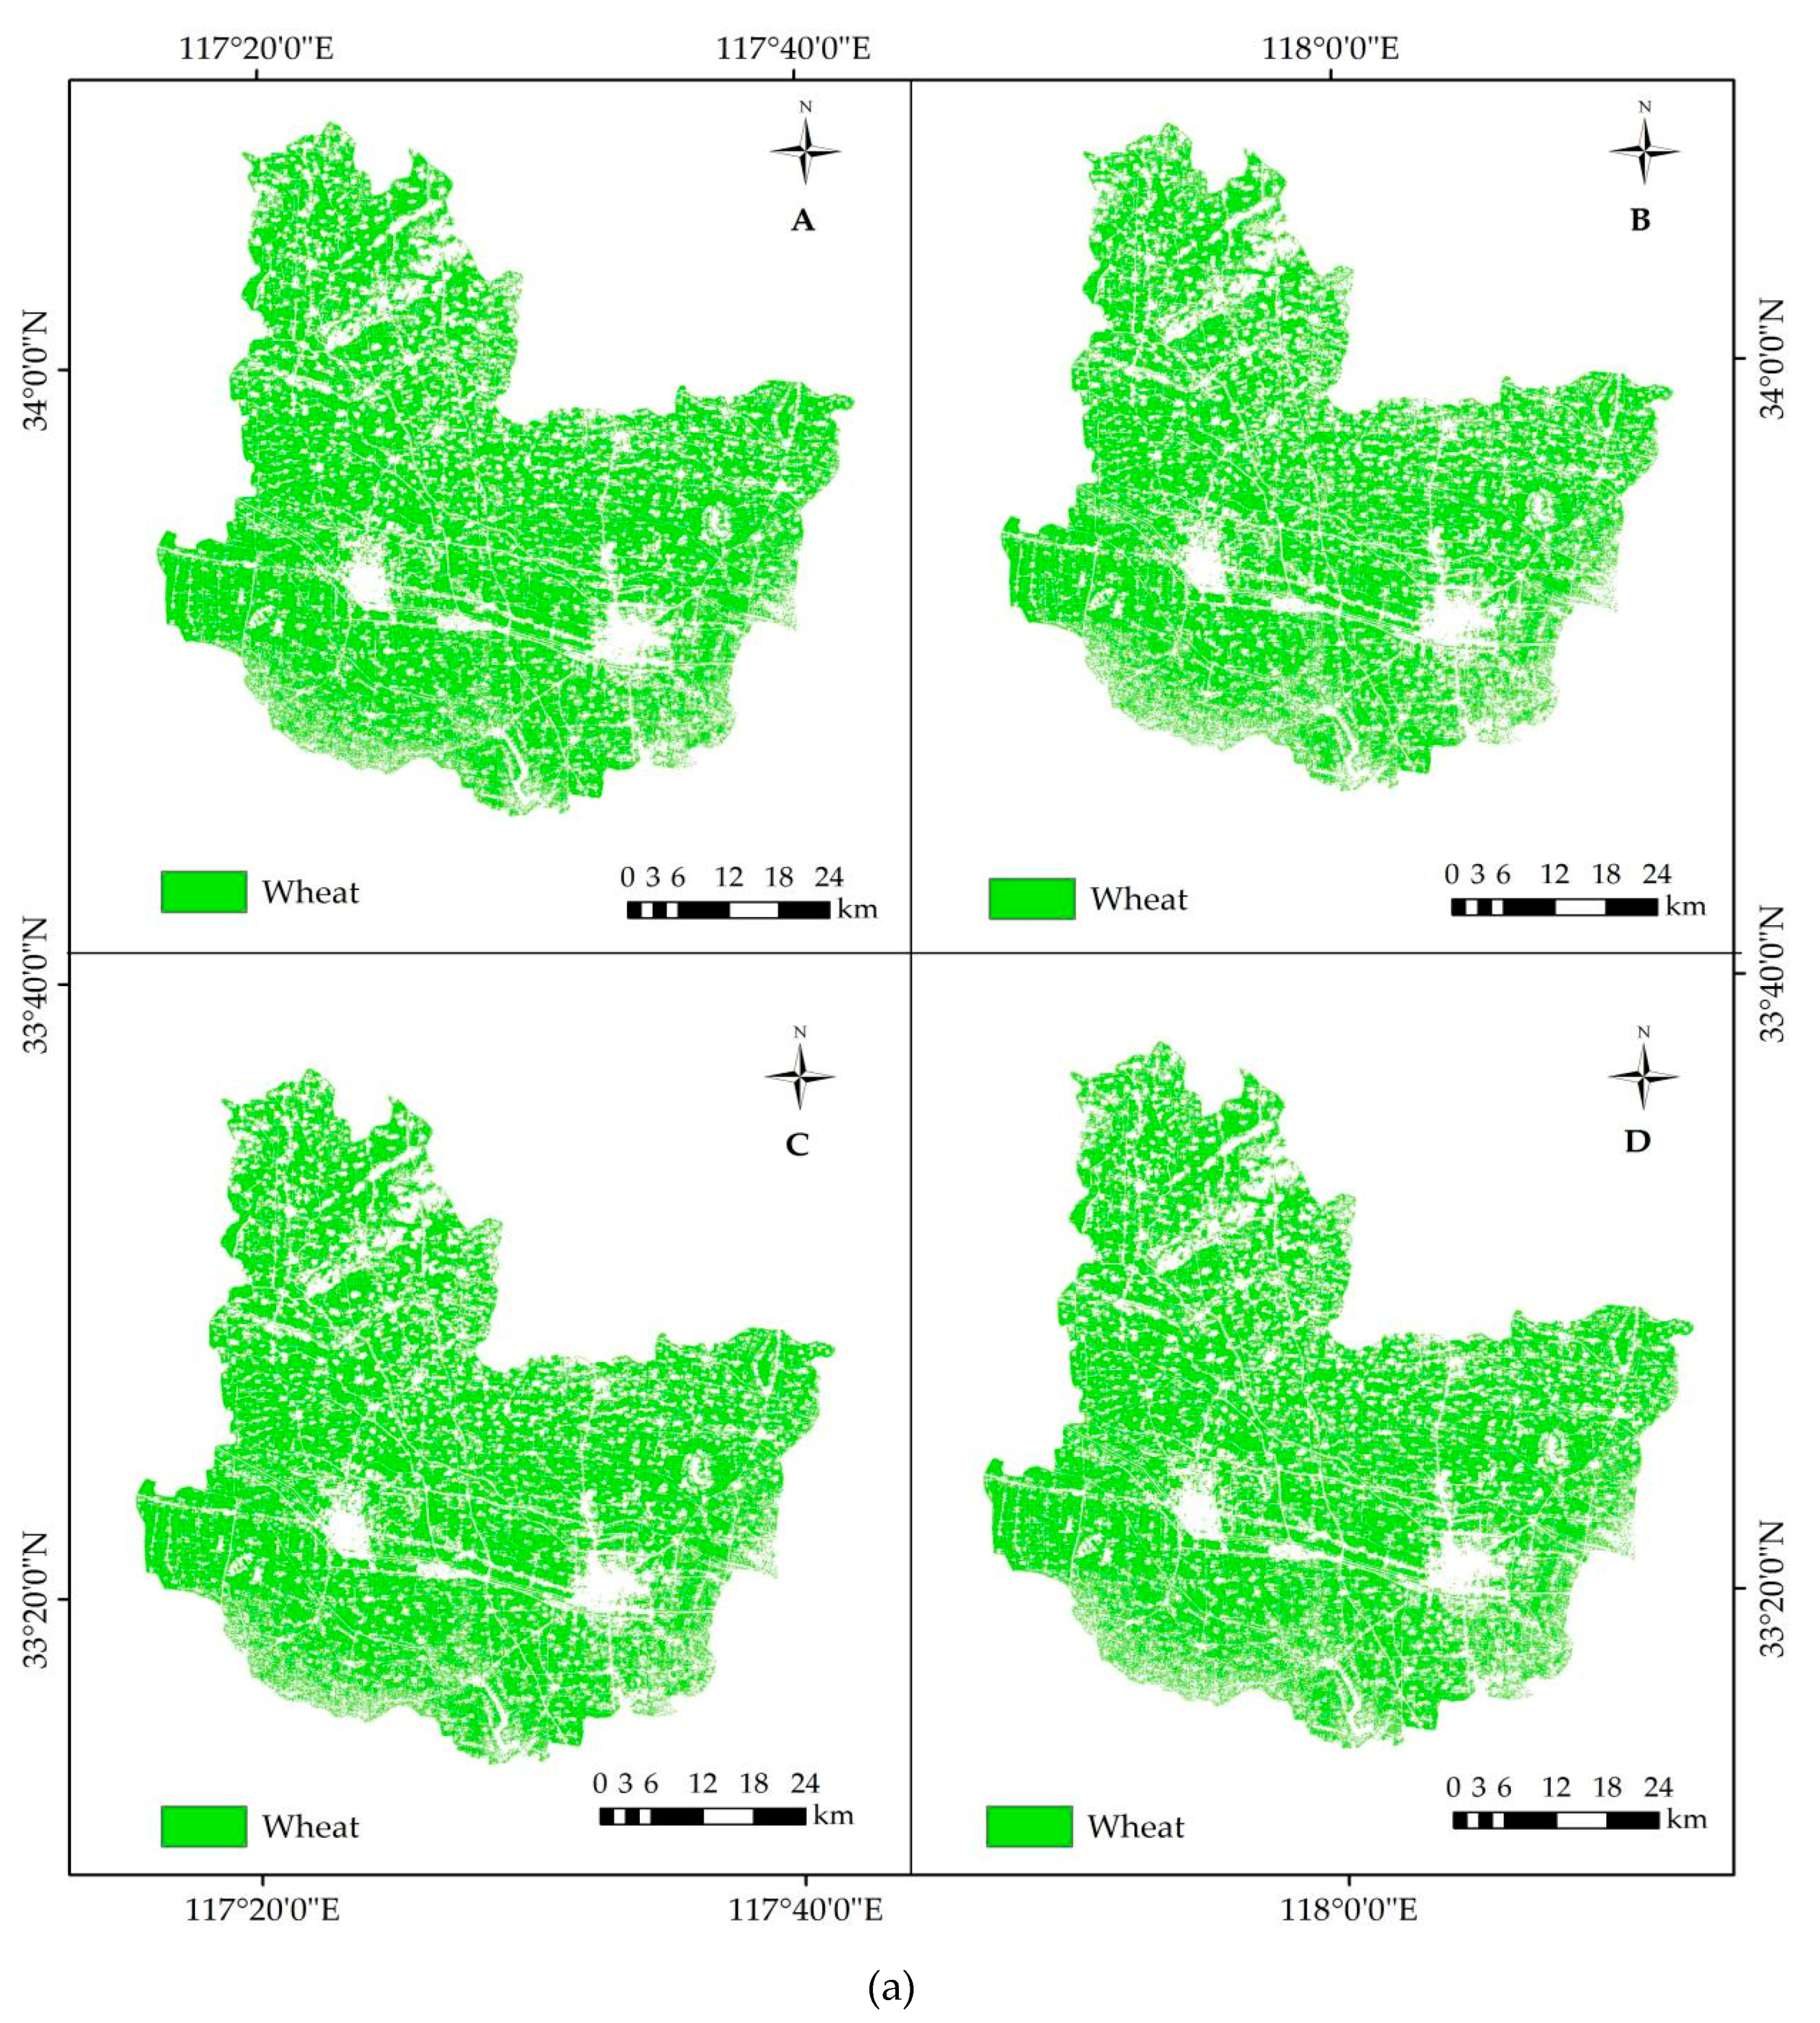
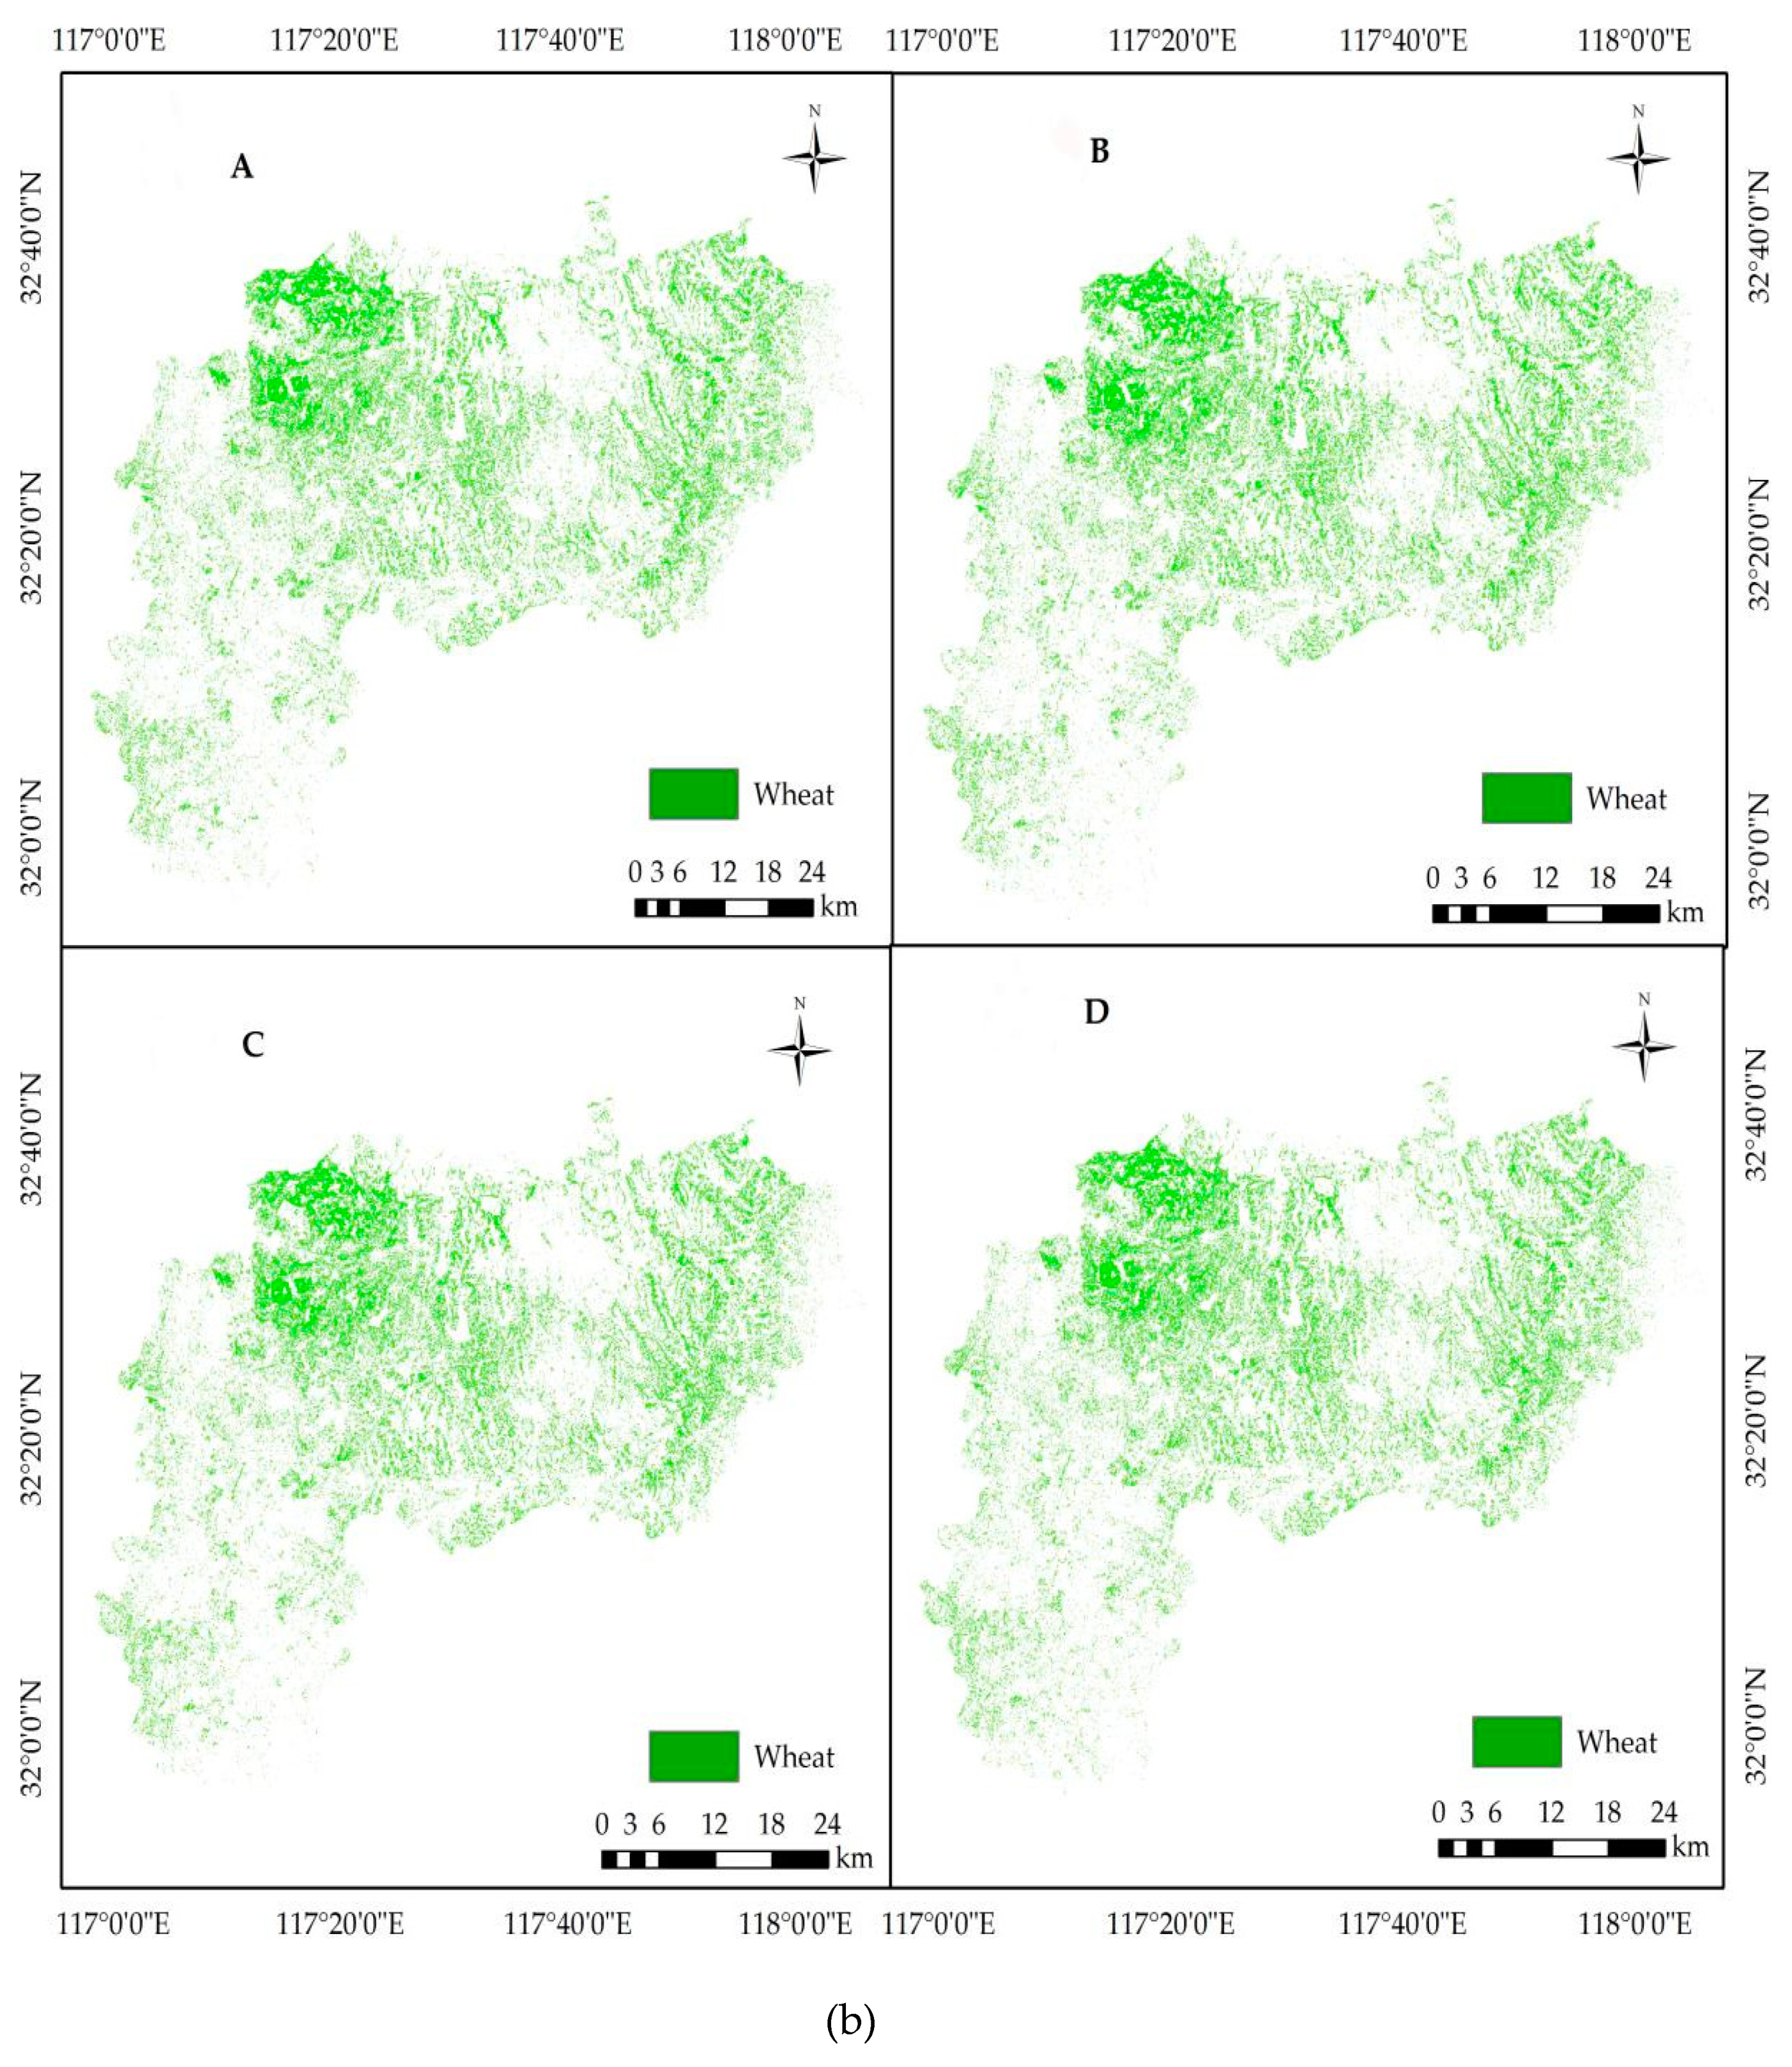
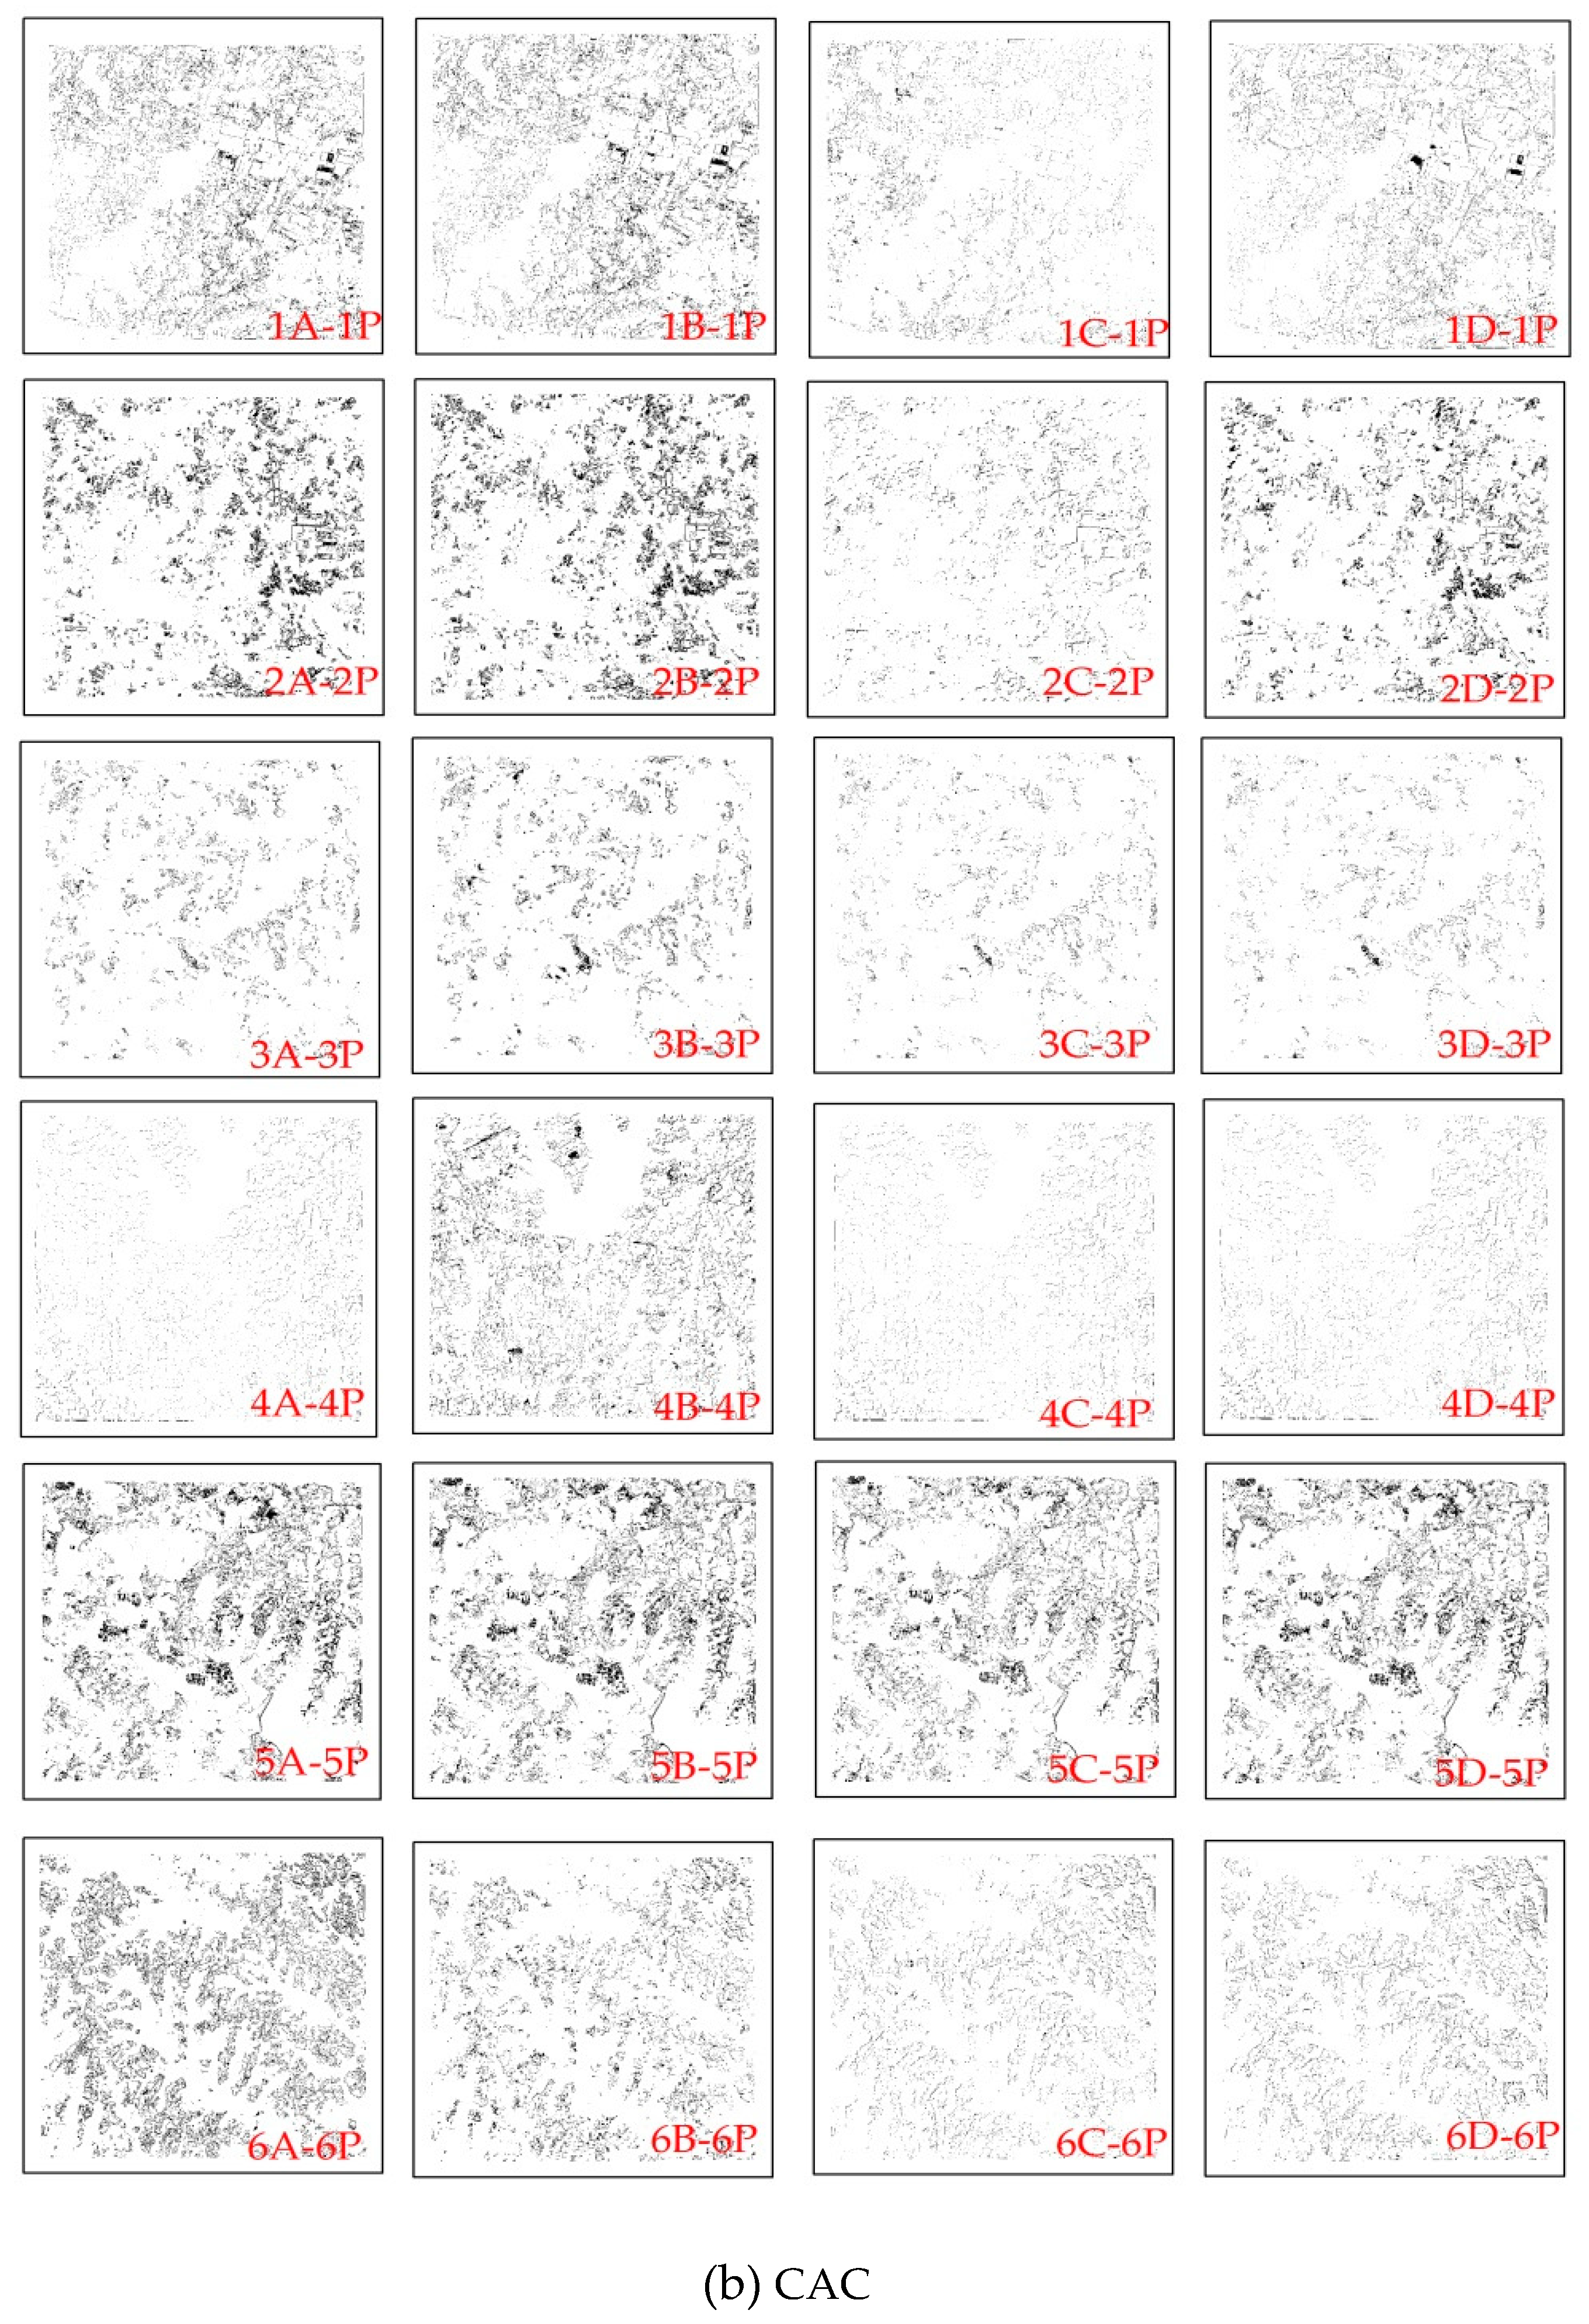
After analysis, the heading stage was found to be the optimum period for winter wheat extraction from other land cover types in both study areas, but the selection of features showed variability. The maximum and minimum contribution of winter wheat extraction in NAC were NDVI and NDWI, while in CAC were band 6 and NDBI, respectively. Based on the Sentinel-2 image at the heading stage, the distribution of winter wheat could be achieved according to the results of feature selection. The producer’s accuracy and user’s accuracy of winter wheat in NAC was about 95% and 93%, respectively, while those in CAC were about 80% and 78%, respectively. The difference between the results confirmed the importance of considering the planting conditions for mapping.
5.2. Factors Influencing the Accuracy of Winter Wheat Mappings
The difference in mapping accuracy between the two areas may be due to the specific conditions of the two study areas. Located in the northern plain of Anhui province, NAC is a winter wheat intensive planting area with continuous spatial distribution, regular patches and large planting area. Compared with NAC, the winter wheat planting scale in CAC is relatively small and most of which are discontinuous and irregularly distributed making it difficult to identify winter wheat fields. Previous studies have shown that fragmentation has a greater impact on crop mapping [
6,
12]. The higher the land fragmentation level, the more serious the mixed pixels are and the lower the mapping accuracy of winter wheat is, which may partially explain the phenomenon that the extraction accuracy of winter wheat in NAC was higher than that in CAC. Moreover, crop types and planting patterns determined the complexity of winter wheat extraction. The winter crops in NAC were only barley and wheat, and the planting area of wheat was large, so barley can be neglected compared to its planting scale. The winter crops in CAC were barley, oilseed rape and wheat. The large area of oilseed rape would affect the extraction results and make the wheat mapping in CAC more complex. The mapping accuracy could be improved when there is a better method to eliminate the influence of other winter crops, such as oilseed rape.
5.3. Winter Wheat Mapping Using Optimum Feature Subset
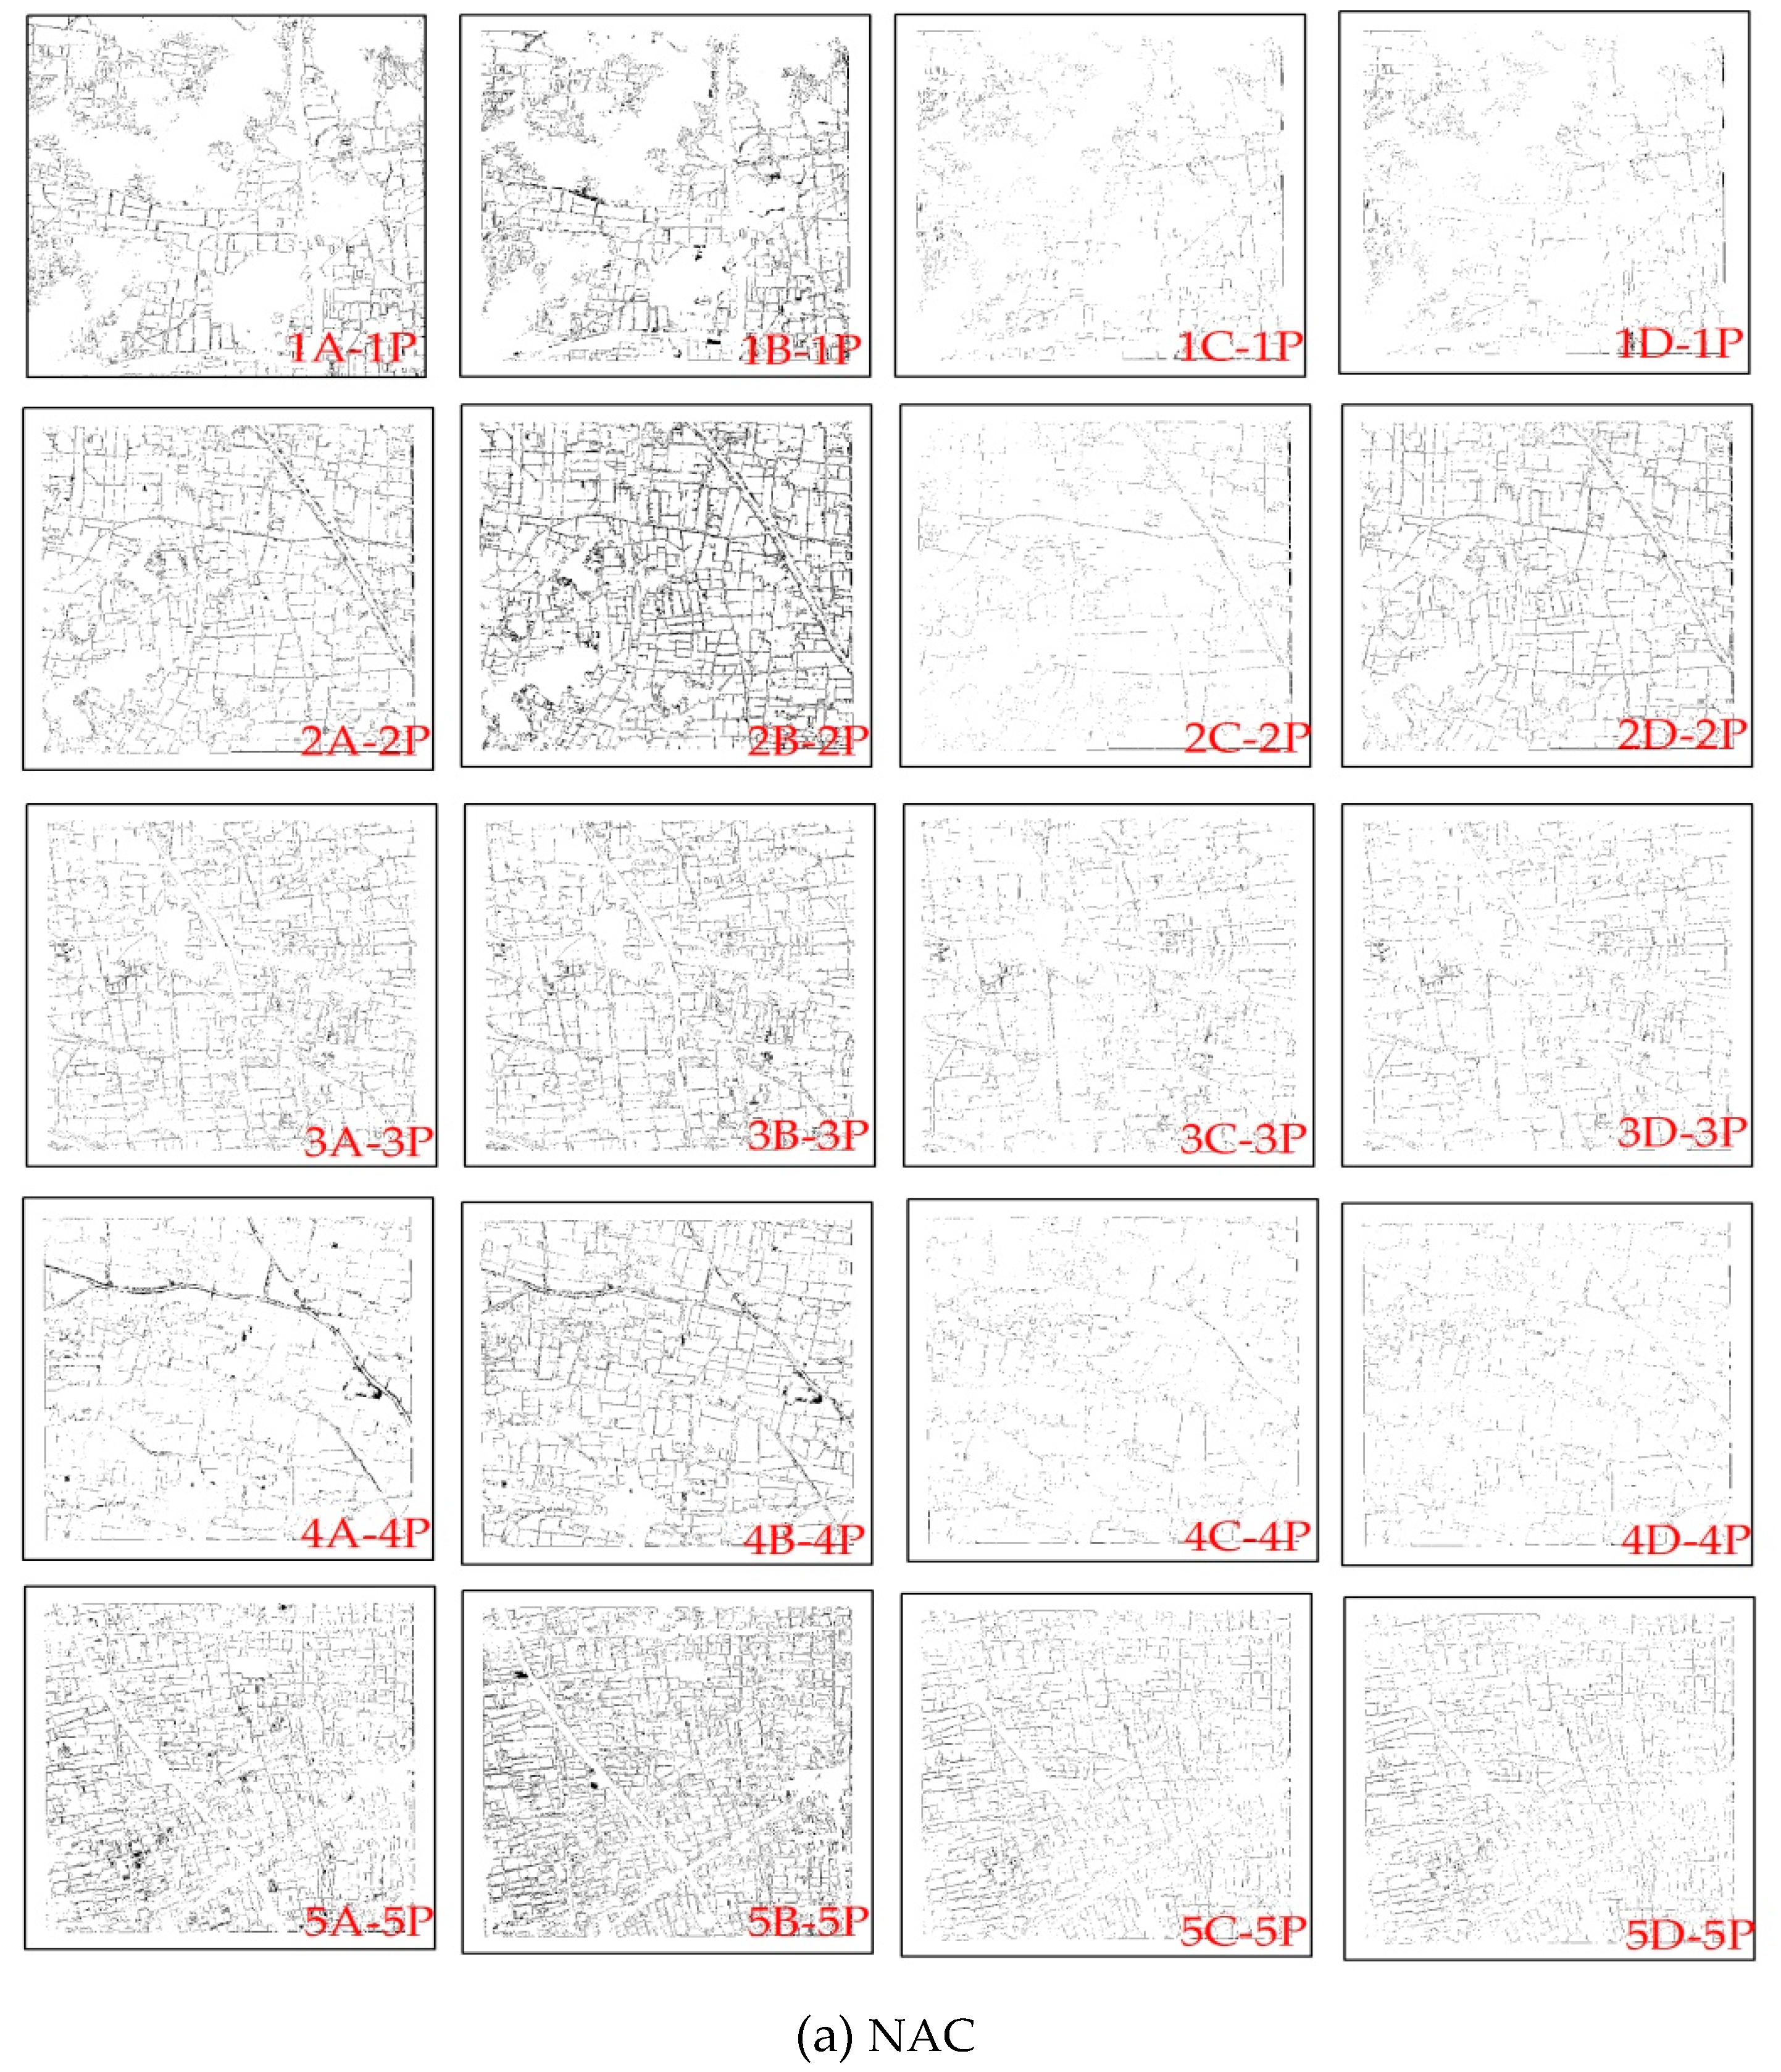
In our study, the percentage error of winter wheat extraction was lower than 5% and Kappa was greater than 0.83 by using the first five features with the highest score in NAC. The percentage error of the first seven features in CAC was lower than 25%, and Kappa was greater than 0.7. The higher classification accuracy was achieved based on the optimum features of scheme D compared to those in scheme A with all indices and the features in scheme B with all spectral bands. The reason may be that the combination of optimum subsets of all types of features takes advantage of multi-source information to maximize useful information compared with a single feature. Although the highest classification accuracy was obtained using scheme C for both study areas, scheme D removed features with low importance and only retained those contributed significantly to winter wheat extraction, so the workload was reduced and the work efficiency was improved significantly.
5.4. Uncertainty Analysis and Future Needs
In this study, we explored the mapping of winter wheat in heterogeneous planting conditions and got good results. However, there are still some uncertainties that need to be addressed in the future. First, this study lacks field investigation data. Second, only four winter wheat planting counties were selected as the study areas since the available images were reduced due to cloud cover and bad weather, and only one winter wheat growing season from 2017 to 2018 was selected for the study. More work needs to be conducted in the future, such as expanding the scope of the study area and choosing multiple growing seasons to verify the applicability and generalization of the conclusions in this study. Third, we only used machine learning methods to extract winter wheat in the study area. Further efforts could be implemented to evaluate the influence of different methods (such as deep learning) on the accuracy of wheat mapping.
6. Conclusions
An integrative analysis of the optimum period, optimum screening feature and optimum extraction scheme was explored for winter wheat mapping in Anhui province in China using high-spatial-resolution Sentinel-2 images. In both study areas, the optimum period for winter wheat extraction was the heading stage and the optimum features were NDVI, NDVI6, band 11 (1614 nm), band 2 (496 nm) and band 8 (835 nm) for NAC, and band 6 (740 nm), NDVI, GNDVI, band 2 (496 nm), band 11 (1614 nm), EVI and band 4 (665 nm) for CAC. Based on the optimum feature scheme, random forest classifier generated a Kappa of about 0.85 in NAC and a Kappa of 0.75 in CAC, accompanied by a reduction of more than 60% in computational cost of image analysis. The wheat maps had high accuracies, which can support the utility of the maps for depicting the spatial distribution of winter wheat. The value of our research lies in that relatively less resources in terms of datasets and timing would be employed to obtain practical and accurate wheat planting information, so as to provide valuable references in methods and make up for the shortage of wheat study for the areas where challenged by high degree of fragmentation, complex terrain surface and changeable climate. The result provides references for agricultural and government departments to make decisions, as well as food security issues.


 ,
, 


