Abstract
The measurement error of differential reflectivity (ZDR), especially systematic ZDR bias, is a fundamental issue for the application of polarimetric radar data. Several calibration methods have been proposed and applied to correct ZDR bias. However, recent studies have shown that ZDR bias is time-dependent and can be significantly different on two adjacent days. This means that the frequent monitoring of ZDR bias is necessary, which is difficult to achieve with existing methods. As radar sensitivity has gradually been enhanced, large amounts of online solar echoes have begun to be observed in volume-scan data. Online solar echoes have a high frequency, and a known theoretical value of ZDR (0 dB) could thus allow the continuous monitoring of ZDR bias. However, online solar echoes are also affected by low signal-to-noise ratio and precipitation attenuation for short-wavelength radar. In order to understand the variation of ZDR bias in a C-band polarimetric radar at the Nanjing University of Information Science and Technology (NUIST-CDP), we analyzed the characteristics of online solar echoes from this radar, including the daily frequency of occurrence, the distribution along the radial direction, precipitation attenuation, and fluctuation caused by noise. Then, an automatic method based on online solar echoes was proposed to monitor the daily ZDR bias of the NUIST-CDP. In the proposed method, a one-way differential attenuation correction for solar echoes and a maximum likelihood estimation using a Gaussian model were designed to estimate the optimal daily ZDR bias. The analysis of three months of data from the NUIST-CDP showed the following: (1) Online solar echoes occurred very frequently regardless of precipitation. Under the volume-scan mode, the average number of occurrences was 15 per day and the minimum number was seven. This high frequency could meet the requirements of continuous monitoring of the daily ZDR bias under precipitation and no-rain conditions. (2) The result from the proposed online solar method was significantly linearly correlated with that from the vertical pointing method (observation at an elevation angle of 90°), with a correlation coefficient of 0.61, suggesting that the proposed method is feasible. (3) The day-to-day variation in the ZDR bias was relatively large, and 32% of such variations exceeded 0.2 dB, meaning that a one-time calibration was not representative in time. Accordingly, continuous calibration will be necessary. (4) The ZDR bias was found to be largely influenced by the ambient temperature, with a large negative correlation between the ZDR bias and the temperature.
1. Introduction
Because differential reflectivity (ZDR) provides information about the shape and composition of hydrometeors, ZDR is an important polarimetric weather radar measurement [1], which has been successfully used in Hydrometeor Classification [2,3,4], quantitative precipitation estimation [5,6], the detection of severe thunderstorms [7,8], the retrieval of raindrop size distributions [9,10], quantitative precipitation forecasts through data assimilation [11], and so forth. ZDR is the difference between reflectivity factors at horizontal and vertical polarizations; thus, it varies in a narrow range of approximately –1 to 6 dB (rain: 0 to 5.5 dB; hail and graupel: –1 to 6 dB; snow and ice crystals: –0.5 to 6 dB). Because of the small range of the intrinsic values, the required accuracy for ZDR for quantitative applications is 0.1–0.2 dB [12]. ZDR is not affected by the absolute miscalibration of the radar transmitter or receiver; however, it is affected by the relative miscalibration of the horizontal and vertical channels. The relative miscalibration indicates the differences in the transmitted powers, microwave losses, receiver gains, and bandwidths between the two orthogonal channels, and results in an undesirable systematic bias of ZDR.
Three types of calibration methods are available to correct ZDR bias: instrumental calibration, standard reflection/natural scattering calibration [13,14], and standard radiation source calibration. (1) The instrumental calibration uses internal/external instruments to measure the relative differences between horizontal and vertical channels [15] from calibration ports related to the radar architecture. This calibration can return the full-path (transmitting path plus receiving path) ZDR bias, however it depends on radar architecture and high-precision instruments. Additionally, it is challenging to determine the relative difference between the antenna gains of two orthogonal channels. (2) Standard reflection/natural scattering calibration depends on the reflection or scattering from natural or man-made targets with known polarization characteristics. The “metal ball” method is a standard reflection calibration in which a floating metal ball with a known ZDR is used to calculate the bias by observing the ball’s ZDR. This method is relatively accurate, however the radar must be switched from the operational scan mode to the ball-tracking scan mode, which is not practical when many calibrations are required. A similar method was proposed by Gabella [13] in which the reflective object was changed to a fixed metallic tower. Meanwhile, in standard scattering calibration, the ZDR bias is estimated using specific raindrops/snowflakes [16] with a known polarization. The multiple-elevation-angle method [17] involves the observation of stratiform precipitation at several elevation angles to calculate the bias of ZDR according to the formula for the elevation-angle dependence of ZDR. Ryzhkov et al. [14] proposed a high-elevation-angle method that estimates ZDR bias observing light rain and dry aggregated snow at a high elevation angle. When light rain or snow was vertically observed by radar at an elevation angle of 90°, the horizontal and vertical sizes of the raindrops/snowflakes were found to be approximately equal, and the theoretical ZDR was therefore 0 dB. The vertical pointing method uses the above fact to obtain the ZDR bias [18,19,20]. Similarly, the Bragg scattering method estimates ZDR bias based on the fact that the intrinsic ZDR of Bragg scattering is 0 dB [21,22]. As mentioned above, standard reflection/scattering calibrations require the use of a special scan mode or specific weather conditions. Since these conditions cannot be met every day, it is difficult to obtain a continuous measure of ZDR bias using such calibration methods. (3) Standard radiation source calibration uses a natural or man-made standard radiation source that emits standard signals to calibrate ZDR. The most commonly used radiation source is the sun. Solar radiation has been used in radar meteorology for long time to check the antenna alignment and the sensitivity and stability of the receiver chain [23]. Though solar radiation is concentrated in the visible light wavelengths, there is a small amount of energy (<1%) distributed in the microwave band [24]. When the radar antenna is pointed at the sun, the radar antenna will receive the energy at the radar frequency, forming strip-like solar echoes (Figure 1a). However, the pattern/feature of radar echoes from clouds and precipitation is very different from that of solar echoes. As for the observation of clouds and precipitation, the radar transmits electromagnetic waves and receives the backscattered electromagnetic waves, forming radar images of clouds and precipitation (Figure 1b). Because the sun emits equal amounts of spectral power density in both horizontal and vertical polarizations, the theoretical ZDR of solar radiation is 0 dB and the bias due to the receiving path can be determined. In the previous solar calibration method, the radar must be switched to sun-tracking mode [25] and cannot be used while simultaneously making precipitation observations; thus, in this paper, this method is called the offline solar method. Another type of solar echo appears sporadically in volume scans in operational mode, and the calibration method based on such data is called the online solar method (in order to distinguish it from the offline solar method). Huuskonen and Holleman [23] first proposed an extraction method for online solar echoes. Later, Holleman et al. [25,26] used online solar signals to monitor the radar receiver gain and the ZDR receiving-path bias, showing that online solar echoes can be used to monitor and calibrate polarimetric radar.
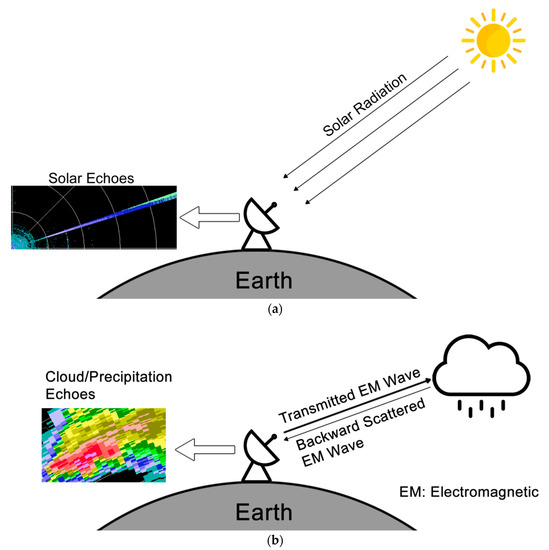
Figure 1.
Conceptual sketches of radar echoes from the sun (a) and from cloud/precipitation (b).
The above traditional methods are relatively mature. If the ZDR bias is not time-variant, the ZDR calibration will be simple and the bias can be corrected using the aforementioned traditional methods. However, recent studies have shown that ZDR bias can be time-variant or temperature-dependent [22,27], and that the biases between two adjacent days can be significantly different. In such cases, one-time calibration is not representative, and continuous high-frequency calibration should therefore be considered. Traditional methods of ZDR calibration are all limited by certain prerequisites. For instance, the metal-ball method and the offline solar method require the radar to be switched from precipitation scan mode to ball-tracking/sun-tracking mode. Additionally, calibration methods based on observations of raindrops or snowflakes (e.g., the vertical pointing method or the rain/snow methods) require uniform precipitation (i.e., no convective precipitation) in the radar coverage or directly above the radar; these conditions are difficult to meet every day, and these methods are thus incapable of performing continuous calibration for operational radars. In the present study, an automatic calibration method based on online solar echoes was designed in order to continuously monitor daily ZDR biases in a C-band polarimetric radar at the Nanjing University of Information Science and Technology (NUIST-CDP). This study proposes a differential attenuation correction for solar echoes to eliminate the effects of precipitation. Furthermore, a Gaussian maximum likelihood method was used to reduce the fluctuation caused by noise, and a vertical pointing method was selected as truth to evaluate the result of the proposed online solar method.
This paper is organized as follows. Section 2 introduces the radar and methodology. Section 3 presents the characteristics of online solar echoes, the characteristics of ZDR bias, and evaluations of the proposed method. Various topics about the uncertainty of the proposed method are discussed in Section 4, including random error, systematic bias, and the relationship between ZDR bias and ambient temperature. Finally, the advantages and limitations of the study are summarized in Section 5.
2. Radar and Methodology
2.1. C-Band Polarimetric Radar
With funding from the China Meteorological Administration, the Nanjing University of Information Science and Technology installed a high-resolution C-band Dual-Polarization Doppler radar in 2013. The NUIST-CDP is a ground-based (118.72°E, 32.21°N) radar with an antenna elevation of 87 m. The wavelength of the radar is ~5.5 cm, the beamwidth is 0.54°, and the antenna diameter is ~8.5 m. NUIST-CDP operates in simultaneous transmission and simultaneous reception (STSR) mode, and measures reflectivity factor (Z), radial velocity (V), spectrum width (W), ZDR, differential phase (ϕDP), and correlation coefficient (ρhv). A volume scan mode named VCP21_90D was used at a pulse width of 0.5 μs and an elevation angle ranging from 0.5 to 19.5°, plus a plan position indicator (PPI) scan at an elevation angle of 90° (Table 1). The range resolution of the data was 75 m, the azimuthal resolution of PPI was <0.6°, the maximum detection range/radius was ~150 km, and the duration of each volume scan was ~7 min. More details and observational analysis of NUIST-CDP can be found in Chu et al. [28].

Table 1.
Parameters of the C-band polarimetric radar at the Nanjing University of Information Science and Technology (NUIST-CDP).
NUIST-CDP has been shown to be superior to Chinese operational radars (beamwidth ~1°) for observing online solar echoes. Firstly, NUIST-CDP can often observe two adjacent solar radials simultaneously due to its narrower beam, whereas operational radars can only observe one. Thus, NUIST-CDP can acquire double the amount of data under the same conditions. Secondly, NUIST-CDP can scan at an elevation angle of 90°, which is favorable for cross-validation between the online solar method and the vertical pointing method.
2.2. Automatic Online Solar Method
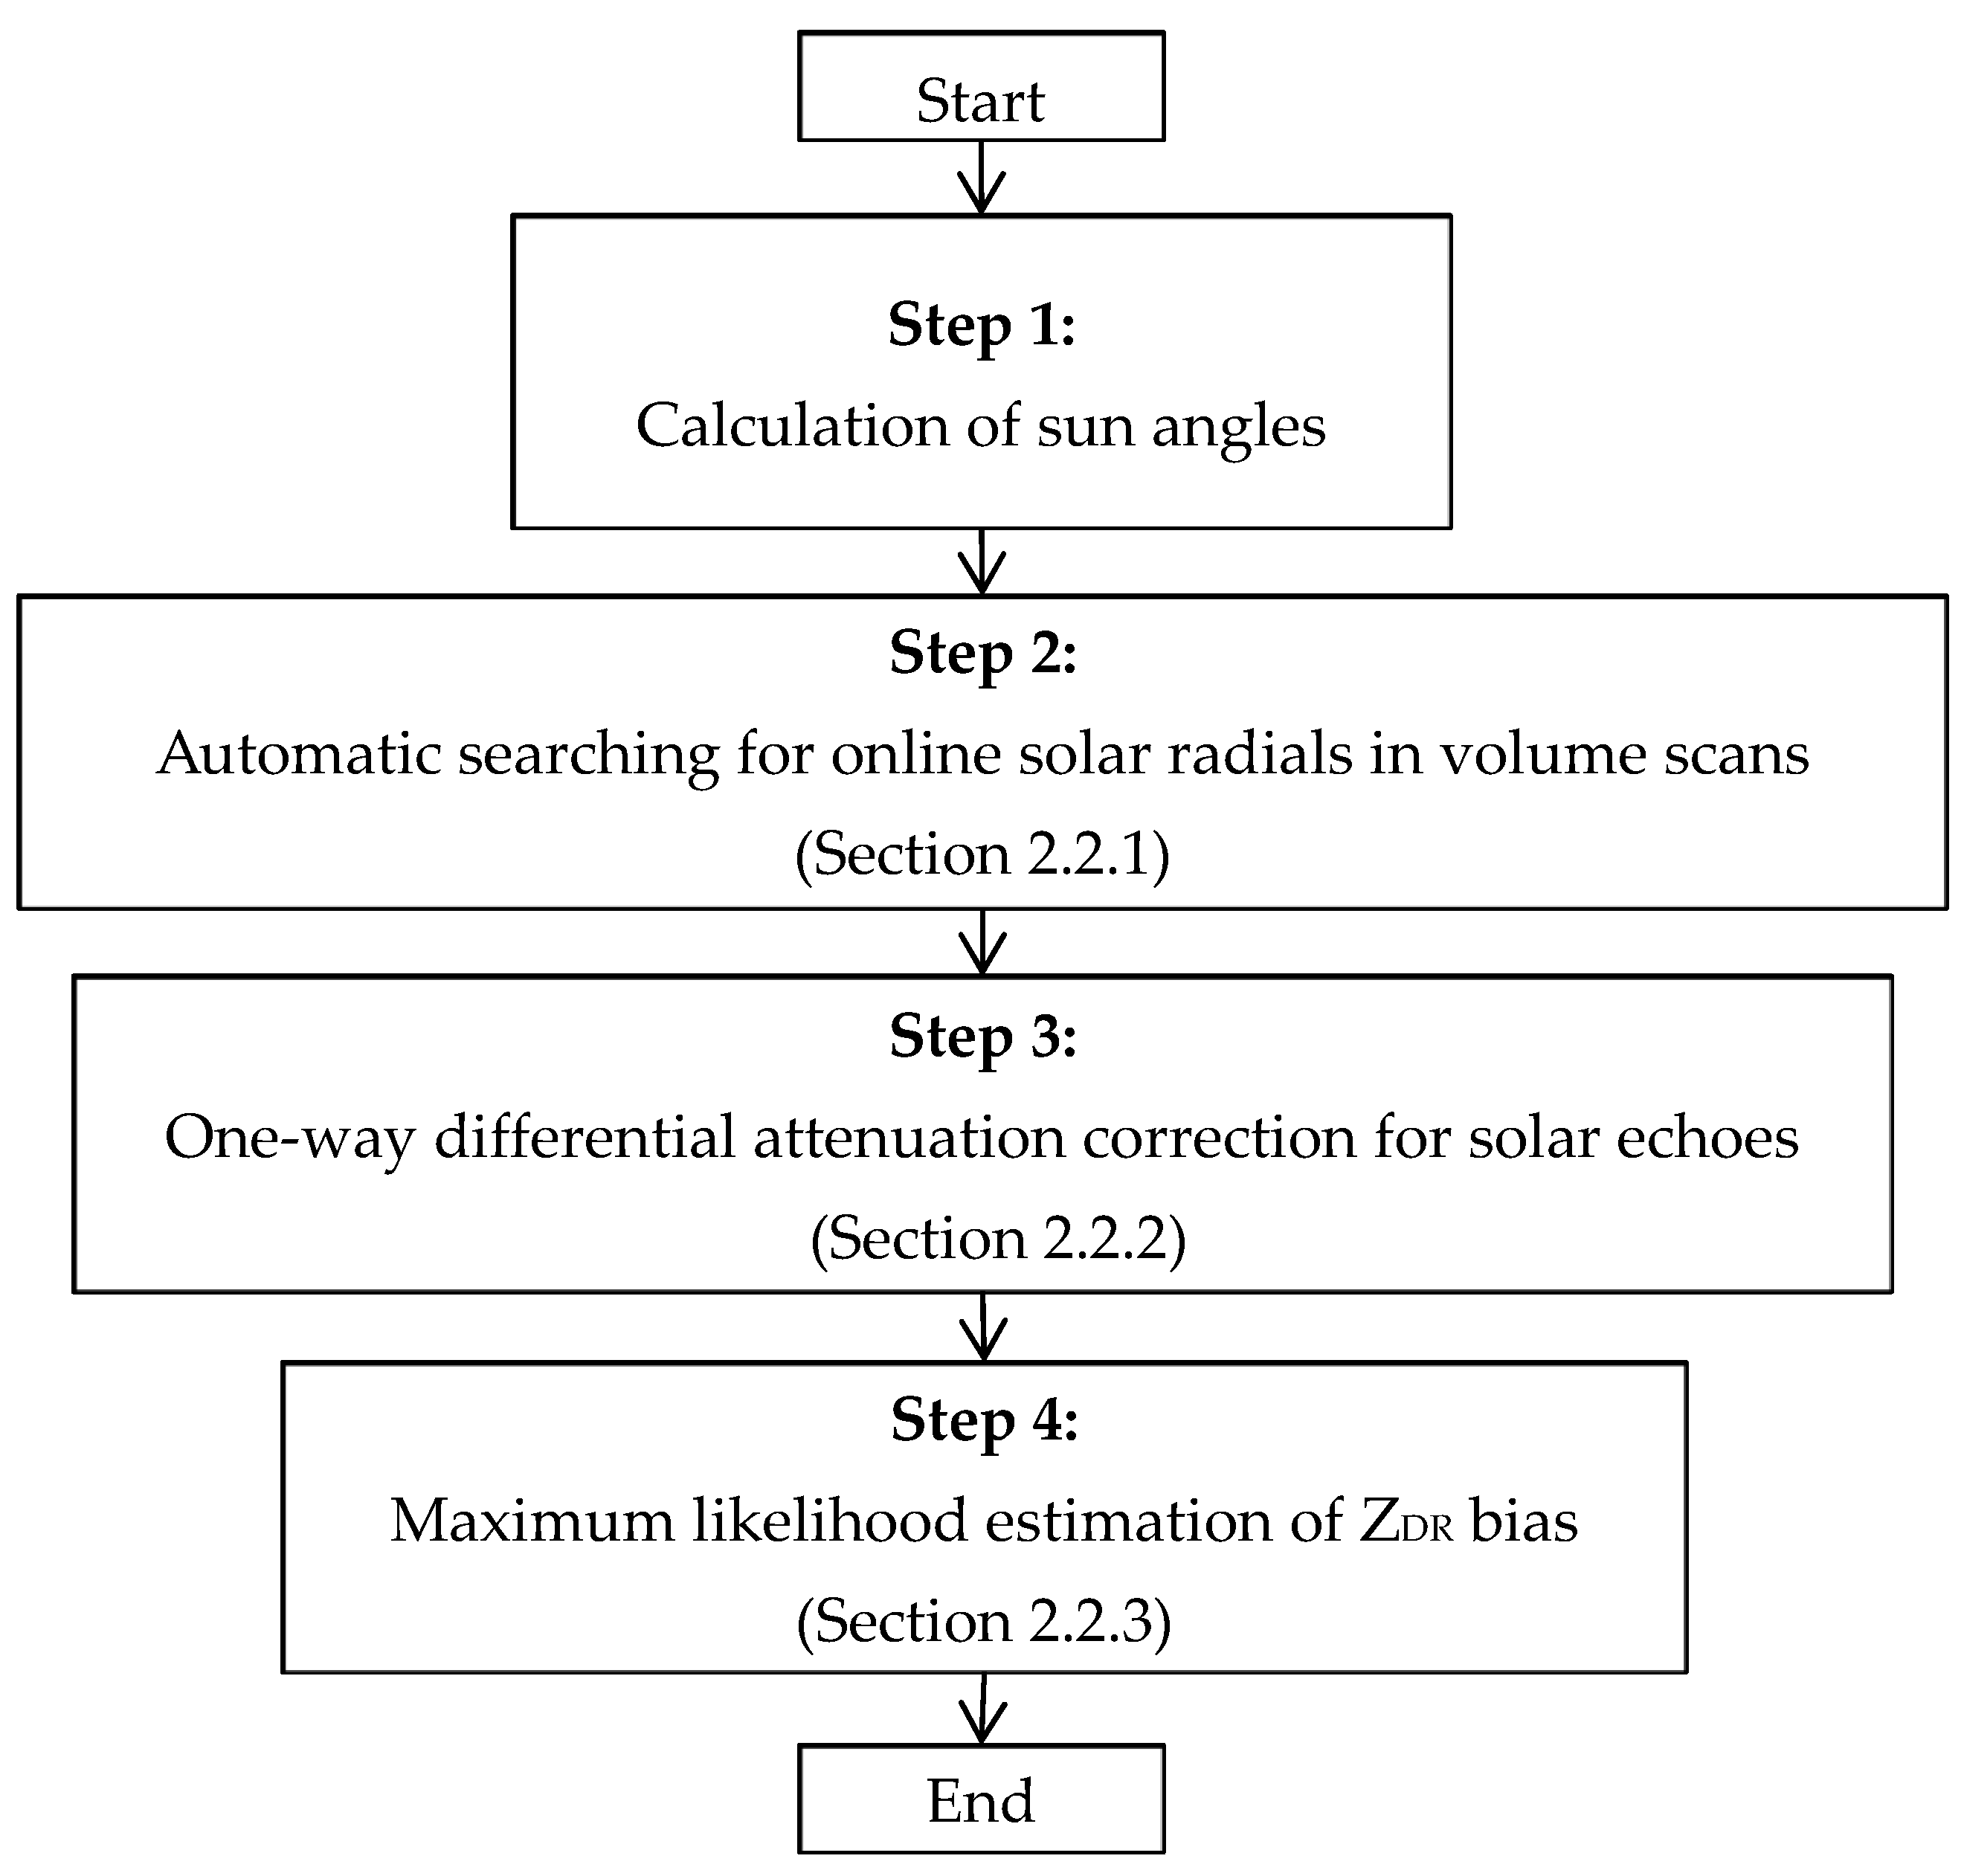
When the antenna points exactly towards the sun during operational volume scans, solar radiation will enter the radar through the receiving path, forming a radial echo (i.e., the online solar echo). Since the theoretical ZDR of online solar echoes is 0 dB, the observed ZDR of the sun can simply be regarded as a systematic bias of ZDR. For the continuous monitoring of the ZDR bias of NUIST-CDP, we proposed an automatic method based on online solar echoes extracted from volume-scan data. The method consists of four steps, as shown in Figure 2. In Step 1, the true angles to the sun are calculated according to the radar latitude and longitude and the observation time [29]. In Step 2, the solar radials are extracted from volume-scan data according to the method described in Section 2.2.1. In Step 3, the one-way differential attenuation caused by precipitation is corrected using the method explained in Section 2.2.2. In Step 4, according to the maximum likelihood estimation of the Gaussian distribution, the ZDR variances related to signal to noise ratio (SNR) are used as weights to estimate the daily ZDR of the sun, i.e., the daily ZDR bias of radar (Section 2.2.3).
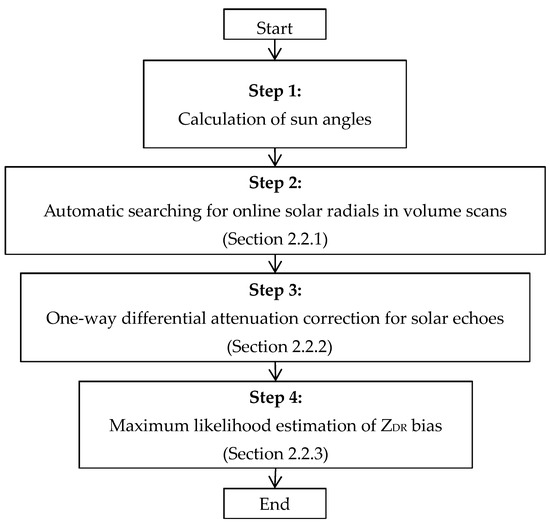
Figure 2.
Flow chart of the proposed automatic calibration method based on online solar echoes.
2.2.1. Extracting Online Solar Radials
In the volume scans, the online solar echoes manifested as one or two adjacent radials from the radar to the maximum range. These echoes can be easily detected using automatic methods, such as that of Huuskonen and Holleman [23]. In this study, an analogous automatic extracting algorithm was designed according to the characteristics of online solar echoes. It was supposed that the elevation-angle bias and the azimuthal bias of the antenna pointing did not exceed 2.5° and 5.0°, respectively. These two conditions can be easily met except in special cases such as mechanical failure. The true solar angles were determined according to the radar latitude and longitude and the observation time, and then each radial at an azimuth of ±5.0° and an elevation angle of ±2.5° around the true solar angle was investigated. At 50 to 150 km, if the proportions of available (i.e., not missing) Z and ZDR data of a radial were both above 90% and the proportion of available V data was smaller than 50%, this radial would be extracted as an online solar radial. Since solar signals were continuous along the radial direction, Z and ZDR were available at each bin. Additionally, solar signals did not vary with time, and thus the proportion of available V was very low. This automatic method can exactly distinguish online solar radials from meteorological echoes; however, in some occasions, the electromagnetic interference echoes from some external radiation sources (e.g., other radars) will be mistakenly regarded as solar echoes, because these interference echoes also have the characteristics mentioned above and can be hardly distinguished from solar echoes.
2.2.2. One-Way Differential Attenuation Correction of Online Solar Data
The solar signals traveling from the top of the atmosphere to the ground-based antenna are attenuated by air, cloud, and precipitation. For ZDR, the attenuation of solar signals by air and cloud could be ignored since the attenuation caused by the atmosphere and cloud droplets are nearly equal at horizontal and vertical polarizations. However, the attenuation by precipitation in the C-band could not be ignored, especially during heavy rain/hail during the rainy season. During the detection of a meteorological target, the electromagnetic waves will be attenuated twice by rainfall during the transmission and the reception, so the attenuation/differential attenuation correction of meteorological echoes is two-way. When the radar is receiving solar irradiation, attenuation only occurs once, so the attenuation/ differential attenuation correction is one-way. Thus, the differential attenuation correction of solar ZDR is also different from the widely-used two-way differential attenuation corrections [30,31]. The one-way equations are as follows:
where and are the corrected and observed differential reflectivity (dB), respectively, is the maximum range (km) of precipitation from the radar, is the specific differential attenuation (dB/km), and are the two-way path-integrated differential attenuation (dB) of precipitation and the differential phase (deg) of radar observation at the , respectively, and c is the attenuation coefficient, which is usually set as 0.036 dB/deg in the C-band [32]. For solar radial data, should be determined before correction. Then, should be calculated from the observed using Equation (1). Finally, the ZDR of the online solar echoes from to the maximum range should be corrected using Equation (2).
2.2.3. Estimation of Daily ZDR from Online Solar Echoes
Besides attenuation, the ZDR of the online solar data was also usually affected by low SNR. Unlike offline solar data, the SNR was relatively low and the ZDR randomly fluctuated due to the noise effect, since the online solar signals mostly entered the antenna from the edges of the main beam (see Section 3.3). Although it was possible to reduce random errors in the average values, the variation of the random error and SNR in different radials were not considered. Thus, the maximum likelihood method was adopted to optimize the daily ZDR estimation. Firstly, it was presumed that the real value of the solar ZDR was θ and the ZDR of the jth solar radial was Xj = θ + Wj, where is the Gaussian distribution of the noise and is the standard deviation associated with the SNR. Then, Xj obeyed a Gaussian distribution N(θ, and the probability density function was (x, θ). The θ parameter can be estimated using the maximum likelihood method.
where N is the number of solar radials in one day. Let
Solving for the maximum value of is equivalent to finding the minimum value of . Solving :
Equation (5) was used to estimate the daily ZDR using the maximum likelihood method with the variance of ZDR as the weights and considering the random errors caused by noise; therefore, this equation performed better than simple averaging.
2.3. Processing of Vertical Pointing Data
The shape of raindrops can be approximated by an oblate spheroid. Radar and in situ aircraft-based observations have shown that, on average, raindrops are oriented with their axis of symmetry in the vertical direction. This implies that the shape of raindrops observed at an elevation angle of 90° is nearly circular [18]. The vertical pointing method can be used to relatively accurately obtain the full-path ZDR bias. Although this method cannot be used to continuously monitor ZDR bias due to the requirement for stable rainfall/snowfall above the radar, it can be used to verify the accuracy of the online solar method introduced in Section 2.2. As shown in Table 1, the additional 15th PPI in the NUIST-CDP volume scan was at an elevation angle of exactly 90°. In order to avoid interference from insects, ground clutters, hailstones, or the bright band (melting layer), when acquiring reliable liquid raindrop echoes, the vertical pointing data were selected between Z values of 18 and 50 dBZ, > 0.97, and heights of 1–4 km. Then, an average value of ZDR was calculated over all azimuths (0–360°) to avoid the direction-dependent bias associated with mechanical structures [18,19].
3. Results
The online solar echoes in the NUIST-CDP volume scan for three consecutive months (June, July and August 2015) were extracted and processed using the online solar method described in Section 2.2. After that, the characteristics of the online solar data were analyzed, as described in the following sections. The daily ZDR biases of NUIST-CDP were calculated using online solar echoes and evaluated by vertical pointing data as described in Section 2.3.
3.1. Occurrence Frequency of Online Solar Radials
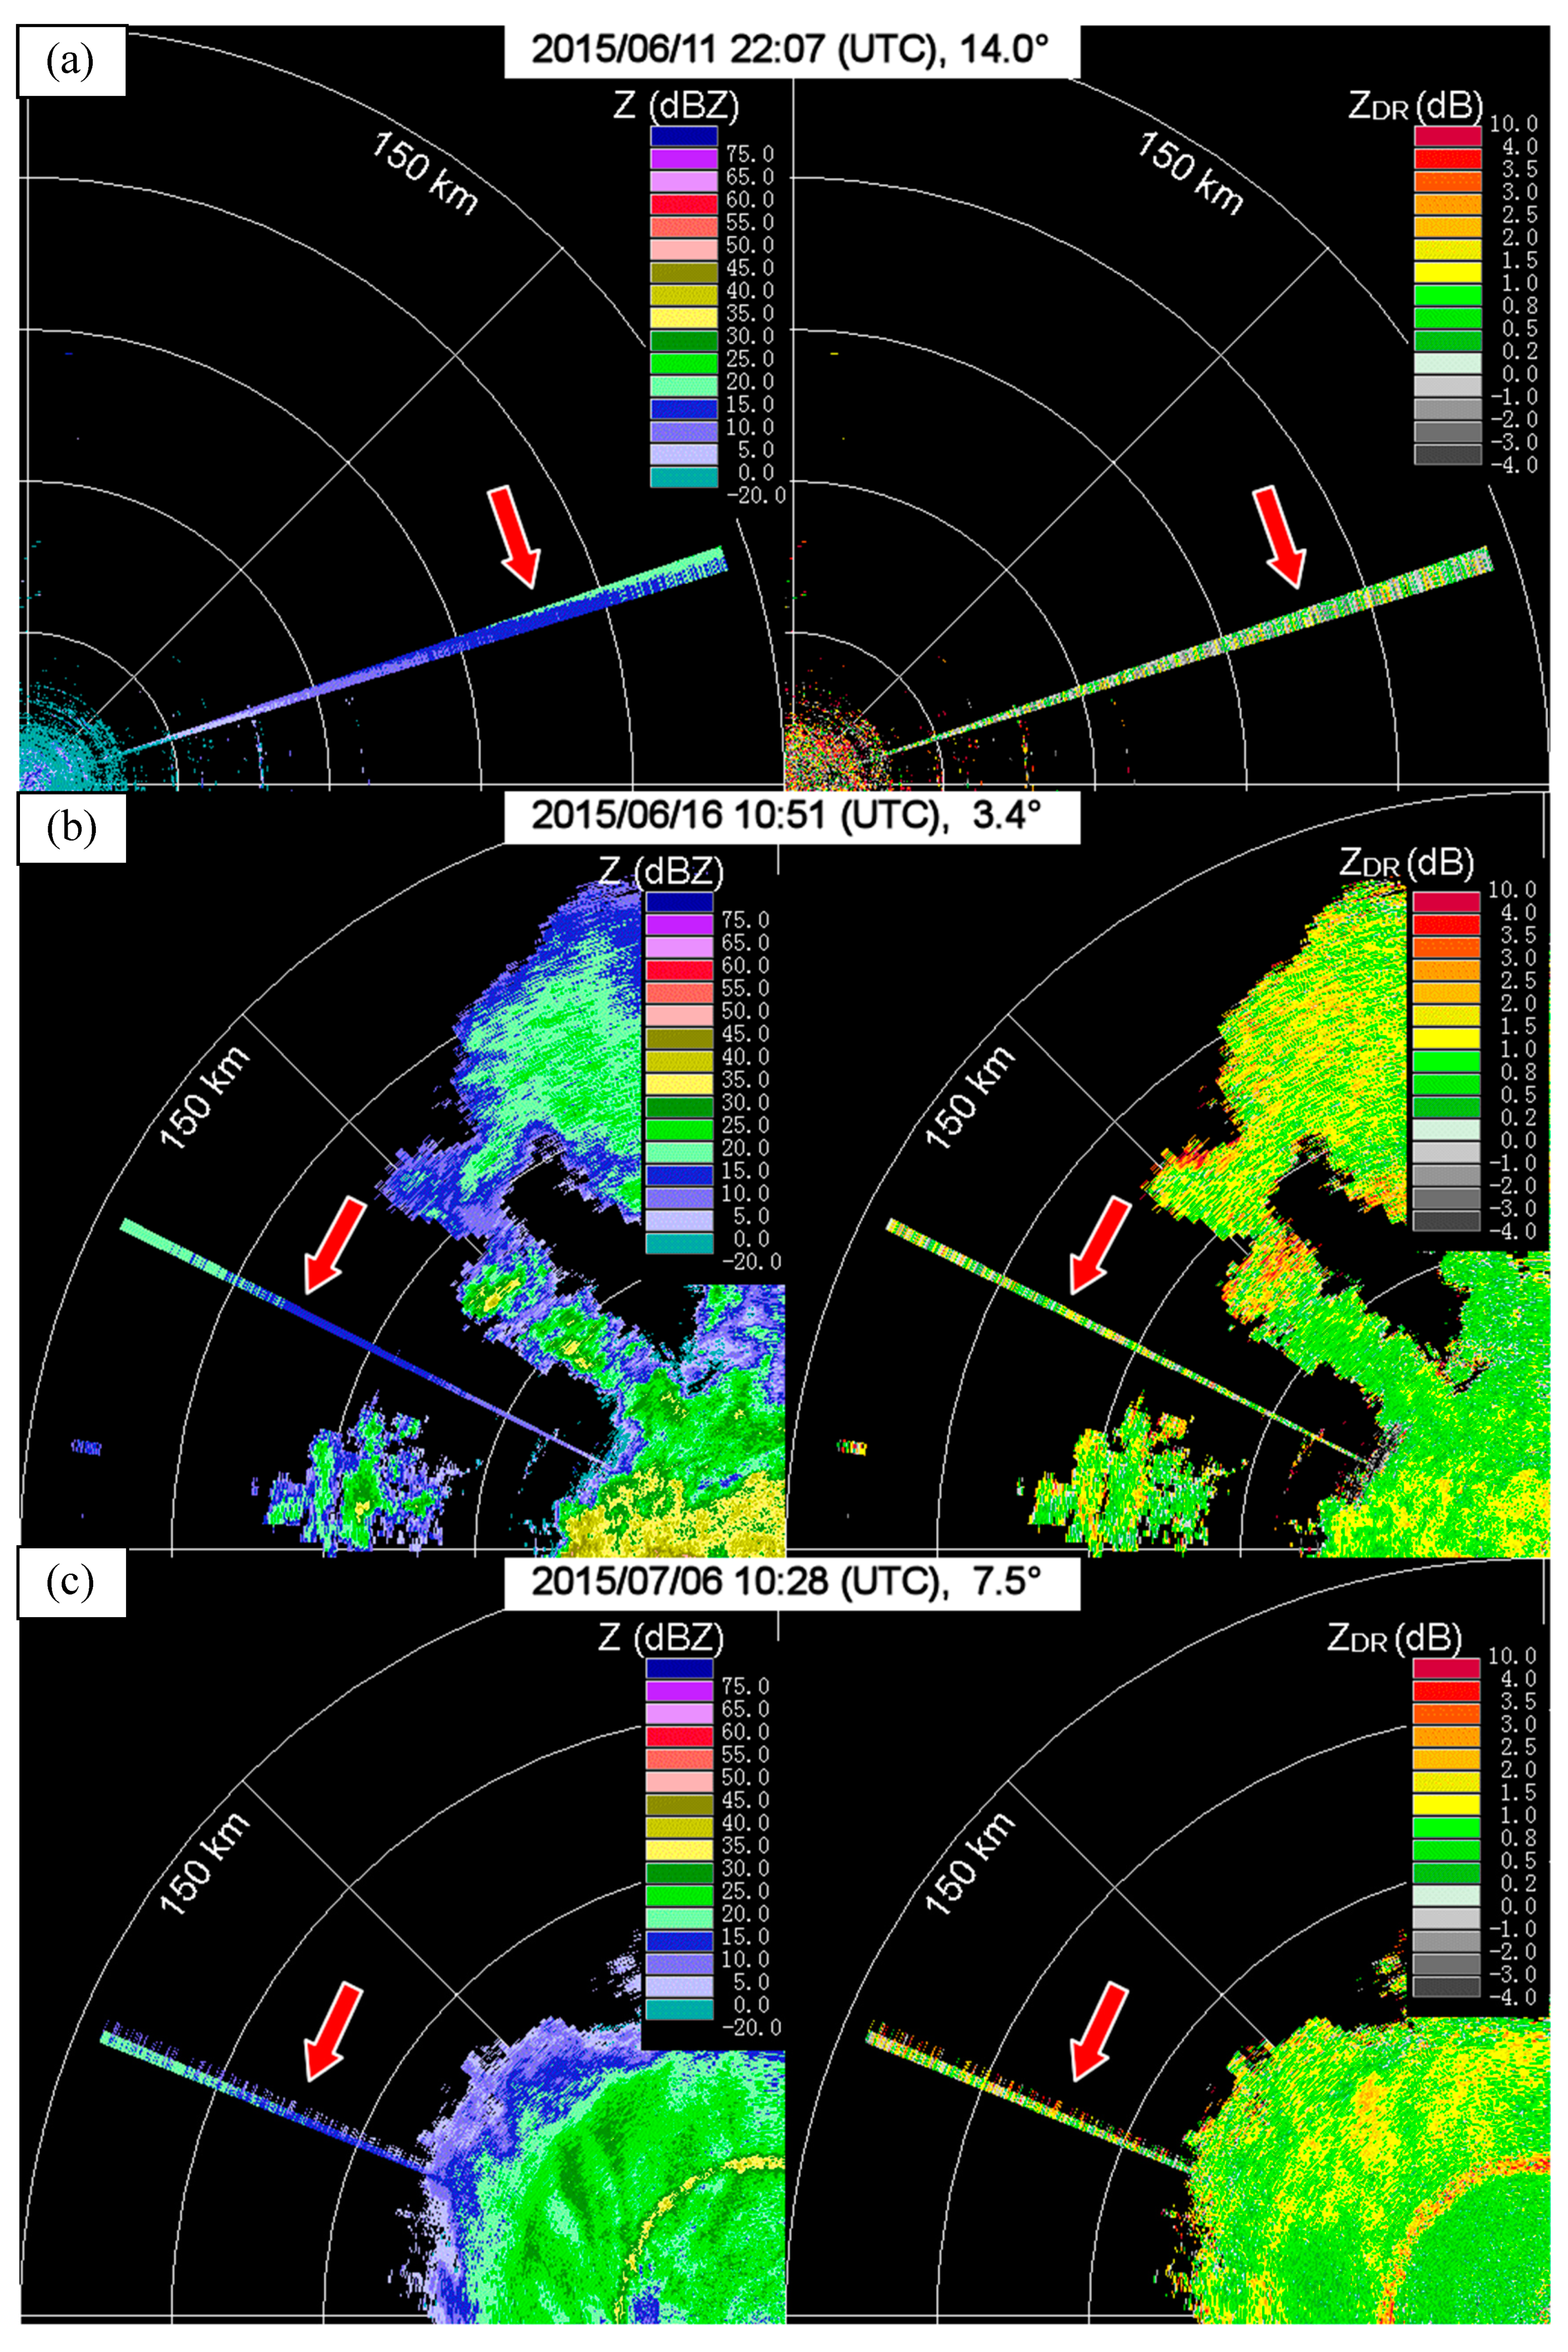
Figure 3 shows the online solar radials observed by NUIST-CDP under a clear sky, weak convective precipitation, and stratiform precipitation. Since the highest elevation angle of the volume scans was 19.5° (see Table 1), the online solar echoes only appeared at sunrise and sunset. From June to August 2015, online solar echoes mainly appeared at 05:00–07:00 and 17:00–19:00 (both local time). The online solar radials appeared near the true angles of the sun, forming one or two adjacent radials. The data for each radial covered nearly all of the distance from the radar to the maximum range, and Z gradually increased with distance due to the range correction of the radar signal processor. ZDR fluctuated around a constant that did not depend on the range. Due to the attenuation at the C-band, the appearance of online solar echoes under precipitation was decided using a combination of the solar flux intensity, rainfall rate, and precipitation area. Online solar echoes sometimes coexisted with precipitation echoes (Figure 3b,c) when the attenuation of precipitation was not strong, suggesting that it is also possible to estimate ZDR bias using online solar echoes under weak precipitation conditions.

Figure 3.
Three cases of online solar echoes. (a) Under a clear sky; (b) under weak convective precipitation; (c) under stratiform precipitation. Online solar radials are indicated by red arrows. Clearly, online solar echoes do not only appear under clear sky conditions but sometimes coexist with weak precipitation.
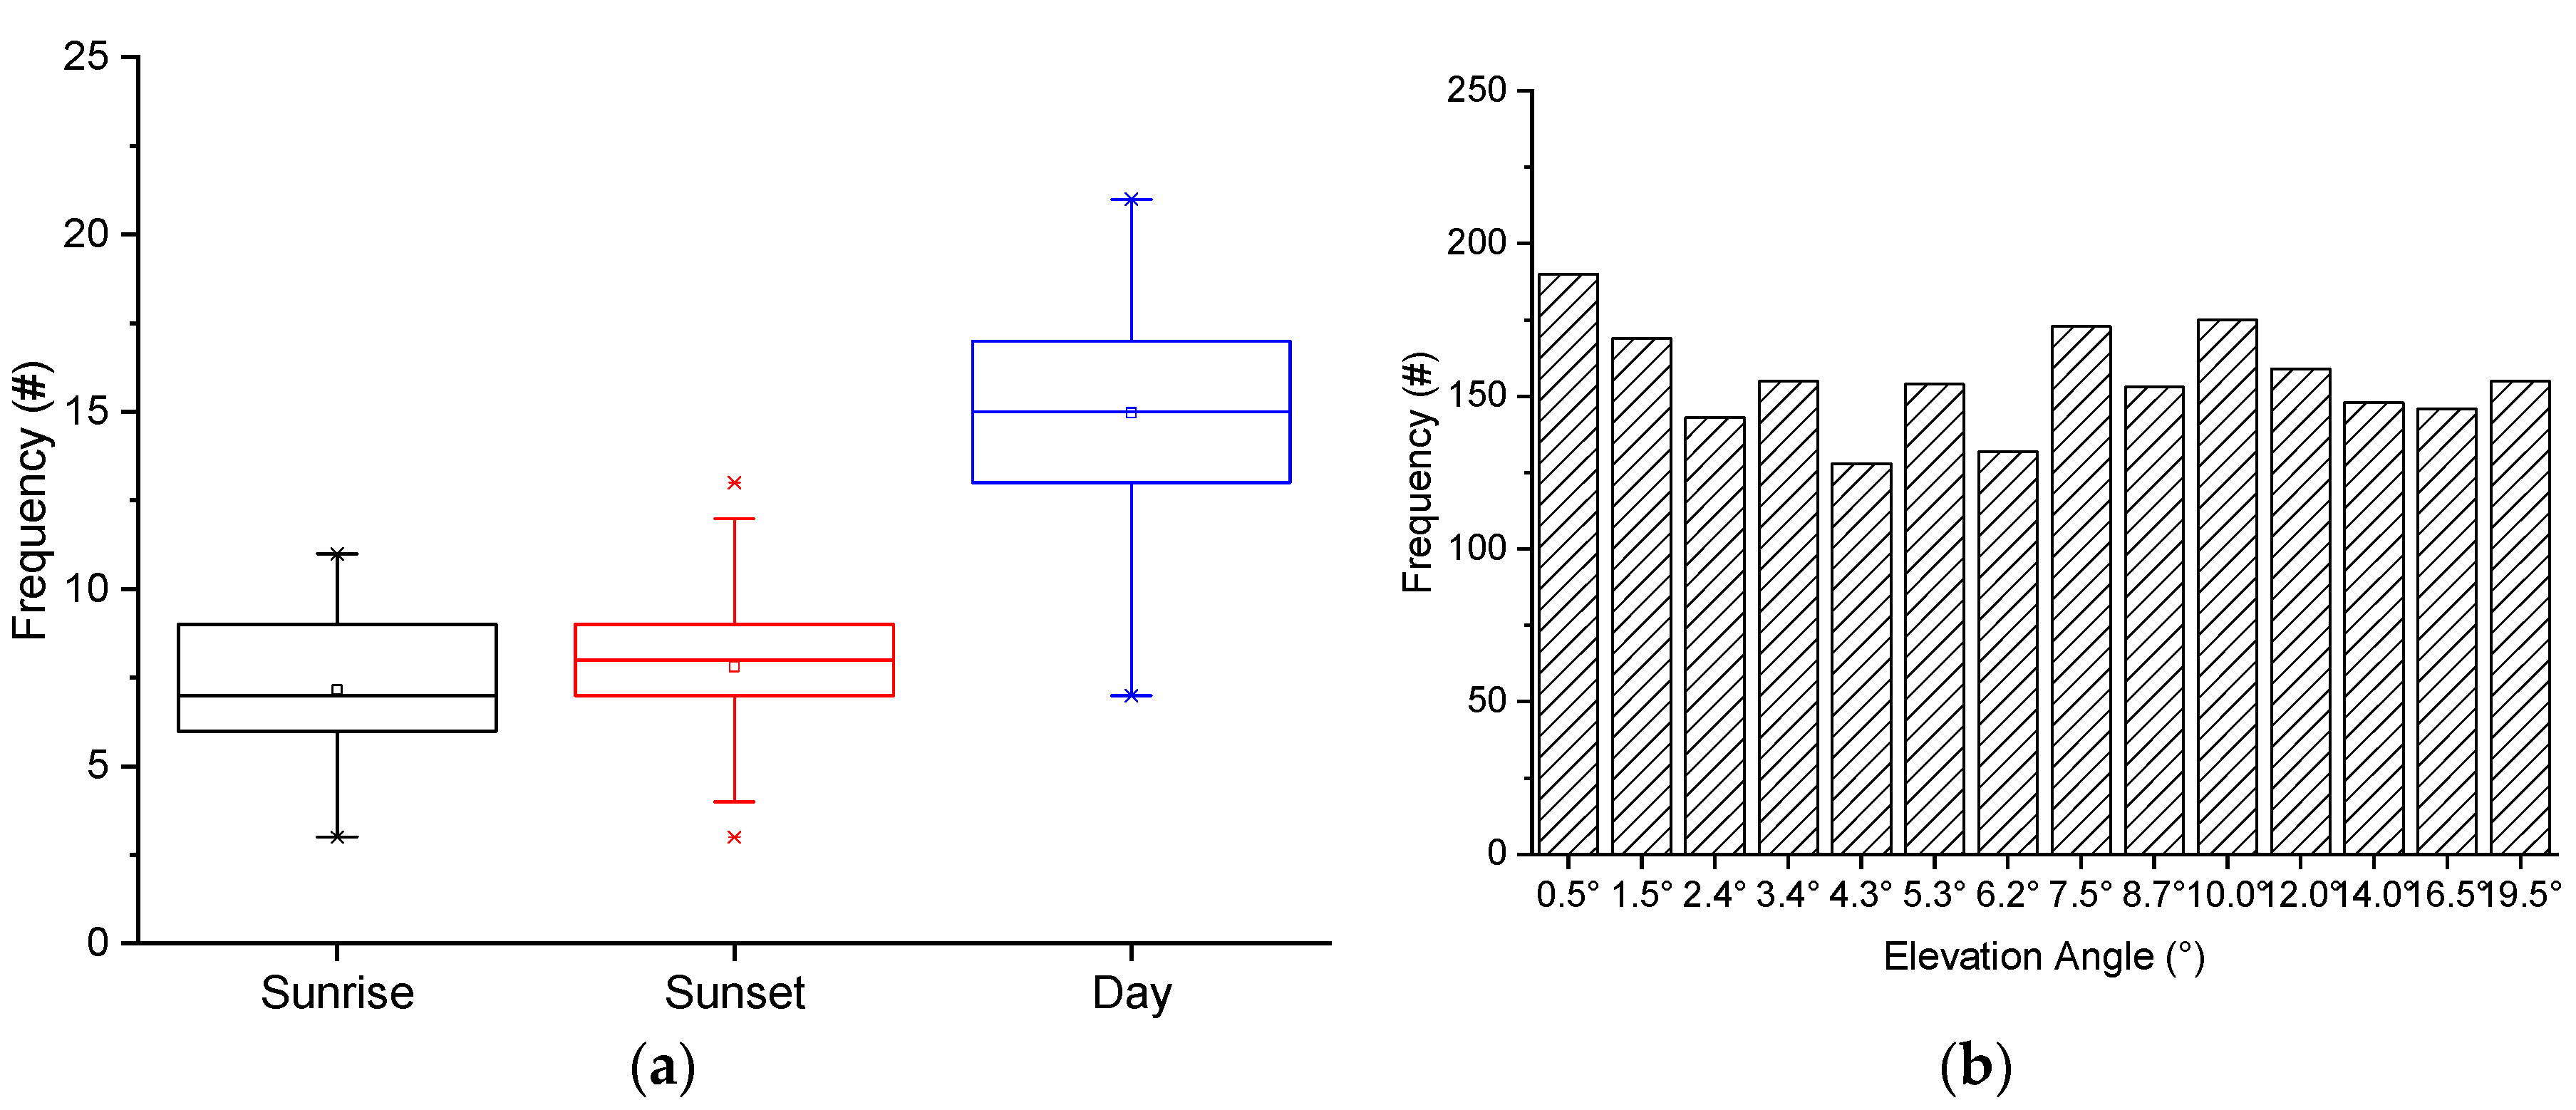
Online solar echoes (also called sun strobes) are commonly seen in volume scans [33]. In the present study, the three-month data were statistically analyzed to determine the frequency of occurrence of online solar echoes in the volume scans. As shown in Figure 4a, the daily average number of volume scans that contained online solar echoes was up to 15, and the minimum number was 7. Over the three months, a total of 1213 volume scans contained solar echoes. The solar and precipitation echoes coexisted in 141 volume scans. Solar radials were almost evenly distributed at each elevation angle, and each elevation angle contained an average of 155 solar radials (Figure 4b). In the NUIST-CDP volume scan data, a certain number of online solar echoes appeared every day, and the number of echoes was similar at all elevation angles. This characteristic was favorable for the continuous monitoring of daily ZDR bias.

Figure 4.
Frequency of occurrence of online solar echoes in the volume scan. (a) Boxplot and (b) frequency distribution with elevation angle. Clearly, online solar echoes occurred very frequently and appeared at a similar frequency at each elevation angle. This characteristic was favorable for the monitoring of daily differential reflectivity (ZDR) bias.
3.2. Characteristics of Online Solar Echoes along the Radial
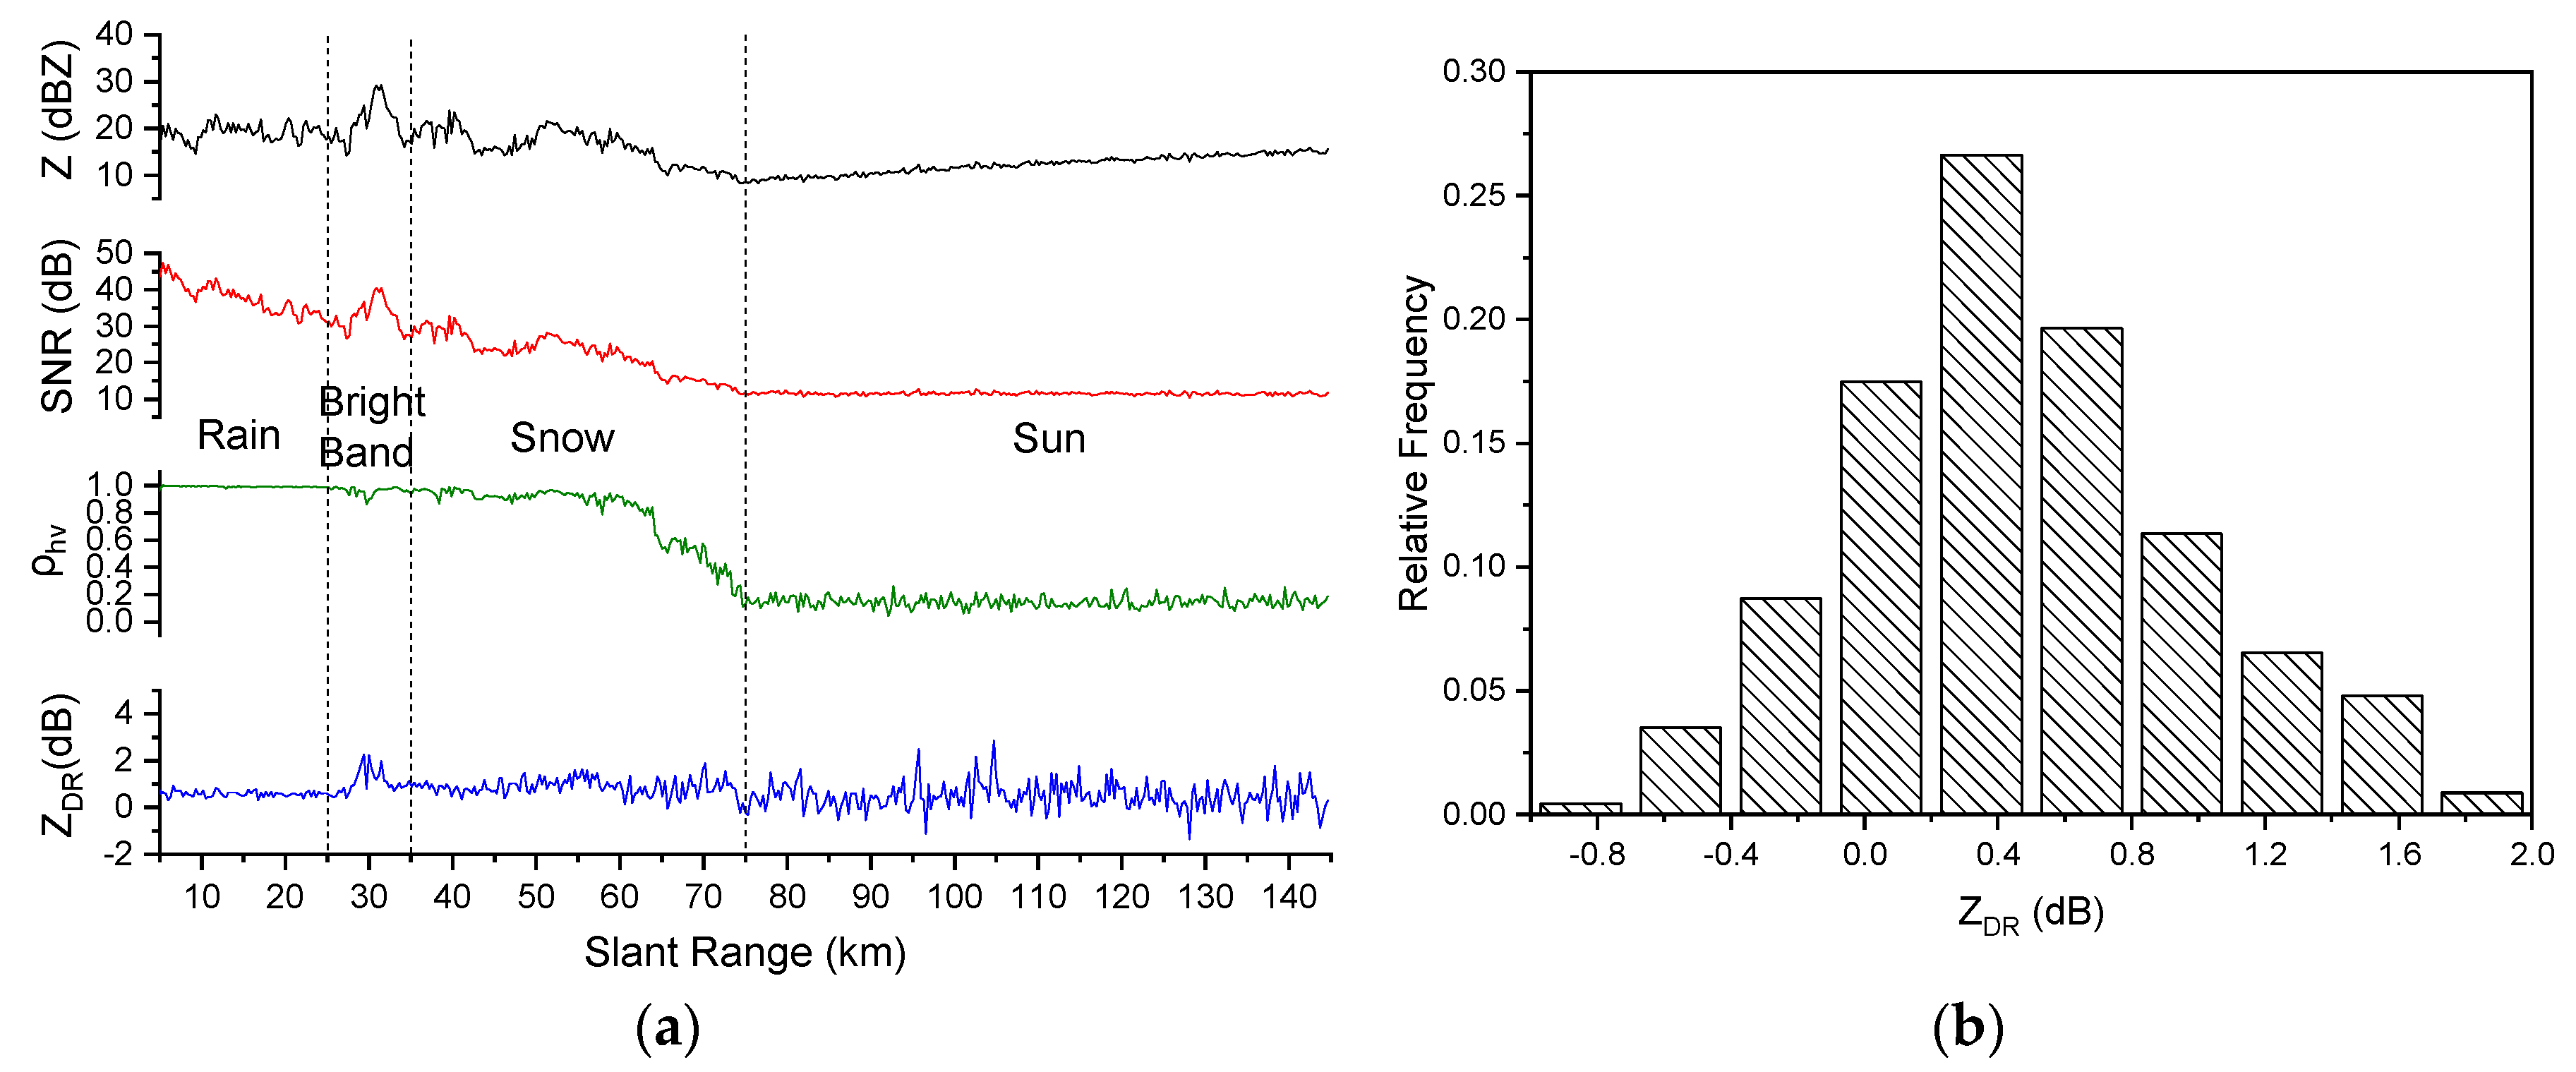
Figure 5 shows a case of an online solar radial that was observed by NUIST-CDP at 10:28 UTC on 06 July 2015. This radial appeared at an elevation angle of 7.5°, and the solar echoes were accompanied by stratiform precipitation with a bright band. Along this radial, there were four types of echoes (divided by three vertical dashed lines in Figure 5a), namely rain, bright band, snow, and sun. In the bright band, was significantly reduced, while Z and ZDR increased. In the rain and snow echoes, increased, while Z and ZDR were reduced relative to bright band echoes. These were typical polarization characteristics of stratiform precipitation. However, the solar echoes (>75 km) were obviously different from those of the meteorological echoes. The electromagnetic waves of solar radiation are continuous waves, and thus solar echoes cover nearly all of the range bins. Moreover, the solar energy in the low atmosphere is nearly constant and is equal between the horizontal and vertical directions. Thus, the ZDR and SNR were unchanged with varying distance, however, they did fluctuate due to the white noise. Solar radiation is randomly polarized and uncorrelated between the horizontal and vertical directions, and is thus very low. As shown in Figure 5b, the histogram of solar ZDR shows an approximately Gaussian distribution, which meant that the method in Section 2.2.3 could be used to avoid noise interference and obtain the optimal estimation.
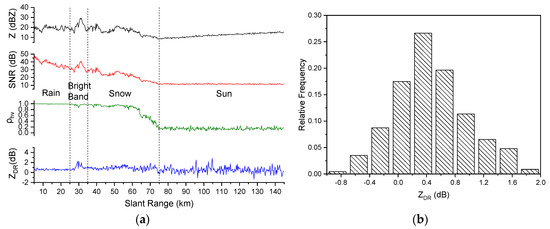
Figure 5.
Distribution of online solar echoes along the radial direction. (a) Range profiles. The characteristics of solar echoes were largely different from those of meteorological echoes. (b) The histogram of solar ZDR. Clearly, the probability density function of solar ZDR shows an approximately Gaussian distribution, which means that the method in Section 2.2.3 could be used to obtain the optimal estimation.
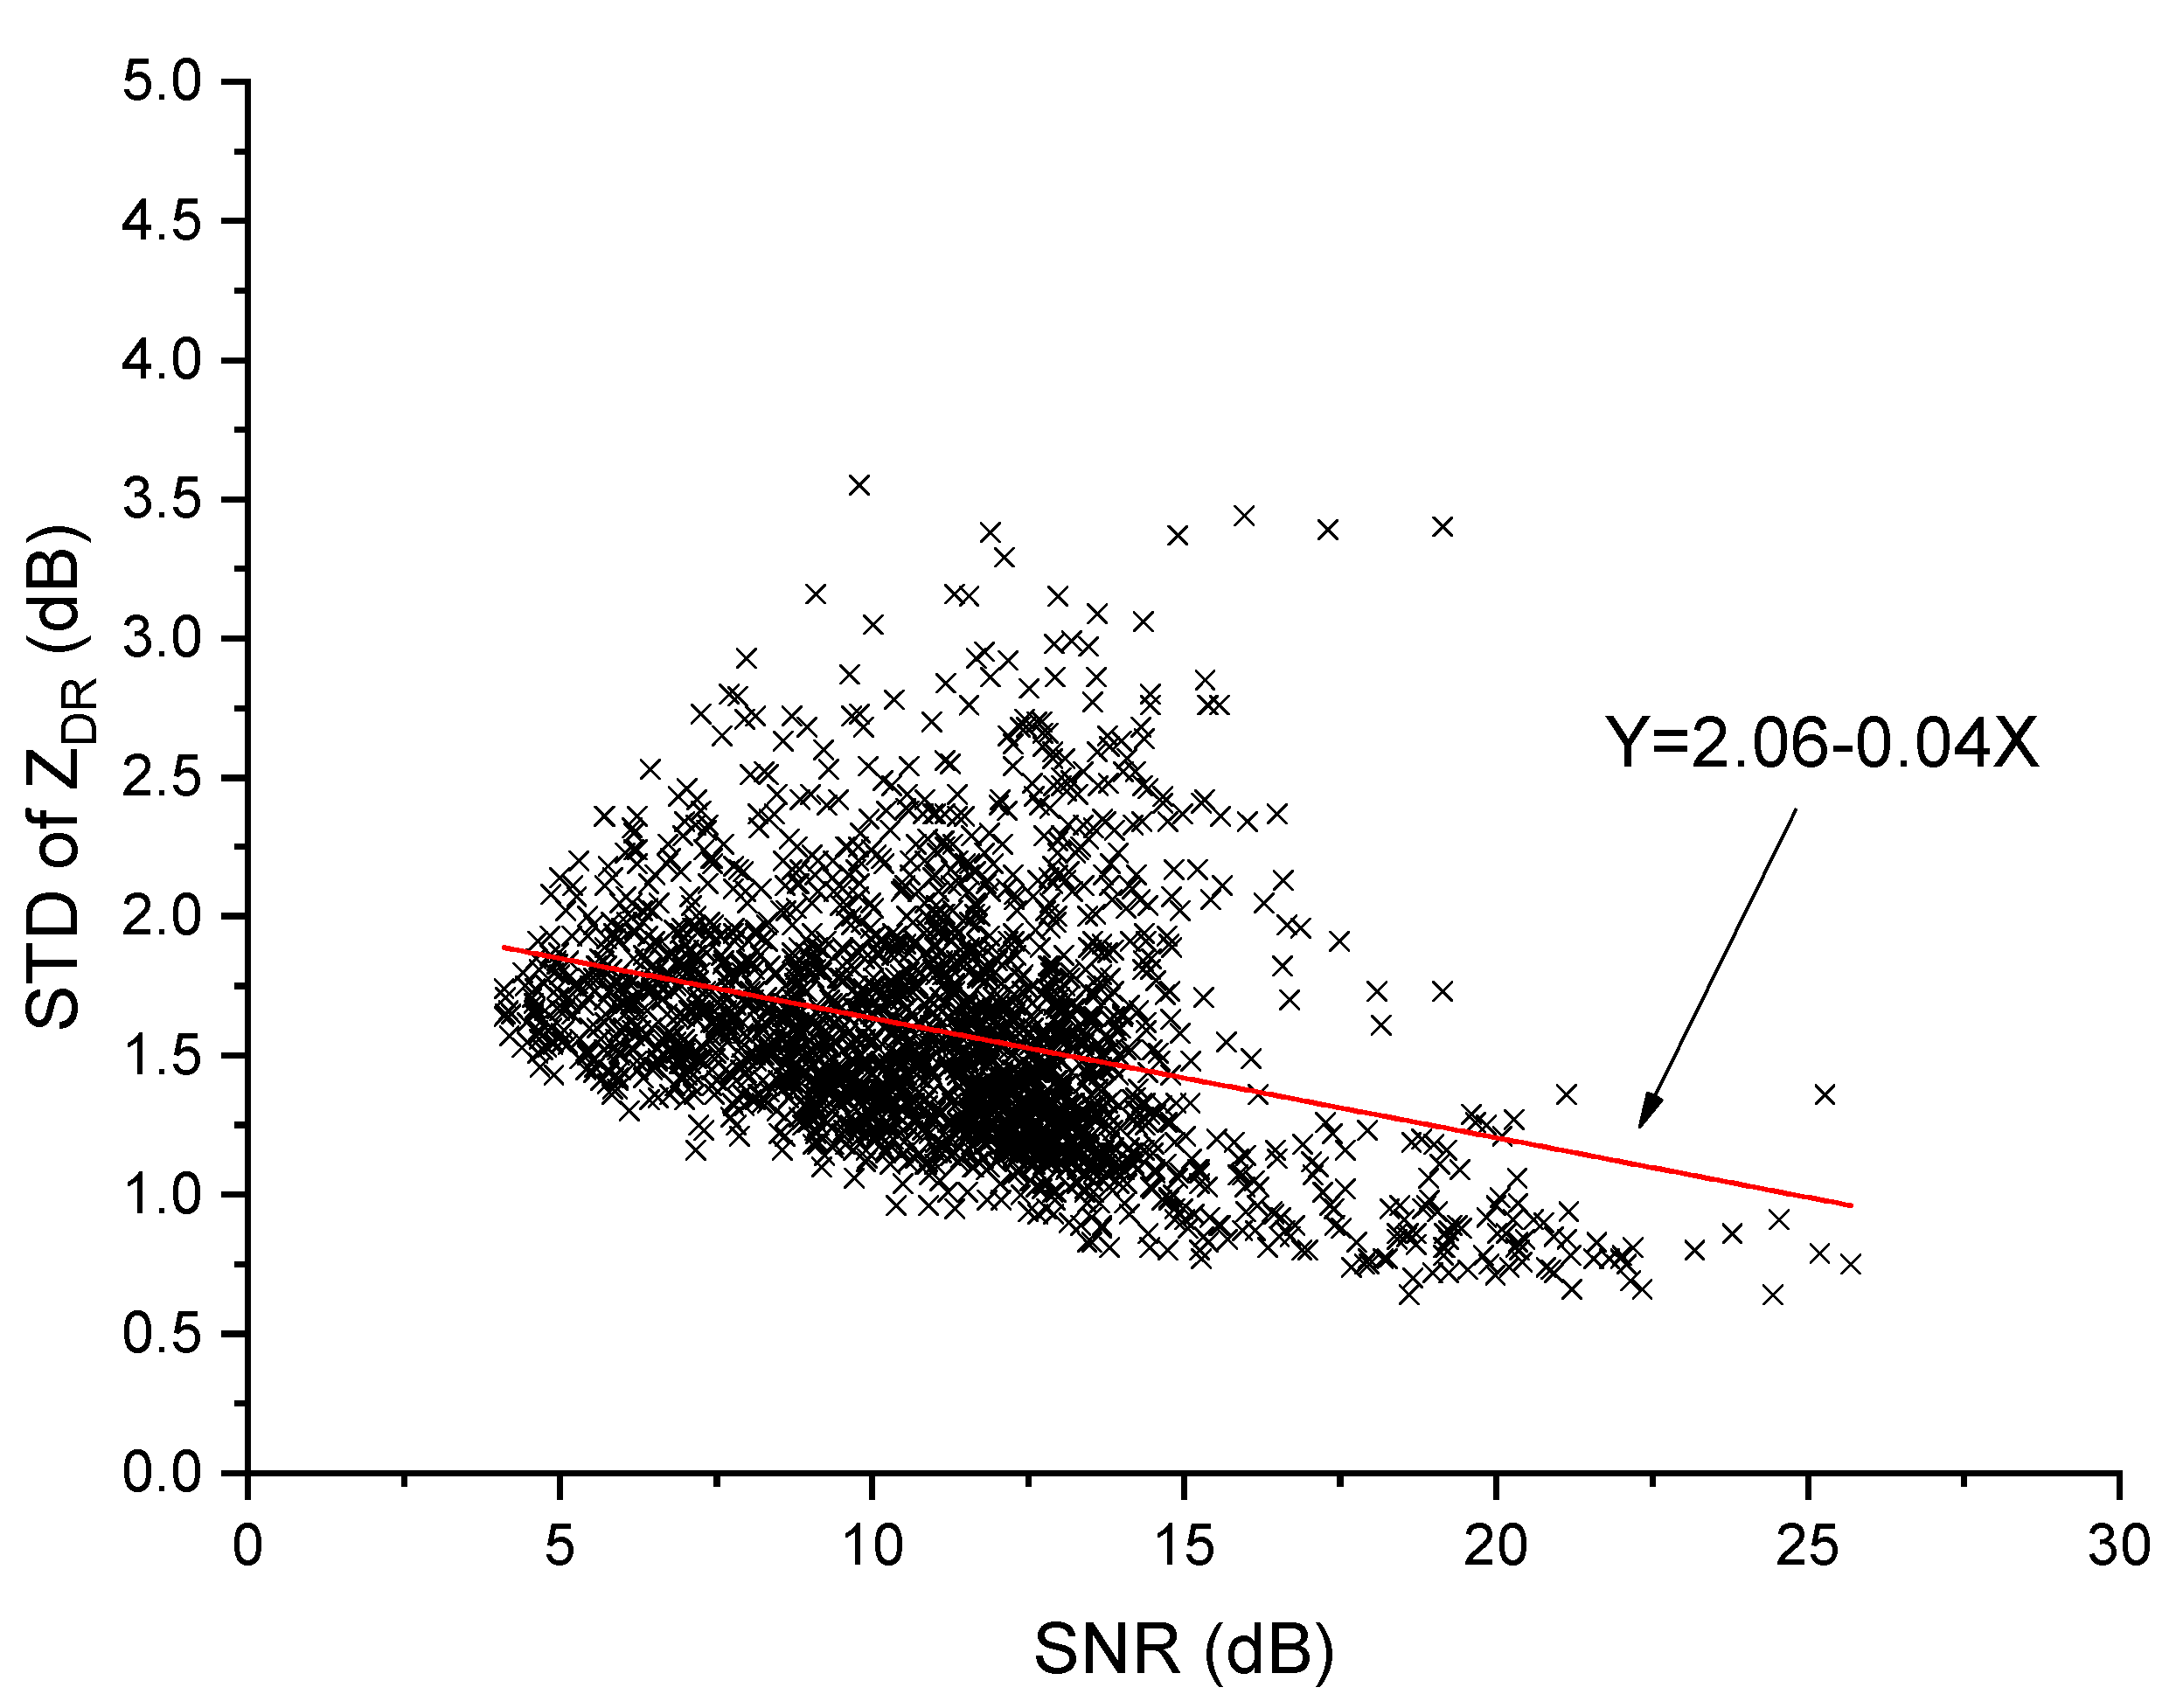
Generally, since the online solar signals were weak relative to the meteorological signals, the ZDR fluctuated (i.e., large standard deviation) under noise interference. The relationship between the noise power and the standard deviation of ZDR is shown in Figure 6. The solar SNR was between 5 and 25 dB. A smaller SNR led to a larger standard deviation of ZDR. The solar SNR and ZDR were almost linearly related, with a slope of –0.04. Since the standard deviation varied with SNR, a simple average of several radials in one day could not produce the optimal estimation of daily ZDR. This problem was solved using Equations (3) to (6).

Figure 6.
The relationship between the signal to noise ratio (SNR) and the standard deviation of ZDR. Thus, the variance caused by noise should be considered in the estimation of the solar ZDR.
3.3. Distribution within the Main Beam
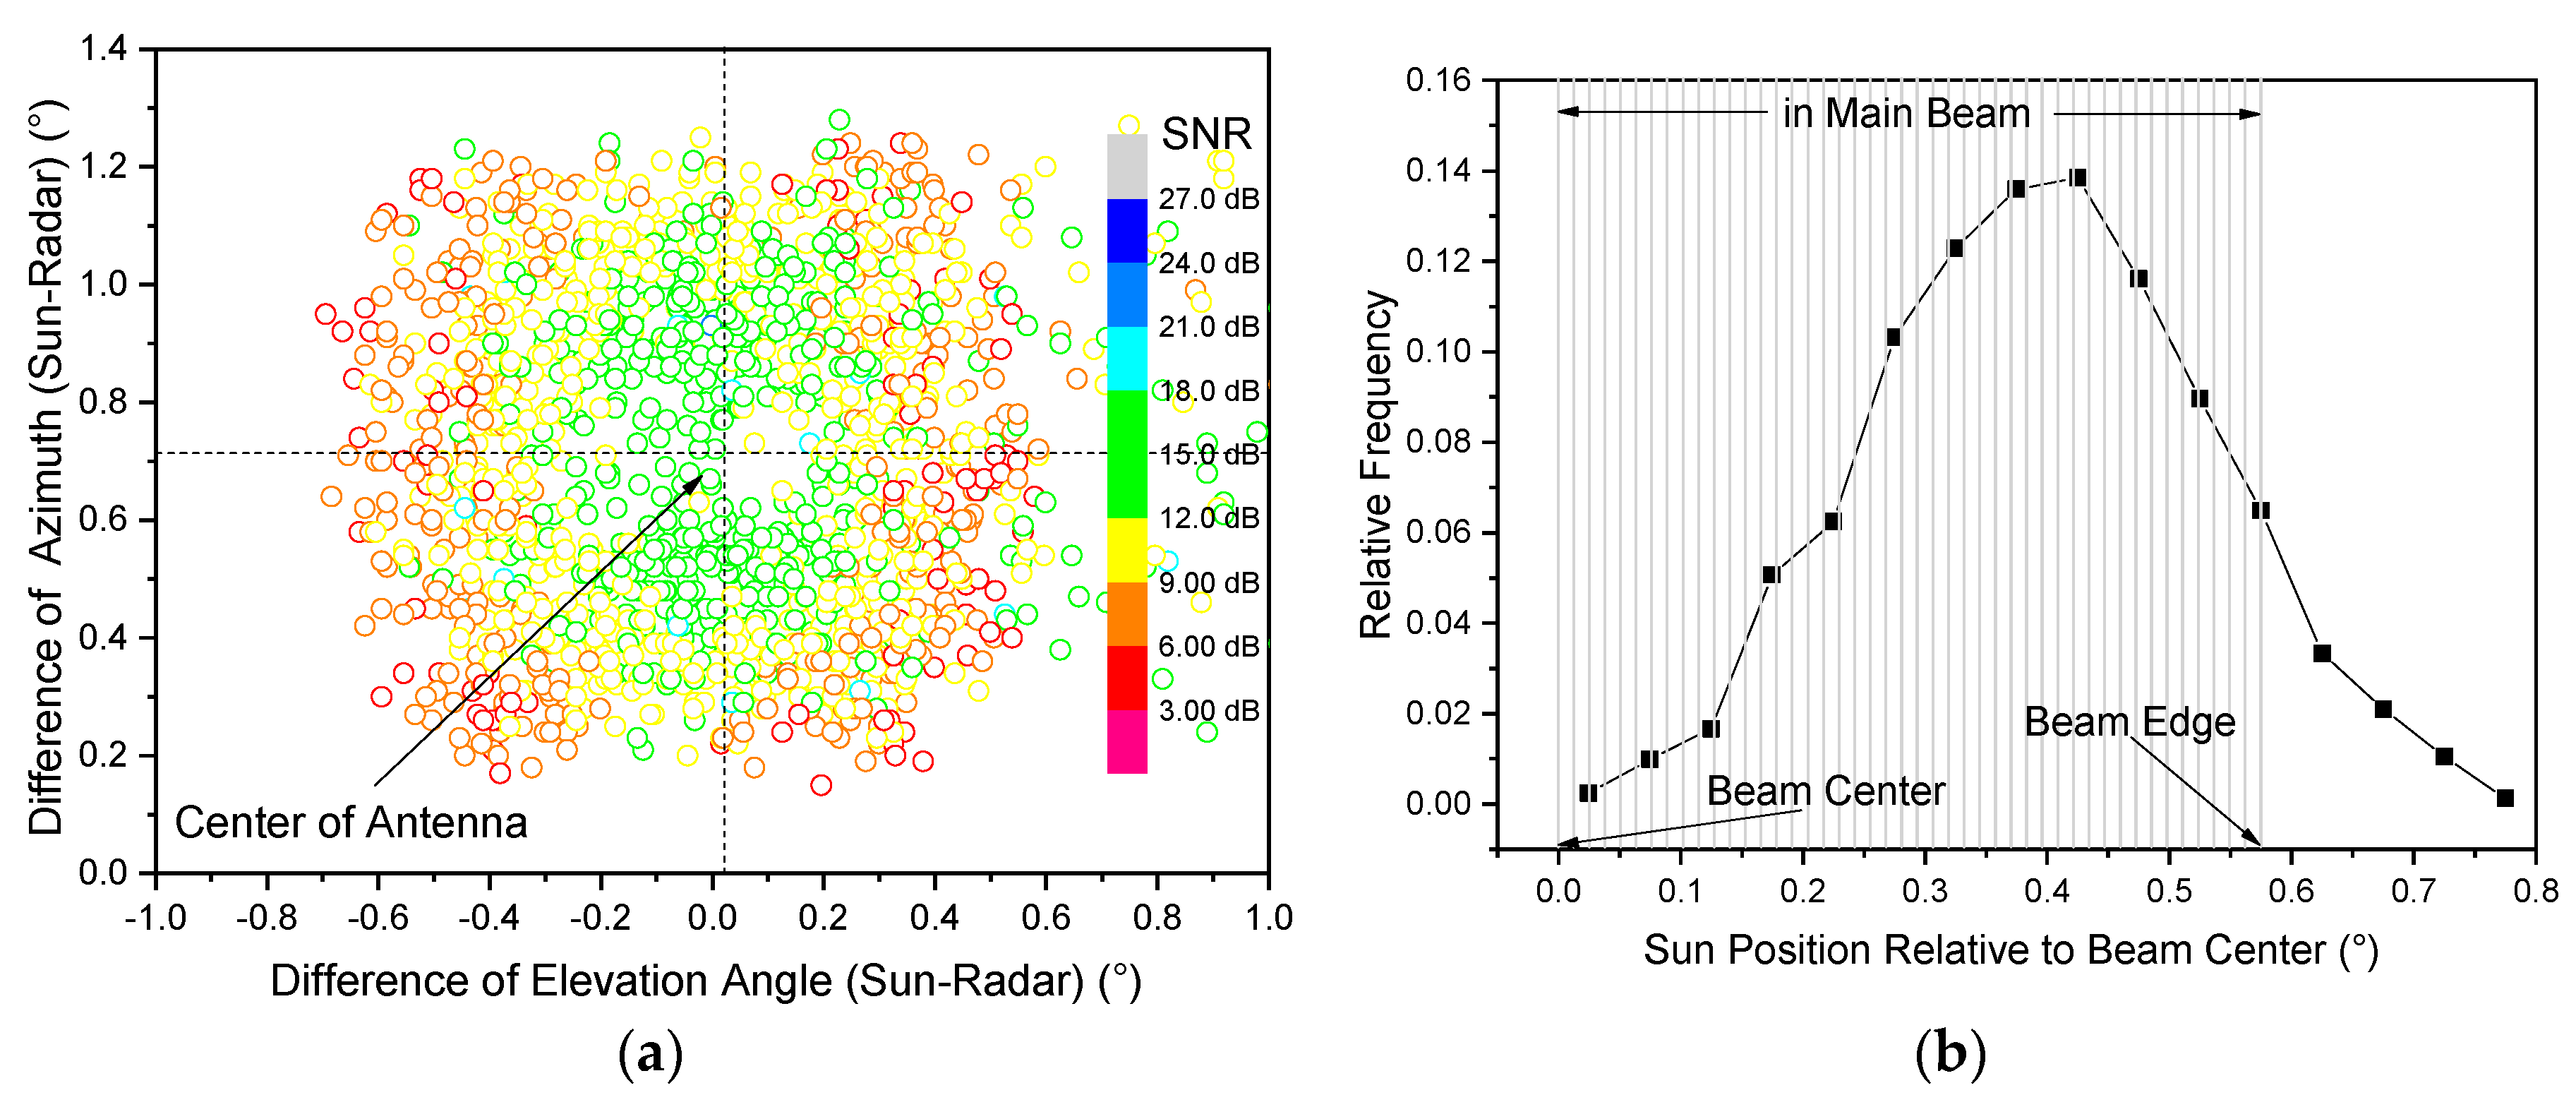
The radar antenna gain is not uniform in the main beam, with the gain maximum at the center and decreasing outwards. The offline solar method repeatedly searches for the maximum signal, so that the offline solar signals can enter the radar from the center of the main beam with maximum gain. However, the fact that online solar echoes were observed during the volume scan shows that the solar signals do not always come from the center of the main beam. The solar SNR was observed to be lower than the offline solar signals, which led to a larger variation of solar ZDR (Figure 6). Figure 7 shows the distribution of the online solar signal relative to the center of the main beam. In Figure 7a, the intersection between the two dashed lines shows the center of the main beam, and the different colored points represent different SNRs. Clearly, SNR was correlated with the distance from the beam center, with SNR reducing with increasing distance. Moreover, the fact that a lower point density was observed at the center of the main beam indicates that only a small number of online solar signals came from the center of the main beam. As shown in Figure 7b, the distance of the online solar signals from the center of the main beam approximately obeyed a Gaussian distribution, with the largest frequency appearing at 0.4–0.45°. The 3 dB main beamwidth of NUIST-CDP was 0.54°, and during the scanning of one radial the antenna rotated by 0.60° (azimuth resolution); thus, the main beam coverage was 1.14° and its half-width was 0.57°. As is evident from Figure 7b, the majority of online solar signals entered the antenna from the edges of the main beam and the SNR was lower than that of the offline solar signals. Thus, Equation (5) was proposed and used to estimate daily ZDR bias. Specifically, the echoes closer to the center of the beam were assigned with larger weight, which made the results more reliable.

Figure 7.
(a) Position and SNR of online solar signals relative to the center of the main radar beam. The intersection of the two dashed lines represents the center of the main beam. Clearly, the online solar signals rarely enter the antenna from the center of the main beam, and the SNR is larger closer to the center. (b) Distribution of the position of the online solar signals relative to the center of the main beam. Clearly, the majority of the solar signals came from the edges of the main beam, and the SNRs of the solar signals are lower than those of the offline solar signals.
3.4. Comparison with the Vertical Pointing Method
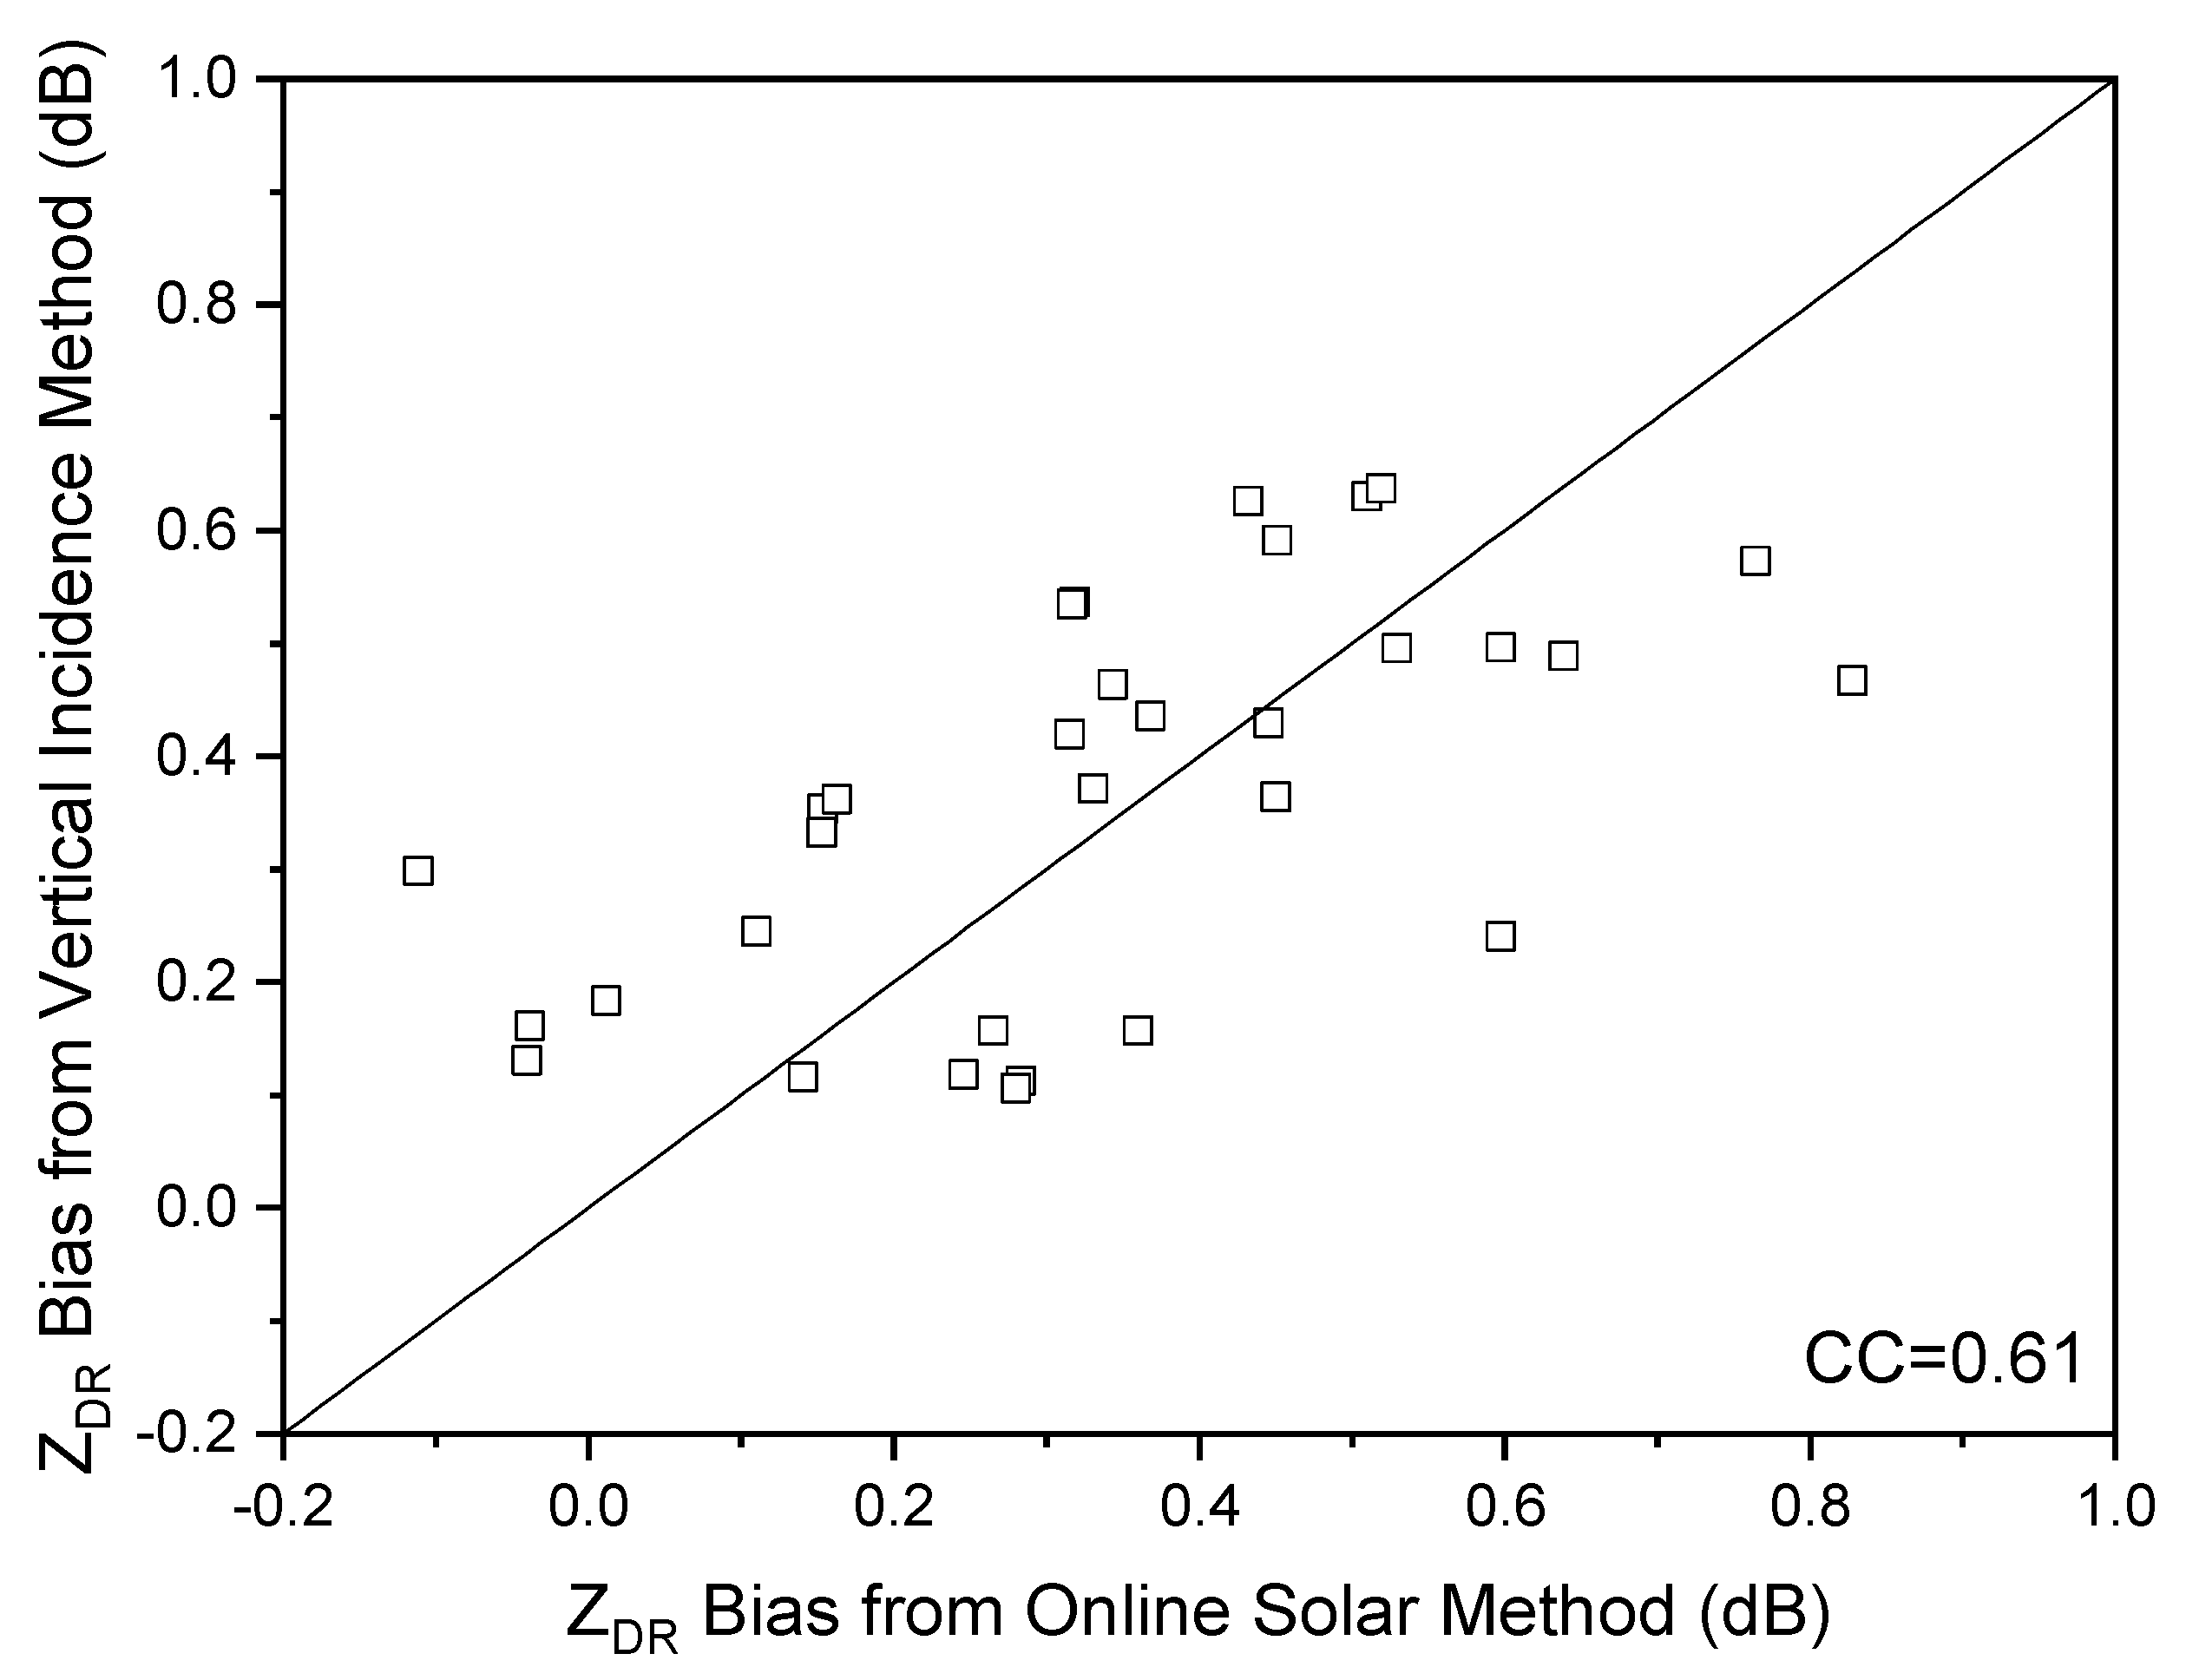
When stable precipitation occurred directly above the radar, the vertically observed ZDR could be used to reliably calibrate ZDR bias. Therefore, the accuracy of the online solar method could be validated by comparison with the vertical pointing method. The processing of vertical pointing data was introduced in Section 2.3. As shown in Figure 8, the daily ZDR biases of the two methods were highly consistent, with a correlation coefficient of 0.61, which indicates that the proposed method could reasonably represent the ZDR bias. The vertical pointing method obtained the full-path bias, while the online solar method estimated the receiving-path bias. For STSR radars, the transmitted power is split into two channels (H and V) for transmission, and the transmitting-path bias is unaffected by the fluctuation of the transmission power. Therefore, the mean difference of 0.05 dB between the vertical pointing method and the online solar method could be regarded as transmitting-path bias [20]. The standard deviation of the differences (0.184 dB) can be considered as the precision of the online solar method. The results from these two methods can be acquired simultaneously only on rainy days, but a comparison between these two methods contains uncertainty, due to factors such as differential attenuation correction error, wet radome attenuation [34], and low SNR of solar echoes. Thus, despite the evident linear relationship, the correlation coefficient was not very high.

Figure 8.
The daily ZDR bias of the online solar method and the vertical pointing method. The results show that the results of the proposed method were correlated with those of the traditional vertical pointing method.
3.5. Variation in Daily ZDR Bias
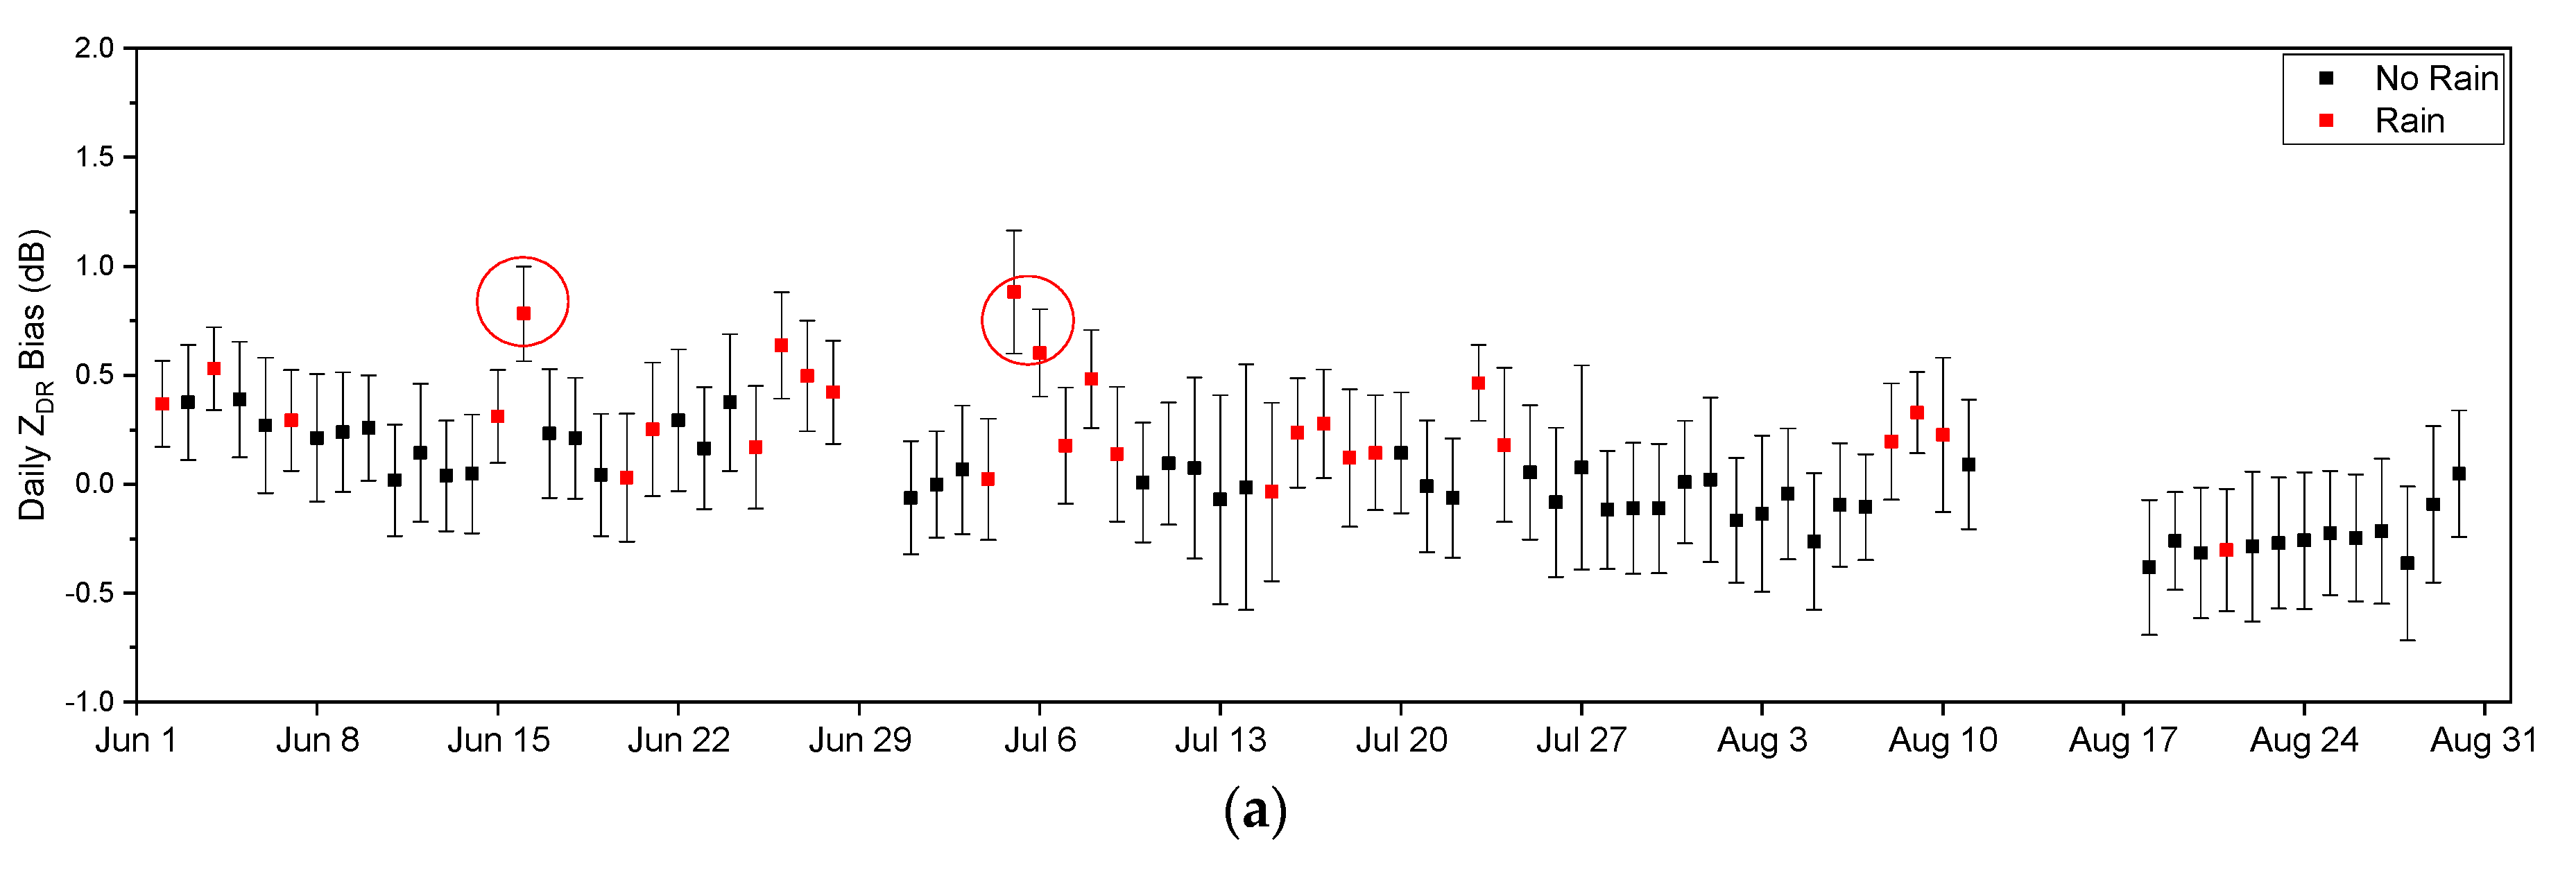
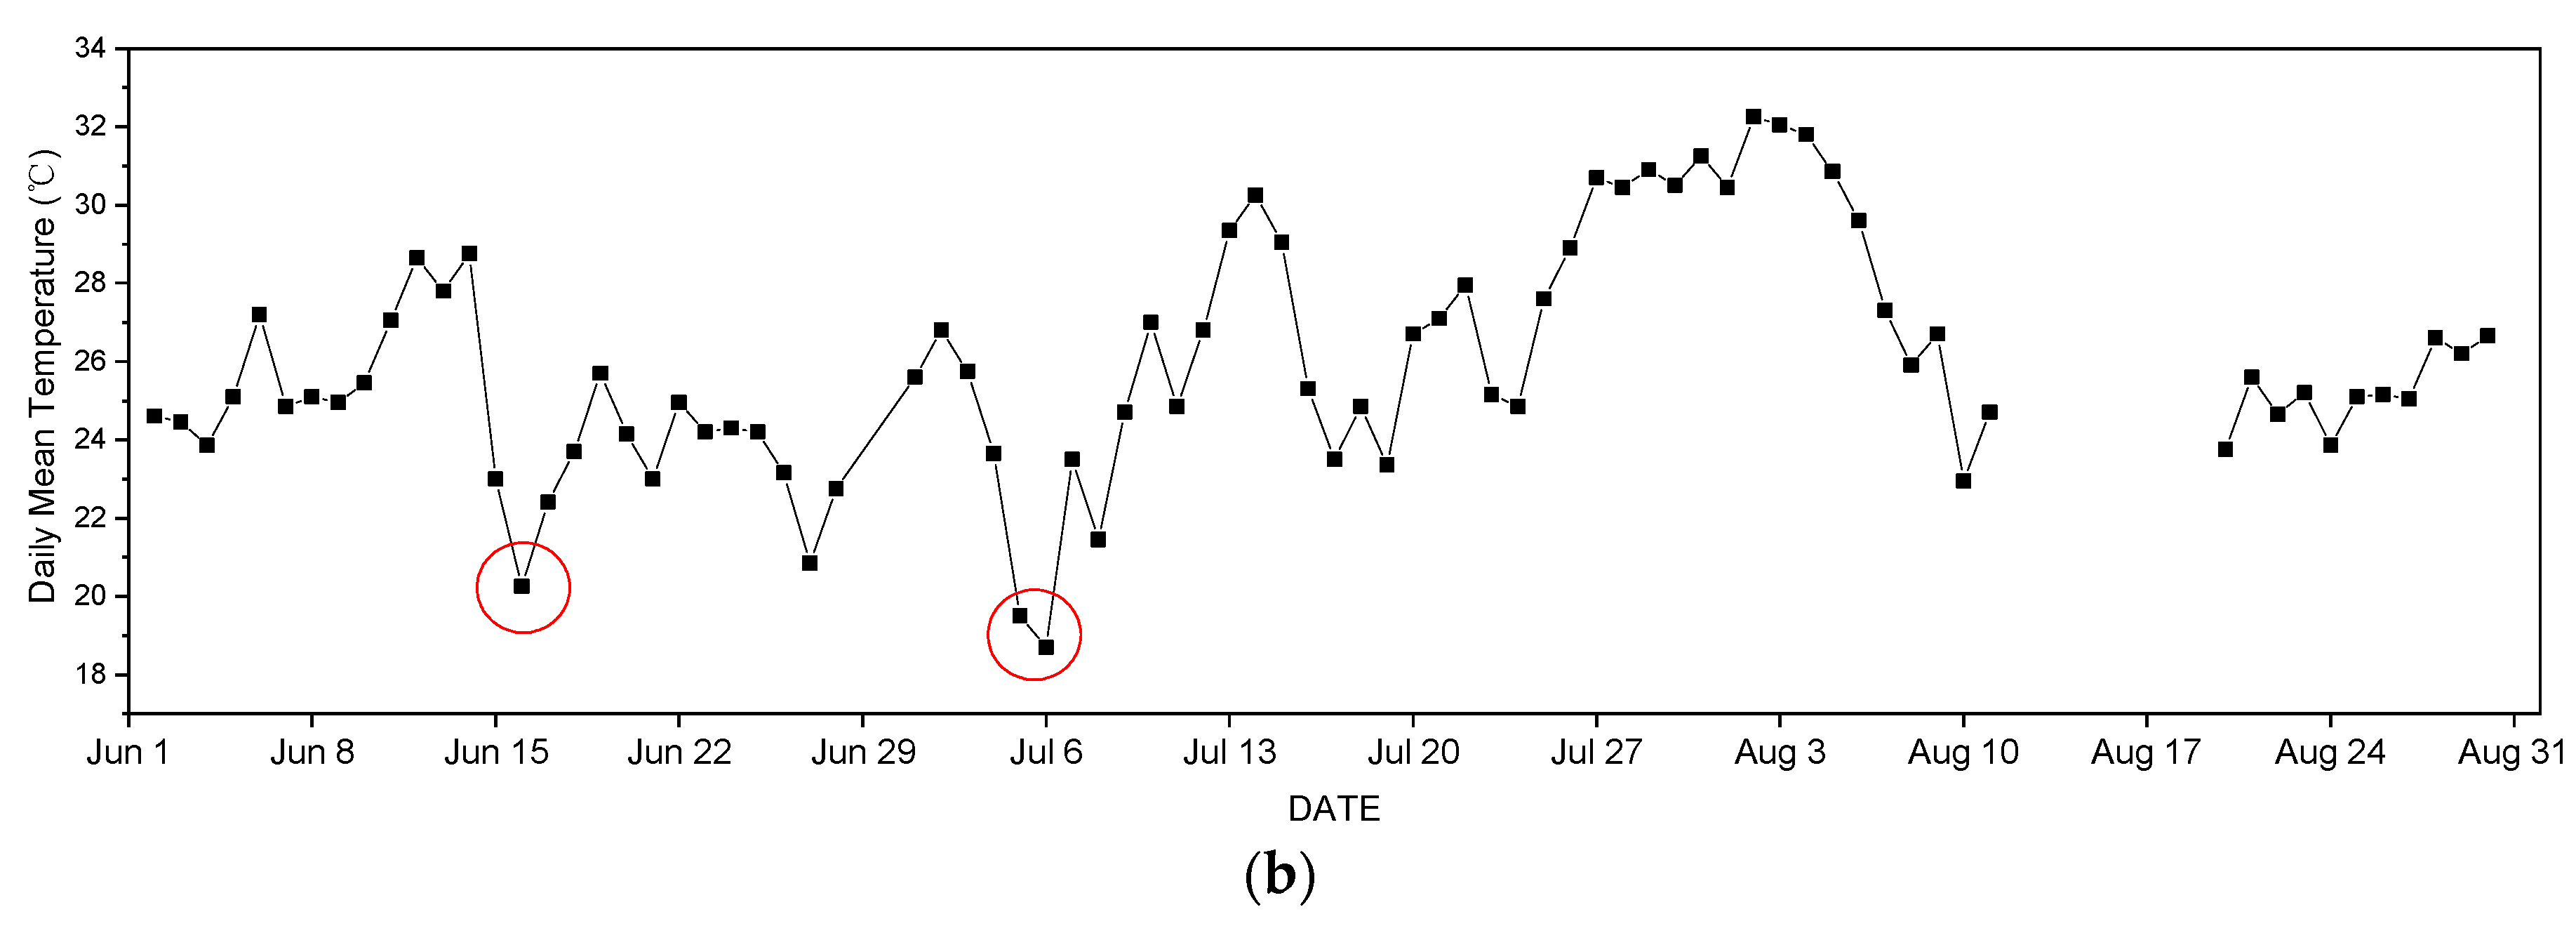
Except for two missing periods between June and August 2015 (29–30 June and 12–17 August), online solar echoes were observed every day. The daily ZDR bias of NUIST-CDP was not constant, but was rather time-variant and significantly fluctuating, as shown in Figure 9a. Especially, ZDR bias significantly increased on 15 June and 06 July. As shown in Figure 9b, such abnormal change of bias was related to a sudden drop in temperature. More discussion can be found in Section 4.1. The traditional methods are limited by certain prerequisites and were incapable of detecting the tendency of daily ZDR bias. This highlights the advantages of the online solar method. The reason for the variation of ZDR bias is complicated, however the main factor may be ambient temperature.
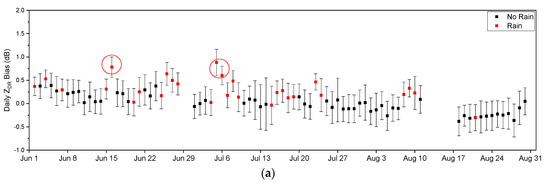
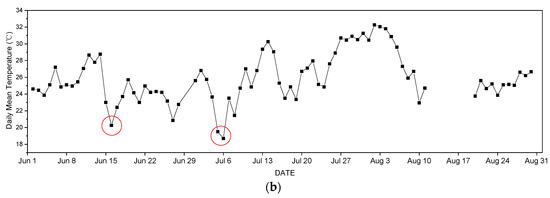
Figure 9.
(a) Daily ZDR bias of NUIST-CDP and (b) daily mean temperature for three months.
3.6. ZDR Correction Cases
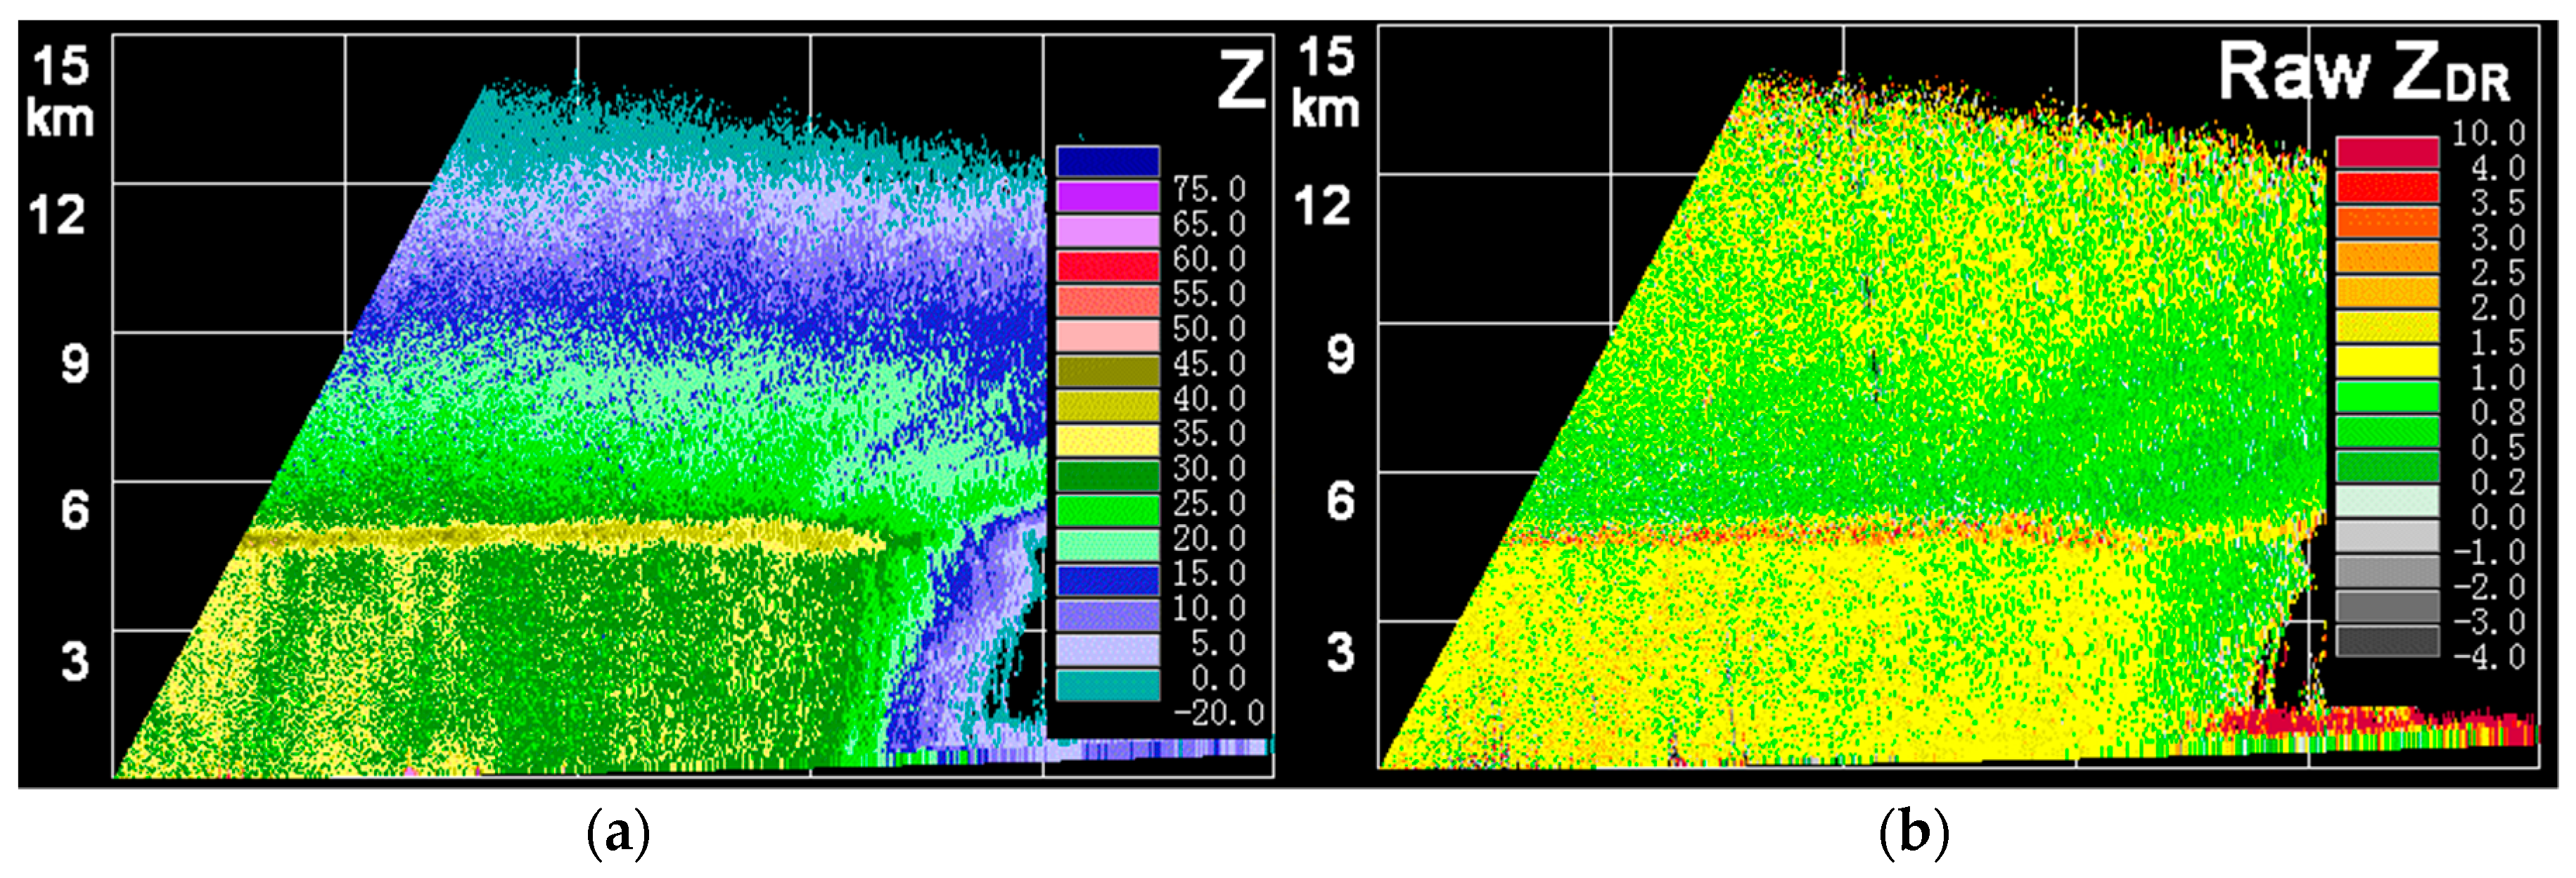
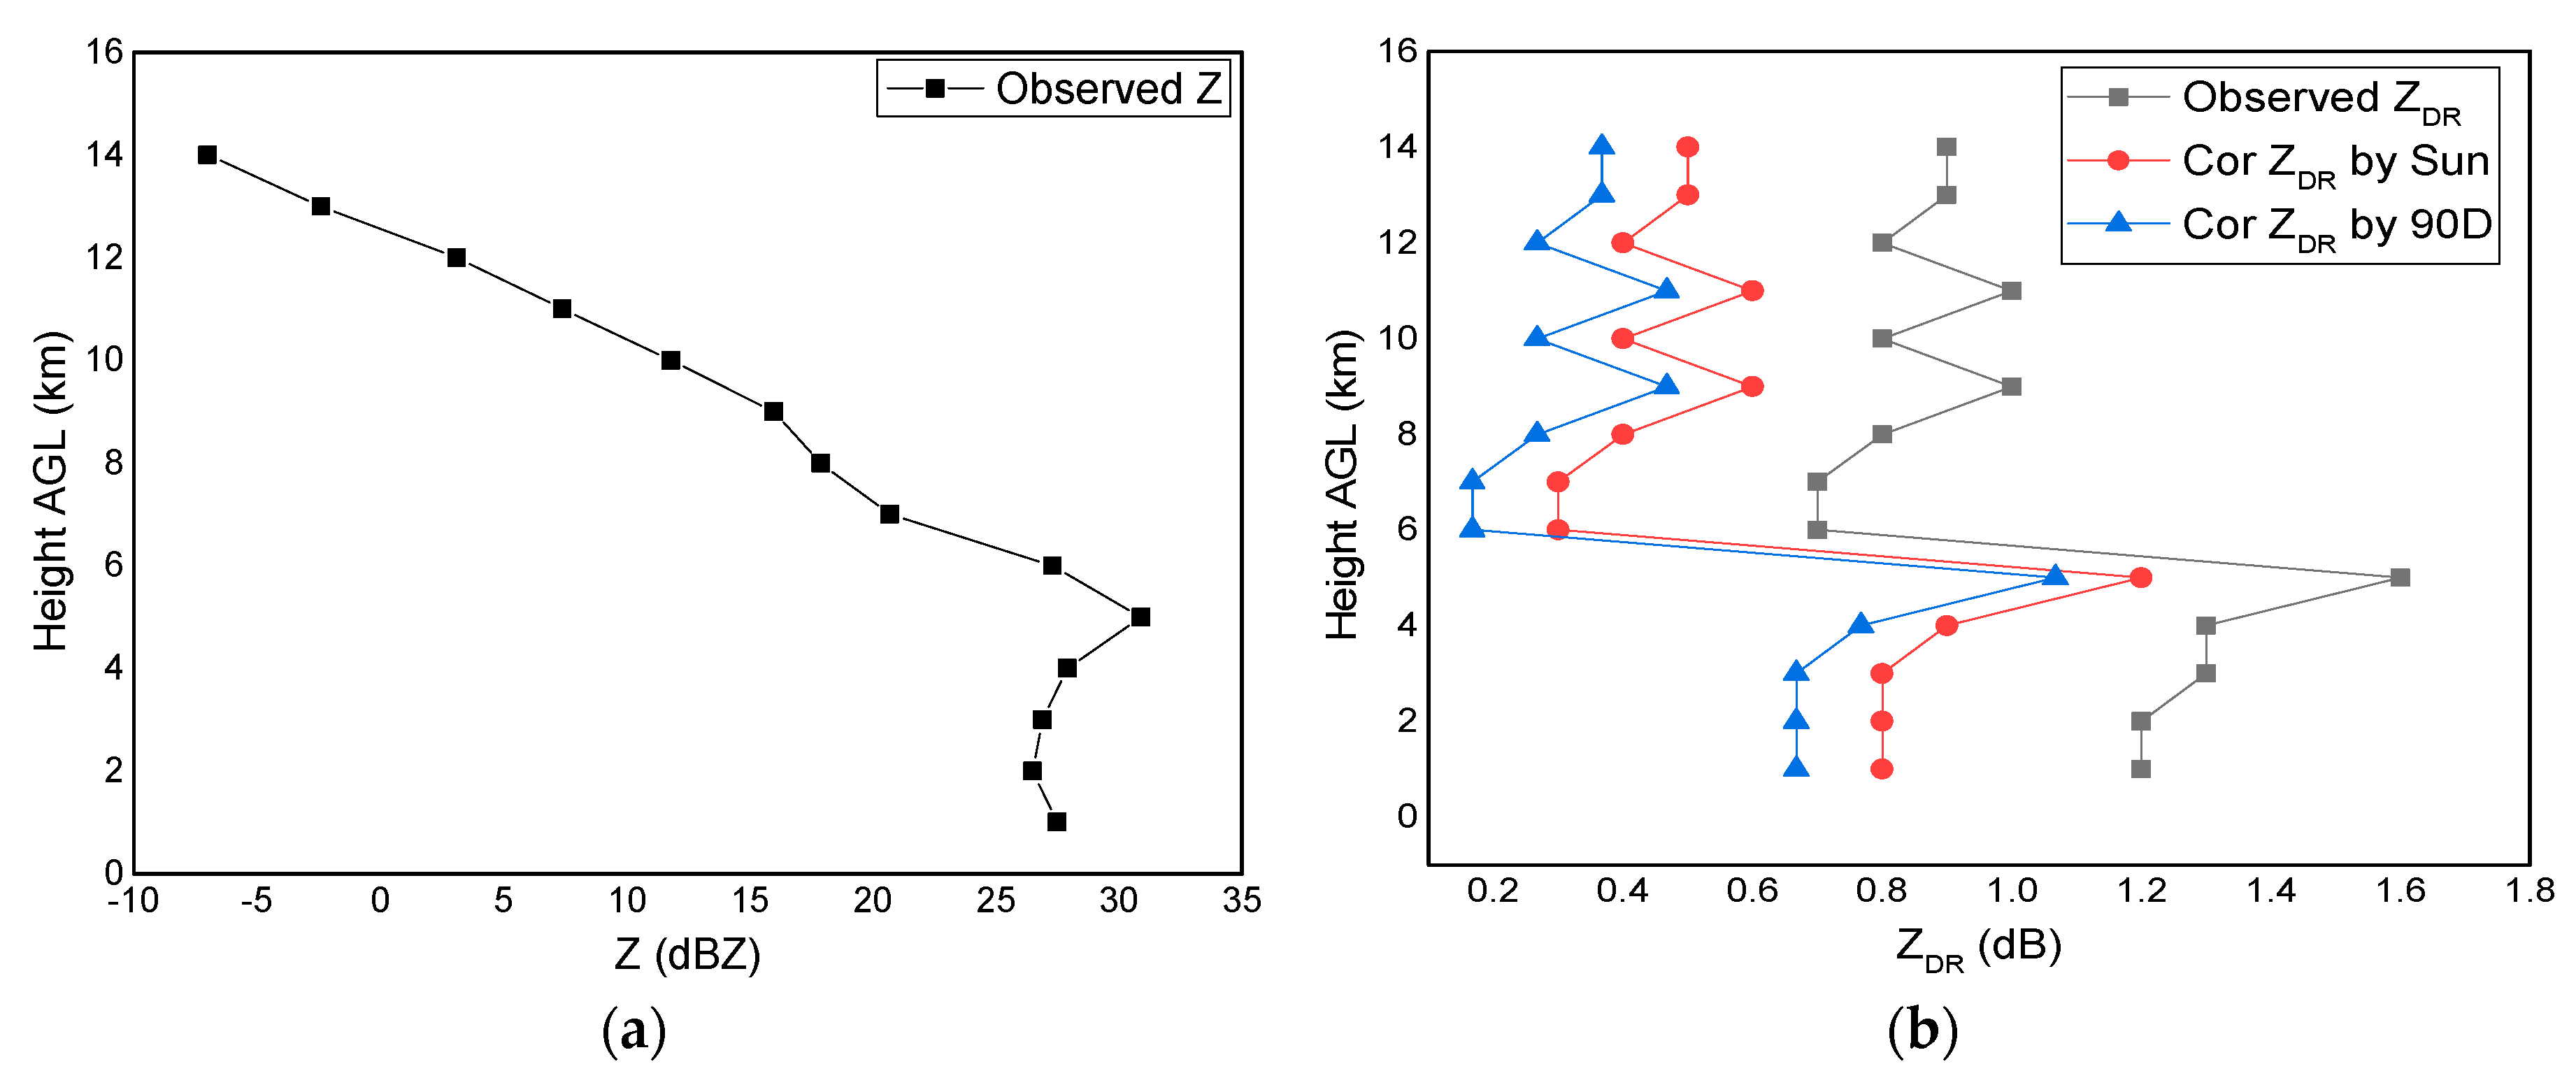
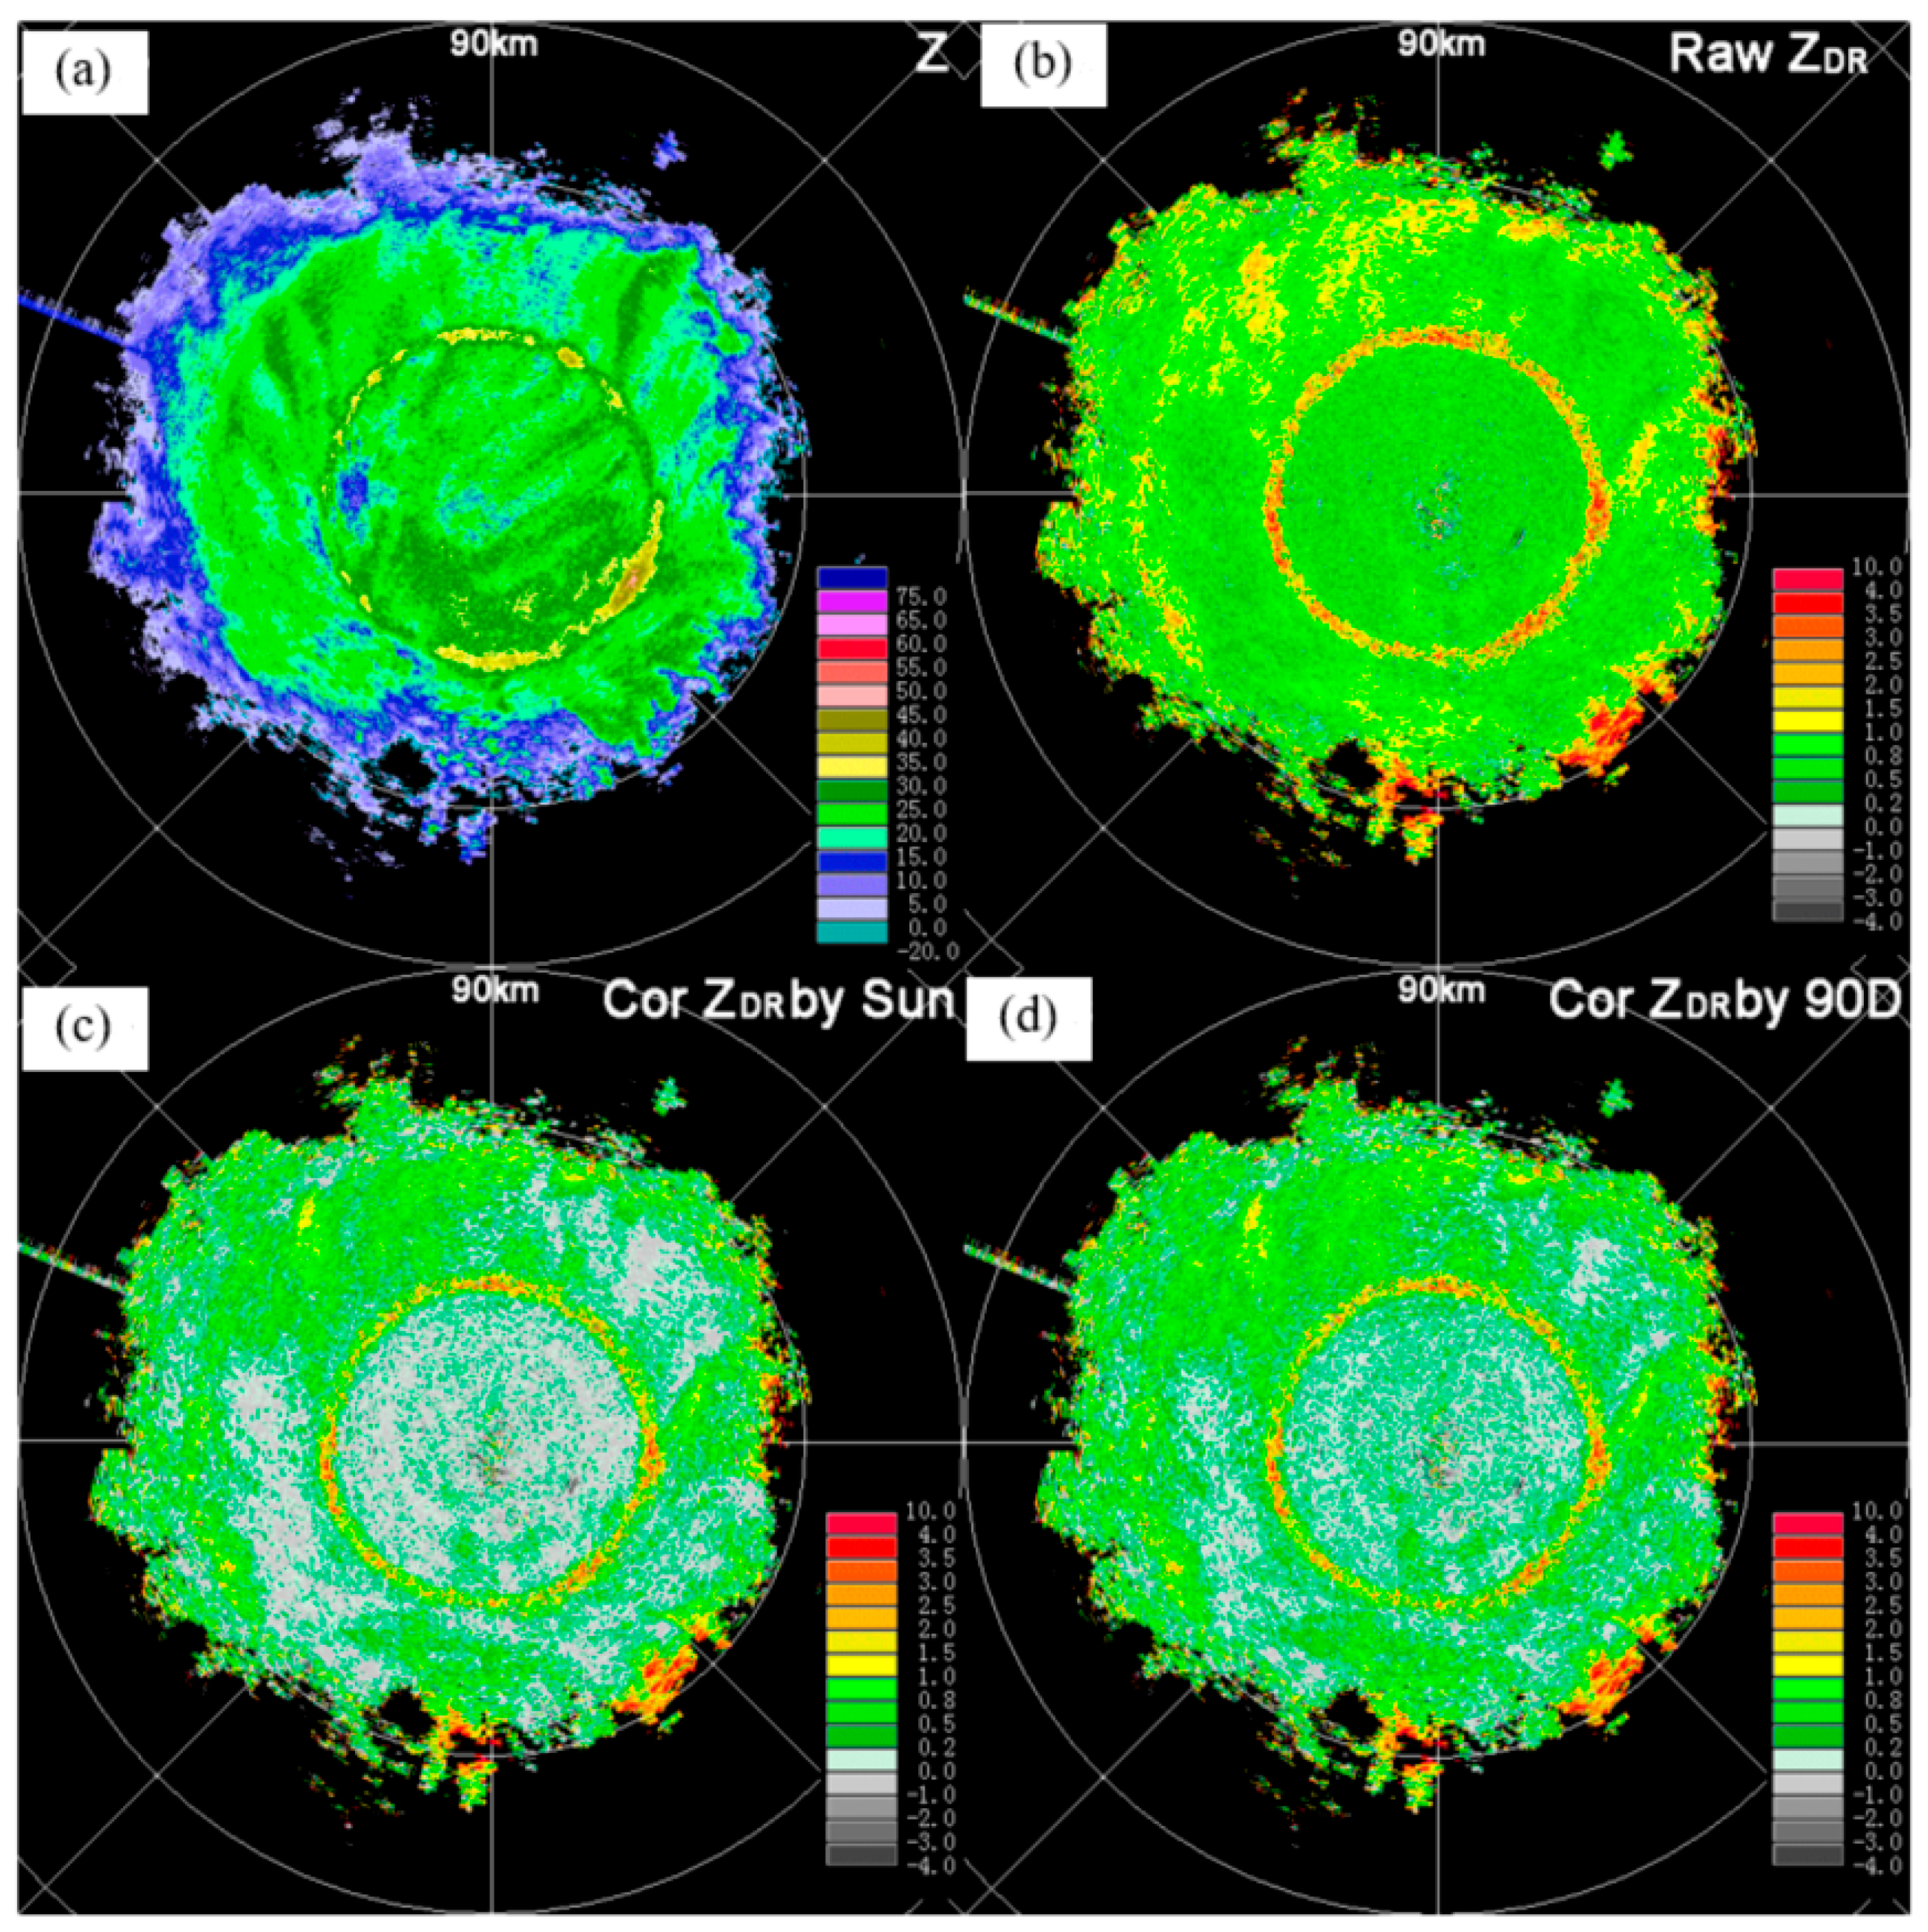
After determining the tendency of the daily ZDR bias, bias correction was performed according to Figure 9. A range height indicator (RHI) case of stratiform precipitation observed by NUIST-CDP at 11:10 UTC on 28 June 2015 was used to evaluate the correction for ZDR bias. As shown in Figure 10, a straight bright band was observed at a height of 5 km, a typical feature of stratiform precipitation. As can be seen from Figure 10b, the ZDR of ice crystals at a height of 6 km above the bright band was large, which suggests a positive ZDR bias. Moreover, the rain ZDR below the bright band was also relatively large, which is inconsistent with the Z values. After bias correction of 0.415 dB according to the online solar method, as shown in Figure 10c, the values were reasonable, and the ZDR of the ice crystals was closer to the theoretical value (0.2–0.3 dB). The vertical pointing PPI at 10:54 UTC on the same day showed ZDR bias was 0.548 dB. After correction of the bias, Figure 10d was more reasonable. The red ellipse in Figure 10d contained some negative ZDR caused by attenuation of the beams through the bright band, which was absent in Figure 10c. This indicates that, while the online solar method can reduce ZDR bias, its precision was lower than the vertical pointing method. Similarly, the two corrected vertical profiles shown in Figure 11b were better than the observed raw profile. In the corrected vertical profile by online solar method, the ZDR at a height of 6 km above the bright brand was adjusted from 0.7 to 0.3 dB.
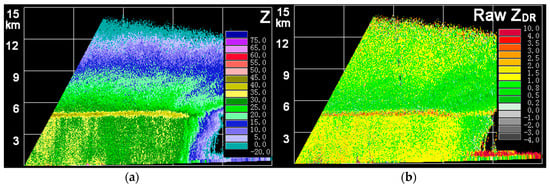
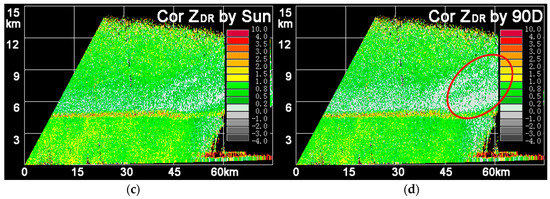
Figure 10.
Range height indicator (RHI) images of a case observed at 11:10 UTC on 28 June 2015. (a) Observed reflectivity factor. (b) Observed ZDR. (c) Corrected ZDR by the proposed online solar method. (d) Corrected ZDR by the vertical pointing method. Clearly, the corrected ZDR by the online solar method is closer to that corrected by the vertical pointing method (truth) than the uncorrected ZDR. The corrected ZDR at a height of about 6 km is reasonable, compared with the observed ZDR.
Another example is Figure 3c, which was observed at 10:28 UTC on 06 July 2015 at an elevation angle of 7.5°. As shown in Figure 12a,b, obvious positive bias was found in the observed ZDR. The online solar method and the vertical pointing method yielded biases up to 0.503 dB and 0.487 dB, respectively. After correction, the ZDR in Figure 12c was more reasonable and closer to the truth (Figure 12d), compared to the observed ZDR (Figure 12b).
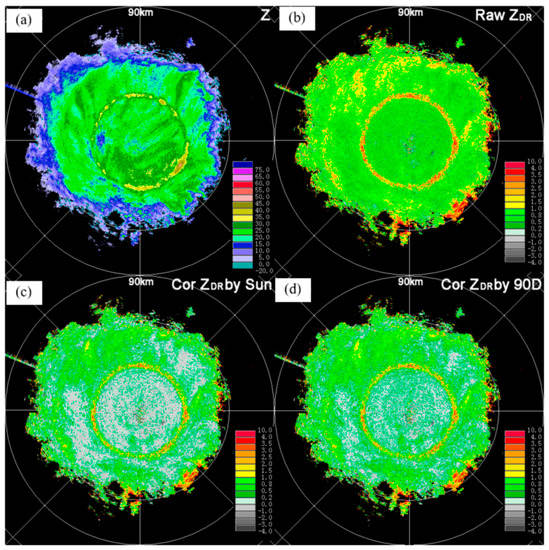
Figure 12.
Plan position indicator (PPI) images of a case observed at 10:28 UTC on 06 July 2015 at the elevation angle of 7.5°. (a) Observed reflectivity factor. (b) Observed ZDR. (c) Corrected ZDR by the proposed online solar method. (d) Corrected ZDR by the vertical pointing method. Clearly, the corrected ZDR by the proposed online solar method is closer to that corrected by the vertical pointing method (truth) than the uncorrected ZDR.
4. Discussion
4.1. ZDR Bias and Ambient Temperature
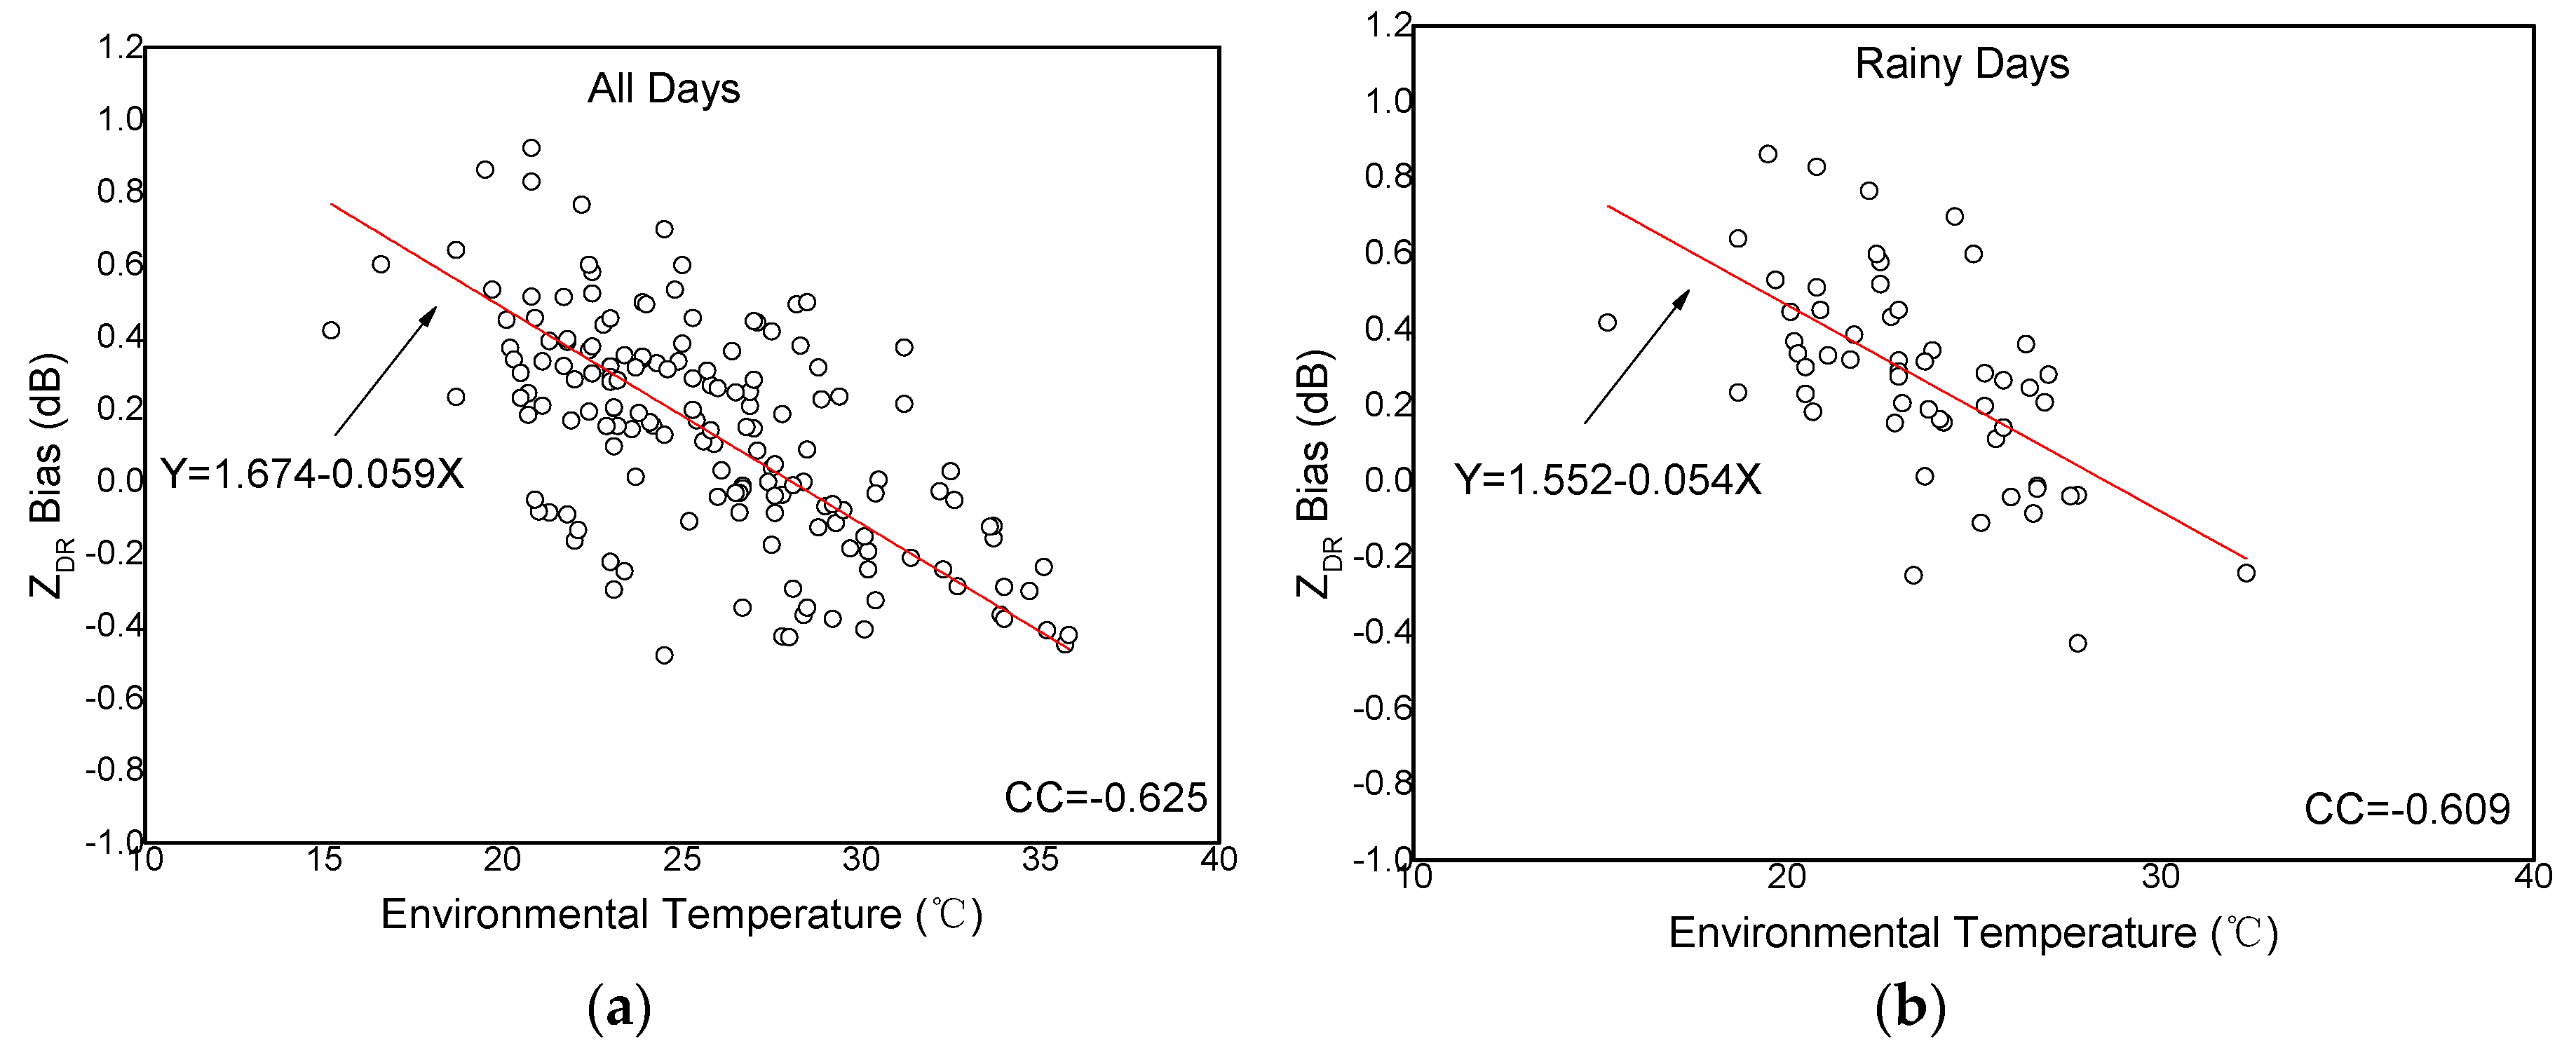
Generally, temperature effects on the horizontal and vertical channels, such as specific heat capacity and the coefficient of thermal expansion, are different, which affects the ZDR bias differently for different temperatures. The internal temperature distribution of radars is very complex, including antenna temperature, wave-guide temperature, receivers temperature, etc. To analyze the temperature effects, the temperature measured by an automatic weather station at a distance of 500 m away from the radar was treated as the ambient temperature. As shown in Figure 13a, the ambient temperature was negatively correlated with the ZDR bias obtained using the online solar method, with a correlation coefficient of –0.625. A similar observation was made by Hubbert [27], suggesting that temperature was a major influencing factor on the variation of ZDR bias. Figure 13b shows the relationship between ZDR bias and temperature on rainy days. The rain-day correlation coefficients and the all-day correlation coefficients are very close to each other, and the two fitting equations are almost the same. It indicates that precipitation does not affect the statistical relationship between ZDR bias and temperature. Hence, ambient temperature should be considered in monitoring and correcting ZDR bias.
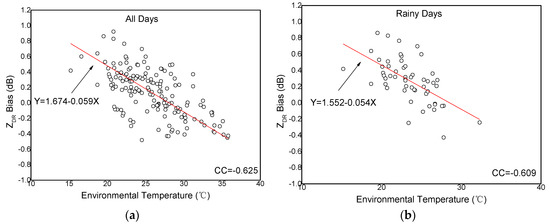
Figure 13.
The observed relationship between daily ZDR bias and ambient temperature from June to August 2015. (a) Data for all days. (b) Data on the rainy days. The results show that the ZDR bias of NUIST-CDP was significantly correlated with the ambient temperature, with a correlation coefficient of about –0.6.
4.2. Random Error and Systematic Bias of ZDR
The observational errors of ZDR include random error (standard deviation) and systematic bias. The random error depends on precipitation type, pulse accumulation, and SNR, while the systematic bias is decided by the relative calibration errors between the transmitting and receiving channels. To analyze the random errors in ZDR of NUIST-CDP, uniform snowfall echoes on 31 January 2016 were selected, and the statistical differences between adjacent two bins were used to approximate the random errors. > 0.98 was set as the threshold to filter out the low SNR and non-weather echoes. As shown in Figure 14, the random errors of ZDR with the largest probability appeared at 0.1 dB, indicating that the random errors basically meet the required precision of 0.1–0.2 dB for ZDR. Therefore, the subsequent accuracy analysis of ZDR for NUIST-CDP focuses on systematic bias.
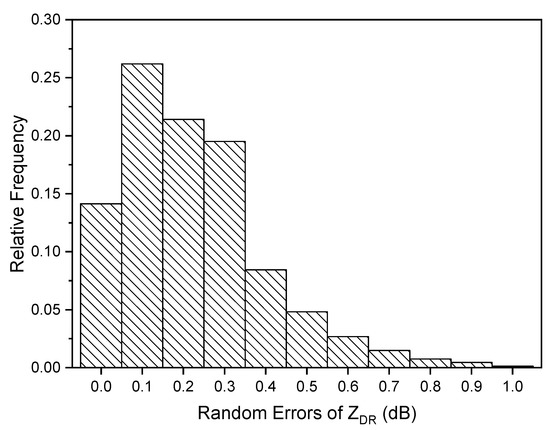
Figure 14.
Distribution of the random error of ZDR from NUIST-CDP based on an analysis of a case of uniform snowfall.
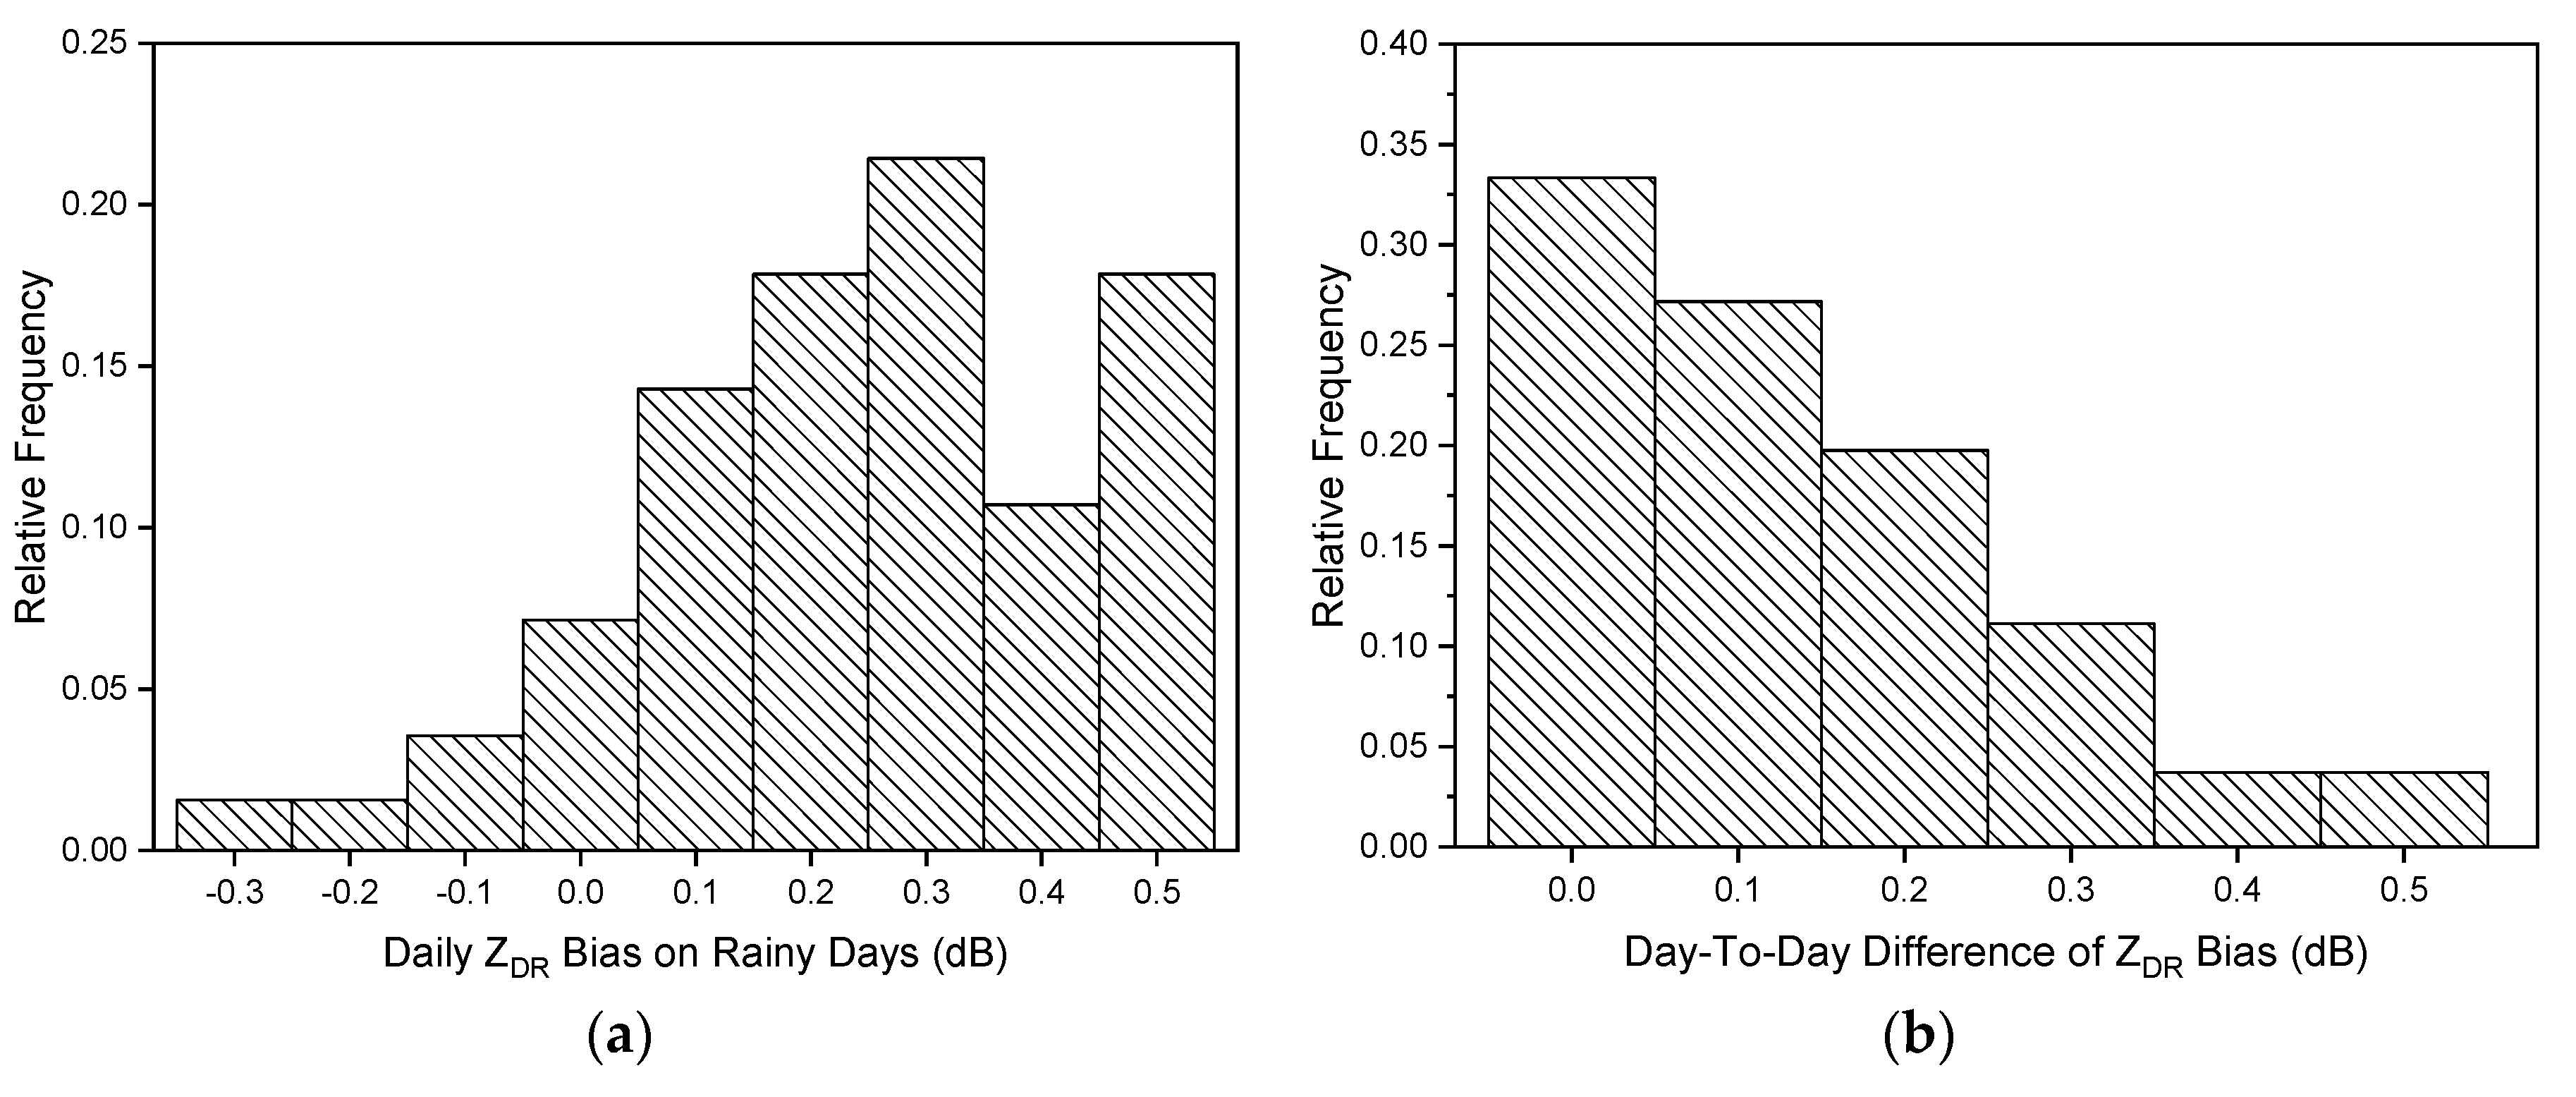
Based on the three-month results of the online solar method (Figure 9a), the distributions of daily ZDR bias and the day-to-day differences in daily bias were analyzed. As shown in Figure 15a, the daily ZDR bias varied from 0.0 dB (1st quartile) to 0.27 dB (3rd quartile) with a median of 0.12 dB, meaning that the range exceeded the precision of 0.2 dB. As shown in Figure 15b, the day-to-day difference ranged from 0.03 dB (1st quartile) to 0.23 dB (3rd quartile) and 32% of the day-to-day difference exceeded 0.2 dB. Therefore, for NUIST-CDP, a one-time calibration once every few days or weeks is not representative of the time variation of the ZDR bias, with continuous calibration being highly necessary.
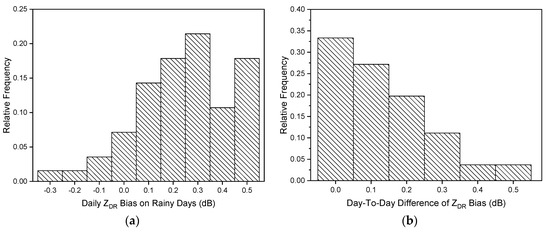
Figure 15.
(a) Distribution of the daily ZDR bias of NUIST-CDP. (b) Distribution of the day-to-day difference in the ZDR bias. The results show that 32% of the day-to-day difference exceeded 0.2 dB, meaning that continuous calibration is highly necessary for NUIST-CDP.
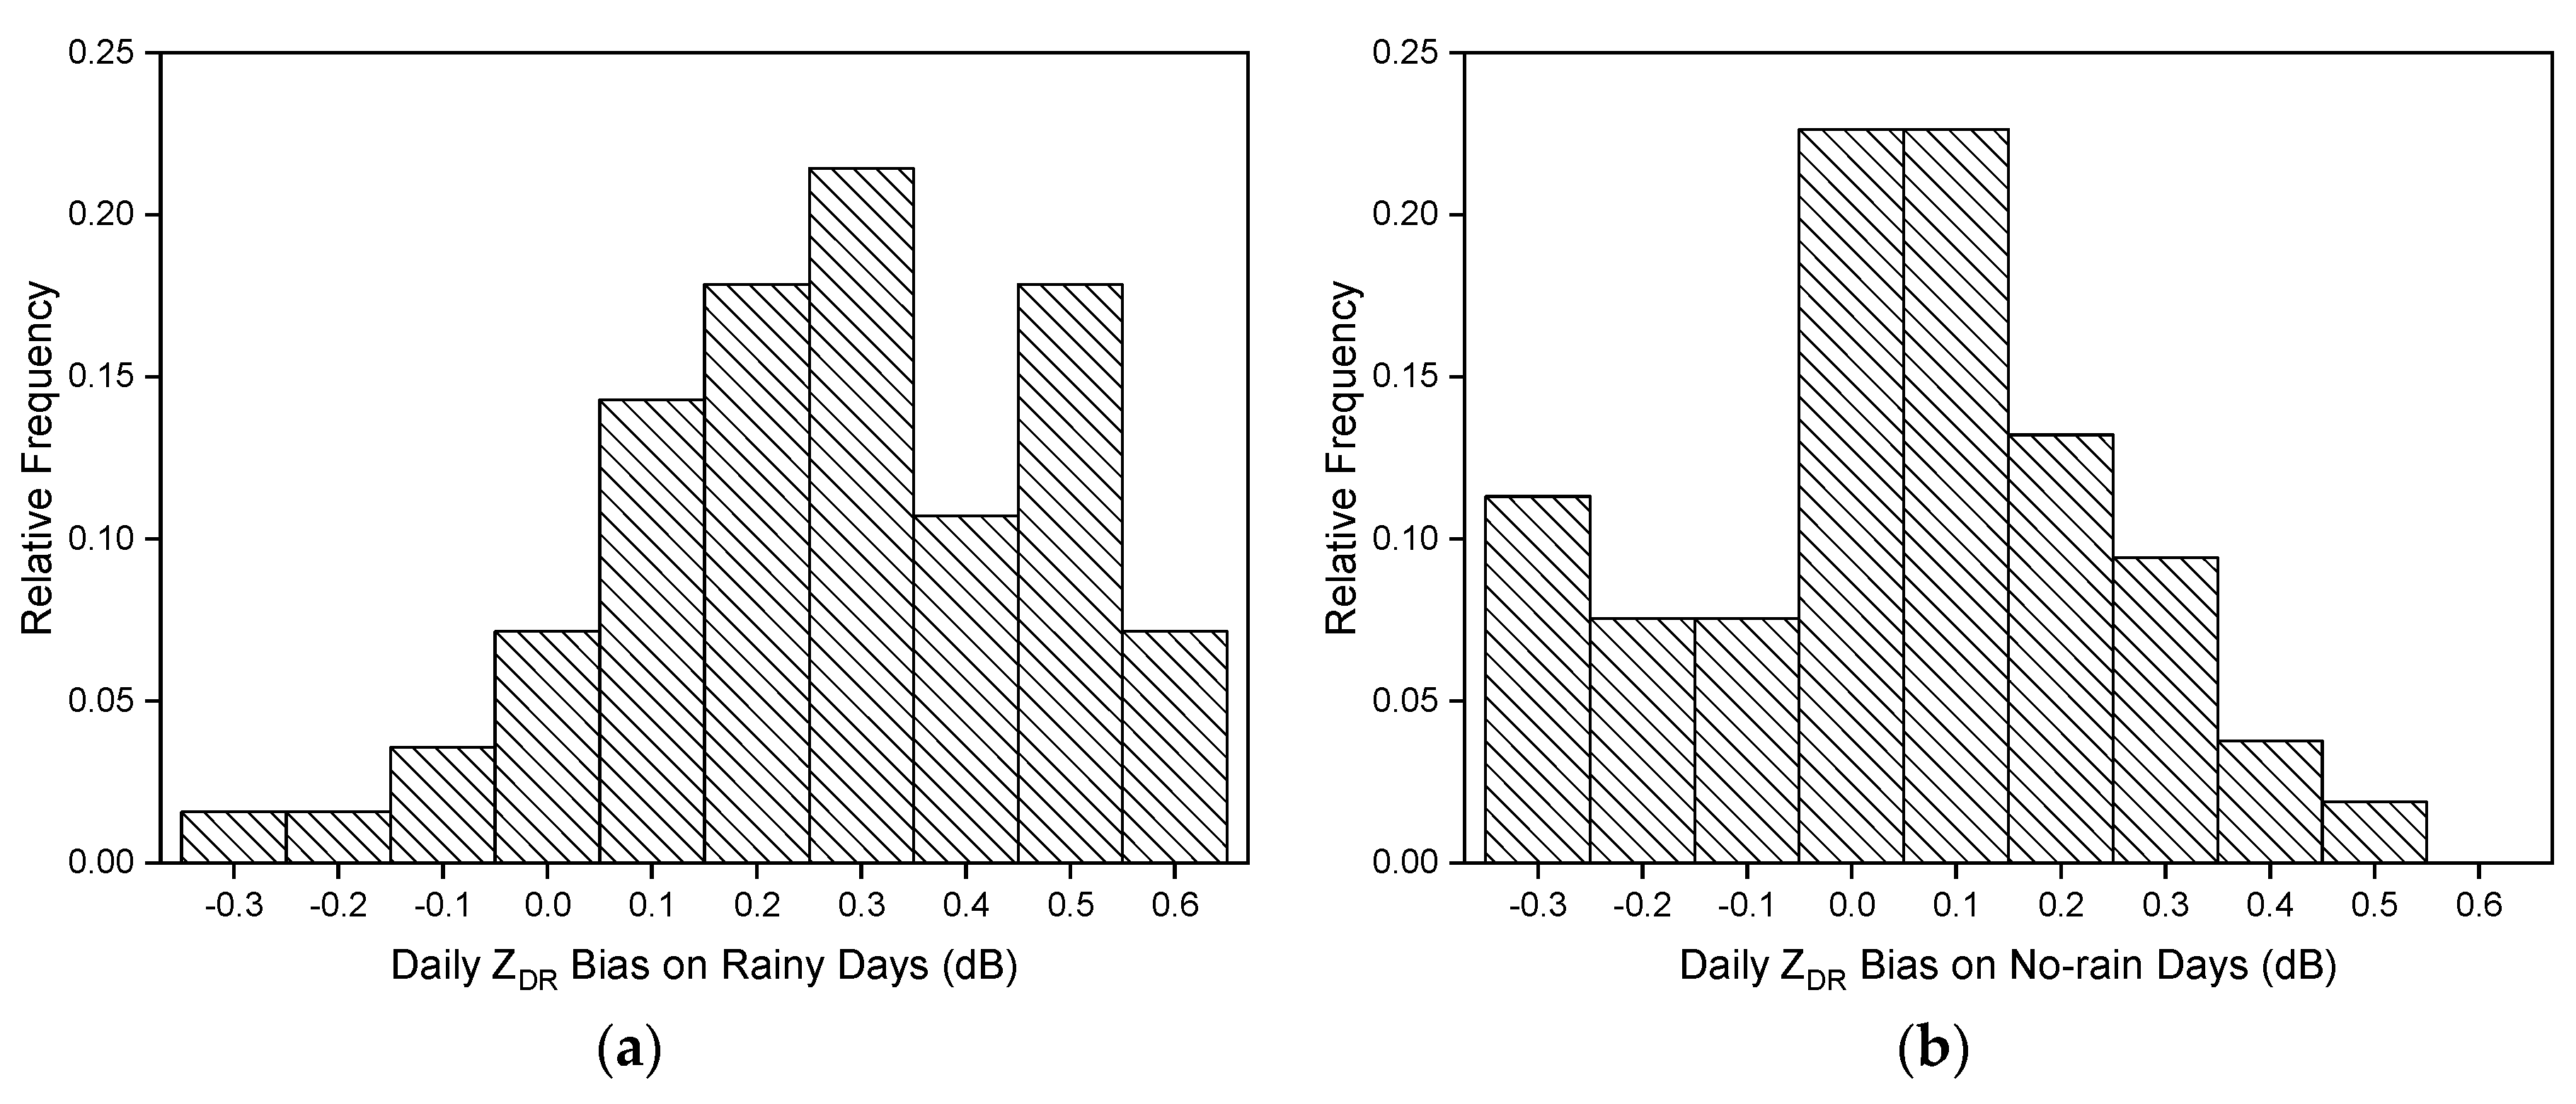
Figure 16 shows the distributions of daily ZDR bias on rainy days and on no-rain days. On rainy days, the daily ZDR bias varied from 0.15 dB (1st quartile) to 0.45 dB (3rd quartile) with a median of 0.28 dB. On no-rain days, the daily ZDR bias varied from −0.06 dB (1st quartile) to 0.17 dB (3rd quartile) with a median of 0.04 dB. The majority of ZDR bias on rainy days was positive (Figure 16a), which was due to the low ambient temperature on rainy days (Figure 13b). The distribution of ZDR bias on no-rain days was different, as the positive and negative values appeared at similar probabilities. Moreover, the interquartile range (the IQR) of bias on rainy days was 0.3 dB, which is larger than that on no-rain days (0.23 dB), indicating that the ZDR bias on rainy days is a more serious issue.

Figure 16.
(a) Distribution of the daily ZDR bias on rainy days and (b) on no-rain days.
4.3. Uncertainty of the Proposed Online Solar Method
As shown in Section 3.4, the precision of the online solar method was 0.184 dB, which is smaller than the required accuracy for ZDR (0.2 dB). There were a number of factors contributing the uncertainty. (1) Like the offline solar method, the online solar method includes only the receiving-path bias. If the transmitting-path bias is large or varies, then the online solar method will have additional error. The transmitting-path bias in this study was only 0.05 dB, so the correction by the online solar method was satisfactory. (2) The SNR of solar echoes is usually not high. A low SNR leads to a large standard deviation of solar ZDR estimates, which will cause large estimation errors. (3) Similar to the two-way attenuation correction, the one-way attenuation correction in this method also contains severe uncertainty, such as the variation of the coefficients for different types of hydrometeor, the observational error of ϕDP/KDP, and the attenuation of wet radome [34]. (4) Due to the limitation of available elevation angles in the volume scans, the online solar echoes only appeared at sunrise and sunset, meaning that only the bias at these two time periods can be used to represent daily bias. Thus, there can be some errors in time representativeness. (5) The majority of solar signals came from the edges of the main beam (Figure 7). If the antenna gains for horizontal and vertical polarizations are not the same, the ZDR bias at the beam edge is not the same as the ZDR bias at the beam center [25]. This can cause additional uncertainty.
5. Conclusions
Recent research has shown that ZDR bias in radars is time-variant. Addressing such variation would greatly complicate ZDR calibration and affect the quantitative application of polarimetric data. Due to limitations imposed by the specific meteorological conditions or the radar scan mode, traditional calibration methods are incapable of continuous monitoring/calibration for ZDR bias. Therefore, in this study, a method for the continuous monitoring of the ZDR bias of C-band polarimetric radar was proposed which uses online solar echoes in volume scans. Furthermore, a one-way differential attenuation correction was designed considering the attenuation of the solar signal that is caused by precipitation, and a maximum likelihood estimation was put forward based on the large ZDR fluctuation that is caused by the low SNR of solar echoes. The three months of data from June to August 2015 were analyzed, and the proposed method was validated using the vertical pointing method (considered to be a relatively reliable method). The results showed the following: (1) online solar echoes occurred at very high frequency regardless of precipitation. The average number of occurrences was 15 per day and the minimum was 7. Therefore, this meets the requirements for the continuous monitoring of the daily ZDR bias. (2) The online solar method was correlated with the vertical pointing method, meaning that the proposed method was reliable. (3) The day-to-day difference in the ZDR bias varied significantly, with amplitudes of 0.03–0.23 dB and an average of 0.11 dB/day. Furthermore, 32% of the day-to-day difference exceeded 0.2 dB, meaning that continuous calibration is highly necessary. (4) The ZDR bias of NUIST-CDP was largely influenced by the ambient temperature with a negative correlation. This phenomenon should be investigated further.
The main advantage of the online solar calibration method proposed in this paper is the capability to continuously monitor the daily ZDR bias for a polarimetric radar without affecting operational observations. It is worth noting that the online solar method also has the following limitations. (1) The online solar method is less accurate than those of traditional methods such as the vertical pointing method. Therefore, the more accurate, traditional methods should be used when possible and feasible. (2) The online solar method only obtained the receiving-path bias. Under the hypothesis that the transmitting-path bias was time-invariant, this method should be combined with other calibration methods to obtain the full-path bias. (3) Due to the limitation of elevation angles in the volume scans, the online solar signals only appeared at sunrise and sunset, meaning that only daily ZDR bias (rather than hourly or minutely ZDR bias) can be obtained. In the future, a calibration method based on ambient temperature should be considered to estimate hourly or minutely ZDR bias.
Author Contributions
Conceptualization, Z.C.; methodology and writing—original draft preparation, Z.C. and W.L.; writing—review and editing, G.Z.; validation, L.K. and N.L.; supervision, G.Z.
Funding
This research was funded by the National Natural Science Foundation of China, grant numbers 41590873, and by the National Key R&D Program of China, grant numbers 2018YFC1506603 and 2017YFC1501401.
Conflicts of Interest
The authors declare no conflict of interest.
References
- Seliga, T.A.; Bringi, V.N. Potential Use Of Radar Differential Reflectivity Measurements at Orthogonal Polarizations for Measuring Precipitation. J. Appl. Meteorol. 1976, 15, 69–76. [Google Scholar] [CrossRef]
- Vivekanandan, J.; Zrnic, D.S.; Ellis, S.M.; Oye, R.; Ryzhkov, A.V.; Straka, J. Cloud Microphysics Retrieval Using S-Band Dual-Polarization Radar Measurements. Bull. Am. Meteorol. Soc. 1999, 80, 381–388. [Google Scholar] [CrossRef]
- Lim, S.; Chandrasekar, V.; Bringi, V.N. Hydrometeor Classification System using Dual-polarization Radar Measurements: Model Improvements and in situ Verification. IEEE Trans. Geosci. Remote Sens. 2005, 43, 792–801. [Google Scholar] [CrossRef]
- Park, H.S.; Ryzhkov, A.V.; Zrnić, D.S.; Kim, K.-E. The Hydrometeor Classification Algorithm for the Polarimetric WSR-88D: Description -and Application to an MCS. Weather Forecast. 2009, 24, 730–748. [Google Scholar] [CrossRef]
- Ryzhkov, A.V.; Giangrande, S.E.; Schuur, T.J. Rainfall Estimation with a Polarimetric Prototype of WSR-88D. J. Appl. Meteorol. 2005, 44, 502–515. [Google Scholar] [CrossRef]
- Chen, H.; Chandrasekar, V. The Quantitative Precipitation Estimation System for Dallas–Fort Worth (DFW) Urban Remote Sensing Network. J. Hydrol. 2015, 531, 259–271. [Google Scholar] [CrossRef]
- Bringi, V.N.; Seliga, T.A.; Aydin, K. Hail detection with a differential reflectivity radar. Science 1984, 225, 1145–1147. [Google Scholar] [CrossRef] [PubMed]
- Ryzhkov, A.V.; Schuur, T.J.; Burgess, D.W.; Zrnic, D.S. Polarimetric Tornado Detection. J. Appl. Meteorol. 2005, 44, 557–570. [Google Scholar] [CrossRef]
- Zhang, G.; Vivekanandan, J.; Brandes, E. A Method for Estimating Rain Rate and Drop Size Distribution from Polarimetric Radar Measurements. IEEE Trans. Geosci. Remote Sens. 2001, 39, 830–841. [Google Scholar] [CrossRef]
- Wen, G.; Chen, H.N.; Zhang, G.F.; Sun, J.M. An Inverse Model for Raindrop Size Distribution Retrieval with Polarimetric Variables. Remote Sens. 2018, 10, 1179. [Google Scholar] [CrossRef]
- Jung, Y.; Zhang, G.; Xue, M. Assimilation of Simulated Polarimetric Radar Data for a Convective Storm Using the Ensemble Kalman Filter. Part I: Observation Operators for Reflectivity and Polarimetric Variables. Mon. Weather Rev. 2008, 136, 2228–2245. [Google Scholar] [CrossRef]
- Kumjian, M. Principles and Applications of Dual-polarization Weather Radar. Part I: Description of the Polarimetric Radar Variables. J. Oper. Meteorol. 2013, 1, 226–242. [Google Scholar] [CrossRef]
- Gabella, M. On the Use of Bright Scatterers for Monitoring Doppler, Dual-Polarization Weather Radars. Remote Sens. 2018, 10, 1007. [Google Scholar] [CrossRef]
- Ryzhkov, A.V.; Giangrande, S.E.; Melnikov, V.M.; Schuur, T.J. Calibration Issues of Dual-Polarization Radar Measurements. J. Atmos. Ocean. Technol. 2005, 22, 1138–1155. [Google Scholar] [CrossRef]
- Zrnic, D.S.; Melnikov, V.M.; Carter, J.K. Calibrating Differential Reflectivity on the WSR-88D. J. Atmos. Ocean. Technol. 2006, 23, 944–951. [Google Scholar] [CrossRef]
- Gorgucci, E.; Scarchilli, G.; Chandrasekar, V. Calibration of Radars using Polarimetric Techniques. IEEE Trans. Geosci. Remote Sens. 1992, 30, 853–858. [Google Scholar] [CrossRef]
- Bechini, R.; Baldini, L.; Cremonini, R.; Gorgucci, E. Differential Reflectivity Calibration for Operational Radars. J. Atmos. Ocean. Technol. 2008, 25, 1542–1555. [Google Scholar] [CrossRef]
- Gorgucci, E.; Scarchilli, G.; Chandrasekar, V. A Procedure to Calibrate Multiparameter Weather Radar using Properties of the Rain Medium. IEEE Trans. Geosci. Remote Sens. 1999, 37, 269–276. [Google Scholar] [CrossRef]
- Bringi, V.N.; Chandrasekar, V. Polarimetric Doppler Weather Radar: Principles and Applications; Cambridge University Press: New York, NY, USA, 2001; p. 636. [Google Scholar]
- Hubbert, J.C.; Bringi, V.N.; Brunkow, D. Studies of the Polarimetric Covariance Matrix. Part I: Calibration Methodology. J. Atmos. Ocean. Technol. 2003, 20, 696–706. [Google Scholar] [CrossRef]
- Melnikov, V.M.; Doviak, R.J.; Zrnić, D.S.; Stensrud, D.J. Mapping Bragg Scatter with a Polarimetric WSR-88D. J. Atmos. Ocean. Technol. 2011, 28, 1273–1285. [Google Scholar] [CrossRef]
- Richardson, L.M.; Zittel, W.D.; Lee, R.R.; Melnikov, V.M.; Ice, R.L.; Cunningham, J.G. Bragg Scatter Detection by the WSR-88D. Part II: Assessment of ZDR Bias Estimation. J. Atmos. Ocean. Technol. 2017, 34, 479–493. [Google Scholar] [CrossRef]
- Huuskonen, A.; Holleman, I. Determining Weather Radar Antenna Pointing Using Signals Detected from the Sun at Low Antenna Elevations. J. Atmos. Ocean. Technol. 2007, 24, 476–483. [Google Scholar] [CrossRef]
- Henson, R.; Ahrens, C. Meteorology Today: An Introduction to Weather, Climate, and the Environment, 12th ed.; Cengage Learning: Boston, MA, USA, 2018; p. 656. [Google Scholar]
- Holleman, I.; Huuskonen, A.; Gill, R.; Tabary, P. Operational Monitoring of Radar Differential Reflectivity Using the Sun. J. Atmos. Ocean. Technol. 2010, 27, 881–887. [Google Scholar] [CrossRef]
- Holleman, I.; Huuskonen, A.; Kurri, M.; Beekhuis, H. Operational Monitoring of Weather Radar Receiving Chain Using the Sun. J. Atmos. Ocean. Technol. 2010, 27, 159–166. [Google Scholar] [CrossRef]
- Hubbert, J.C. Differential Reflectivity Calibration and Antenna Temperature. J. Atmos. Ocean. Technol. 2017, 34, 1885–1906. [Google Scholar] [CrossRef]
- Chu, Z.; Hu, H.; Huang, X.; Wei, M. The Narrow Beam C-band Dual-polarization Doppler Weather Radar of NUIST and Its Performance Analysis (In Chinese). Plateau Meteorol. 2017, 36, 1072–1082. [Google Scholar] [CrossRef]
- Michalsky, J.J. The Astronomical Almanac’s Algorithm for Approximate Solar Position (1950–2050). Sol. Energy 1988, 40, 227–235. [Google Scholar] [CrossRef]
- Testud, J.; Bouar, E.L.; Obligis, E.; Ali-Mehenni, M. The Rain Profiling Algorithm Applied to Polarimetric Weather Radar. J. Atmos. Ocean. Technol. 2000, 17, 332–356. [Google Scholar] [CrossRef]
- Lim, S.; Chandrasekar, V. A Dual-Polarization Rain Profiling Algorithm. IEEE Trans. Geosci. Remote Sens. 2006, 44, 1011–1021. [Google Scholar] [CrossRef]
- Zhang, G. Weather Radar Polarimetry; CRC Press Publications: Boca Raton, FL, USA, 2016; p. 304. [Google Scholar]
- Zhang, J.; Howard, K.; Langston, C.; Vasiloff, S.; Kaney, B.; Arthur, A.; Van Cooten, S.; Kelleher, K.; Kitzmiller, D.; Ding, F.; et al. National Mosaic and Multi-Sensor QPE (NMQ) System: Description, Results, and Future Plans. Bull. Am. Meteorol. Soc. 2011, 92, 1321–1338. [Google Scholar] [CrossRef]
- Gorgucci, E.; Bechini, R.; Baldini, L.; Cremonini, R.; Chandrasekar, V. The Influence of Antenna Radome on Weather Radar Calibration and Its Real-Time Assessment. J. Atmos. Ocean. Technol. 2013, 30, 676–689. [Google Scholar] [CrossRef]


© 2019 by the authors. Licensee MDPI, Basel, Switzerland. This article is an open access article distributed under the terms and conditions of the Creative Commons Attribution (CC BY) license (http://creativecommons.org/licenses/by/4.0/).