Article

Effects of Climate Factors and Human Activities on the Ecosystem Water Use Efficiency throughout Northern China

1
State Key Laboratory of Remote Sensing Science, Jointly Sponsored by Beijing Normal University and Institute of Remote Sensing and Digital Earth of Chinese Academy of Sciences, Beijing 100875, China
2
Beijing Engineering Research Center for Global Land Remote Sensing Products, Institute of Remote Sensing Science and Engineering, Faculty of Geographical Science, Beijing Normal University, Beijing 100875, China
3
State Key Laboratory of Earth Surface Processes and Resource Ecology, Faculty of Geographical Science, Beijing Normal University, Beijing 100875, China
4
School of Geography and Tourism, Anhui Normal University, Wuhu 241002, China
5
College of Urban and Environmental Sciences, Peking University, Beijing 100871, China
6
Division of Environment and Sustainability, The Hong Kong University of Science and Technology, Kowloon 999077, Hong Kong, China
*
Author to whom correspondence should be addressed.
Remote Sens. 2019, 11(23), 2766; https://doi.org/10.3390/rs11232766
Submission received: 12 September 2019 / Revised: 1 November 2019 / Accepted: 22 November 2019 / Published: 24 November 2019

Abstract

:
Global climate changes have increased the imbalance of water resources, especially in northern China, which comprises typical arid and semiarid regions. Large-scale afforestation has been implemented over the past three decades in northern China. The ecosystem water use efficiency (WUE) connects the carbon cycle and water cycle of the terrestrial ecosystems and is defined as the ratio of the gross primary productivity (GPP) to the evapotranspiration. However, there are still an insufficient number of studies on the impact of the afforestation on the WUE. In this study, we applied the random forest (RF) model to explore the impacts of climate and nonclimate factors on the WUE in northern China. The results showed that in areas with high precipitation, the forests had the highest WUE, while in the arid areas, the croplands had the highest WUE. Of the total area, 44.34% showed a significant increase, and 5.89% showed a significant decrease in the WUE from 1982–2015 in northern China. The main driving factors for the changes in the WUE were climate factors, including the precipitation, temperature and solar radiation, which contributed to approximately 84% of the WUE trends, while human activities, such as afforestation, contributed to approximately 16% of the WUE trends. Overall, although the climate had a larger impact on the WUE dynamics than the human activities, our results suggested that the impacts of the afforestation programs on forest carbon and water cycles should be considered in the context of climate change.

Graphical Abstract

1. Introduction

Global climate changes have increased the imbalance of water resources [1], especially in arid regions. The planting of vegetation is regarded as one of the most powerful approaches for combatting global warming [2]. However, newly planted vegetation needs more water to grow [3] while storing carbon and providing biofuel to contribute to climate change mitigation [4], which has a significant impact on the ecological sustainability in arid and semiarid regions. The 2030 Agenda for Sustainable Development set by the United Nations through the Sustainable Development Goals (SDGs) defined the sustainable development of terrestrial ecosystems (SDG15) as one of the important objectives [5]. The large-scale ecological restoration programs (e.g., afforestation, revegetation) implemented in the arid and semiarid areas of northern China are sustainable for ecological development, but there is still controversy [6,7,8] regarding the adverse effect of the excessive water consumption.
The ecosystem water use efficiency (WUE) is defined as the ratio of the gross primary productivity (GPP) to the evapotranspiration (ET) [9,10,11] and is one of the indicators that comprehensively reflects ecological sustainable development [12]. WUE is often used to explore the resilience of vegetation ecosystems to drought [13,14], as it is a key parameter that measures the exchange between the carbon gain and water loss of terrestrial ecosystems [15]. It provides an important basis for promoting sustainable management of regional vegetation ecosystems [15,16,17,18]. Although many environmental factors have a significant impact on WUE, plants with high WUE may also likely place severe stress on regional water resources [11]. Therefore, quantifying the spatiotemporal variations in WUE and its drivers is crucial for understanding the relationship between ecosystem restoration and water resource shortages [17,18,19,20].
Climate factors, including temperature, precipitation and solar radiation, have significant effects on the WUE in an ecosystem [17,18]. However, the effects of these factors on the WUE are recognized differently at different spatiotemporal scales [14,21,22]. The estimation of the WUE with a process-driven model based on the GPP and ET suggested that the WUE was negatively correlated with the mean annual precipitation and temperature in China over the last three decades [18]. A study that employed long-term measurements of carbon and water fluxes at sites in a forest of the Northern Hemisphere identified a large increase in the WUE during the past two decades, which coincided with an increase in the atmospheric CO2 from 350 to 400 ppm [22]. The flux measurements from sites showed that the response of the WUE to drought across global ecosystems corresponded well with the climatic zones [14]. The Moderate Resolution Imaging Spectroradiometer (MODIS) GPP and ET products are some of the most widely used remote sensing data in studies of ecosystem WUE [10,23]. The effects of meteorological drivers on the global patterns of WUE were nonmonotonic based on the MODIS GPP and ET data over the period from 2000 to 2013 [23]. However, studies on the WUE over long time series and large spatial ranges based on remote sensing data are still insufficient. The time range of the Global Land Surface Satellite (GLASS) GPP and ET products is from 1982 to 2015, and it is currently one of the longest remote sensing product sources [24,25]. Based on the GLASS GPP and ET data, this study explored the spatiotemporal changes in the WUE and the relationship between the climate factors and the ecosystem WUE.
The WUE is sensitive to changes in human activities such as land cover changes and land management practices [26]. On agricultural land, the crop yield could be improved by anthropogenic activities such as irrigation, fertilizer application, and tillage because these land management practices modify the carbon and water cycles to improve the WUE [27]. Land cover changes have a great impact on the land surface biogeochemical and biophysical processes [28,29], which means that it could also change the ecosystem WUE. Northern China, which is also known as the Three North Regions (TNR) of China [30], is a typical area of arid and semiarid ecosystems where the shortage of water is one of the threats to plant growth. The ability of the plants to survive under limited water conditions is indispensable for the ecosystems of this region [8]. Ecological restoration projects, such as afforestation programs, have contributed to the accelerated greening trends in the TNR [31], but they have fewer effects on the biomass change in Northeast China [32] and on the hydrological cycle over the entire TNR during 1989–2009 [33]. Although land cover changes play a critical role in certain areas, the role is not large enough to shape the WUE pattern on a regional scale [26]. Therefore, the results of these studied imply that there are still insufficient studies on the impact of afforestation on WUE, especially in the TNR of China.
It is a key scientific issue to assess the suitability of afforestation in arid and semiarid areas. Therefore, WUE was used as an indicator to reflect ecologically sustainable development, and the role of climate factors and human activity on WUE were quantitatively assessed in the arid and semiarid TNR. Specifically, the main objectives in this study were (i) to verify the effectiveness of the ecosystem WUE with the GLASS products, (ii) to analyze the spatiotemporal changes in the GLASS WUE from 1982 to 2015, (iii) to explore the impact of climate change and human activities on the WUE change trends, and (iv) to evaluate the relative importance of these two types of factors. Our results can contribute to the design of governmental ecological policies.

2. Materials and Methods
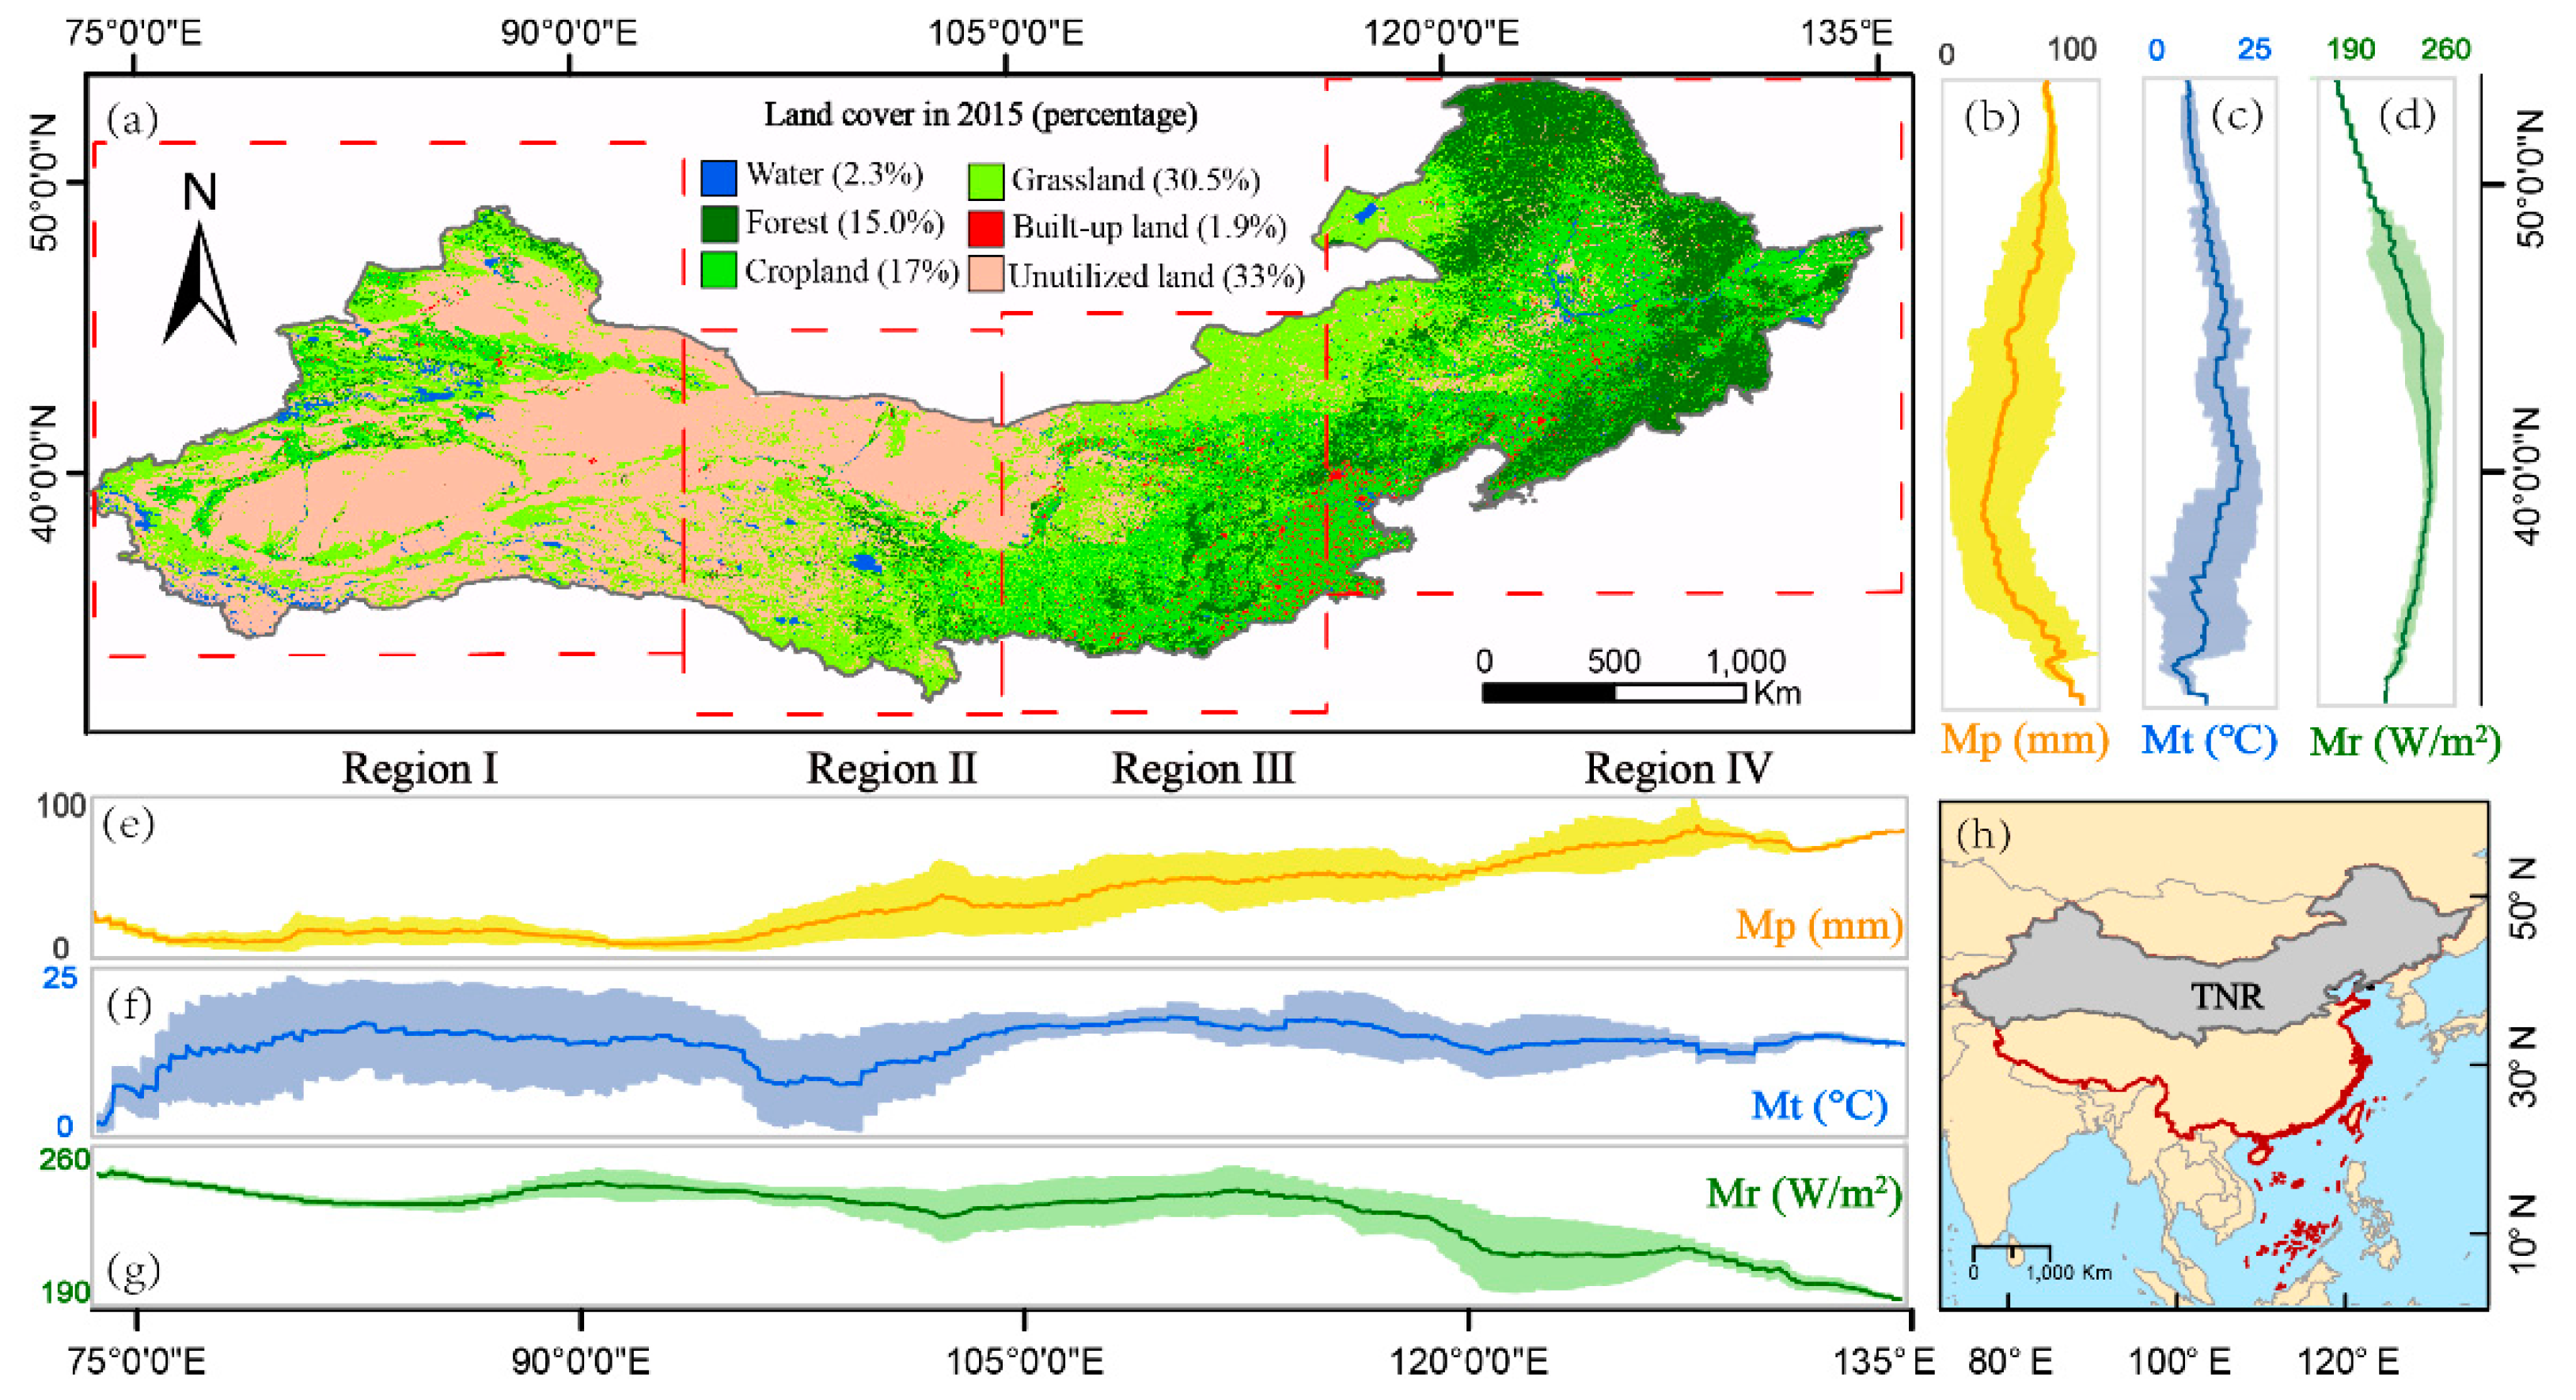
2.1. Study Area

The study area is located in northern China and included northwestern China, northern China, and northeastern China, which is an area that is also known as the TNR of China [30] and has a total area of 5.3 million km2 and accounts for 54.8% of mainland China. In the TNR, ecological restoration projects (e.g., afforestation and revegetation programs) have been widely implemented, and the afforested area has increased from approximately 10 million to 34 million hectares [34,35]. Considering the different climate conditions between the western and eastern parts of the study area, the TNR was divided into four regions based on climatic zone and vegetation maps of China (Figure 1) [30,36]. The four regions were the northwestern region (region I), the western-central region (region II), the eastern-central region (region III), and the northeastern region (region IV).
The TNR is located in the climate transition zone between arid and humid environments, and from the west to the east, the main land cover types in the TNR are unutilized land, grassland, cropland and forest. The grasslands are dominated by temperate meadow-steppe and temperate steppe-desert [37], and the croplands are mainly dry land. Various land management practices, including plastic mulching, drip irrigation, and gravel-sand mulching, are utilized for the crops in this area [38,39,40,41]. The forests include forests with canopy cover greater than 30%, woods with canopy cover between 10–30%, and shrubs and other afforested land [42].

2.2. Data Sources

In this study, the GLASS products, land cover data, and climate data were used to explore the spatiotemporal trends and drivers of the ecosystem WUE in the TNR. The specific workflow (Figure S1) presents the overall approach developed in this study.

2.2.1. GLASS Products

This study was based on the GLASS GPP and ET products from 1982 to 2015 (http://glass-product.bnu.edu.cn/) with a spatial resolution of 0.05° (~5.6 km) and a temporal resolution of 8 days, which were used to explore the spatial distribution and temporal trend of the WUE. The GLASS GPP product was calculated by the eddy covariance-light use efficiency (EC-LUE) model based on remote sensing data and showed optimal simulation accuracy for almost all vegetation types globally [25,43]. The ET product was obtained by merging five process-based algorithms with a Bayesian model averaging method [44], which showed high reliability and accuracy [24]. Consequently, both the GLASS GPP and ET could reveal the spatial distribution of the gross primary productivity and evapotranspiration.

2.2.2. Land Cover Data

The land cover data were used to investigate the impact of the different land cover types on the WUE. The land cover data were obtained from the Data Center for Resources and Environmental Sciences, Chinese Academy of Sciences (RESDC) (http://www.resdc.cn), with a spatial resolution of 1 km and a temporal resolution of 5 years. The data were derived from Landsat TM/ETM+ and Landsat 8 data from 1990 to 2015, which were interpreted visually at a scale of 1:100,000 after being georeferenced and orthorectified [45]. Among these data, there are six land cover types, including cropland, forest, grassland, water, built-up land and unutilized lands [42]. The overall identification accuracy was over 95%, among which the accuracy of cropland can reach 99% and 98% for grassland, forest and built-up land [42,45], so the data were suitable for analyzing the land cover changes in the TNR over the past 25 years.

2.2.3. Climate Data

To explore the impact of the climate factors on the vegetation WUE, the precipitation, temperature and solar radiation data from the Climatic Research Unit (CRU), version TS3.22 (http://www.cru.uea.ac.uk/) [46] were used in this study. These gridded data have a spatial resolution of 0.5° (~56 km) and a monthly temporal resolution. They were obtained from more than 4000 meteorological stations and interpolated based on spatial autocorrelation functions [47,48]. The CRU datasets are characterized by high quality and a wide application range and have become a basic dataset for use in research on climate change [49,50,51].
A set of seven variables was selected as the drivers of the changes in WUE from 1982 to 2015 (Table 1).

2.2.4. MODIS Products

To verify the effectiveness of the WUE estimated in the TNR from the GLASS products, the WUE calculated by the GLASS GPP and ET was compared with the WUE calculated by the MODIS GPP and ET, which are widely used remote sensing products [10,11,52]. The annual GPP (MOD17A3) and ET (MOD16A3) data with a 1 km resolution from 2000 to 2014 were produced by the Numerical Terra Dynamic Simulation Group (http://www.ntsg.umt.edu) and are freely available.

2.3. Data Preprocessing

April to October was selected as the vegetation growing season [53,54] for the calculation of the average GPP and ET throughout the growing season, and the mean value of the WUE was obtained. The mean precipitation, temperature and solar radiation were also calculated from April to October. To maintain the accuracy of the land cover change estimation, nearest neighbor resampling was applied to the remaining datasets to match the 1 km spatial resolution of the land cover data.
The WUE values of the croplands, forests and grasslands were mainly considered in this study since the TNR is dominated by these land cover types. The land cover data from 1990 to 2015 were processed, and those pixels that consistently remained one type of land cover or only changed land cover type once (e.g., from croplands to forests, from cropland to grasslands, etc.) were selected as the research object, which was called land cover changes (LCC). Since it is difficult to describe the relationship between WUE and multiple changes of land cover, we simplified the calculation by omitting the pixels with more than one change in land cover.
To verify the effectiveness of the WUE from the GLASS products for the TNR, the WUE results derived from the GLASS products and MODIS products were compared for different land cover types in different regions. However, the relationship between the GLASS-WUE and the MODIS-WUE under different land cover types could not be verified yearly due to the limitation of land cover data with a temporal resolution of 5 years. For the pixels with consistent land cover types over the 5 years, we assumed that the land cover type of these pixels did not change during the 5 years. Therefore, the pixels of croplands, forests and grasslands with consistent land cover types from 1990 to 2015 were selected [51] as the target of the comparison, and the WUE values of the four regions were compared for each year.

2.4. Trend Analysis

The trend analysis was conducted on a per-pixel basis with a linear regression between the WUE of the TNR and the year (1982–2015). WUE was considered as a dependent variable and the year as an independent variable. Their relationship is represented by the following equation:
WUE = a + b × Year
where a is the y-intercept, which gives the WUE value at the beginning of the period, and b is the trend, which represents the rate of change of WUE per unit year.
The p-values of two-sided Student’s t-tests were computed to examine the consistency of the trends (b). A p-value of a pixel of less than 0.05 indicated that the pixel had significant positive or negative temporal changes. If the p-value of a pixel was more than 0.05, this indicates that the pixel had no consistent changes [55,56]. Linear regression was also used to calculate the temporal trends of the precipitation, temperature, and solar radiation.

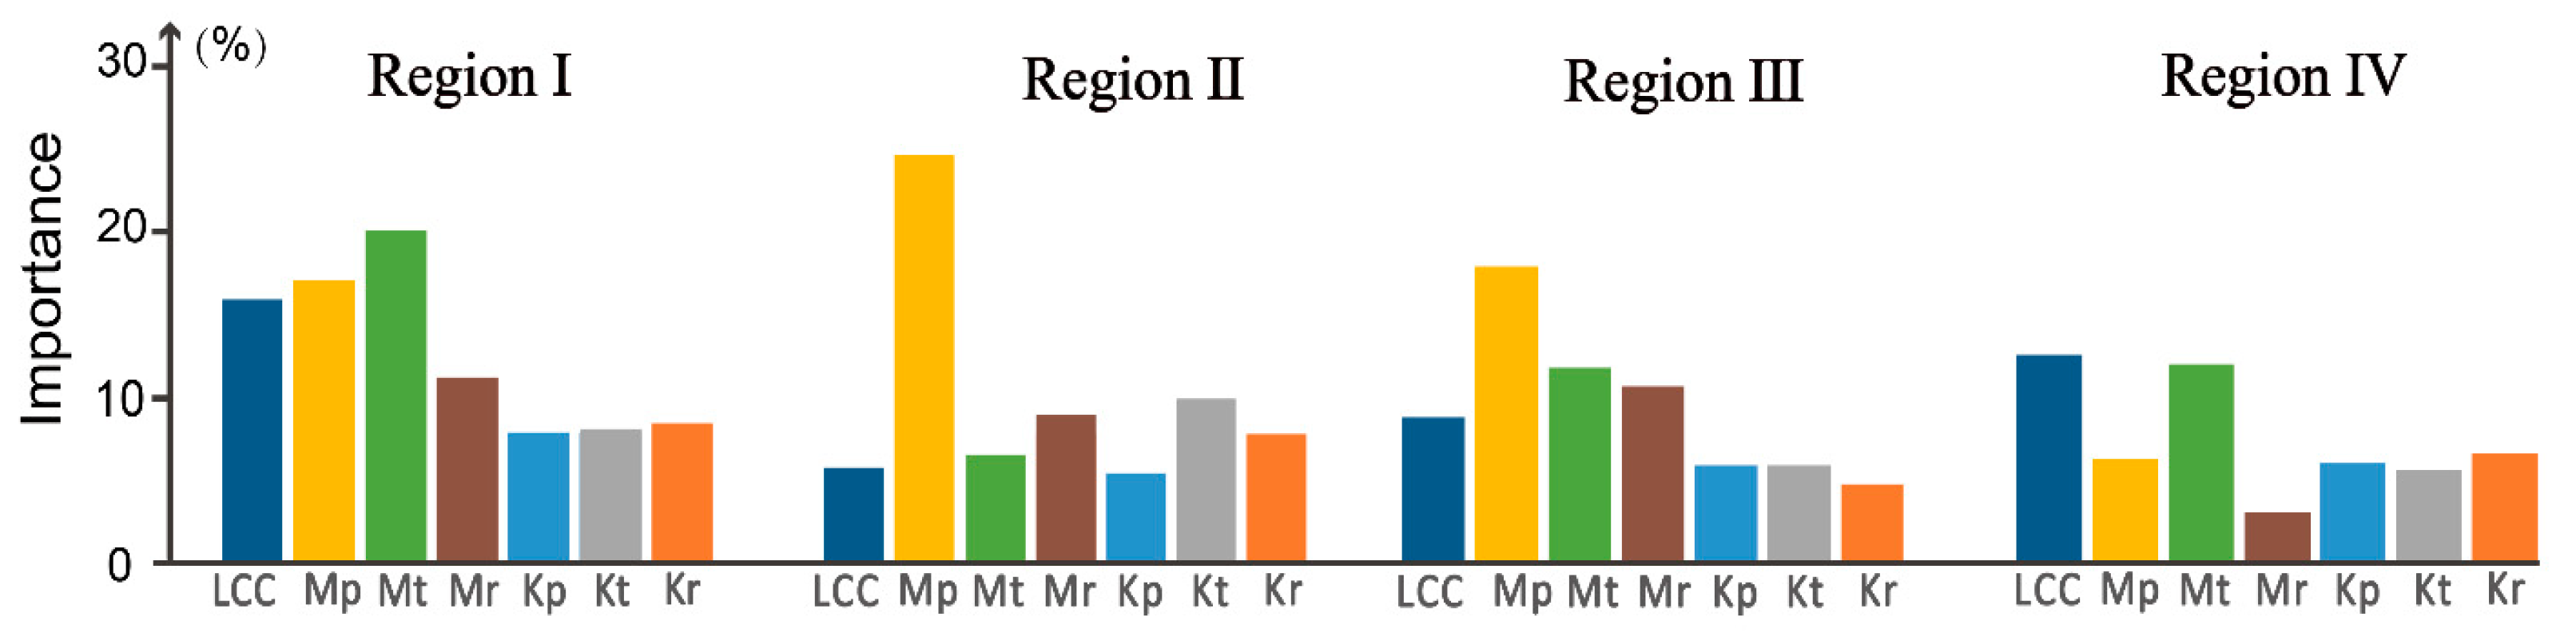
2.5. Analysis of the Drivers of the Changes in the WUE

To explore the underlying drivers of the changes in WUE, we selected the main driver by analyzing the importance of every factor to the WUE. Here, we calculated the variable importance with the internal importance measurement of the random forest (RF) algorithm to identify the drivers with the most important contributions to changing trends in the WUE [57]. The RF is an effective algorithm for optimizing learning accuracy without obviously complicating the calculation [58], and it has been widely used in geography and ecology [57,59,60].
The drivers that were used in the RF model included the climate factors and human activities. The climate factors included 6 potential drivers (Mp, Mt, Mr, Kp, Kt and Kr, details seen in Table 1), and the human activities were characterized by the LCC. The WUE trends (WUE-K) were treated as the target variables to be explained. The mean value of the climate factors represented the general climate conditions over a period of time, while the trends of the slope reflected the changes in the climate conditions over many years [57]. One RF model was set up for each of the four regions in this study. The number of trees and the number of variables tried at each split are two key parameters of the RF model and were set to the default values of 500 and 2, respectively.
Here, we aimed to determine the relative importance of the factors that influenced trends of the WUE. Thus, we used the RF internal variable importance measures to achieve this goal and focused on the importance indicator %IncMSE, which indicates an increase in the mean square error (MSE) [61]. The higher the value of %IncMSE was, the more important the variable was in the out-of-bag cross-validation process [58], which meant the higher importance of the driver was in explaining the WUE trends in this study. To further explore the specific effects of every climate factor on the WUE, the partial dependence plot (PDP) provided by the RF was used to describe the influences of the single variation on the WUE. The PDP can reveal the nonlinear relationships between the drivers and the target variable and graphically characterize their relationships independently of other variables [59,62,63].
The RF algorithm was implemented using the random forest package available in the R environment [62].

3. Results

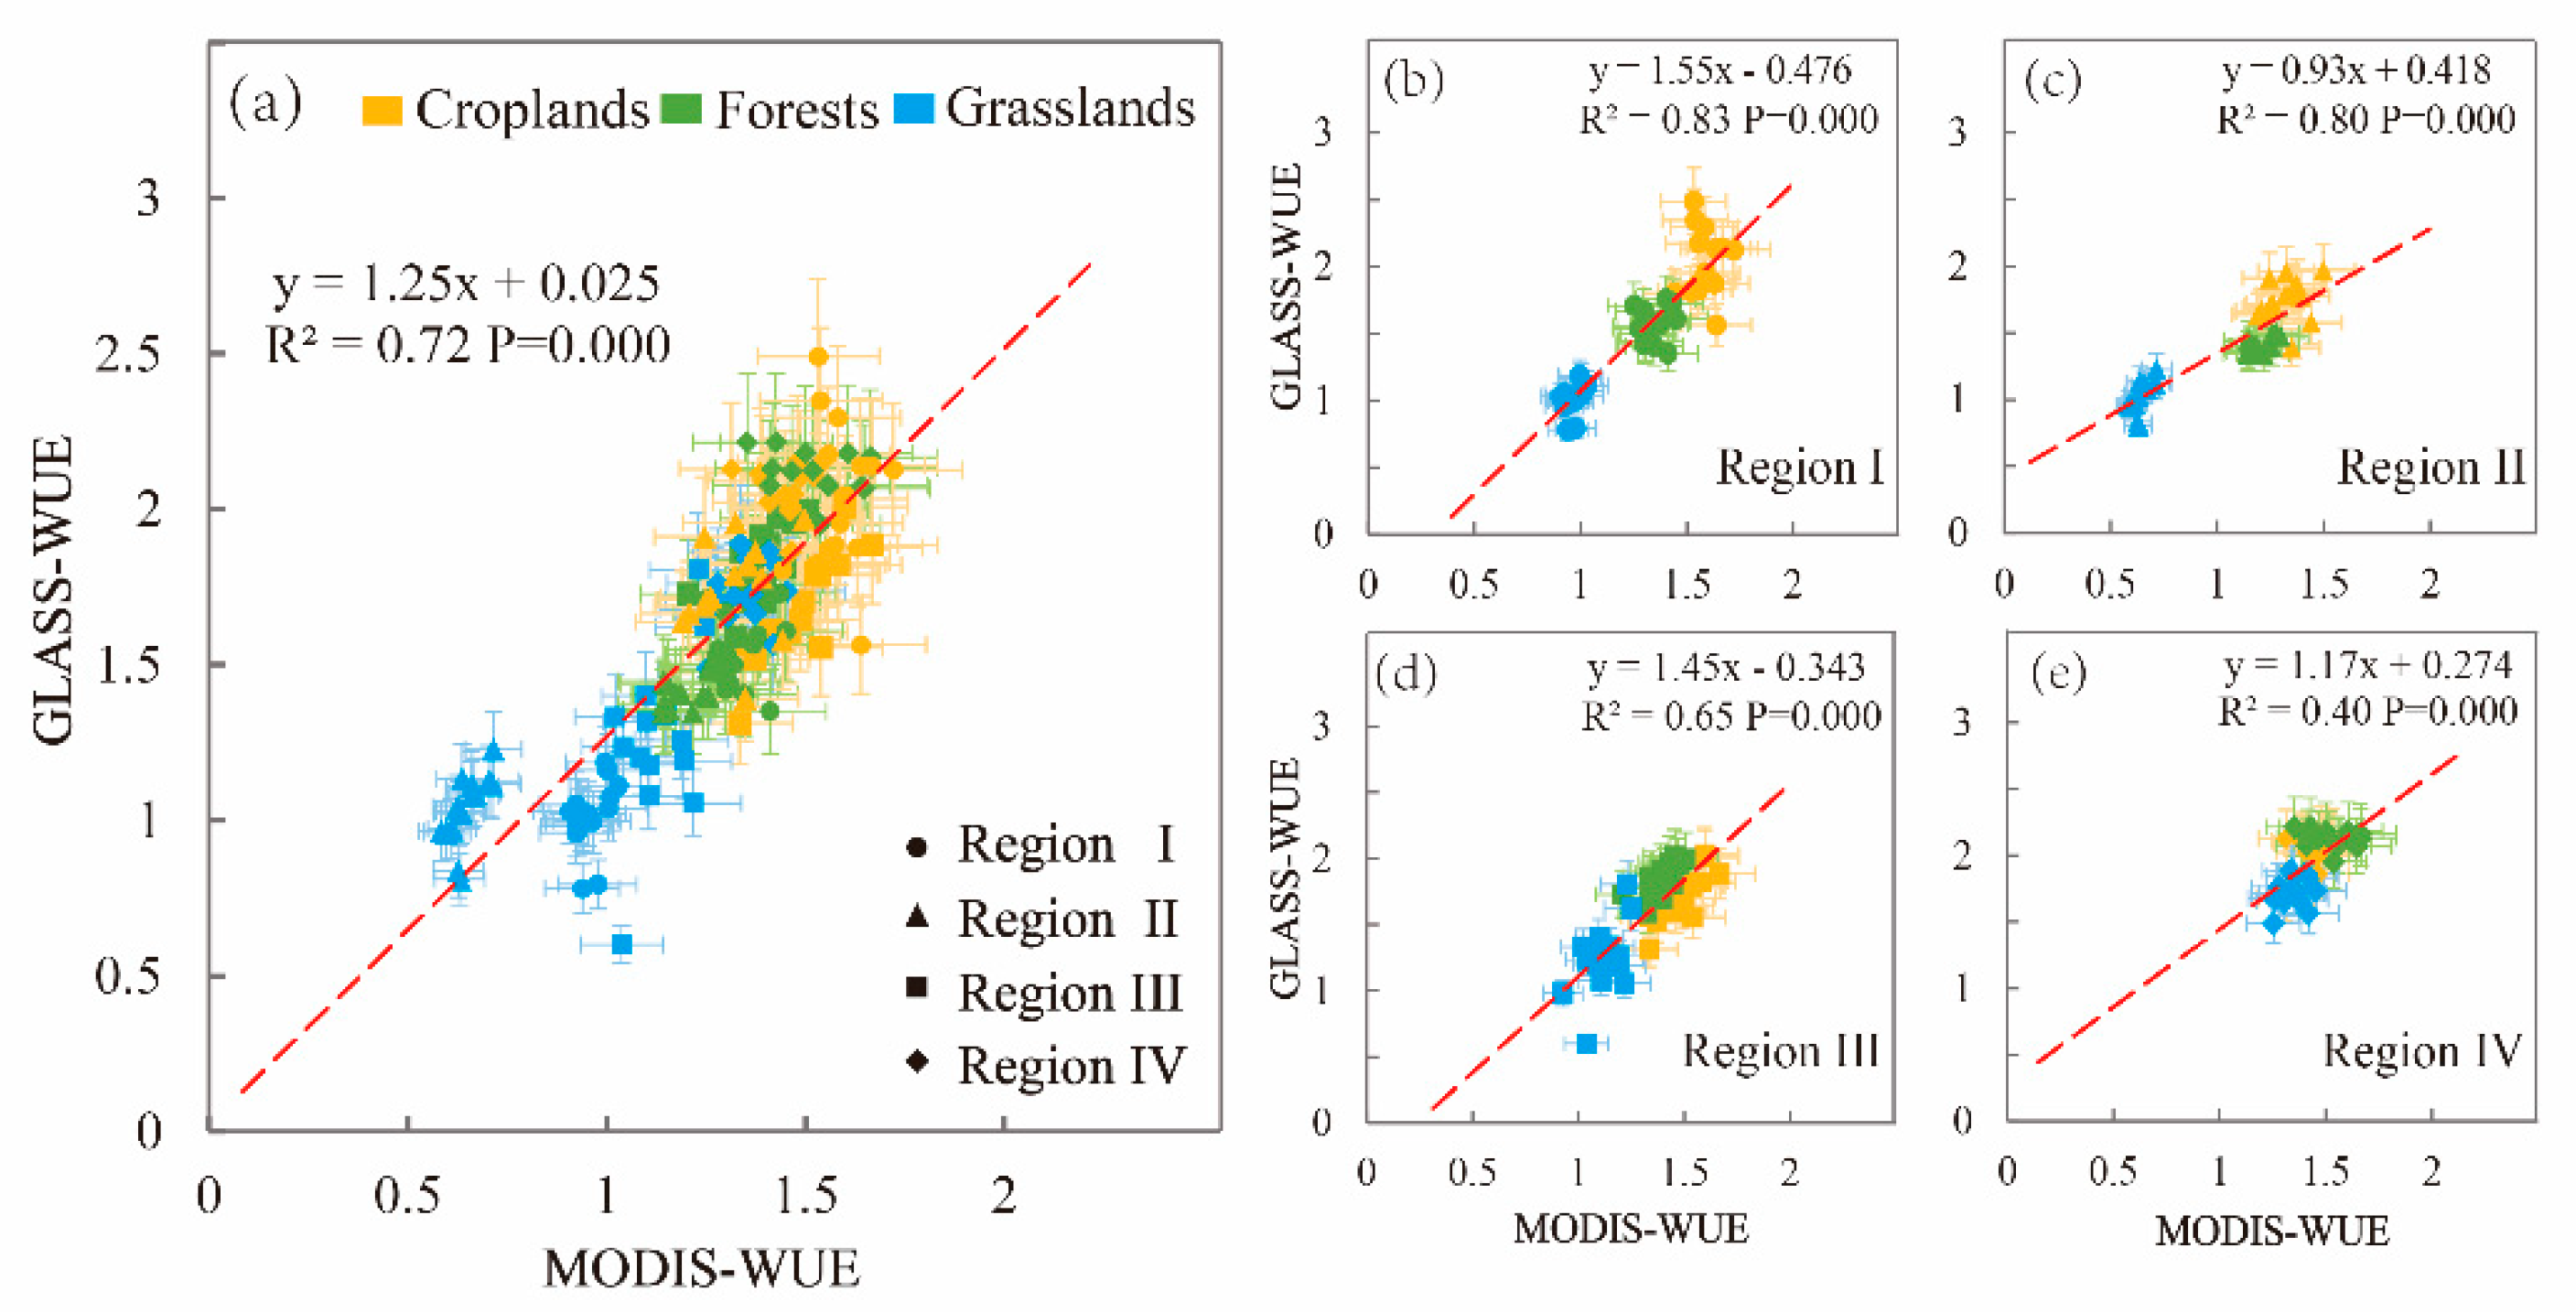
3.1. Verification of the Effectiveness of the WUE Estimated from the GLASS Products

To verify the effectiveness of the GLASS-WUE, we compared the two WUE datasets derived from the GLASS GPP and ET products and from the MODIS GPP and ET datasets for the TNR (Figure 2). We found a high degree of consistency between the MODIS-WUE and GLASS-WUE (RMSE = 0.21, R2 = 0.72, p < 0.001). However, the GLASS-WUE was slightly overestimated compared to the MODIS-WUE for the whole study area. Upon comparing the GLASS-WUE and MODIS-WUE values in the different regions (Figure 2b–e), there was good consistency between the values in regions I to III; all R squared values were greater than 0.6.
Upon comparing the results of this study with other estimates in the literature, the spatial distribution of the GLASS-WUE was consistent with the results of the model estimations and remote sensing calculations [21,64,65]. The reported ranges of the WUE in China were approximately 0.37–3.10 g C kg−1 H2O in the period from 2003 to 2010 [64], 0–3.8 g C kg−1 H2O between 1980 and 2010 [65], approximately 0.36–3.89 g C kg−1 H2O in the period of 2001 to 2010 [21], and 0–5 g C kg−1 H2O between 1979 and 2012 [18], all of which were similar to our results, which ranged from 0 to 4 g C kg−1 H2O.
Therefore, the WUE values calculated using the GLASS products in this study were consistent with the results of previous studies, supporting the use of the GLASS products to study WUE. It was feasible and effective to use GLASS products to study the ecosystem WUE, especially for long-term research.

3.2. Spatial Patterns of WUE

The average WUE for the total area in the TNR showed larger spatial variations from the west to the east (Figure 3). The mean WUE (WUE-M) from 1982 to 2015 was 1.40 g C kg−1 H2O and ranged from approximately 0 to 4 g C kg−1 H2O. The WUE of the western regions (regions I and II) was lower, while the WUE in the eastern regions (regions III and IV) was higher. The pixels of the cropland, forest and grassland types that were unchanged in the land cover data from 1990 to 2015 were selected to calculate their WUE values. The results showed that the WUE was significantly different among the croplands, forests and grasslands (one-way ANOVA, p < 0.001, Figure 3a–d) in each region. Specifically, the grasslands had the lowest WUE values of the whole TNR, the forests had the highest WUE values in the eastern TNR (regions I and II) and the croplands had the highest WUE values in the arid areas of the western TNR (regions III and IV).

3.3. Trend Analysis of the Changes in WUE in the TNR

During the period of 1982 to 2015, 75.94% of the total area in the TNR showed an increase in the WUE, with a significant increase of 18.52% (Figure 4a, p < 0.05). The increasing WUE was mainly found in the Northeast Plain, North China Plain, and some mountainous areas of Xinjiang. In contrast, the WUE of the mountainous areas in Northeast China, eastern Inner Mongolia and Qilian Mountain showed a significant decreasing trend, accounting for 2.5% of the total area. The interannual variations in the spatially averaged WUE (WUE-M) for the different regions are shown in Figure S2.
Considering the impacts of the different types of vegetation transformations on the WUE (Figure 4b–e), the WUE-K of the stable croplands was relatively high. The WUE-K from croplands to grasslands was higher than that to forests in the regions II, III and IV. The WUE-K of the stable forests was relatively low, and the WUE-K from forests to croplands and grasslands were both higher than that of stable forest in all four regions. The WUE-K of the stable grasslands was higher than that of the grasslands that changed into forests in all four regions.

3.4. Drivers of the WUE Trends

To extend the analysis of the underlying factors of the WUE change trends, we used seven factors (i.e., LCC, Mp, Mt, Mr, Kp, Kt and Kr) to explore the importance of each factor in influencing WUE trends. The relative importance of the factors was explored for significant changes in the WUE trends (p < 0.05) in every region through the RF (Figure 5). The drivers explained that the percentages for the four regions from west to the east were approximately 52.96%, 65.91%, 69.26%, and 89.32%. The RMSE of the RF models for each region were 0.015, 0.014, 0.011 and 0.004, respectively. The factors that contributed the most to the WUEs in regions I to IV were Mt, Mp, Mp, and LCC. In region IV, Mt was also very important to the WUE. Overall, the climate factors were the dominant drivers of the WUE dynamics across the entire TNR, contributing to more than 84% of the trend, and the LCC played a relatively small role, accounting for less than 16%.
To further explore the specific effects of each climate factor on the WUE, the PDP was used to describe the influences of single variations on the response (Figure S4). The relationship between the meteorological factors and the WUE was nonmonotonic. In region I, when the temperature reached approximately 19 °C, the WUE increased at the highest rate. The most important climate factor affecting the WUE in regions II and III was the precipitation, which had the greatest impact on the WUE in regions II and III when the precipitation reached approximately 30 mm and 50 mm, respectively. In region IV, the effect of the temperature on the WUE increased gradually and remained stable after approximately 16 °C.

4. Discussion

This study quantitatively assessed the impact of land cover change on the ecosystem WUE under the background of climate change. In general, these geographic characteristics of WUE were mainly due to different climatic conditions [66,67], which was consistent with the results of existing research on WUE [15,65]. The favorable water and heat conditions were beneficial for vegetation growth, and the ecosystem WUE was relatively high [18]. The WUE values of the different vegetation types varied widely in this study, probably due to differences in carbon uptake and water consumption [15,66]. Large variations in the WUE were also evident for the same land cover types in different regions, probably because of the different climate conditions and the impact of human activities. The WUE of the forests in the eastern TNR was higher than that of the croplands [30]. In the arid areas of the western TNR, the forest WUE was lower than that of the croplands, probably because of drip irrigation [38,39], plastic mulch [40], gravel-sand mulch [41], and other land management practices that made the increase in productivity greater than that of evaporation [39]. In terms of the spatial distribution, the regions with significant changes in WUE showed greater spatial variability. To better highlight the WUE variation in small regions, we chose five subregions with obvious changes in the WUE-K to further explore the reasons for the changes in WUE from the perspective of the trends in the GPP and ET. The greater spatial variability of the trends in the WUE was mainly due to the different directions and amounts of GPP and ET in the different regions (Figure S5).
In the four different regions from west to the east (regions I, II, III and IV), the factors that most contributed to the WUEs were the mean temperature, mean precipitation, mean precipitation and LCC, respectively. The most important factor affecting the WUE in region I was the mean temperature. Region I was located in both arid and semiarid regions, where strong evaporation and low precipitation limit the vegetation growth [15]. The effect of the temperature on the WUE was largely reflected in the soil evaporation and the vegetation transpiration due to the sparse vegetation coverage [11,68,69]. The factor that contributed most to the WUE in region II was the mean precipitation. The results based on the site and the model both showed that the WUE of the Chinese terrestrial ecosystems increased quickly with precipitation and then reached saturation [15,64], which was generally consistent with our results from examining the effect of the precipitation on the trends of the WUE (Figure S4). In region III, the vegetation was sensitive to precipitation [15,39,70,71]. The WUE increased rapidly and then maintained a high rate with the increasing temperature (Figure S4) in region IV. This may have been due to the presence of a broad temperate grassland in northeast China that is mainly controlled by temperature [15]. In addition to climate factors, human activities also played an important role in the WUE. The variation trend of the WUE was different in the different regions, which was closely related to the changes in land cover (Figure 4b–e). From 1985 to 2012, the TNR experienced intense human activities, such as afforestation, which increased the forested area from approximately 10 million to 34 million hectares [34,35]. The WUE-K from the croplands to the grasslands was higher than that to forests in regions II to IV, and the WUE-K of the stable grasslands was higher than that of the forest that was converted from grasslands in all four regions, which implied that returning croplands to grasslands or protecting the original grasslands may be superior to afforestation and reforestation for maintaining higher WUE. The reason for this trend may be that grass is more likely to survive than forests in arid and semiarid regions [72], and there is more likely to be an impact on the ecosystem WUE from converting from other land use types to grasslands. In addition, if afforestation exceeds the carrying capacity of an ecosystem, degradation is inevitable [65], which is negative for the ecosystem WUE.
This study quantitatively assessed the impact of climate factors and land cover change on the ecosystem WUE, and the results could contribute to the design of governmental ecological policies. However, there are still some uncertainties in this study. First, in the RF, the relationships between the drivers and the target variable were not as simple as a formula or a graph, which made the mechanism between the drivers and the WUE difficult to explain by the theories of ecology and geography. Second, the spatial resolutions of the multisource datasets were not exactly the same, so there was some deviation in the expected results. Third, we mainly discussed the effects of the climate factors and human activities, such as LCC, on the WUE in this study. However, the WUE of an ecosystem is impacted by many other factors, including the leaf area index [73], stomatal conductance characteristics [74,75,76], the growth cycles of vegetation [63,77], drought stress [15], CO2 fertilization effects [22], and urbanization [30]. Additionally, the soil moisture, respiration, nitrogen content, and other soil conditions [78,79] also play important roles in improving the WUE of crops. Therefore, in the future, we will improve the above deficiencies by selecting a model or method that includes biophysical mechanisms to explore the drivers of changes in WUE, collecting data with the same spatial resolution to avoid problems caused by resolution mismatching, further exploring other factors affecting the WUE, and promoting the sustainable development of ecosystems in the TNR of China.

5. Conclusions

In this study, we explored the impacts of climate factors and human activities, especially land cover change, on the WUE dynamics in the TNR during the period of 1982 to 2015. Our results demonstrated that climate factors played dominant roles in affecting the WUE trends, contributing to approximately 84% of the WUE trends, while the land cover change played a relatively small role. Furthermore, our results also showed that the forests had the highest WUE values in the humid areas of the eastern TNR and that croplands had the highest WUE values in the arid areas of the western TNR. Of the total area, 44.34% displaying a significant increase and 5.89% displaying a significant decrease in the WUE from 1982 to 2015.
This study quantitatively assessed the impact of afforestation on the WUE in the TNR, which is critical for gaining a better understanding of the environmental changes due to the afforestation program in China. Overall, although the climate factors had a larger impact on the WUE dynamics than human activities under the background of climate change, our results suggested that the impacts of afforestation programs on the forest carbon and water cycles should be considered because they contribute to approximately 16% of the WUE change trends.

Supplementary Materials

The following are available online at https://www.mdpi.com/2072-4292/11/23/2766/s1. Figure S1: The methodological workflow of the research. Figure S2: Interannual variations of the spatially averaged WUE (WUE-M) of the different regions over the TNR from 1982–2015. Figure S3: The change levels of the annual WUE in China from 1982–2015. Figure S4: Partial dependence plots (PDP) for the climate factors. Figure S5. The classification of the WUE trends (p < 0.05) in the five subregions. Table S1. The criteria for the classification of the WUE trends.

Author Contributions

X.D. and X.Z. conceived of and designed the experiments. X.D. processed and analyzed the data. All authors contributed to the ideas, writing, and discussion.

Funding

This study was supported by the National Key Research and Development Program of China (Nos. 2016YFB0501404 and 2016YFA0600103).

Acknowledgments

The authors thank Yifeng Peng, Jiacheng Zhao, Haoyu Wang, Naijing Liu and Qian Zhou for the helpful comments that improved this manuscript and appreciate the comments from Doctor Wei Fang from Queens College, City University of New York.

Conflicts of Interest

The authors declare no conflict of interest.

References

  1. Bogardi, J.J.; Dudgeon, D.; Lawford, R.; Flinkerbusch, E.; Meyn, A.; Pahl-Wostl, C.; Vielhauer, K.; Vörösmarty, C. Water security for a planet under pressure: Interconnected challenges of a changing world call for sustainable solutions. Curr. Opin. Environ. Sustain. 2012, 4, 35–43. [Google Scholar] [CrossRef]
  2. Popkin, G. How much can forests fight climate change? Nature 2019, 565, 280–282. [Google Scholar] [CrossRef]
  3. Jackson, R.B.; Jobbágy, E.G.; Avissar, R.; Roy, S.B.; Barrett, D.J.; Cook, C.W.; Farley, K.A.; le Maitre, D.C.; McCarl, B.A.; Murray, B.C. Trading Water for Carbon with Biological Carbon Sequestration. Science 2005, 310, 1944–1947. [Google Scholar] [CrossRef]
  4. Menz, M.H.M.; Dixon, K.W.; Hobbs, R.J. Hurdles and Opportunities for Landscape-Scale Restoration. Science 2013, 339, 526–527. [Google Scholar] [CrossRef]
  5. United Nations General Assembly. Transforming Our World: The 2030 Agenda for Sustainable Development; Resolution Adopted by the General Assembly on September 25th 2015; United Nations General Assembly: New York, NY, USA, 2015. [Google Scholar]
  6. Fu, B.; Wang, S.; Liu, Y.; Liu, J.; Liang, W.; Miao, C. Hydrogeomorphic Ecosystem Responses to Natural and Anthropogenic Changes in the Loess Plateau of China. Annu. Rev. Earth Planet. Sci. 2017, 45, 223–243. [Google Scholar] [CrossRef]
  7. Feng, X.; Fu, B.; Piao, S.; Wang, S.; Ciais, P.; Zeng, Z.; Lü, Y.; Zeng, Y.; Li, Y.; Jiang, X.; et al. Revegetation in China’s Loess Plateau is approaching sustainable water resource limits. Nat. Clim. Chang. 2016, 6, 1019. [Google Scholar] [CrossRef]
  8. Cao, S.; Wang, G.; Chen, L. Questionable value of planting thirsty trees in dry regions. Nature 2010, 465, 31. [Google Scholar] [CrossRef] [PubMed]
  9. Yu, G.; Song, X.; Wang, Q.; Liu, Y.; Guan, D.; Yan, J.; Sun, X.; Zhang, L.; Wen, X. Water-use efficiency of forest ecosystems in eastern China and its relations to climatic variables. New Phytol. 2008, 177, 927–937. [Google Scholar] [CrossRef] [PubMed]
  10. Huang, L.; He, B.; Han, L.; Liu, J.J.; Wang, H.Y.; Chen, Z.Y. A global examination of the response of ecosystem water-use efficiency to drought based on MODIS data. Sci. Total Environ. 2017, 601–602, 1097–1107. [Google Scholar] [CrossRef] [PubMed]
  11. Sun, Y.; Piao, S.; Huang, M.; Ciais, P.; Zeng, Z.; Cheng, L.; Li, X.; Zhang, X.; Mao, J.; Peng, S. Global patterns and climate drivers of water-use efficiency in terrestrial ecosystems deduced from satellite-based datasets and carbon cycle models. Glob. Ecol. Biogeogr. 2016, 25, 311–323. [Google Scholar] [CrossRef]
  12. Huang, M.; Shao, M.; Zhang, L.; Li, Y. Water use efficiency and sustainability of different long-term crop rotation systems in the Loess Plateau of China. Soil Tillage Res. 2003, 72, 95–104. [Google Scholar] [CrossRef]
  13. Zhang, X.; Susan Moran, M.; Zhao, X.; Liu, S.; Zhou, T.; Ponce-Campos, G.E.; Liu, F. Impact of prolonged drought on rainfall use efficiency using MODIS data across China in the early 21st century. Remote Sens. Environ. 2014, 150, 188–197. [Google Scholar] [CrossRef]
  14. Yang, Y.; Guan, H.; Okke, B.; Mcvicar, T.R.; Long, D.; Piao, S.; Liang, W.; Liu, B.; Jin, Z.; Simmons, C.T. Contrasting responses of water use efficiency to drought across global terrestrial ecosystems. Sci. Rep. 2016, 6, 23284. [Google Scholar] [CrossRef] [PubMed]
  15. Liu, Y.; Xiao, J.; Ju, W.; Zhou, Y.; Wang, S.; Wu, X. Water use efficiency of China’s terrestrial ecosystems and responses to drought. Sci. Rep. 2015, 5, 13799. [Google Scholar] [CrossRef] [PubMed]
  16. Cheng, L.; Zhang, L.; Wang, Y.P.; Canadell, J.G.; Chiew, F.H.S.; Beringer, J.; Li, L.; Miralles, D.G.; Piao, S.; Zhang, Y. Recent increases in terrestrial carbon uptake at little cost to the water cycle. Nat. Commun. 2017, 8, 110. [Google Scholar] [CrossRef]
  17. Huang, M.; Piao, S.; Zeng, Z.; Peng, S.; Ciais, P.; Cheng, L.; Mao, J.; Poulter, B.; Shi, X.; Yao, Y.; et al. Seasonal responses of terrestrial ecosystem water-use efficiency to climate change. Glob. Chang. Biol. 2016, 22, 2165–2177. [Google Scholar] [CrossRef]
  18. Sun, S.; Song, Z.; Wu, X.; Wang, T.; Wu, Y.; Du, W.; Che, T.; Huang, C.; Zhang, X.; Ping, B.; et al. Spatio-temporal variations in water use efficiency and its drivers in China over the last three decades. Ecol. Indic. 2018, 94, 292–304. [Google Scholar] [CrossRef]
  19. Baldocchi, D. A comparative study of mass and energy exchange rates over a closed C3 (wheat) and an open C4 (corn) crop: II. CO2 exchange and water use efficiency. Agric. For. Meteorol. 1994, 67, 291–321. [Google Scholar] [CrossRef]
  20. Ito, A.; Inatomi, M. Water-Use Efficiency of the Terrestrial Biosphere: A Model Analysis Focusing on Interactions between the Global Carbon and Water Cycles. J. Hydrometeorol. 2012, 13, 681–694. [Google Scholar] [CrossRef]
  21. Zhu, X.; Yu, G.; Wang, Q.; Hu, Z.; Zheng, H.; Li, S.; Sun, X.; Zhang, Y.; Yan, J.; Wang, H. Spatial variability of water use efficiency in China’s terrestrial ecosystems. Glob. Planet. Chang. 2015, 129, 37–44. [Google Scholar] [CrossRef]
  22. Keenan, T.F.; Hollinger, D.Y.; Bohrer, G.; Dragoni, D.; Munger, J.W.; Schmid, H.P.; Richardson, A.D. Increase in forest water-use efficiency as atmospheric carbon dioxide concentrations rise. Nature 2013, 499, 324. [Google Scholar] [CrossRef] [PubMed]
  23. Xue, B.; Guo, Q.; Otto, A.; Xiao, J.; Tao, S.; Li, L. Global patterns, trends, and drivers of water use efficiency from 2000 to 2013. Ecosphere 2016, 6, 1–18. [Google Scholar] [CrossRef]
  24. Yao, Y.; Liang, S.; Li, X.; Hong, Y.; Fisher, J.B.; Zhang, N.; Chen, J.; Cheng, J.; Zhao, S.; Zhang, X. Bayesian multimodel estimation of global terrestrial latent heat flux from eddy covariance, meteorological, and satellite observations. J. Geophys. Res. Atmos. 2014, 119, 4521–4545. [Google Scholar] [CrossRef]
  25. Cai, W.; Yuan, W.; Liang, S.; Zhang, X.; Dong, W.; Xia, J.; Fu, Y.; Chen, Y.; Liu, D.; Zhang, Q. Improved estimations of gross primary production using satellite-derived photosynthetically active radiation. J. Geophys. Res. Biogeosci. 2014, 119, 110–123. [Google Scholar] [CrossRef]
  26. Tian, H.; Lu, C.; Chen, G.; Xu, X.; Liu, M.; Ren, W.; Tao, B.; Sun, G.; Pan, S.; Liu, J. Climate and land use controls over terrestrial water use efficiency in monsoon Asia. Ecohydrology 2011, 4, 322–340. [Google Scholar] [CrossRef]
  27. Fei, L.; Wang, X.; Bing, H.; Ouyang, Z.; Duan, X.; Hua, Z.; Hong, M. Soil carbon sequestrations by nitrogen fertilizer application, straw return and no-tillage in China’s cropland. Glob. Chang. Biol. 2010, 15, 281–305. [Google Scholar] [CrossRef]
  28. Jarosz, N.; Béziat, P.; Bonnefond, J.M.; Brunet, Y.; Calvet, J.C.; Ceschia, E.; Elbers, J.A.; Hutjes, R.W.A.; Traullé, O. Effect of land use on carbon dioxide, water vapour and energy exchange over terrestrial ecosystems in Southwestern France during the CERES campaign. Biogeosci. Discuss. 2009, 6, 2755–2784. [Google Scholar] [CrossRef]
  29. Sakai, R.K.; Fitzjarrald, D.R.; Moraes, O.L.L.; Staebler, R.M.; Acevedo, O.C.; Czikowsky, M.J.; Silva, R.D.; Brait, E.; Miranda, V. Land-use change effects on local energy, water, and carbon balances in an Amazonian agricultural field. Glob. Chang. Biol. 2004, 10, 895–907. [Google Scholar] [CrossRef]
  30. Jiang, B.; Liang, S.; Yuan, W. Observational evidence for impacts of vegetation change on local surface climate over northern China using the Granger causality test. J. Geophys. Res. Biogeosci. 2015, 120, 1–12. [Google Scholar] [CrossRef]
  31. Liu, J.; Li, S.; Ouyang, Z.; Tam, C.; Chen, X. Ecological and socioeconomic effects of China’s policies for ecosystem services. Proc. Natl. Acad. Sci. USA 2008, 105, 9477–9482. [Google Scholar] [CrossRef]
  32. Zhang, Y.; Liang, S. Changes in forest biomass and linkage to climate and forest disturbances over Northeastern China. Glob. Chang. Biol. 2014, 20, 2596–2606. [Google Scholar] [CrossRef] [PubMed]
  33. Xie, X.; Liang, S.; Yao, Y.; Jia, K.; Meng, S.; Li, J. Detection and attribution of changes in hydrological cycle over the Three-North region of China: Climate change versus afforestation effect. Agric. For. Meteorol. 2015, 203, 74–87. [Google Scholar] [CrossRef]
  34. Zhang, Y.; Peng, C.; Li, W.; Tian, L.; Zhu, Q.; Chen, H.; Fang, X.; Zhang, G.; Liu, G.; Mu, X.; et al. Multiple afforestation programs accelerate the greenness in the ‘Three North’ region of China from 1982 to 2013. Ecol. Indic. 2016, 61, 404–412. [Google Scholar] [CrossRef]
  35. Zhang, G.; Dong, J.; Xiao, X.; Hu, Z.; Sheldon, S. Effectiveness of ecological restoration projects in Horqin Sandy Land, China based on SPOT-VGT NDVI data. Ecol. Eng. 2012, 38, 20–29. [Google Scholar] [CrossRef]
  36. Yu, M.; Li, Q.; Hayes, M.J.; Svoboda, M.D.; Heim, R.R. Are droughts becoming more frequent or severe in China based on the Standardized Precipitation Evapotranspiration Index: 1951–2010? Int. J. Climatol. 2014, 34, 545–558. [Google Scholar] [CrossRef]
  37. Ni, J. Carbon storage in grasslands of China. J. Arid Environ. 2002, 50, 205–218. [Google Scholar] [CrossRef]
  38. Zhang, H.; Xiong, Y.; Huang, G.; Xu, X.; Huang, Q. Effects of water stress on processing tomatoes yield, quality and water use efficiency with plastic mulched drip irrigation in sandy soil of the Hetao Irrigation District. Agric. Water Manag. 2017, 179, 205–214. [Google Scholar] [CrossRef]
  39. Jin, N.; Ren, W.; Tao, B.; He, L.; Ren, Q.; Li, S.; Yu, Q. Effects of water stress on water use efficiency of irrigated and rainfed wheat in the Loess Plateau, China. Sci. Total Environ. 2018, 642, 1–11. [Google Scholar] [CrossRef]
  40. Liu, Q.; Chen, Y.; Liu, Y.; Wen, X.; Liao, Y. Coupling effects of plastic film mulching and urea types on water use efficiency and grain yield of maize in the Loess Plateau, China. Soil Tillage Res. 2016, 157, 1–10. [Google Scholar] [CrossRef]
  41. Wang, Y.; Xie, Z.; Malhi, S.S.; Vera, C.L.; Zhang, Y. Gravel-sand mulch thickness effects on soil temperature, evaporation, water use efficiency and yield of watermelon in semi-arid Loess Plateau, China. Acta Ecol. Sin. 2014, 34, 261–265. [Google Scholar] [CrossRef]
  42. Liu, J.; Zhang, Z.; Xu, X.; Kuang, W.; Zhou, W.; Zhang, S.; Li, R.; Yan, C.; Yu, D.; Wu, S.; et al. Spatial patterns and driving forces of land use change in China during the early 21st century. J. Geogr. Sci. 2010, 20, 483–494. [Google Scholar] [CrossRef]
  43. Yuan, W.; Liu, S.; Yu, G.; Bonnefond, J.-M.; Chen, J.; Davis, K.; Desai, A.R.; Goldstein, A.H.; Gianelle, D.; Rossi, F.; et al. Global estimates of evapotranspiration and gross primary production based on MODIS and global meteorology data. Remote Sens. Environ. 2010, 114, 1416–1431. [Google Scholar] [CrossRef] [Green Version]
  44. Duan, Q.; Phillips, T.J. Bayesian estimation of local signal and noise in multimodel simulations of climate change. J. Geophys. Res. Atmos. 2010, 115. [Google Scholar] [CrossRef]
  45. Liu, J.; Liu, M.; Tian, H.; Zhuang, D.; Zhang, Z.; Zhang, W.; Tang, X.; Deng, X. Spatial and temporal patterns of China’s cropland during 1990–2000: An analysis based on Landsat TM data. Remote Sens. Environ. 2005, 98, 442–456. [Google Scholar] [CrossRef]
  46. Harris, I.; Jones, P.D.; Osborn, T.J.; Lister, D.H. Updated high-resolution grids of monthly climatic observations—The CRU TS3.10 Dataset. Int. J. Climatol. 2014, 34, 623–642. [Google Scholar] [CrossRef] [Green Version]
  47. Mitchell, T.D.; Jones, P.D. An improved method of constructing a database of monthly climate observations and associated high-resolution grids. Int. J. Climatol. 2005, 25, 693–712. [Google Scholar] [CrossRef]
  48. New, M.; Hulme, M.; Jones, P. Representing Twentieth-Century Space-Time Climate Variability. Part II: Development of 1901-96 Monthly Grids of Terrestrial Surface Climate. J. Clim. 2000, 13, 2217–2238. [Google Scholar] [CrossRef]
  49. Jones, P.D.; Lister, D.H.; Osborn, T.J.; Harpham, C.; Salmon, M.; Morice, C.P. Hemispheric and large-scale land-surface air temperature variations: An extensive revision and an update to 2010. J. Geophys. Res. Atmos. 2012, 117. [Google Scholar] [CrossRef] [Green Version]
  50. Jong, R.D.; Schaepman, M.E.; Furrer, R.; Bruin, S.D.; Verburg, P.H. Spatial relationship between climatologies and changes in global vegetation activity. Glob. Chang. Biol. 2013, 19, 1953–1964. [Google Scholar] [CrossRef]
  51. Wu, D.; Zhao, X.; Liang, S.; Zhou, T.; Huang, K.; Tang, B.; Zhao, W. Time-lag effects of global vegetation responses to climate change. Glob. Chang. Biol. 2015, 21, 3520–3531. [Google Scholar] [CrossRef]
  52. Zhang, L.; Tian, J.; He, H.; Ren, X.; Sun, X.; Yu, G.; Lu, Q.; Lv, L. Evaluation of Water Use Efficiency Derived from MODIS Products against Eddy Variance Measurements in China. Remote Sens. 2015, 7, 11183–11201. [Google Scholar] [CrossRef] [Green Version]
  53. Piao, S.; Yin, G.; Tan, J.; Cheng, L.; Huang, M.; Li, Y.; Liu, R.; Mao, J.; Myneni, R.B.; Peng, S.; et al. Detection and attribution of vegetation greening trend in China over the last 30 years. Glob. Chang. Biol. 2015, 21, 1601–1609. [Google Scholar] [CrossRef] [PubMed]
  54. Peng, S.; Chen, A.; Xu, L.; Cao, C.; Fang, J.; Ranga, B.M.; Jorge, E.P.; Compton, J.T.; Piao, S. Recent change of vegetation growth trend in China. Environ. Res. Lett. 2011, 6, 044027. [Google Scholar] [CrossRef]
  55. Assal, T.J.; Anderson, P.J.; Sibold, J. Spatial and temporal trends of drought effects in a heterogeneous semi-arid forest ecosystem. For. Ecol. Manag. 2016, 365, 137–151. [Google Scholar] [CrossRef] [Green Version]
  56. Czerwinski, C.J.; King, D.J.; Mitchell, S.W. Mapping forest growth and decline in a temperate mixed forest using temporal trend analysis of Landsat imagery, 1987–2010. Remote Sens. Environ. 2014, 141, 188–200. [Google Scholar] [CrossRef]
  57. Leroux, L.; Bégué, A.; Lo Seen, D.; Jolivot, A.; Kayitakire, F. Driving forces of recent vegetation changes in the Sahel: Lessons learned from regional and local level analyses. Remote Sens. Environ. 2017, 191, 38–54. [Google Scholar] [CrossRef] [Green Version]
  58. Breiman, L. Statistical modeling: The two cultures. Stat. Sci. 2001, 16, 199–231. [Google Scholar] [CrossRef]
  59. Cutler, D.R.; Edwards, T.C., Jr.; Beard, K.H.; Cutler, A.; Hess, K.T.; Gibson, J.; Lawler, J.J. Random forests for classification in ecology. Ecology 2007, 88, 2783–2792. [Google Scholar] [CrossRef]
  60. Schwalm, C.R.; Anderegg, W.R.L.; Michalak, A.M.; Fisher, J.B.; Biondi, F.; Koch, G.; Litvak, M.; Ogle, K.; Shaw, J.D.; Wolf, A.; et al. Global patterns of drought recovery. Nature 2017, 548, 202–205. [Google Scholar] [CrossRef]
  61. Ye, T.; Zhao, N.; Yang, X.; Ouyang, Z.; Liu, X.; Chen, Q.; Hu, K.; Yue, W.; Qi, J.; Li, Z.; et al. Improved population mapping for China using remotely sensed and points-of-interest data within a random forests model. Sci. Total Environ. 2019, 658, 936–946. [Google Scholar] [CrossRef]
  62. Liaw, A.; Wiener, M. Classification and regression by randomForest. R News 2002, 2, 18–22. [Google Scholar]
  63. Behrens, T.; Schmidt, K.; Ramirez-Lopez, L.; Gallant, J.; Zhu, A.; Scholten, T. Hyper-scale digital soil mapping and soil formation analysis. Geoderma 2014, 213, 578–588. [Google Scholar] [CrossRef]
  64. Xiao, J.; Sun, G.; Chen, J.; Chen, H.; Chen, S.; Dong, G.; Gao, S.; Guo, H.; Guo, J.; Han, S.; et al. Carbon fluxes, evapotranspiration, and water use efficiency of terrestrial ecosystems in China. Agric. For. Meteorol. 2013, 182–183, 76–90. [Google Scholar] [CrossRef]
  65. Gao, Y.; Zhu, X.; Yu, G.; He, N.; Wang, Q.; Tian, J. Water use efficiency threshold for terrestrial ecosystem carbon sequestration in China under afforestation. Agric. For. Meteorol. 2014, 195–196, 32–37. [Google Scholar] [CrossRef]
  66. Tang, X.; Li, H.; Desai, A.R.; Nagy, Z.; Luo, J.; Kolb, T.E.; Olioso, A.; Xu, X.; Yao, L.; Kutsch, W.; et al. How is water-use efficiency of terrestrial ecosystems distributed and changing on Earth? Sci. Rep. 2014, 4, 7483. [Google Scholar] [CrossRef]
  67. Zhang, T.; Peng, J.; Liang, W.; Yang, Y.; Liu, Y. Spatial–temporal patterns of water use efficiency and climate controls in China’s Loess Plateau during 2000–2010. Sci. Total Environ. 2016, 565, 105–122. [Google Scholar] [CrossRef]
  68. Hu, Z.; Yu, G.; Fu, Y.; Sun, X.; Li, Y.; Shi, P.; Wang, Y.; Zheng, Z. Effects of vegetation control on ecosystem water use efficiency within and among four grassland ecosystems in China. Glob. Chang. Biol. 2008, 14, 1609–1619. [Google Scholar] [CrossRef]
  69. Zhang, Z.; Jiang, H.; Liu, J.; Zhou, G.; Liu, S.; Zhang, X. Assessment on water use efficiency under climate change and heterogeneous carbon dioxide in China terrestrial ecosystems. Procedia Environ. Sci. 2012, 13, 2031–2044. [Google Scholar] [CrossRef] [Green Version]
  70. Sun, H.; Shen, Y.; Yu, Q.; Flerchinger, G.N.; Zhang, Y.; Liu, C.; Zhang, X. Effect of precipitation change on water balance and WUE of the winter wheat–summer maize rotation in the North China Plain. Agric. Water Manag. 2010, 97, 1139–1145. [Google Scholar] [CrossRef]
  71. Ma, M.; Yuan, W.; Dong, J.; Zhang, F.; Cai, W.; Li, H. Large-scale estimates of gross primary production on the Qinghai-Tibet plateau based on remote sensing data. Int. J. Digit. Earth 2018, 11, 1166–1183. [Google Scholar] [CrossRef]
  72. Yuan, X.; Li, L.; Chen, X.; Shi, H. Effects of Precipitation Intensity and Temperature on NDVI-Based Grass Change over Northern China during the Period from 1982 to 2011. Remote Sens. 2015, 7, 10164–10183. [Google Scholar] [CrossRef] [Green Version]
  73. Li, Y.; Shi, H.; Zhou, L.; Eamus, D.; Huete, A.; Li, L.; Cleverly, J.; Hu, Z.; Harahap, M.; Yu, Q.; et al. Disentangling Climate and LAI Effects on Seasonal Variability in Water Use Efficiency Across Terrestrial Ecosystems in China. J. Geophys. Res. Biogeosci. 2018, 123, 2429–2443. [Google Scholar] [CrossRef]
  74. Franks, P.J.; Doheny-Adams, T.W.; Britton-Harper, Z.J.; Gray, J.E. Increasing water-use efficiency directly through genetic manipulation of stomatal density. New Phytol. 2015, 207, 188–195. [Google Scholar] [CrossRef] [PubMed]
  75. Liu, C.; He, N.; Zhang, J.; Li, Y.; Wang, Q.; Sack, L.; Yu, G. Variation of stomatal traits from cold temperate to tropical forests and association with water use efficiency. Funct. Ecol. 2018, 32, 20–28. [Google Scholar] [CrossRef] [Green Version]
  76. Lu, X.; Chen, M.; Liu, Y.; Miralles, D.G.; Wang, F. Enhanced water use efficiency in global terrestrial ecosystems under increasing aerosol loadings. Agric. For. Meteorol. 2017, 237–238, 39–49. [Google Scholar] [CrossRef]
  77. Fyllas, N.M.; Christopoulou, A.; Galanidis, A.; Michelaki, C.Z.; Dimitrakopoulos, P.G.; Fulé, P.Z.; Arianoutsou, M. Tree growth-climate relationships in a forest-plot network on Mediterranean mountains. Sci. Total Environ. 2017, 598, 393–403. [Google Scholar] [CrossRef]
  78. Wang, X.; Dai, K.; Zhang, D.; Zhang, X.; Wang, Y.; Zhao, Q.; Cai, D.; Hoogmoed, W.B.; Oenema, O. Dryland maize yields and water use efficiency in response to tillage/crop stubble and nutrient management practices in China. Field Crop. Res. 2011, 120, 47–57. [Google Scholar] [CrossRef]
  79. Hui, D.; Yu, C.-L.; Deng, Q.; Saini, P.; Collins, K.; Koff, J. Weak Effects of Biochar and Nitrogen Fertilization on Switchgrass Photosynthesis, Biomass, and Soil Respiration. Agriculture 2018, 8, 143. [Google Scholar] [CrossRef] [Green Version]
Figure 1. The study area; (a) the land cover distribution of the TNR in 2015; (b–g) For 1982–2013, the mean monthly precipitation, temperature and solar radiation in the growing season (April–October) (Mp, /mm; Mt, /°C; Mr, /W m−2) changed with longitude and latitude. The solid lines show the mean value of every climate factor, and the color zones represent the standard deviation of each interval. (h) Location of the TNR in China.
Remotesensing 11 02766 g001
Figure 2. Comparison of the GLASS-WUE with the MODIS-WUE (Unit, g C kg−1 H2O). The x-axis and y-axis are the WUE values calculated by MODIS and GLASS, respectively. The red dashed line represents the regression line, and the round, triangle, square, and diamond symbols represent regions I to IV, with different colors for croplands, forests and grasslands, respectively. The error bar indicates the standard error of the mean. (ae) Comparison of the GLASS-WUE with the MODIS-WUE in the four regions. The four regions are named regions I, II, III and IV.
Remotesensing 11 02766 g002
Figure 3. The spatial distribution of the mean WUE values (WUE-M) in northern China from 1982–2015. (ad) The WUE-M violin plots of croplands, forests and grasslands in regions I to IV. The four regions are named regions I, II, III and IV.
Remotesensing 11 02766 g003
Figure 4. (a) The spatial distribution of the WUE trends (WUE-K) in northern China from 1982–2015 (p < 0.05); (b–e) The WUE-K mean column chart of the conversions of cropland, forest and grassland in the four regions between 1990 and 2015 with standard deviation error bars. C refers to croplands, F to forests, and G to grasslands. C-C refers to the croplands in 1990, which were still croplands in 2015; C-F refers to the croplands in 1990, which were converted into forests in 2015; and C-G refers to the croplands in 1990, which were converted into grasslands in 2015. The rest of the abbreviations can be extrapolated following these conventions.
Remotesensing 11 02766 g004
Figure 5. Importance of the variables to the WUE trends in northern China via the RF. The seven factors in the RF were LCC, the mean precipitation (Mp), temperature (Mt) and solar radiation (Mr), and their trends (Kp, Kt and Kr, respectively).
Remotesensing 11 02766 g005
Table 1. Variables used as the drivers of the changes in WUE throughout the study area.
Variable ClassVariable NameDefinition and UnitsData SourceSpatial Resolution
Climate factorsMpmean precipitation during the growing season from 1982 to 2013 (mm)CRU0.5°
Mtmean temperature during the growing season from 1982 to 2013 (°C)CRU0.5°
Mrmean solar radiation during the growing season from 1982 to 2013 (W m−2)CRU0.5°
Kpthe trends of mean precipitation during the growing season from 1982 to 2013 (mm yr−1)CRU0.5°
Ktthe trends of mean temperature during the growing season from 1982 to 2013 (°C yr−1)CRU0.5°
Krthe trends of solar radiation during the growing season from 1982 to 2013 (W m−2 yr)CRU0.5°
Human activitiesLCCland cover changes from 1990 to 2015RESDC1 km

