Article

A Preliminary Study of Three-Point Onboard External Calibration for Tracking Radiometric Stability and Accuracy

1
Department of Electrical and Computer Engineering, University at Albany–State University of New York, Albany, NY 12222, USA
2
NASA Goddard Space Flight Center, Greenbelt, MD 20771, USA
*
Author to whom correspondence should be addressed.
Remote Sens. 2019, 11(23), 2790; https://doi.org/10.3390/rs11232790
Submission received: 11 October 2019 / Revised: 21 November 2019 / Accepted: 22 November 2019 / Published: 26 November 2019

Abstract

:
Absolute calibration of radiometers is usually implemented onboard using one hot and one cold external calibration targets. However, two-point calibration methods are unable to differentiate calibration drifts and associated errors from fluctuations in receiver gain and offset. Furthermore, they are inadequate to characterize temporal calibration stability of radiometers. In this paper, a preliminary study with linear radiometer systems has been presented to show that onboard external three-point calibration offers the means to quantify calibration drifts in the radiometer systems, and characterize associated errors as well as temporal stability in Earth and space measurements. Radiometers with three external calibration reference targets operating two data processing paths: i.e., (1) measurement path and (2) calibration validation path have been introduced. In the calibration validation data processing path, measurements of one known calibration target is calibrated using the other two calibration references, and temporal calibration stability and possible calibration temperature drifts are analyzed. In the measurement data processing path, the impact of the calibration drifts on Earth and space measurements is quantified and bounded by an upper limit. This two-path analysis is performed through calibration error analysis (CEA) diagrams introduced in this paper.

Graphical Abstract

1. Introduction

For more than six decades radiometers have been used to measure important geophysical parameters over extended time periods to analyze the Earth and other astronomical systems, and track changes in them. On the other hand, performing reliable continuous observations and detecting small, long term trends accurately via radiometers require precise absolute calibration and increased calibration stability. For example, to measure long-term global climate change in our planet from space, variations in atmospheric temperatures as small as 0.1 °C per decade, and in ozone concentrations as little as 1% per decade should be detected by the radiometer receivers [1]. Thus, during the operational lifetime of radiometers, it is critical to track any calibration drifts, and correct radiometer measurements when calibration errors occur [2].
Absolute calibration of a working radiometer is usually performed onboard by observing one hot and one cold external reference targets to identify the receiver gain and offset, i.e., by implementing a two-point algorithm approach [3,4,5,6,7]. However, two-point algorithms are inadequate to distinguish calibration drifts smaller than the sensitivity of the thermistors on the calibration targets, or errors and uncertainties associated with the measurements of calibration references from variations in the radiometer gain and offset because of aging of the instrument or any other change in the characteristics of the system. Furthermore, they are unable to characterize temporal calibration stability. Internal noise diodes, owing to their low mass and power consumption, have been used in some radiometer systems to introduce additional calibration references to overcome these problems and assess long-term calibration stability and accuracy [8]. However, such internal calibration sources cannot be used for absolute calibration of a radiometer system as they are not sensitive to changes beyond the point they are introduced to the system, such as antenna losses [9]. In addition, noise diodes also need to be recalibrated on-orbit using external calibration sources to mitigate noise diode excess temperature biases, thus are themselves susceptible to calibration drifts and errors mentioned above for two-point external calibration schemes [10]. Finally, obtaining sensitive and stable noise diodes, switches, waveguides, and couplers can be challenging especially for higher frequencies, which limits the use of internal noise diodes [11,12,13]. This paper, on the other hand, aims to address this issue by presenting a novel three-point onboard calibration method that utilizes an additional external calibration reference target, and offers the means to quantify calibration drifts, temporal stability, and associated measurement errors. In this method, the third calibration target allows identifying possible temperature drifts and investigating temporal calibration stability by replacing the unknown measurand with a known calibration reference to be calibrated using the remaining calibration targets. Quantification of the calibration errors because of such drifts and instabilities, on the other hand, is performed through a new concept called calibration error analysis diagrams. Recent developments in design and manufacturing of less massive and stable blackbody calibration references with almost-ideal emissivity values may enable implementation of such external calibration procedures [14,15]; thus, a preliminary analysis with linear radiometer systems is discussed in this paper. Nonlinear effects, on the other hand, are ignored for simplicity.

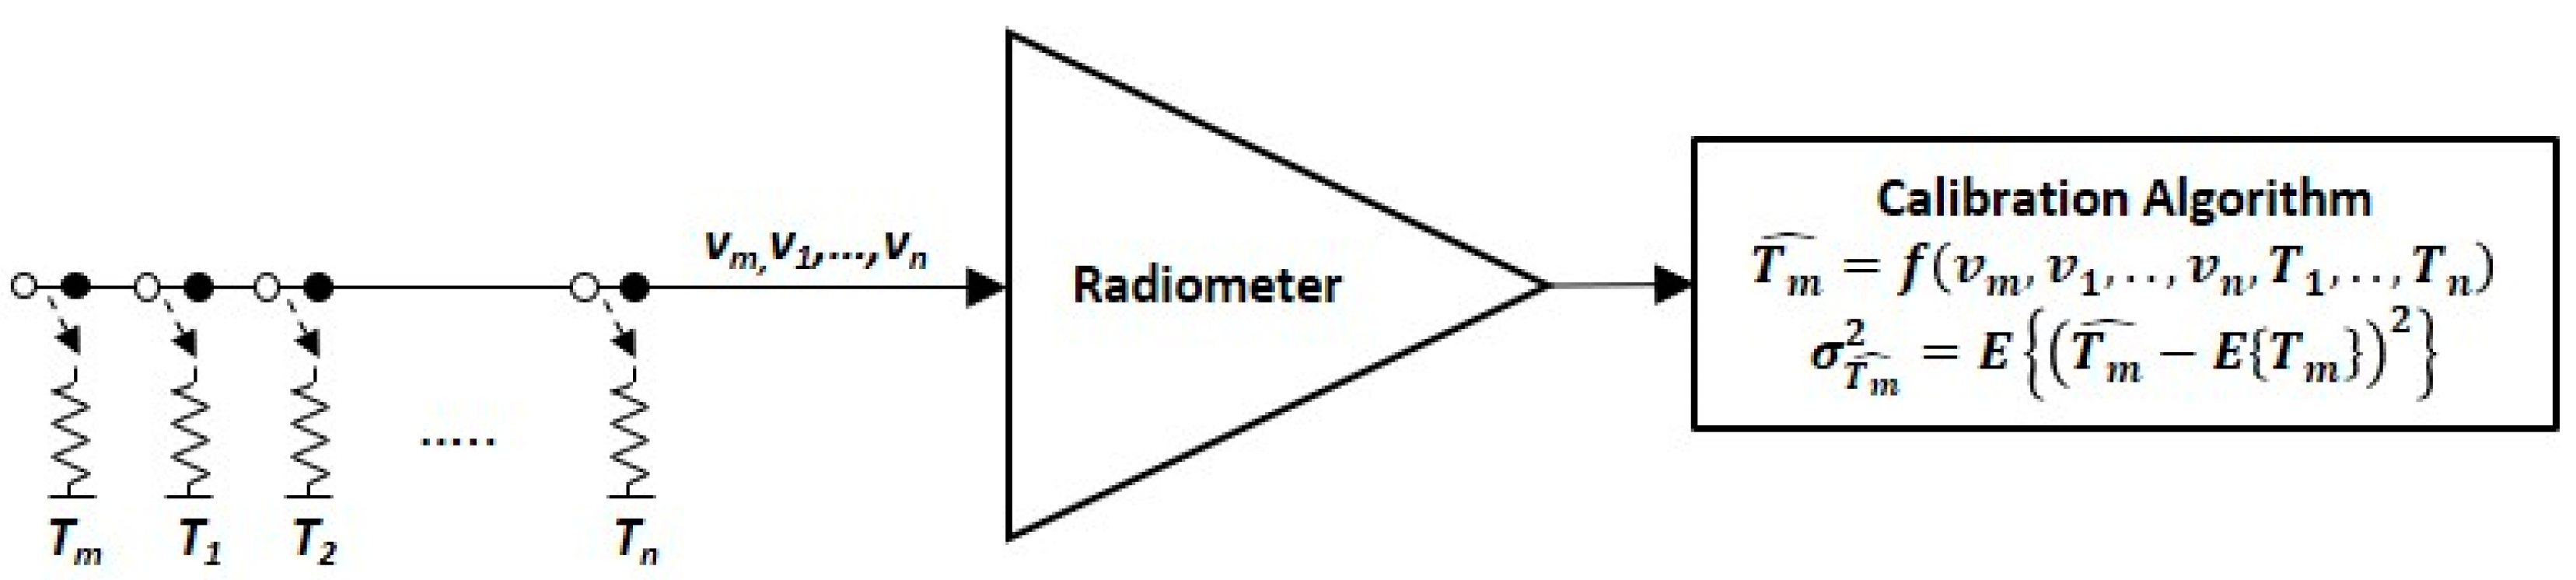
2. Linear Onboard Radiometer Calibration

For a radiometer system observing a measurand, i.e., target, with temperature T m , the general linear calibration model based on least square regression which includes n external calibration reference targets as shown in Figure 1, is given as [9,16]:
T m ^ = ( v m v i n ) i = 1 n ( v i v i n ) T i i = 1 n ( v i v i n ) 2 + T i n
where T m ^ is the estimate of the measurand temperature as the result of calibration, v m and v i are the post-gain voltage counts associated with the measurand and ith calibration target observations, respectively, and T i is the temperature of the ith calibration reference target. T i n and v i n represent the average temperature of the n calibration targets and average of the voltage counts associated with these n calibration targets, respectively. According to Equation (1), the instantaneous radiometer gain, g , and offset, o , can be calculated as:
g = i = 1 n ( v i v i n ) T i i = 1 n ( v i v i n ) 2
o = T i n g · v i n
The uncertainty, i.e., standard deviation, inherent in the measurand brightness temperature estimate described by Equation (1) is expressed as:
σ T m ^ 2 = σ T m 2 + i = 1 n ( σ T i 2 + σ T i m 2 ) n 2 + ( T m T i m n ) 2 i = 1 n ( T i m T i m n ) 2 ( σ T i 2 + σ T i m 2 ) ( i = 1 n ( T i m T i m n ) 2 ) 2 + 2 ( T m T i m n ) i = 1 n ( T i m T i m n ) ( σ T i 2 + σ T i m 2 ) n i = 1 n ( T i m T i m n ) 2
where σ T m ^ is the uncertainty associated with the measurand temperature estimate, σ T m and σ T i are the radiometric resolutions for the measurand and the ith calibration reference, respectively (see Equation (4) below), σ T i m is the uncertainty associated with the mean temperature of the ith calibration target, T i m is the mean temperature of the ith calibration reference, and T i m n is the average of the mean temperatures of the n calibration references. Radiometric resolutions for the measurand and the ith calibration reference, i.e., the resolution at the output of the radiometer when the antenna observes the measurand and the ith external calibration reference, respectively, are defined as:
σ T m = T r e c + T m B τ   and   σ T i = T r e c + T i B τ
where T r e c is the radiometer receiver temperature, B is the radiometer bandwidth, and τ is the integration time. In the limiting case where σ T i m = 0 and σ T i = σ T m , Equation (3) becomes:
σ T m ^ = σ T m ( 1 + 1 n + ( T m T i m n ) 2 i = 1 n ( T i m T i m n ) 2 )
Thus, the uncertainty is reduced by increasing the number of calibration measurements. One can also notice that, in the limit of increasing n, this expression converges to the radiometric resolution σ T m .
The following sections of this paper consider linear radiometer systems with two and three external calibration reference targets whose calibration is defined by Equations (1)–(5). Important parameters and their symbols in these equations are listed in Table 1 for reference.

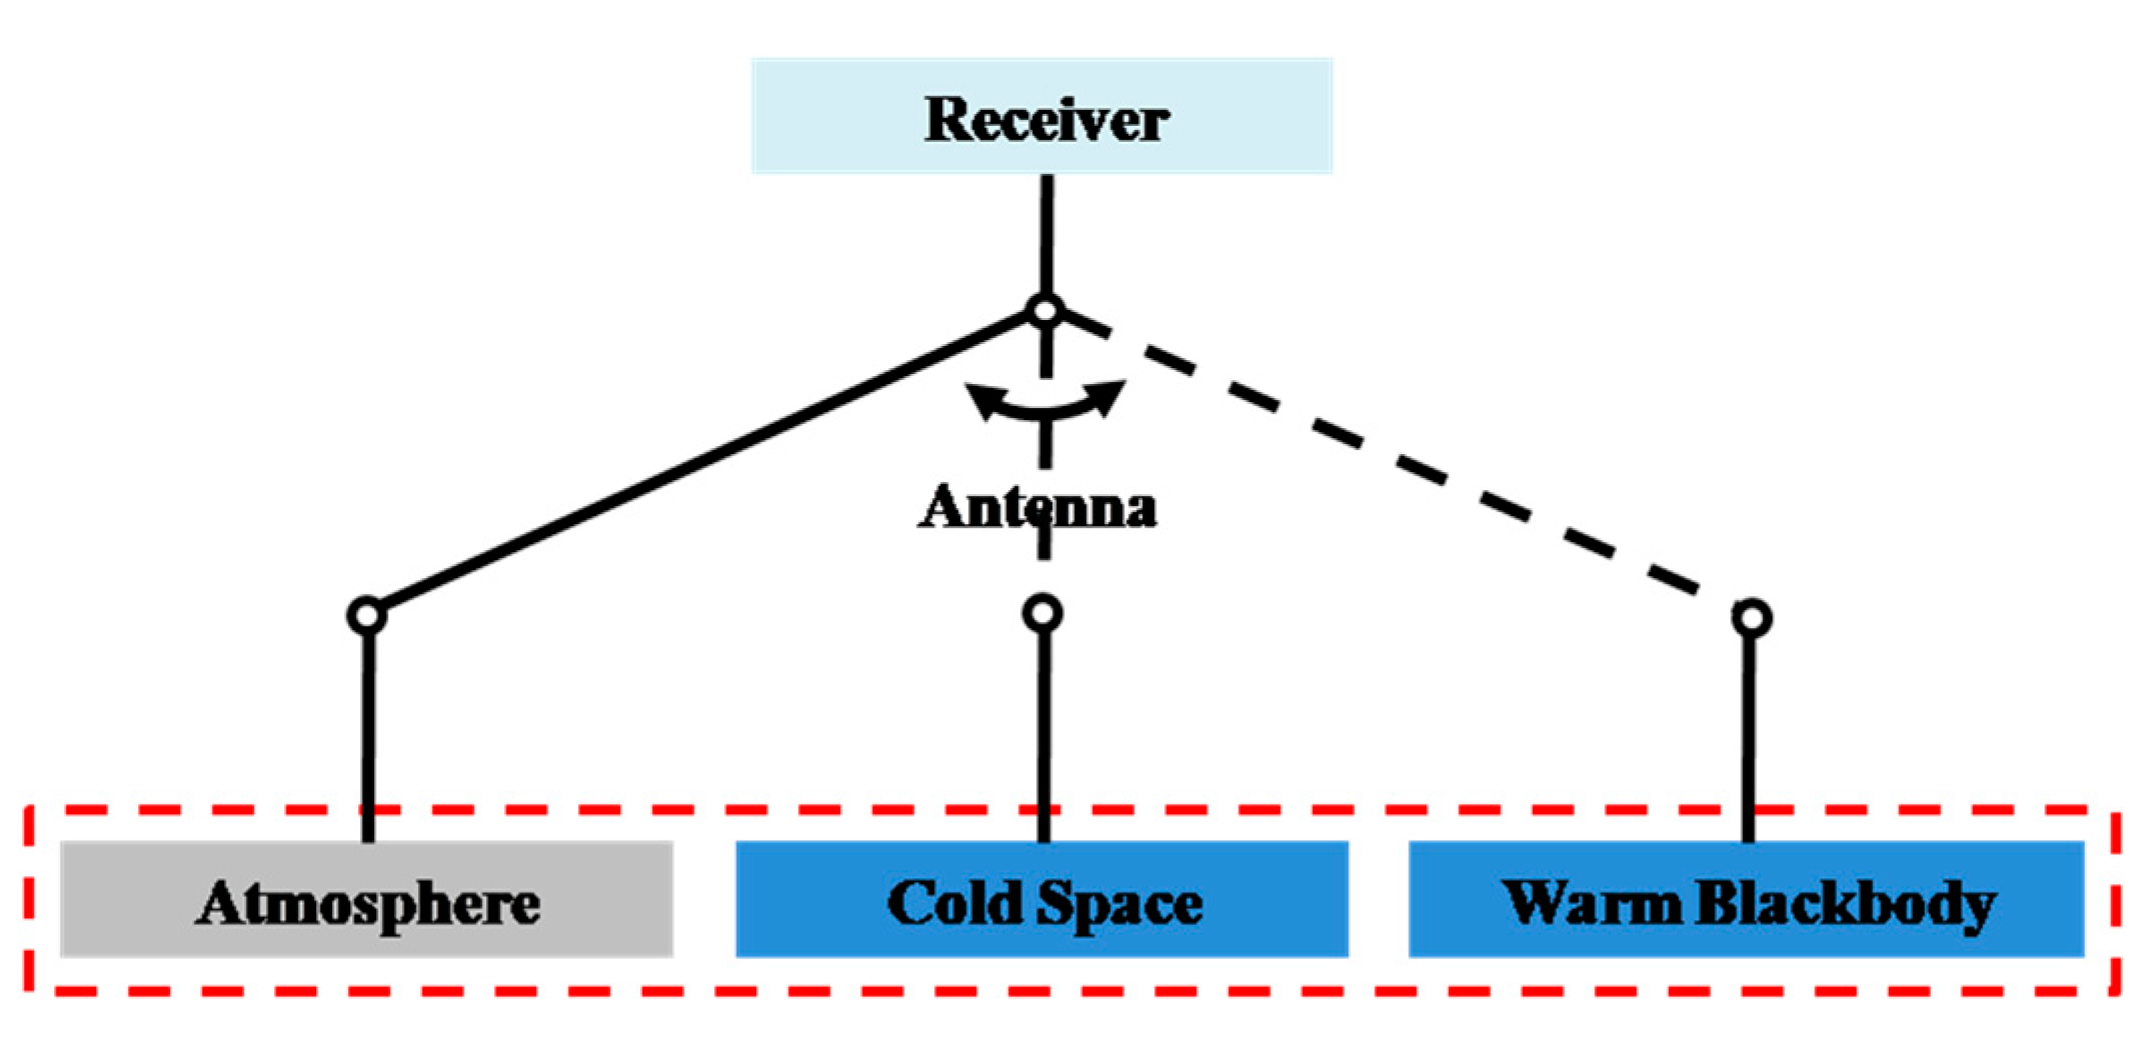
3. Two-Point Calibration

Consider a linear radiometer system with 1-s integration time, 500 K receiver temperature, and 100 MHz receiver bandwidth measuring the atmospheric brightness temperature wherein 2.7 K cold space and a 300 K warm blackbody target are used for absolute onboard calibration as shown in Figure 2. Since the atmospheric brightness temperature is unknown, changes in voltage counts because of the calibration drifts and errors and changes because of receiver gain and offset fluctuations cannot be separated in this system.
Assume that the brightness temperature of the atmosphere is 250 K, and the temperature of the warm blackbody reference target slightly changes over time (300 K + ΔTc), which goes undetected because of inadequate, deficient, or suboptimal thermistor deployment. Note that the radiometric resolution and measurement uncertainty of the 250 K atmospheric brightness temperature measurements are 0.075 K and 0.098 K with this configuration according to Equations (4) and (5), respectively. Errors in the 250 K atmospheric brightness temperature measurements because of such calibration drifts are shown in Figure 3.
Detectability of such calibration errors is defined for this study as the ratio of the magnitude of the measurement error to the uncertainty in the measurement:
D e t e c t a b i l i t y =   T m ^ T m σ T m ^
where T m ^ and T m are the ensemble average (over multiple calibration cycles) of the measurand temperature estimates and true measurand temperatures, respectively, and the error can be considered detectable if the absolute value of the detectability is larger than 1. Note that the measurement uncertainty in the denominator in Equation (6) is slightly different from the measurand radiometric resolution as it also includes uncertainties associated with calibration target measurements and the knowledge of calibration target temperatures as seen in Equation (3). Thus, this uncertainty parameter takes the effects of imperfect thermal radiations from external calibration targets and any ambiguity in their sensing into account.
Figure 4 depicts the detectability values for the measurement errors shown in Figure 3. As seen from the figure, the errors cannot be easily detected, even if the true atmospheric brightness temperature and the radiometer gain are known, as the absolute values of the detectabilities are below 1.
Moreover, as mentioned before, radiometer systems using two calibration reference targets cannot distinguish calibration drifts from changes in radiometer gain and offset since the measurand is unknown. Figure 5 demonstrates the percentage changes in the radiometer gain which would be assumed when the atmospheric brightness temperature measurements were thought error free, i.e., the true atmospheric brightness temperatures were considered not 250 K but 250 K plus the error values shown in Figure 3.
As seen from Figure 5, errors in atmospheric temperature brightness temperature measurements because of the drifts in calibration reference temperatures can be easily mistaken for gain fluctuations in the radiometer system. For instance, 0.1 K drift in 300 K calibration reference temperature would yield a ~249.92 K atmospheric brightness temperature measurement (Figure 3). However, if the true value of the atmospheric temperature is not known, which usually is the case for operational radiometers, this measurement can be accepted true with a 0.035% change in the radiometer gain. Thus, an additional external calibration reference target is necessary to track calibration drifts and errors as well as to assess temporal calibration stability.

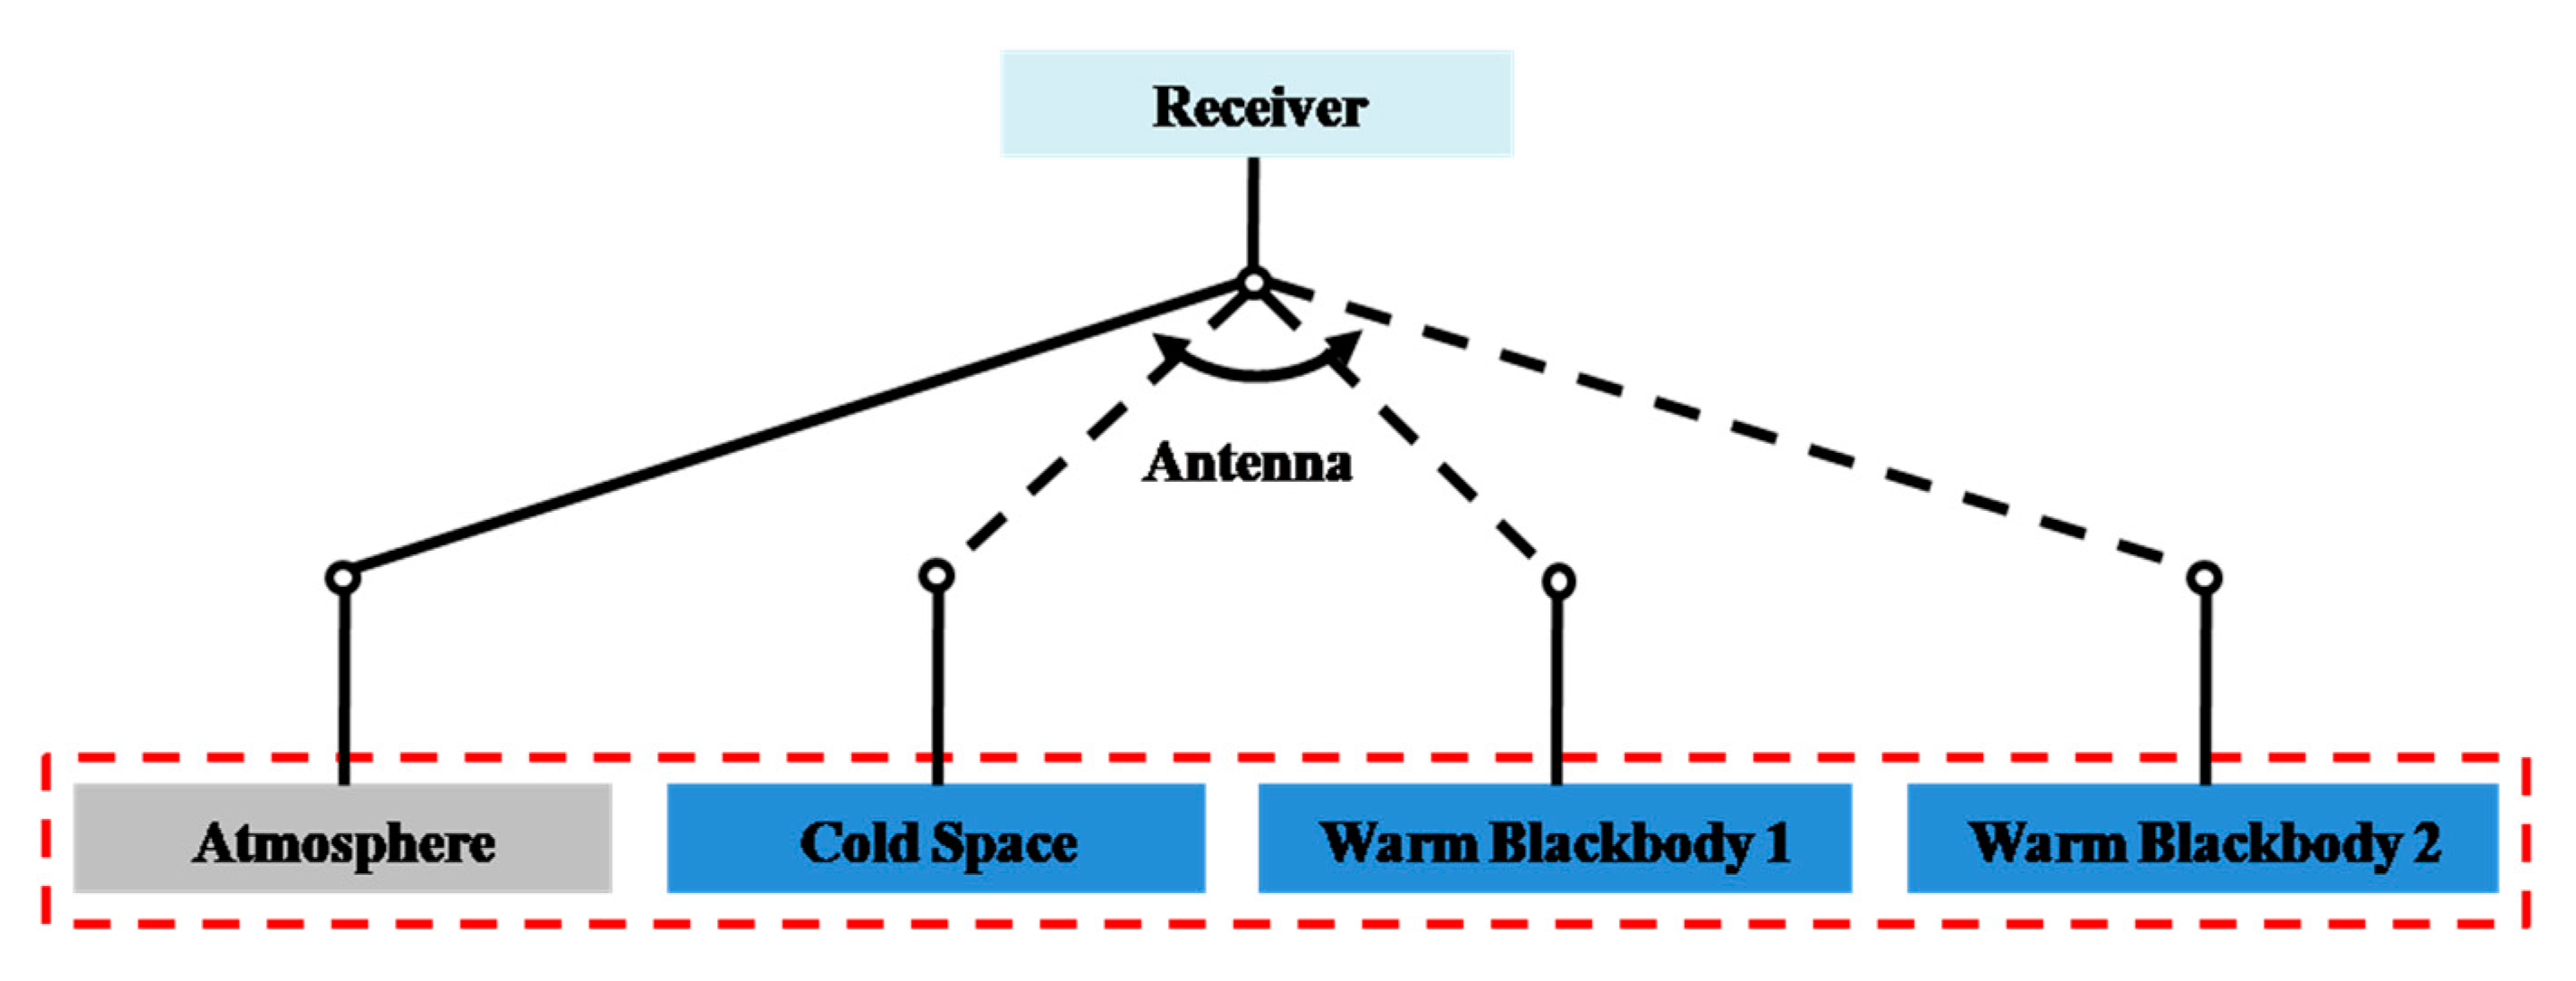
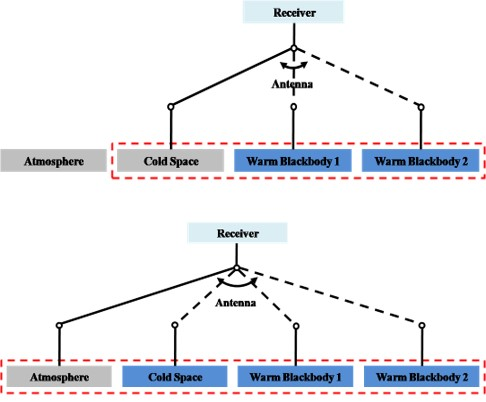
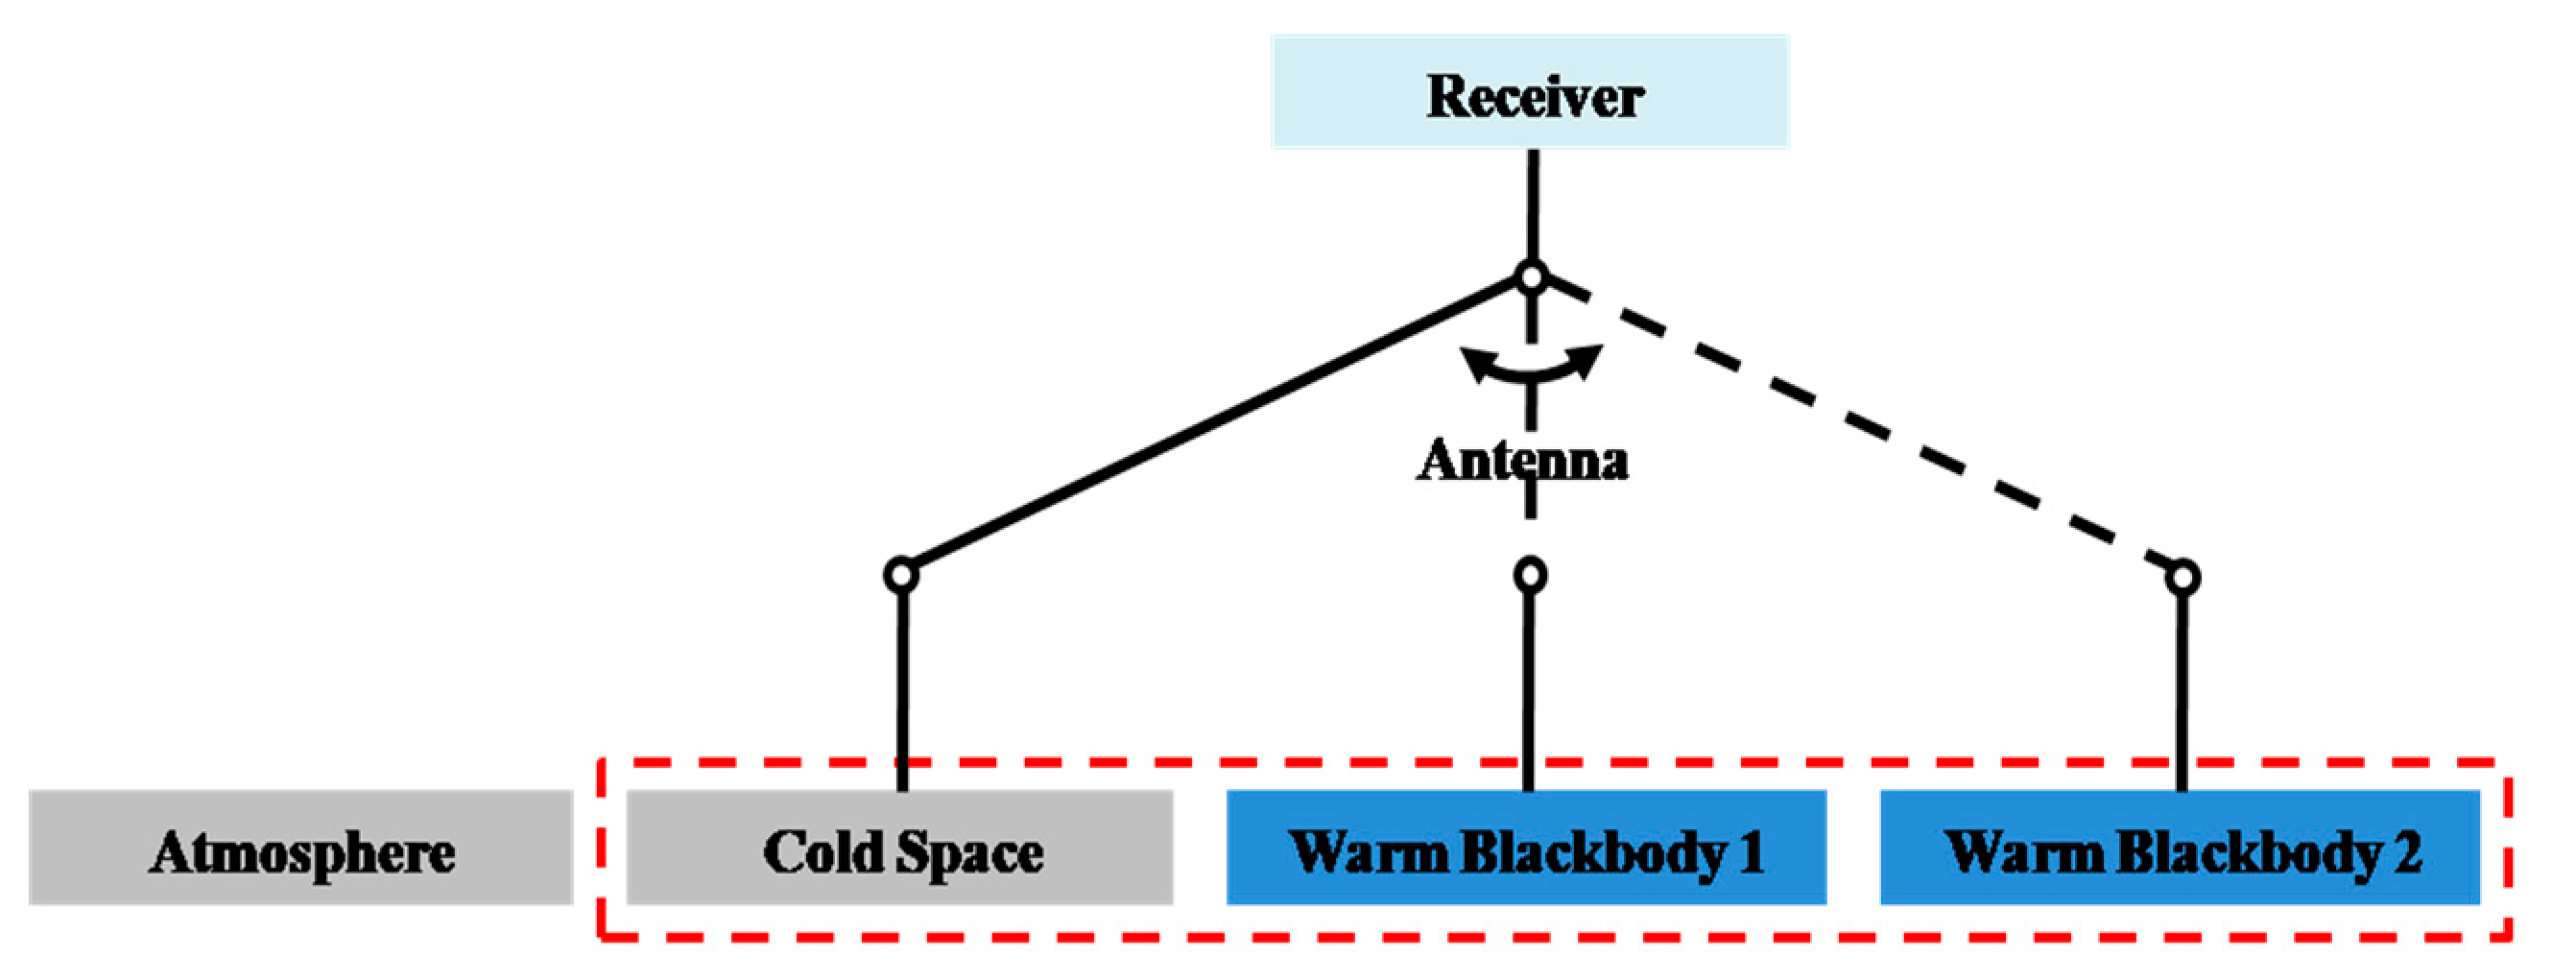
4. Three-Point Calibration

When a third external calibration reference target is added to the radiometer system, measurements of the calibration targets can be used as references to evaluate the accuracy of the radiometer calibration and track calibration stability while performing regular scientific observations [17,18]. One way to achieve this goal is to introduce two data processing paths in the radiometer system, i.e., the measurement processing and the calibration validation processing, as explained below.

4.1. Measurement Data Processing Path

The measurement data processing path is the regular data processing structure in radiometer systems wherein three calibration reference targets are used to calibrate the measurand, e.g., the atmospheric measurements as shown in Figure 6.
In this path, the errors in the calibrated atmospheric brightness temperatures because of drifts in the calibration reference target temperatures and their detectabilities can be calculated using Equations (1)–(6) provided that the atmospheric brightness temperature is known.
Consider the same radiometer system discussed in Section 3 observing a 250 K atmospheric scene with an additional external blackbody calibration reference target with 290 K temperature. In such a system, temperature drifts may occur in both blackbody targets, and errors in the calibrated atmospheric brightness temperatures because of temperature drifts up to 0.1 K are shown in Figure 7. Figure 8 illustrates the detectability values for these errors and indicates that they are hard to detect even if the true atmospheric brightness temperature is known since the absolute detectability levels are below 1. Thus, in the first place it may seem that adding the third calibration reference target is futile to track small calibration drifts and errors. However, the advantage of having an additional calibration reference target will be made obvious in the calibration validation data processing path.
On the other hand, one can calculate using Equation (5) that the additional calibration target reduces the uncertainty in the atmospheric temperature measurements to 0.088 K from 0.098 K.

4.2. Calibration Validation Data Processing Path
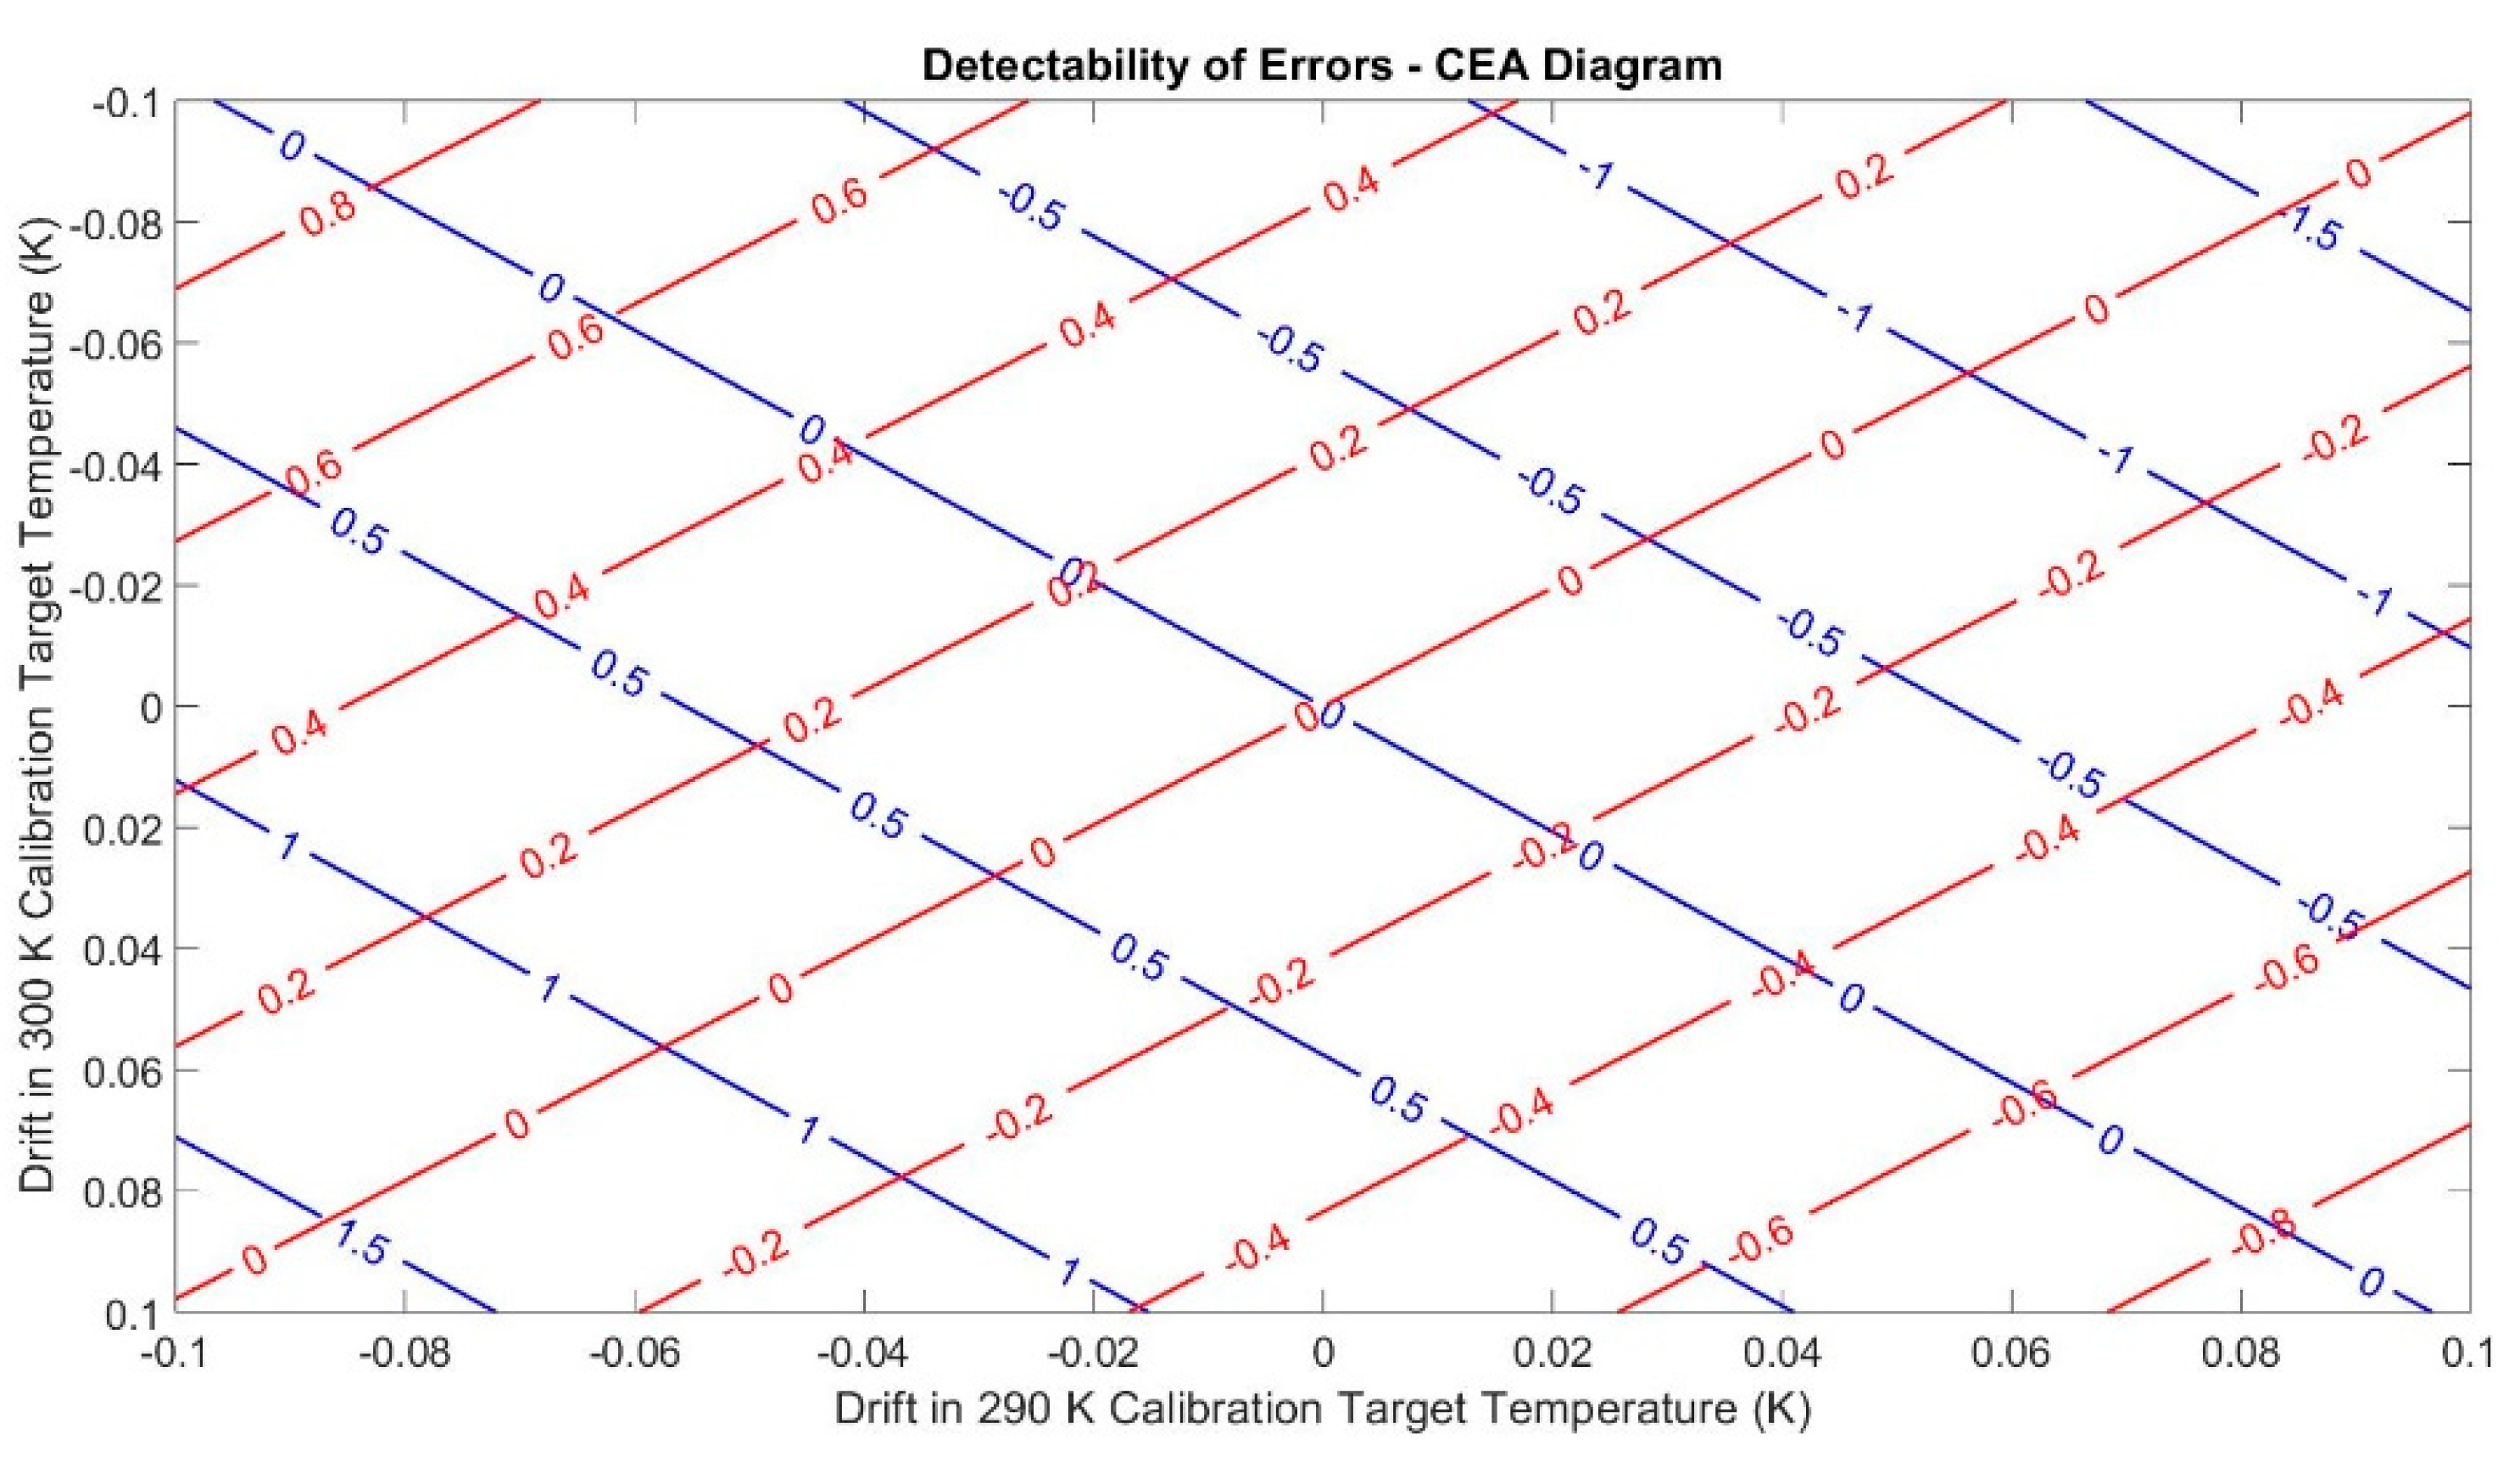
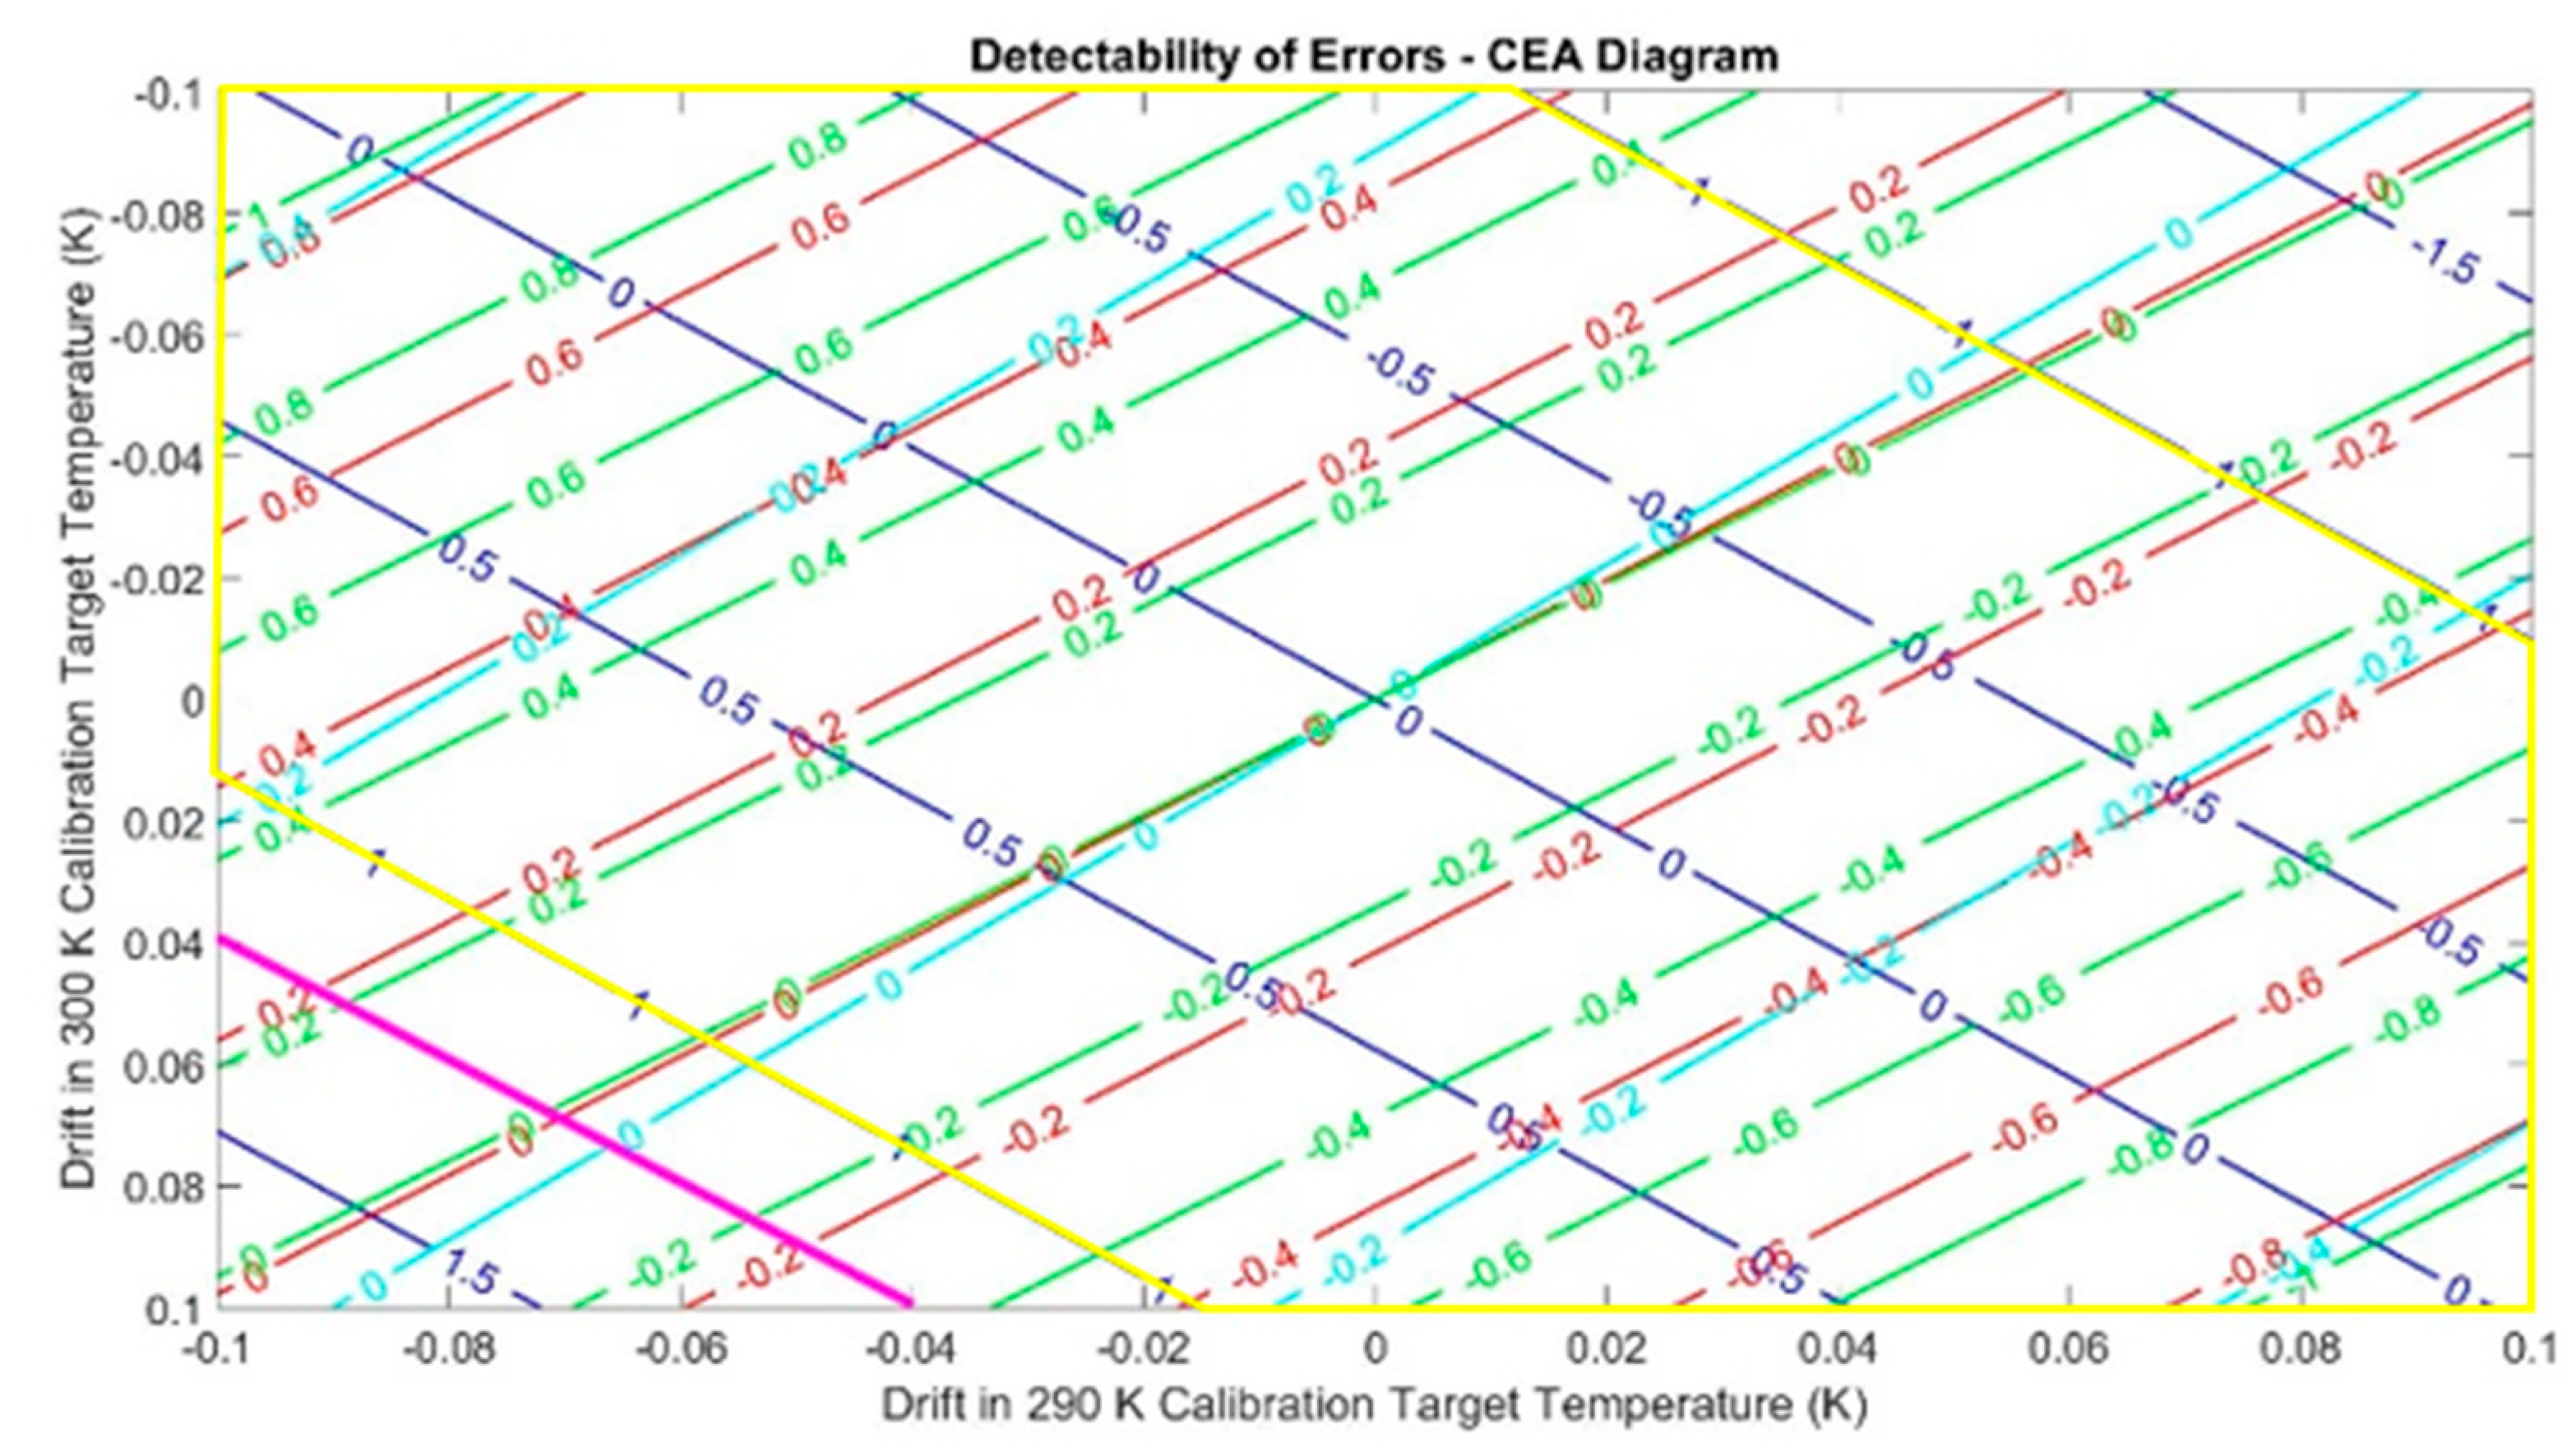
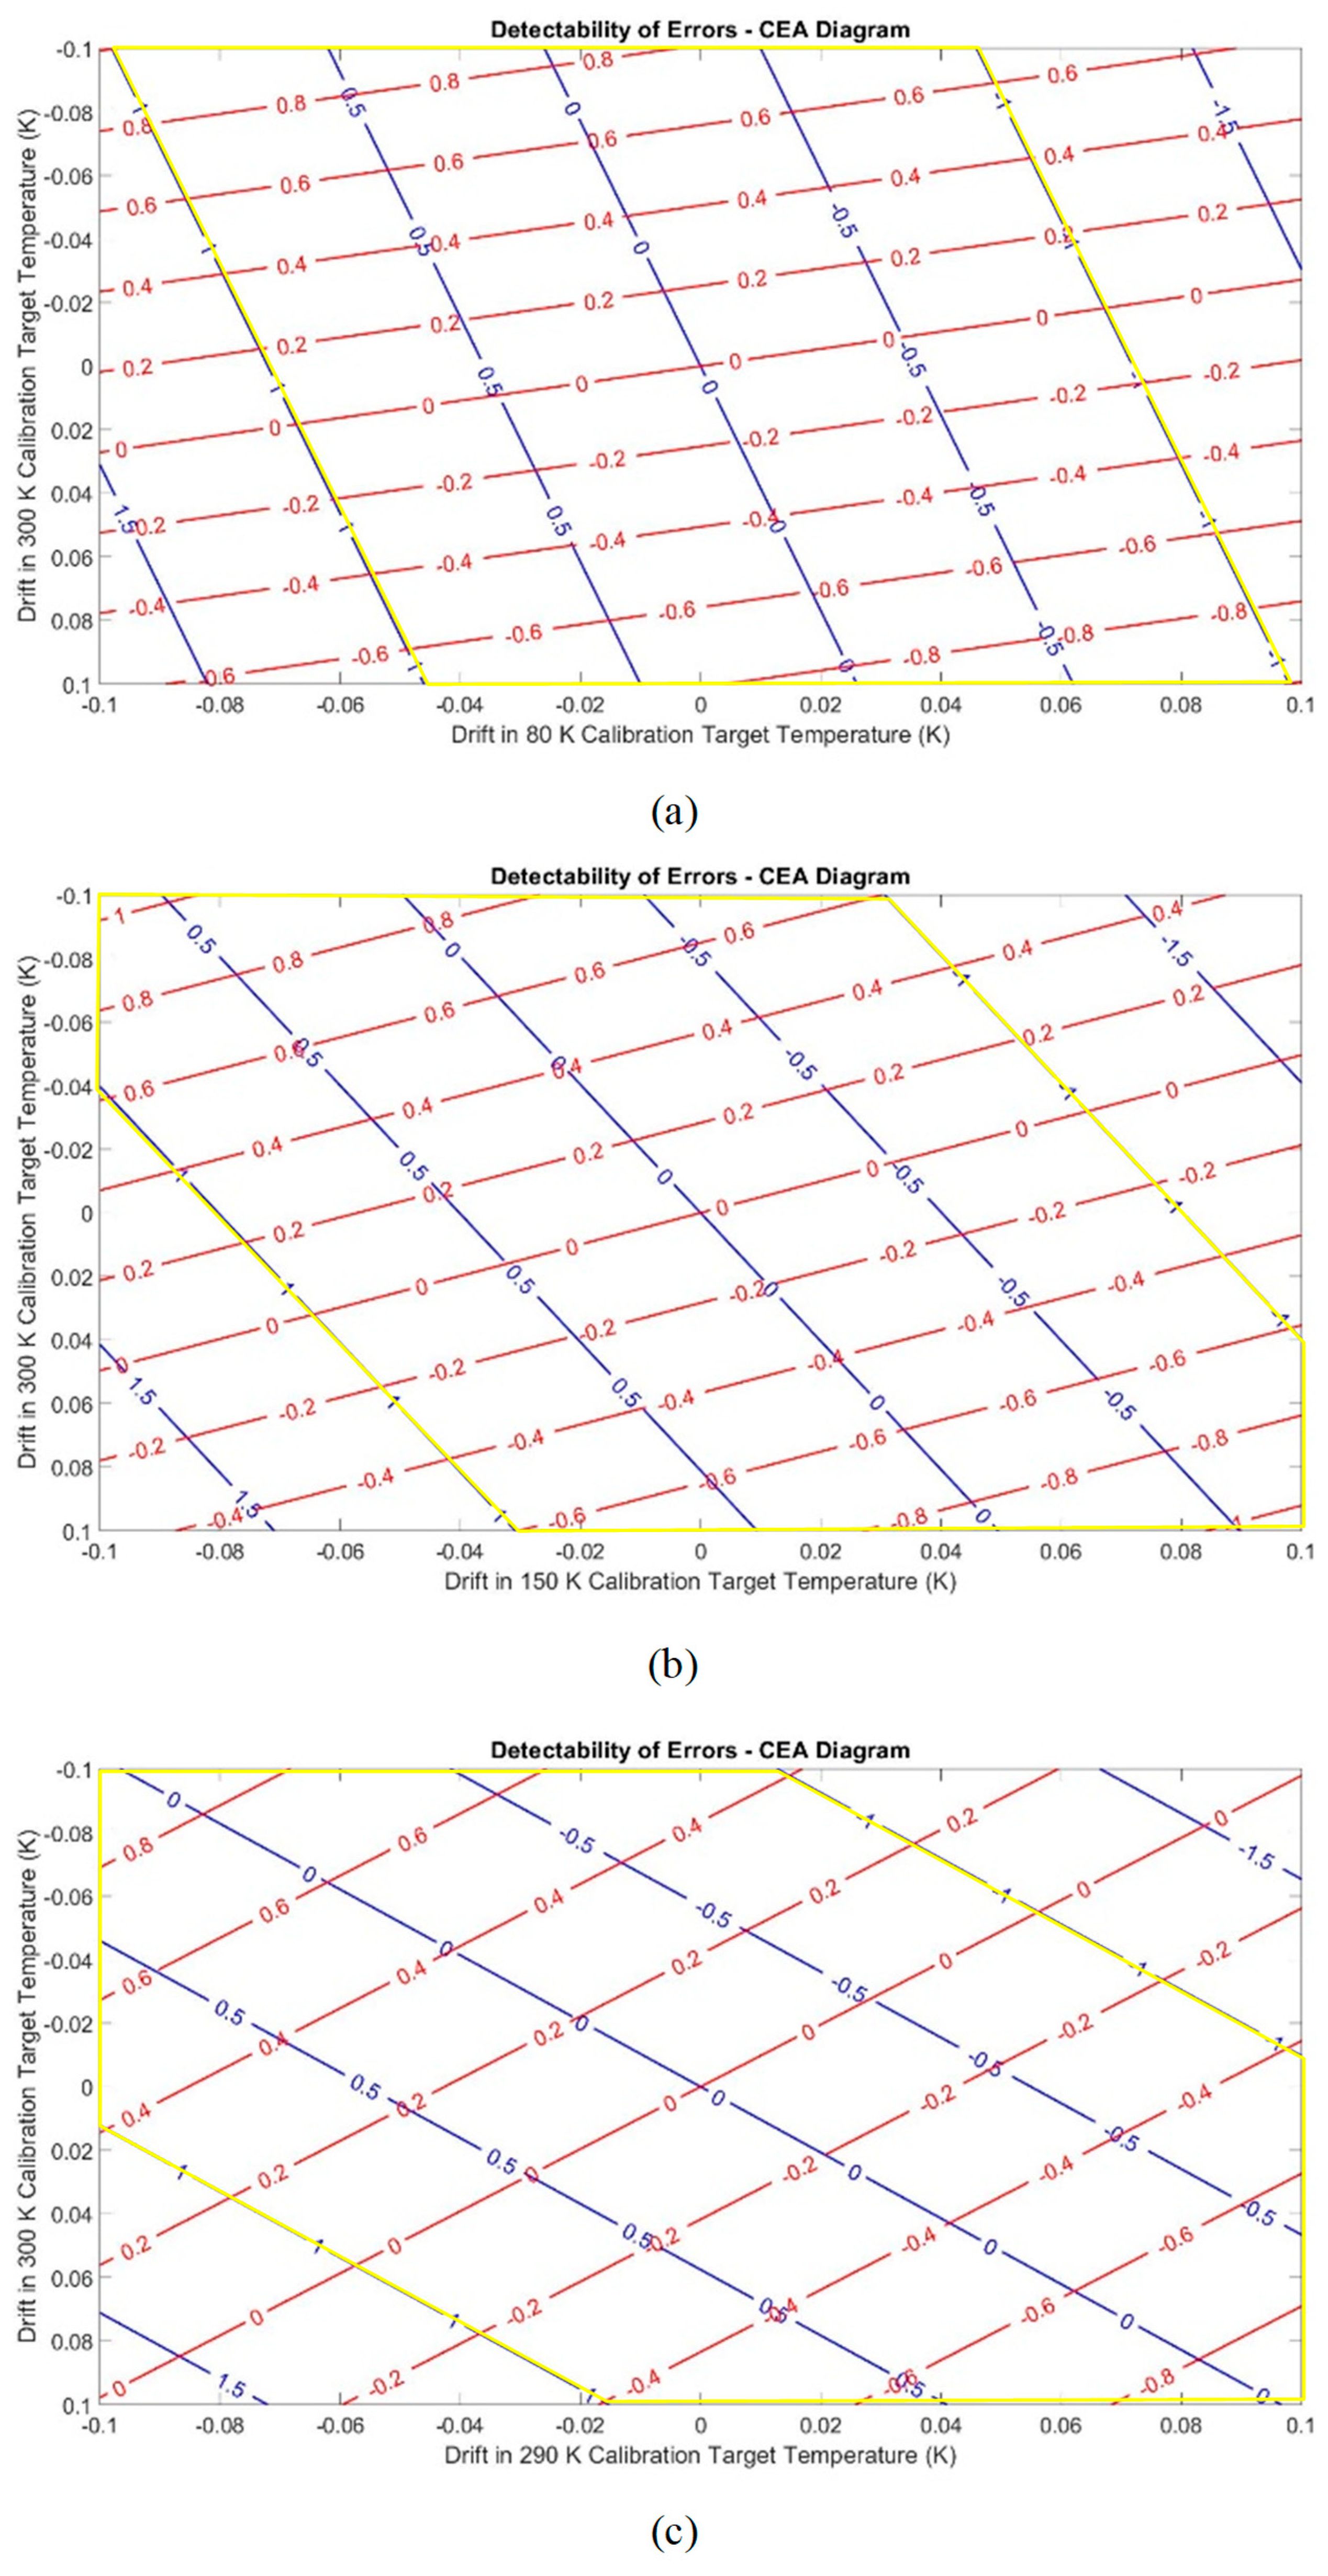
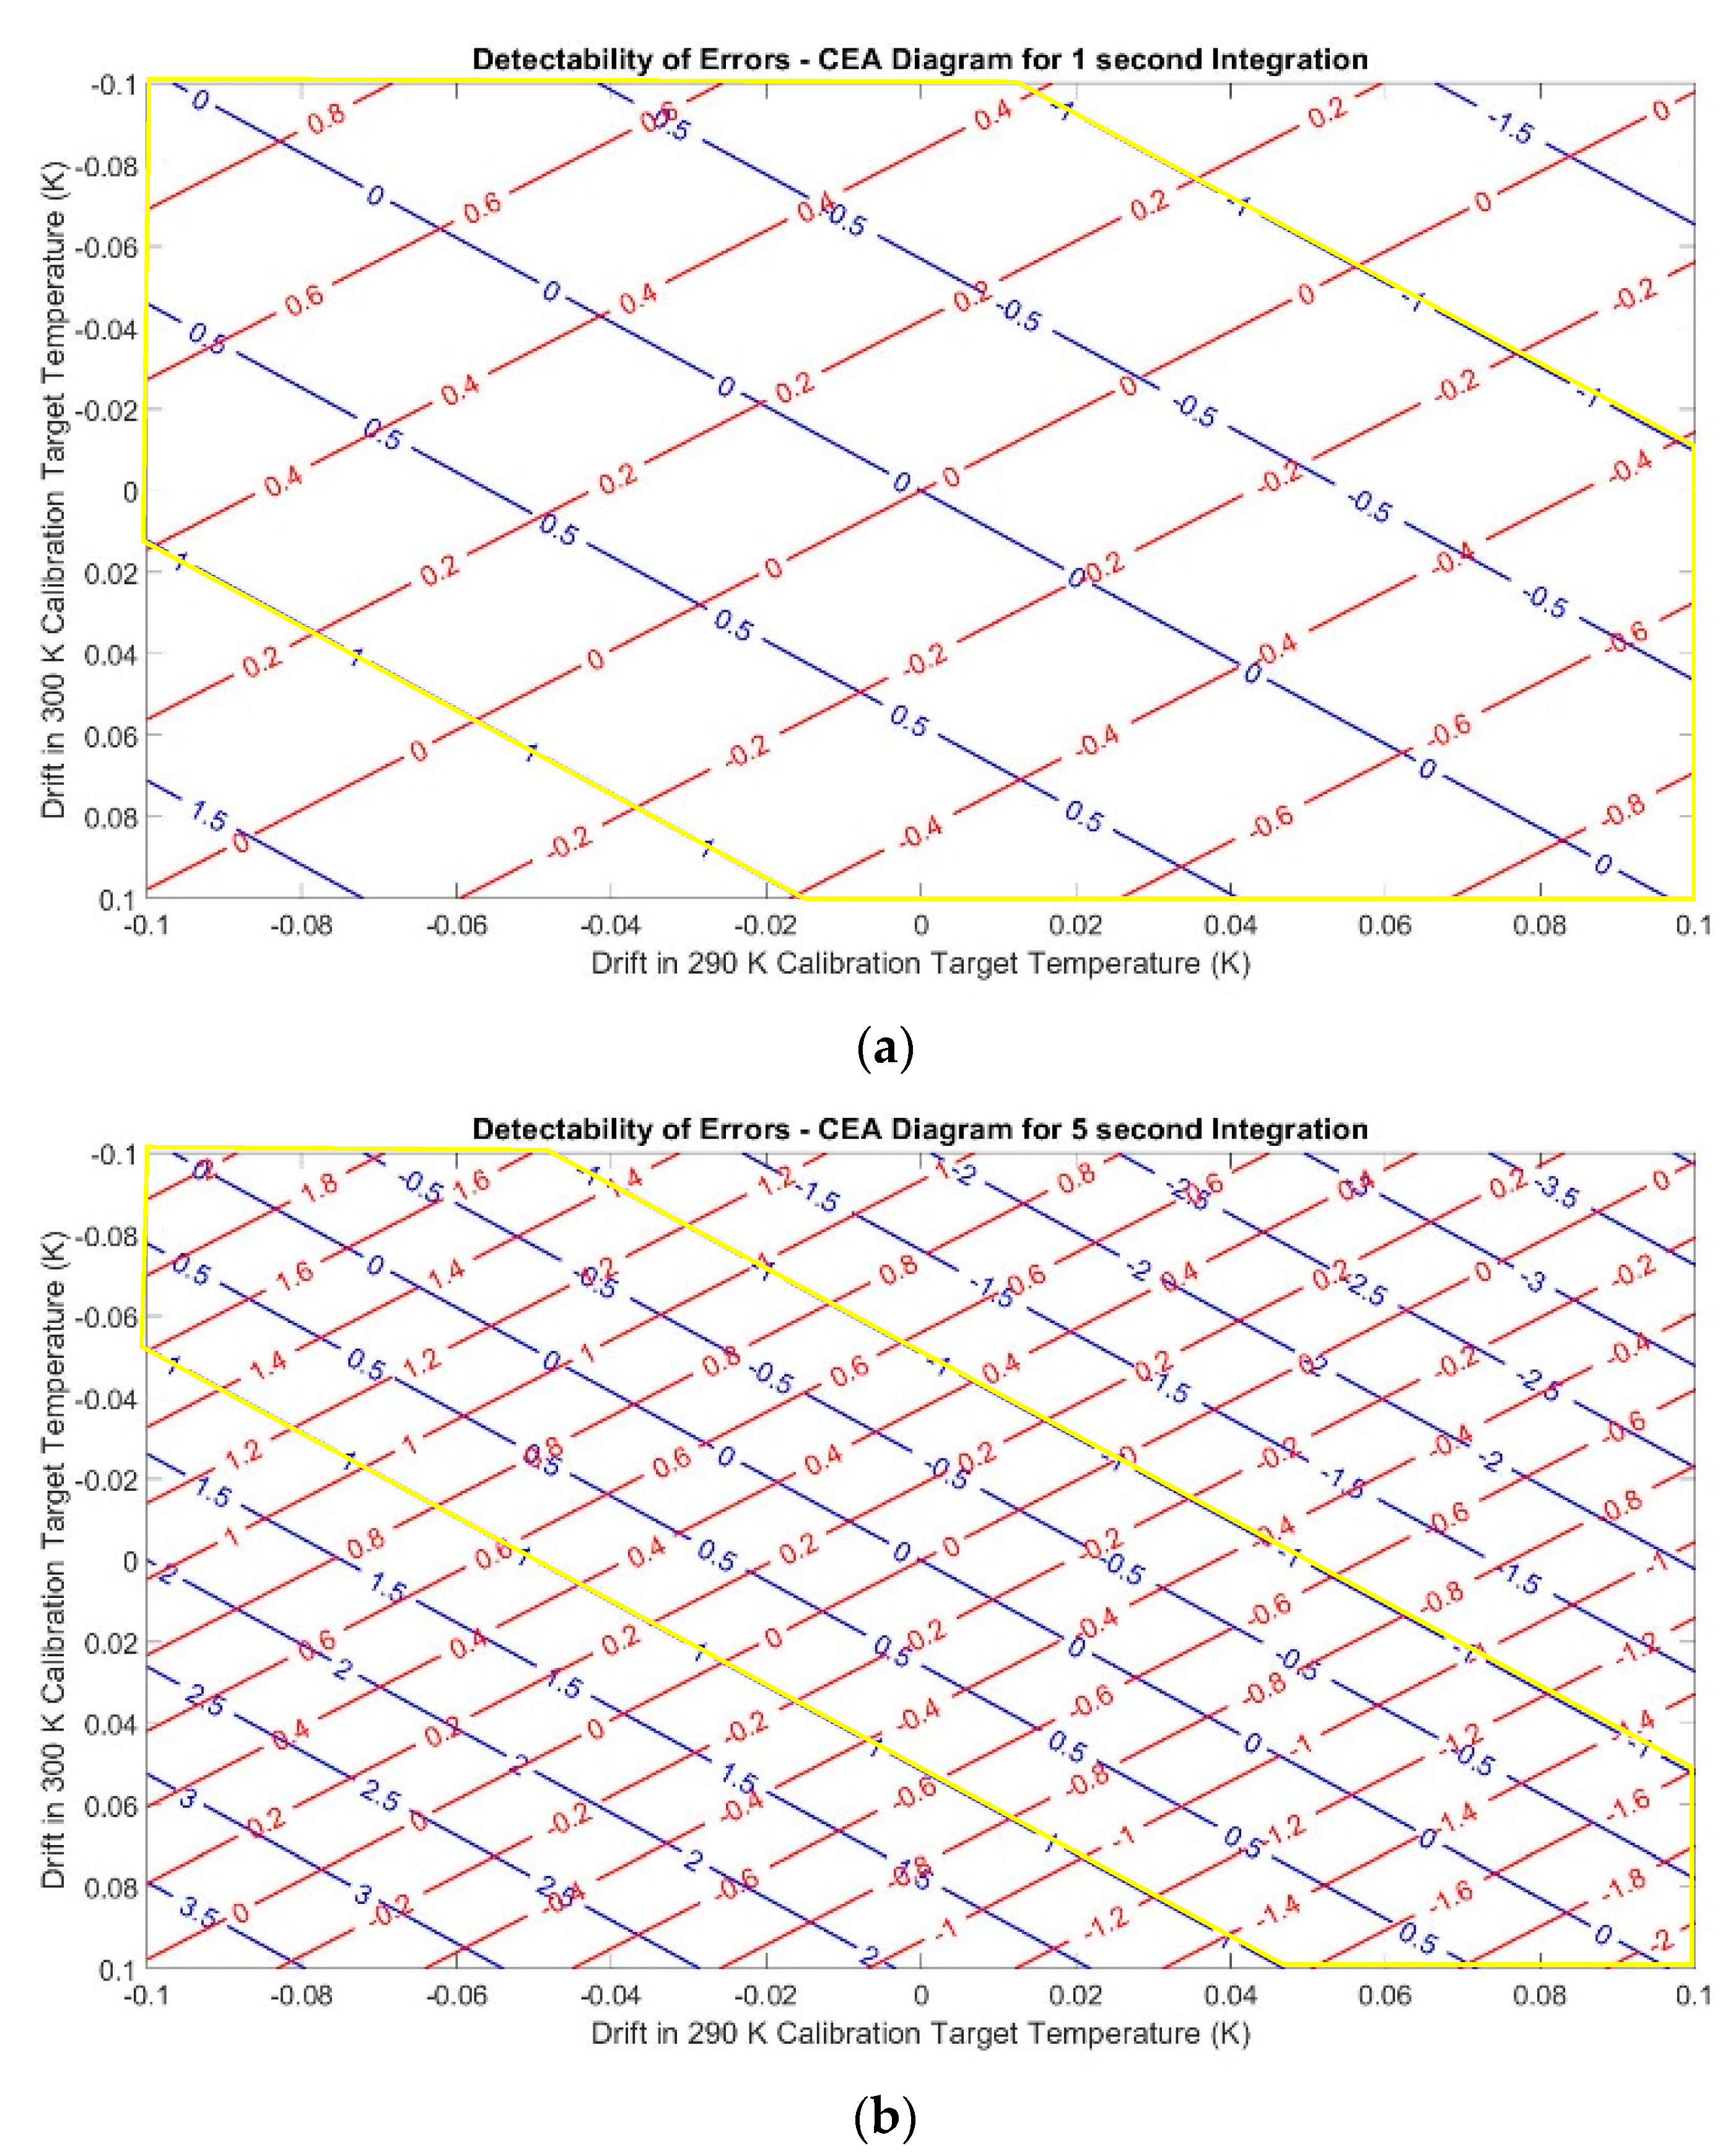
In the calibration validation data processing path, only measurements from two calibration targets are used to calibrate the third calibration target measurements. Since all calibration target temperatures are assumed to be known with certain uncertainties, measurement errors and uncertainties in this path can be associated with calibration stability, drifts, and errors. Figure 9 demonstrates the radiometer system, shown in Figure 6, in the calibration validation data processing path.
Figure 10 displays the measurement errors when two blackbody targets are used to calibrate the cold space measurements, as shown in Figure 9, to validate the accuracy of the radiometer calibration.
Figure 11, on the other hand, demonstrates the detectability of these errors. As seen from the figure, in this case, measurement errors in the cold space observations can be detectable when relatively larger drifts (in most cases when the sum of the magnitude of the temperature drifts exceeds 0.1 K) occur in calibration reference temperatures with opposite gradients. Moreover, in Figure 11, a detected measurement error corresponds to a line formed by points representing every possible temperature drifts in the two calibration targets which would result in that error. Thus, this information can be used to identify errors and possible drifts in each calibration reference.
In addition, calibration validation data processing path permits characterizing the temporal stability of the radiometer calibration through a time adaptive approach. For instance, the uncertainty σ T m ^ in Equation (3) can be calculated for cold space measurements, i.e., the measurand, by varying the interval between the measurand and calibration observation times, t m and t a . Stable radiometer calibration, i.e., stationary radiometer gain, would yield constant σ T m ^ ( t m , t a ) irrespective of t m and t a , whereas varying uncertainty implies non-stationary radiometer gain and offset, thus unstable calibration [19].
Note that the cold space has been chosen here as the target in calibration validation data processing path since it is, as a well characterized calibration reference, considered to be relatively immune to calibration drifts. Otherwise, for instance in the absence of cold space measurements in the calibration procedure, any stable calibration reference can be picked to investigate the possible drifts in the other two calibration targets.

5. Analysis

To understand the effects of calibration drifts and errors in the measurand observations, measurement and calibration validation data processing paths of the radiometer system should be analyzed together. One way to achieve this is to combine the detectability of error information presented in Figure 8 and Figure 11 into one “calibration error analysis” (CEA) diagram as illustrated in Figure 12.
CEA diagrams reveal the impact of the calibration drifts and errors detected in the calibration validation data processing path on the calibrated measurand brightness temperatures in the measurement data processing path. For instance, consider the radiometer system described in Section 4 wherein a 4 K error was detected in the calibration validation data processing path. Figure 13a depicts the line formed by possible calibration drift values for the two blackbody reference temperatures which would lead to this error, and Figure 13b shows the detectability of the error which is larger than 1. Finally, Figure 13c presents the CEA diagram for this error, which reveals that the error in the calibrated atmospheric brightness temperatures, shown by red lines in the diagram, will be smaller than 0.4 times the measurement uncertainty. As a result, using the CEA diagram the error in the calibrated measurand observations because of calibration drifts can be quantified with specific bounds. Note that even no detected error during the calibration validation processing path (i.e., absolute detectabilities are less than 1) would correspond to a region in the CEA diagram which bounds the possible errors in the atmospheric temperatures. For instance, no error detection during the calibration validation processing, which corresponds to the region inside the yellow hexagon in Figure 13c, implies errors in atmospheric brightness temperatures less than ~0.9 times the standard deviation of the measurements.
In an ideal radiometer system, calibration errors should be easily detectable in the calibration validation data processing path, whereas the impact of such calibration errors is preferred to be minimal on the radiometric measurements in the measurement data processing path. Thus, blue contours in the CEA diagrams, like shown in Figure 12, corresponding to the calibration validation data processing path should depict the maximum gradient possible with drifts in calibration targets, while the changes indicated by the red contours associated with the measurement data processing path should be small. This is not a trivial task since CEA diagrams depend on many factors such as the measurand and calibration reference temperatures as well as integration time as discussed in the following sections.
One should also note that, analyses of CEA diagrams in Section 3, Section 4 and Section 5 are done assuming that thermistor sensitivity is larger than 0.1 K and errors in calibration temperature measurements because of inadequate, deficient, or suboptimal thermistor deployment are less than 0.1 K, thus absolute possible drifts in calibration target temperatures are limited to 0.1 K. However, these bounds can be adjusted according to the radiometer system to be analyzed. For instance, in Section 6, because of prior knowledge on MIR calibration experiment, this limit is set to be 1 K. Moreover, it is presumed that cold space brightness temperature is not variable, thus it does not lead to any calibration errors.

5.1. Effect of the Measurand Temperature

Note that so far the brightness temperature of the measurand, e.g., the atmospheric brightness temperature, is assumed to be known. In reality, however, this value is unknown, thus the analyses should take the uncertainty in the measurand brightness temperature into consideration.
The effect of the measurand temperature can be seen only in the measurement data processing path, since only calibration reference targets are considered during the calibration validation data processing path. Thus, for instance, the blue lines corresponding to the calibration validation data processing path in the CEA diagram shown in Figure 12 are independent of the atmospheric brightness temperature. Figure 14 demonstrates how the rest of the CEA diagram changes when the atmospheric brightness temperature changes between 100 K and 400 K.
As seen from the figure, for the radiometer system described in Section 4, the effect of the calibration drift errors on the atmospheric temperature measurements increases with the atmospheric temperature. For example, the impact of the calibration temperature drifts shown with the magenta line (4 K error in the calibration validation data processing path as discussed previously) on 100 K atmospheric brightness temperature measurements is less than 0.2 times the standard deviation of those measurements, whereas this value is close to 0.3 times the measurement uncertainty for 400 K atmospheric brightness temperature measurements. Similarly, undetected calibration temperature drifts in the calibration validation data processing path, shown by the region covered by the yellow lines in the figure, may lead to more significant errors in the atmospheric brightness temperature measurements.

5.2. Choice of Calibration Temperatures

The temperature of the blackbody reference targets is also an important factor in determining calibration drifts as well as their effects on the calibrated measurand observations. In this paper, only one calibration reference temperature is allowed to vary for simplicity.
Any change in the blackbody calibration reference temperatures will have an influence in both calibration validation and measurement data processing paths. Figure 15 demonstrates these effects by showing the CEA diagrams in three different cases for 250 K atmospheric brightness temperature measurements with the radiometer system described in Section 4. The temperature of one blackbody calibration target is kept constant at 300 K, and the temperature of the other one is 80 K in Figure 15a, 150 K in Figure 15b, and 290 K in Figure 15c.
It can be observed from Figure 15 that as the temperature of the second blackbody target increases from 80 K to 290 K, the calibrated cold space brightness temperatures become less sensitive to the temperature drifts in that calibration target in the calibration validation data processing path (detectability of error values starts changing slower in the horizontal direction). The sensitivity to the fixed temperature calibration target, on the other hand, increases (detectability of error values starts changing faster in the vertical direction). In the measurement data processing path, an opposite effect can be seen. Increasing temperature of the second blackbody target increases the error gradient in the atmospheric brightness temperature measurements with respect to any drifts in that calibration target temperature. However, the impact of the drifts in the fixed temperature blackbody target on the errors in the calibrated atmospheric brightness temperatures declines. The maximum error in the atmospheric brightness temperature measurements due to calibration drifts undetected in the calibration validation data processing path follows this trend as well.
The optimum temperature choice for the third calibration target, therefore, should be made based on the susceptibility of the other two calibration references to temperature drifts. If a specific calibration reference is believed to be more vulnerable to temperature drifts, the temperature of the additional calibration target should be selected as close as possible to the temperature of that reference. This would ensure that even small changes in the temperature of the vulnerable target can be detected by calibrating the third calibration reference observations (assumed to be stable) in the calibration validation data processing path. Furthermore, the impact of such changes in the measurand observations would be minimal. If the two calibration targets are equally susceptible to temperature drifts or there is no information regarding the susceptibility to temperature drifts, the optimum temperature for the additional calibration reference would be the middle point between hot and cold calibration target temperatures. Such a selection would minimize the measurement uncertainty, described by Equation (3), thus maximize error detectability in the calibration validation data processing path. Moreover, in both data processing paths, as seen from Equation (1), the impact of temperature drifts would be similar for the two calibration references.

5.3. Effect of the Integration Time

Integration time of the radiometer determines the standard deviation, i.e., uncertainty, of the measurand and calibration observations as defined in Equations (3)–(5). Longer integration times lead to smaller uncertainties which in turn result in higher detectability rates according to Equation (6) since the absolute calibration error does not depend on integration time. For instance, Figure 16a,b demonstrate CEA diagrams for the radiometer system described in Section 4 for 1 s and 5 s integration times, respectively. In the 5 s integration time case, much smaller drifts in the calibration temperatures can be detected during the calibration validation data processing path, but, on the other hand, the impact of the calibration drifts are higher in the measurement data processing path. Thus, calibration temperature drifts not detected in the calibration validation data processing path may lead to more significant errors in the atmospheric brightness temperature measurements.
On the other hand, it is important to note that the integration times in radiometer systems are also bounded by the time and spatial resolution requirements. Longer integration times may reduce the measurement uncertainty but lead to low temporal and spatial resolutions. Especially for space-borne and air-borne radiometry, integration times have to be kept limited to obtain acceptable spatial resolutions because of the high velocity of the systems.

6. Sample Study

This section demonstrates characterization of radiometer calibration drifts and stability through three-point absolute calibration as discussed in the previous sections using real radiometer measurements performed in 2002 by the millimeter-wave imaging radiometer (MIR), a nine-channel cross-track scanning radiometer with frequencies at 89, 150, 183.31 ± 1, 183.31 ± 3, 183.31 ± 7, 220, and 340 GHz [20].

6.1. MIR Calibration Experiment

During the MIR calibration experiment in 2002 (CalEx02), three external absolute calibration targets with temperatures 325.59 K, 293.69 K, and 79.02 K were measured for ~6 h. The receiver temperature and measurement bandwidth were 1800 K and 1 GHz, respectively at 89 GHz, i.e., the frequency channel considered in this paper, and the integration time was 0.2 s. More details about the experiment can be found in [21]. CalEx02 data have been processed to analyze temporal calibration stability and calibration drifts in the calibration validation data processing path as described in Section 4.2.

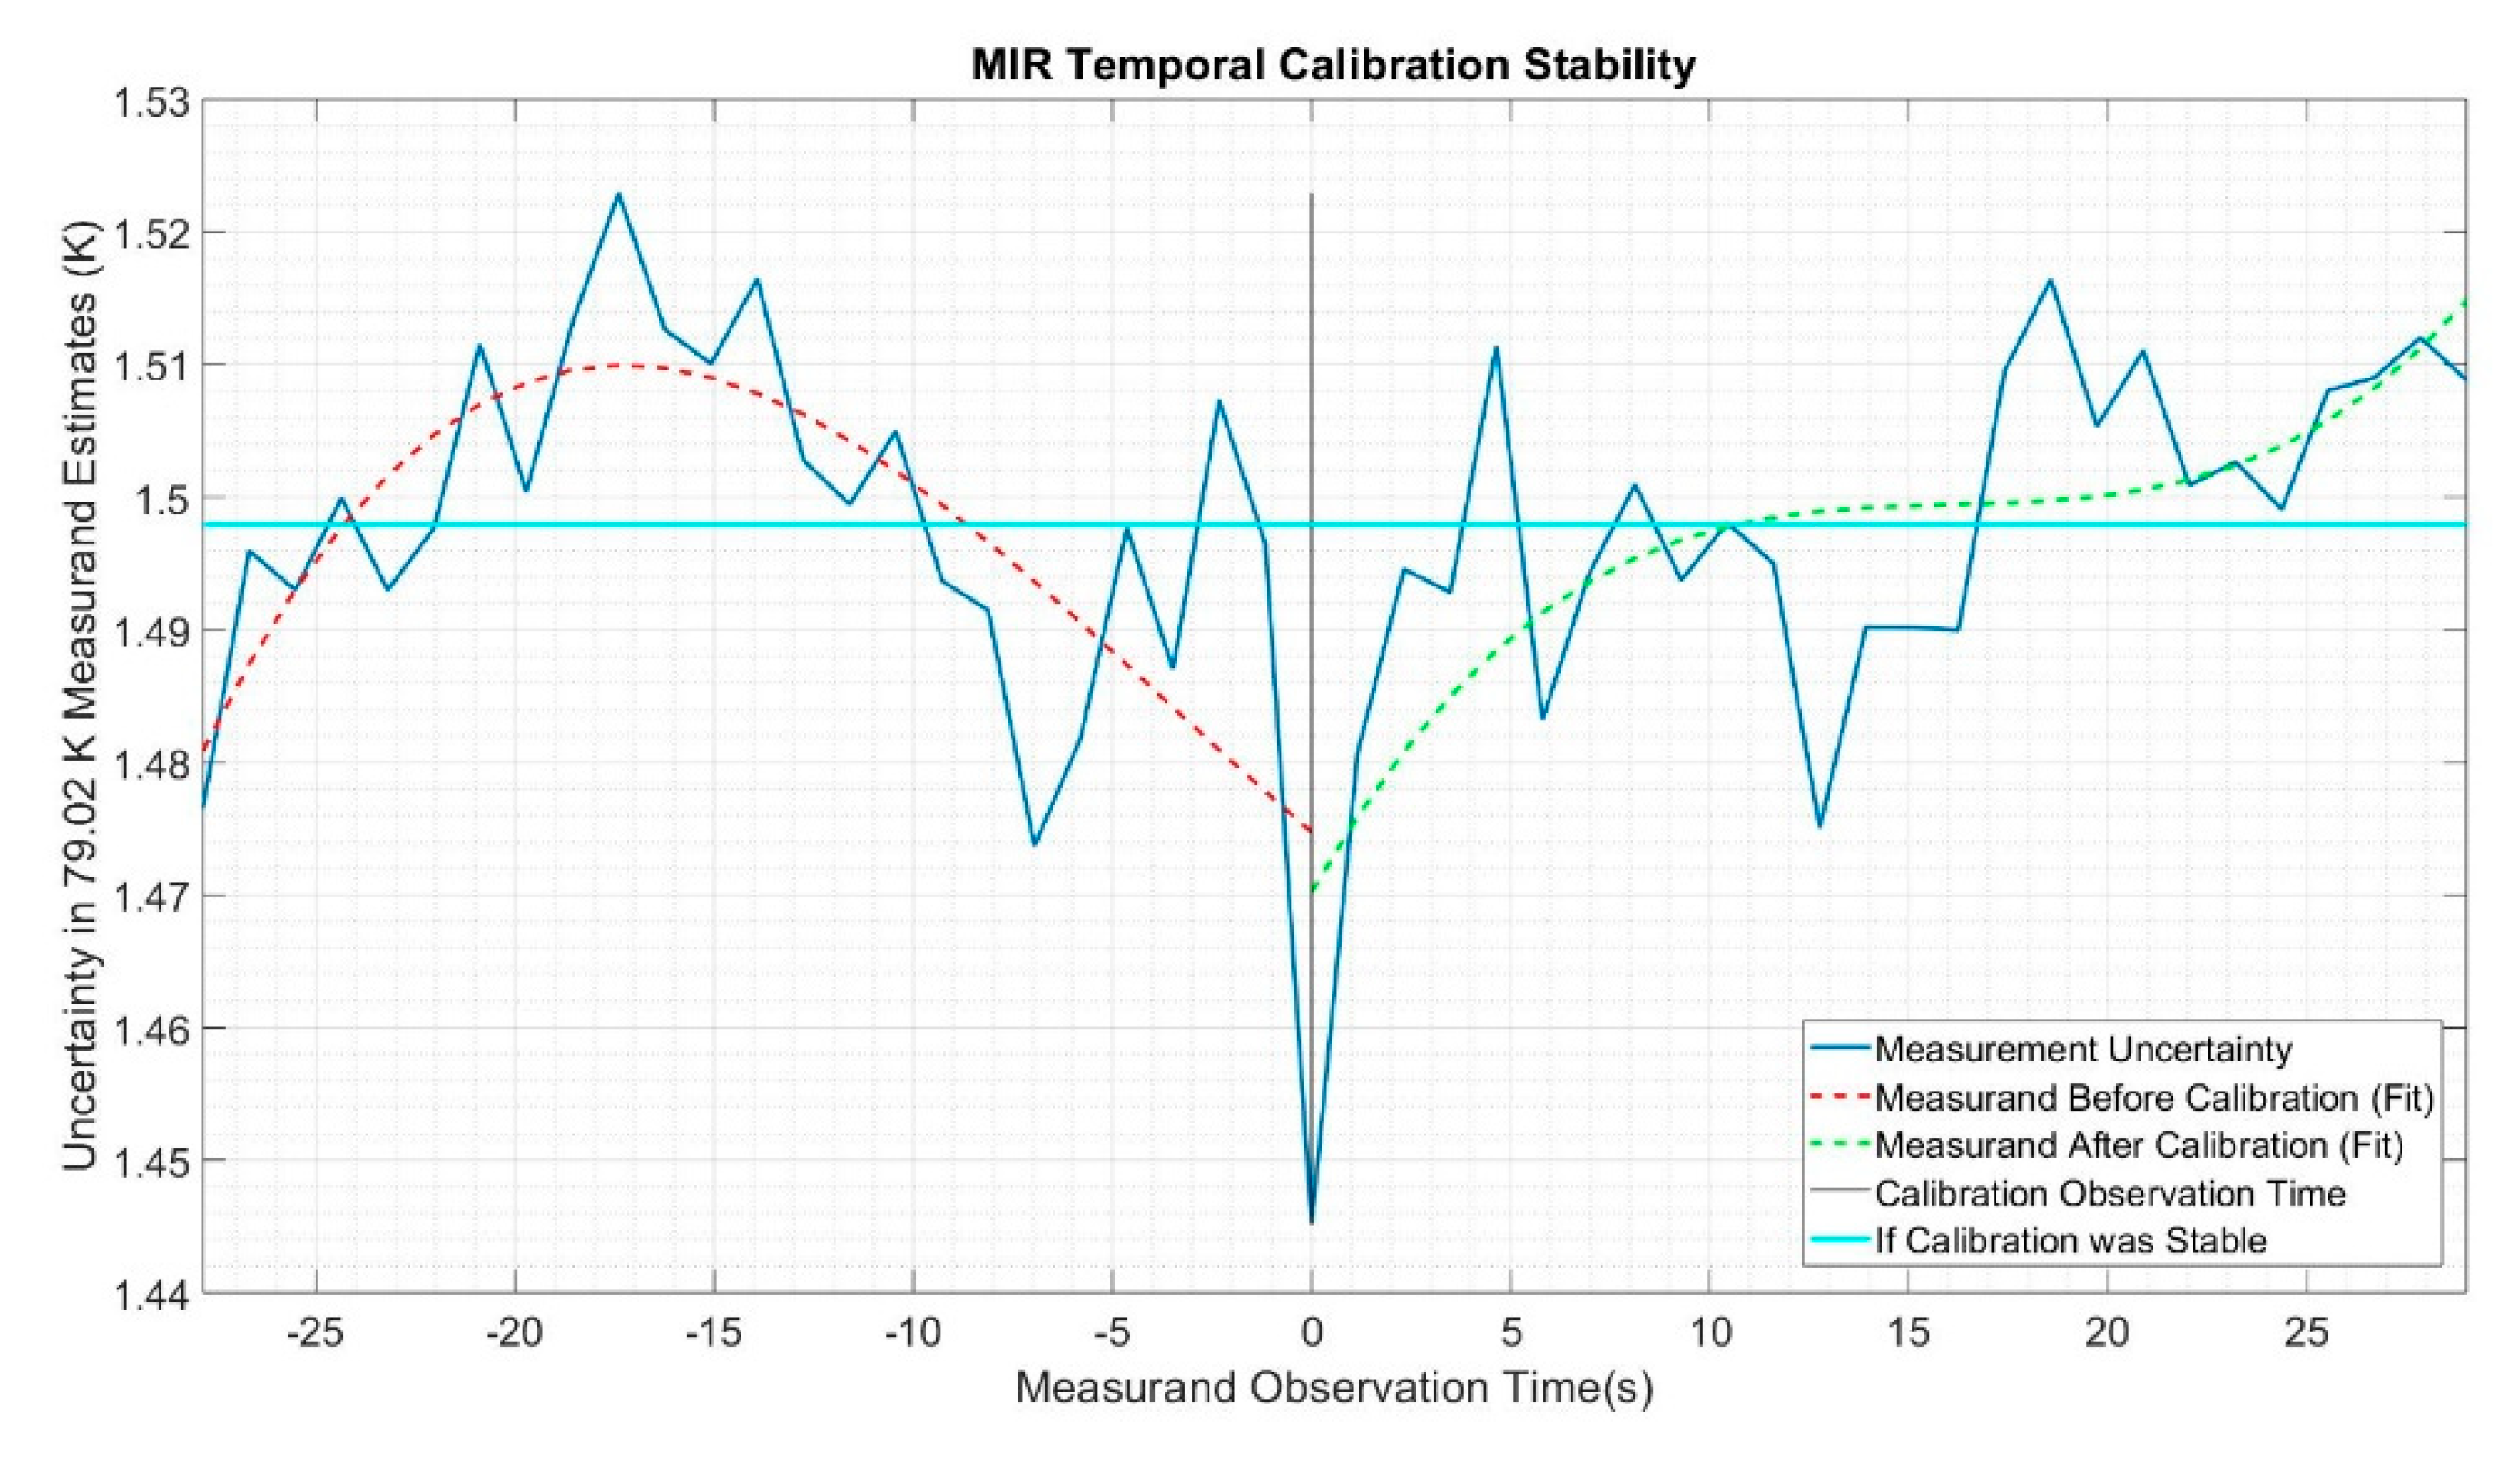
6.2. Temporal Stability of MIR

79.02 K target was considered to be the measurand, and 325.59 K and 293.69 K calibration targets were used to calibrate it using Equation (1) in the calibration validation data processing path. As described in Section 4.2, the time interval between calibration and measurand observations were changed to evaluate the temporal calibration stability. Figure 17 demonstrates the uncertainty in the estimated measurand brightness temperature versus measurand observation time with respect to the calibration observation times. Note that in the figure, calibration observation times are fixed at t a = 0 s whereas the measurand observation time varies.
The figure indicates that the measurement uncertainty depends on the time difference between measurand and calibration observations, which implies non-stationary radiometer gain and offset. Furthermore, the plot is not symmetric around the calibration observation time, t a = 0 s, meaning that using calibration measurements before or after the measurand observation matters. Thus, one can conclude that MIR calibration during the CalEx02 experiment was not stable.

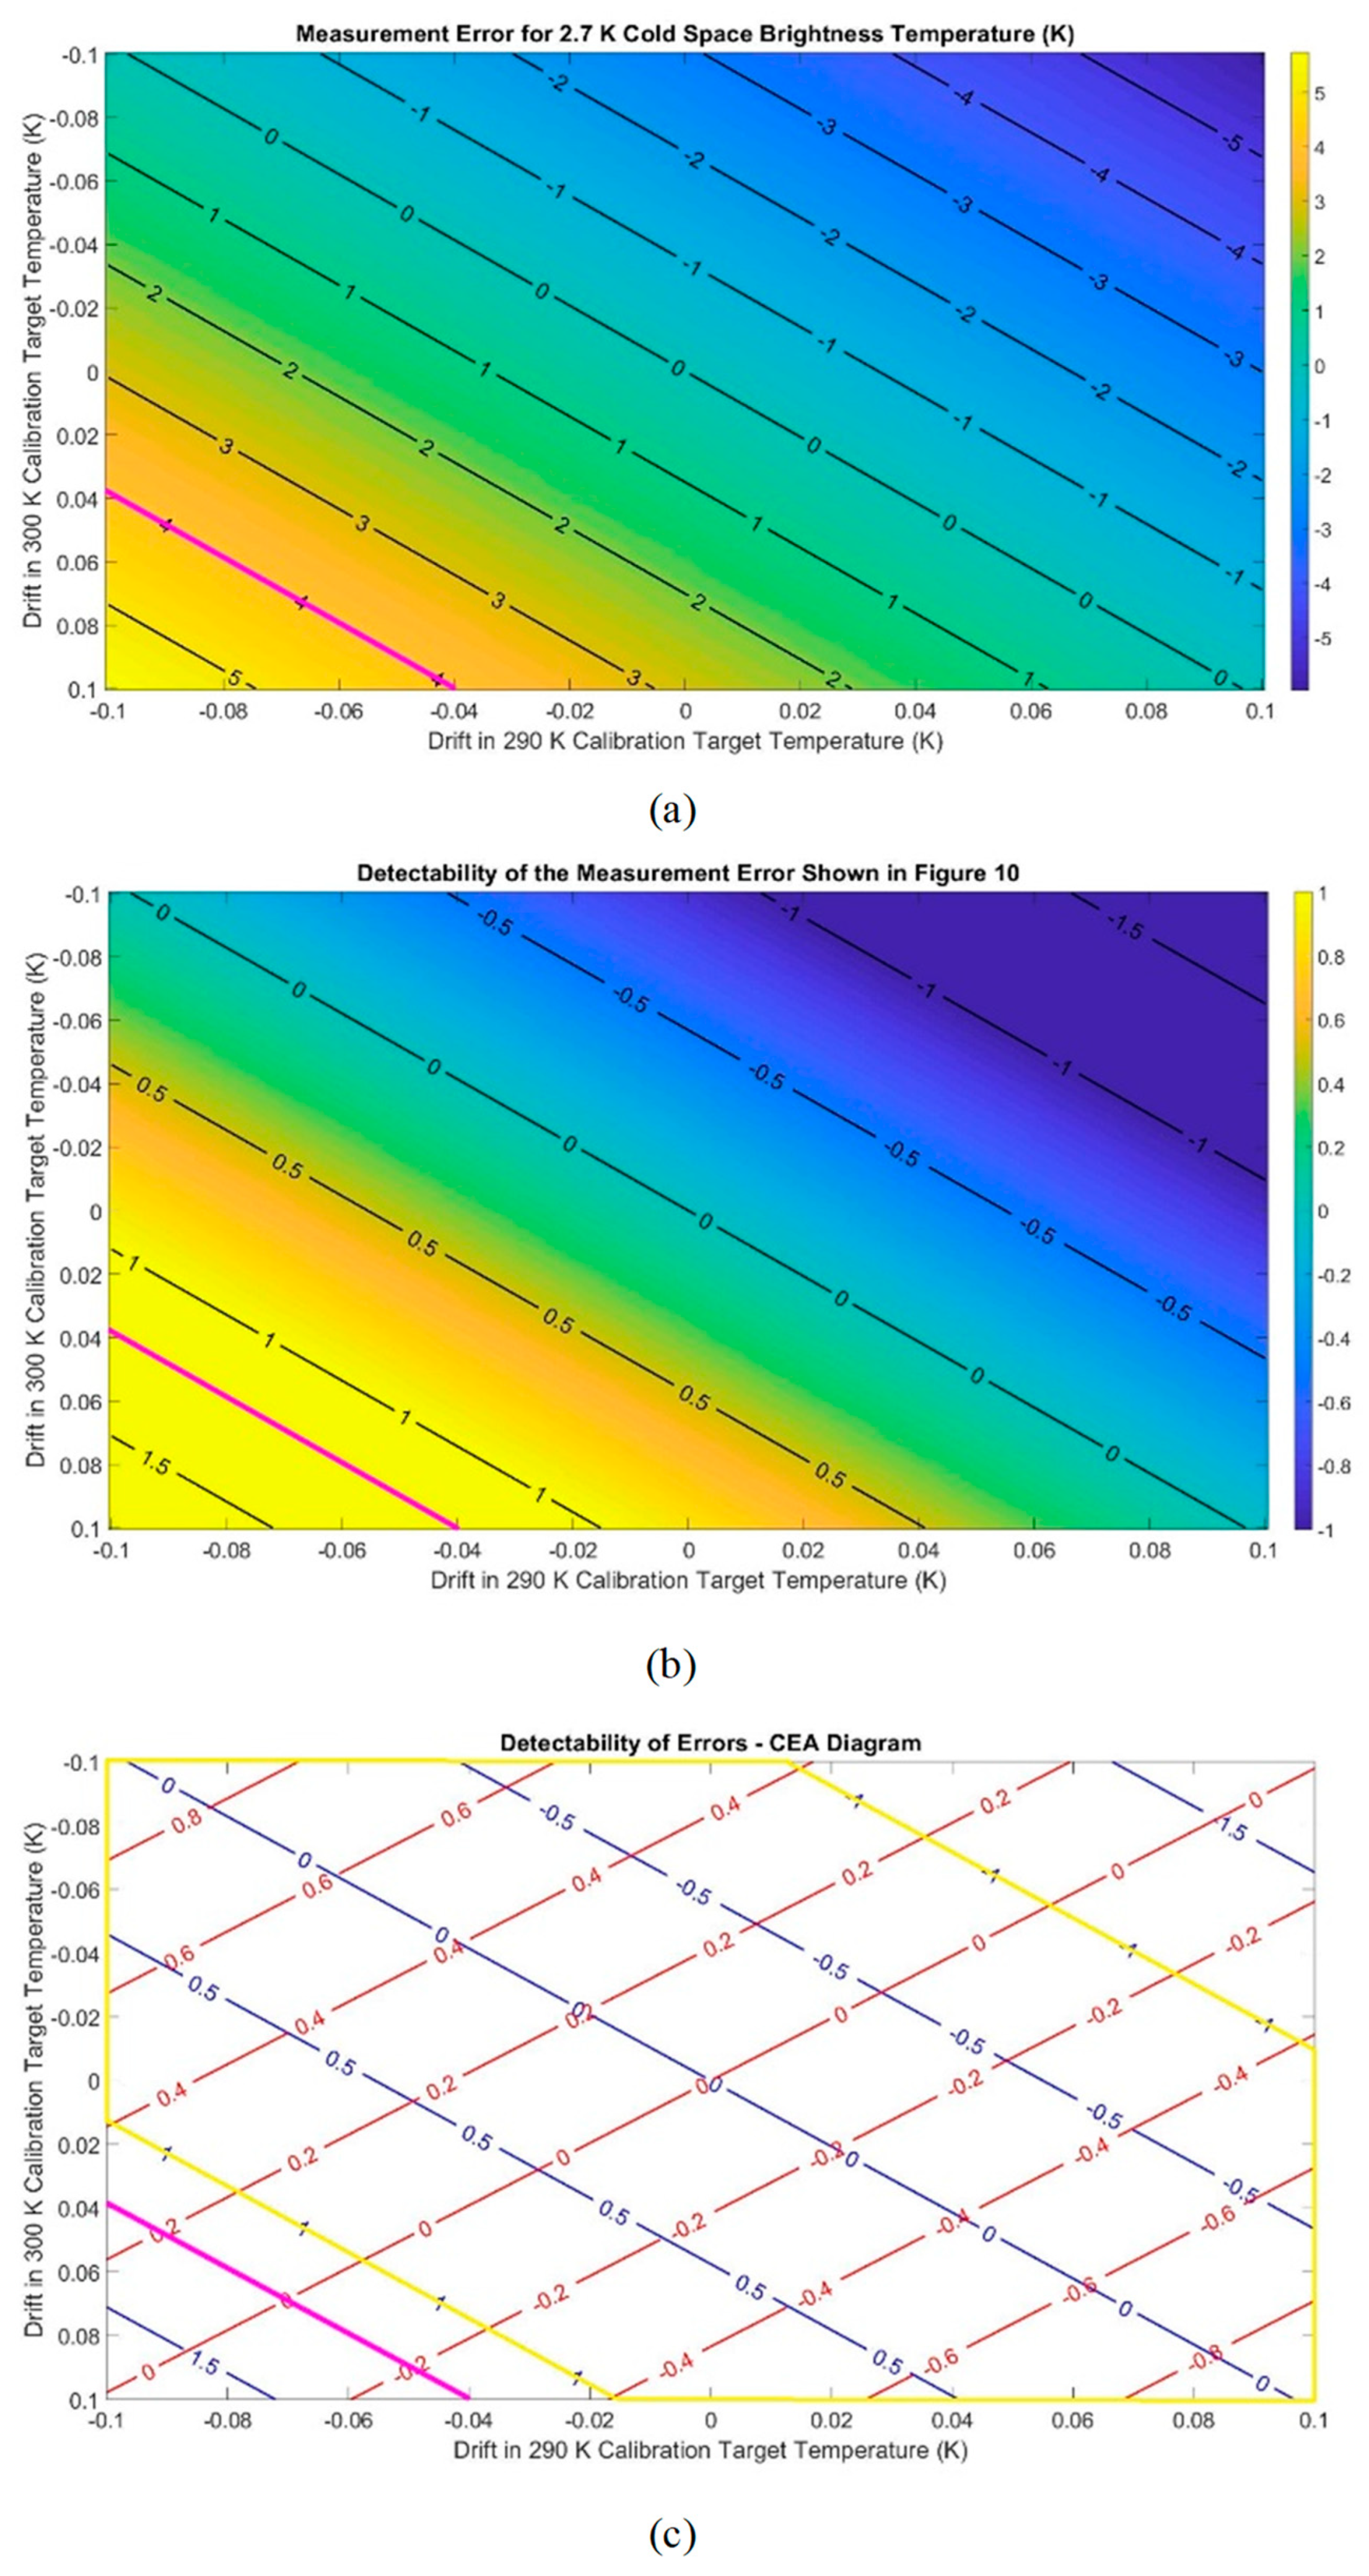
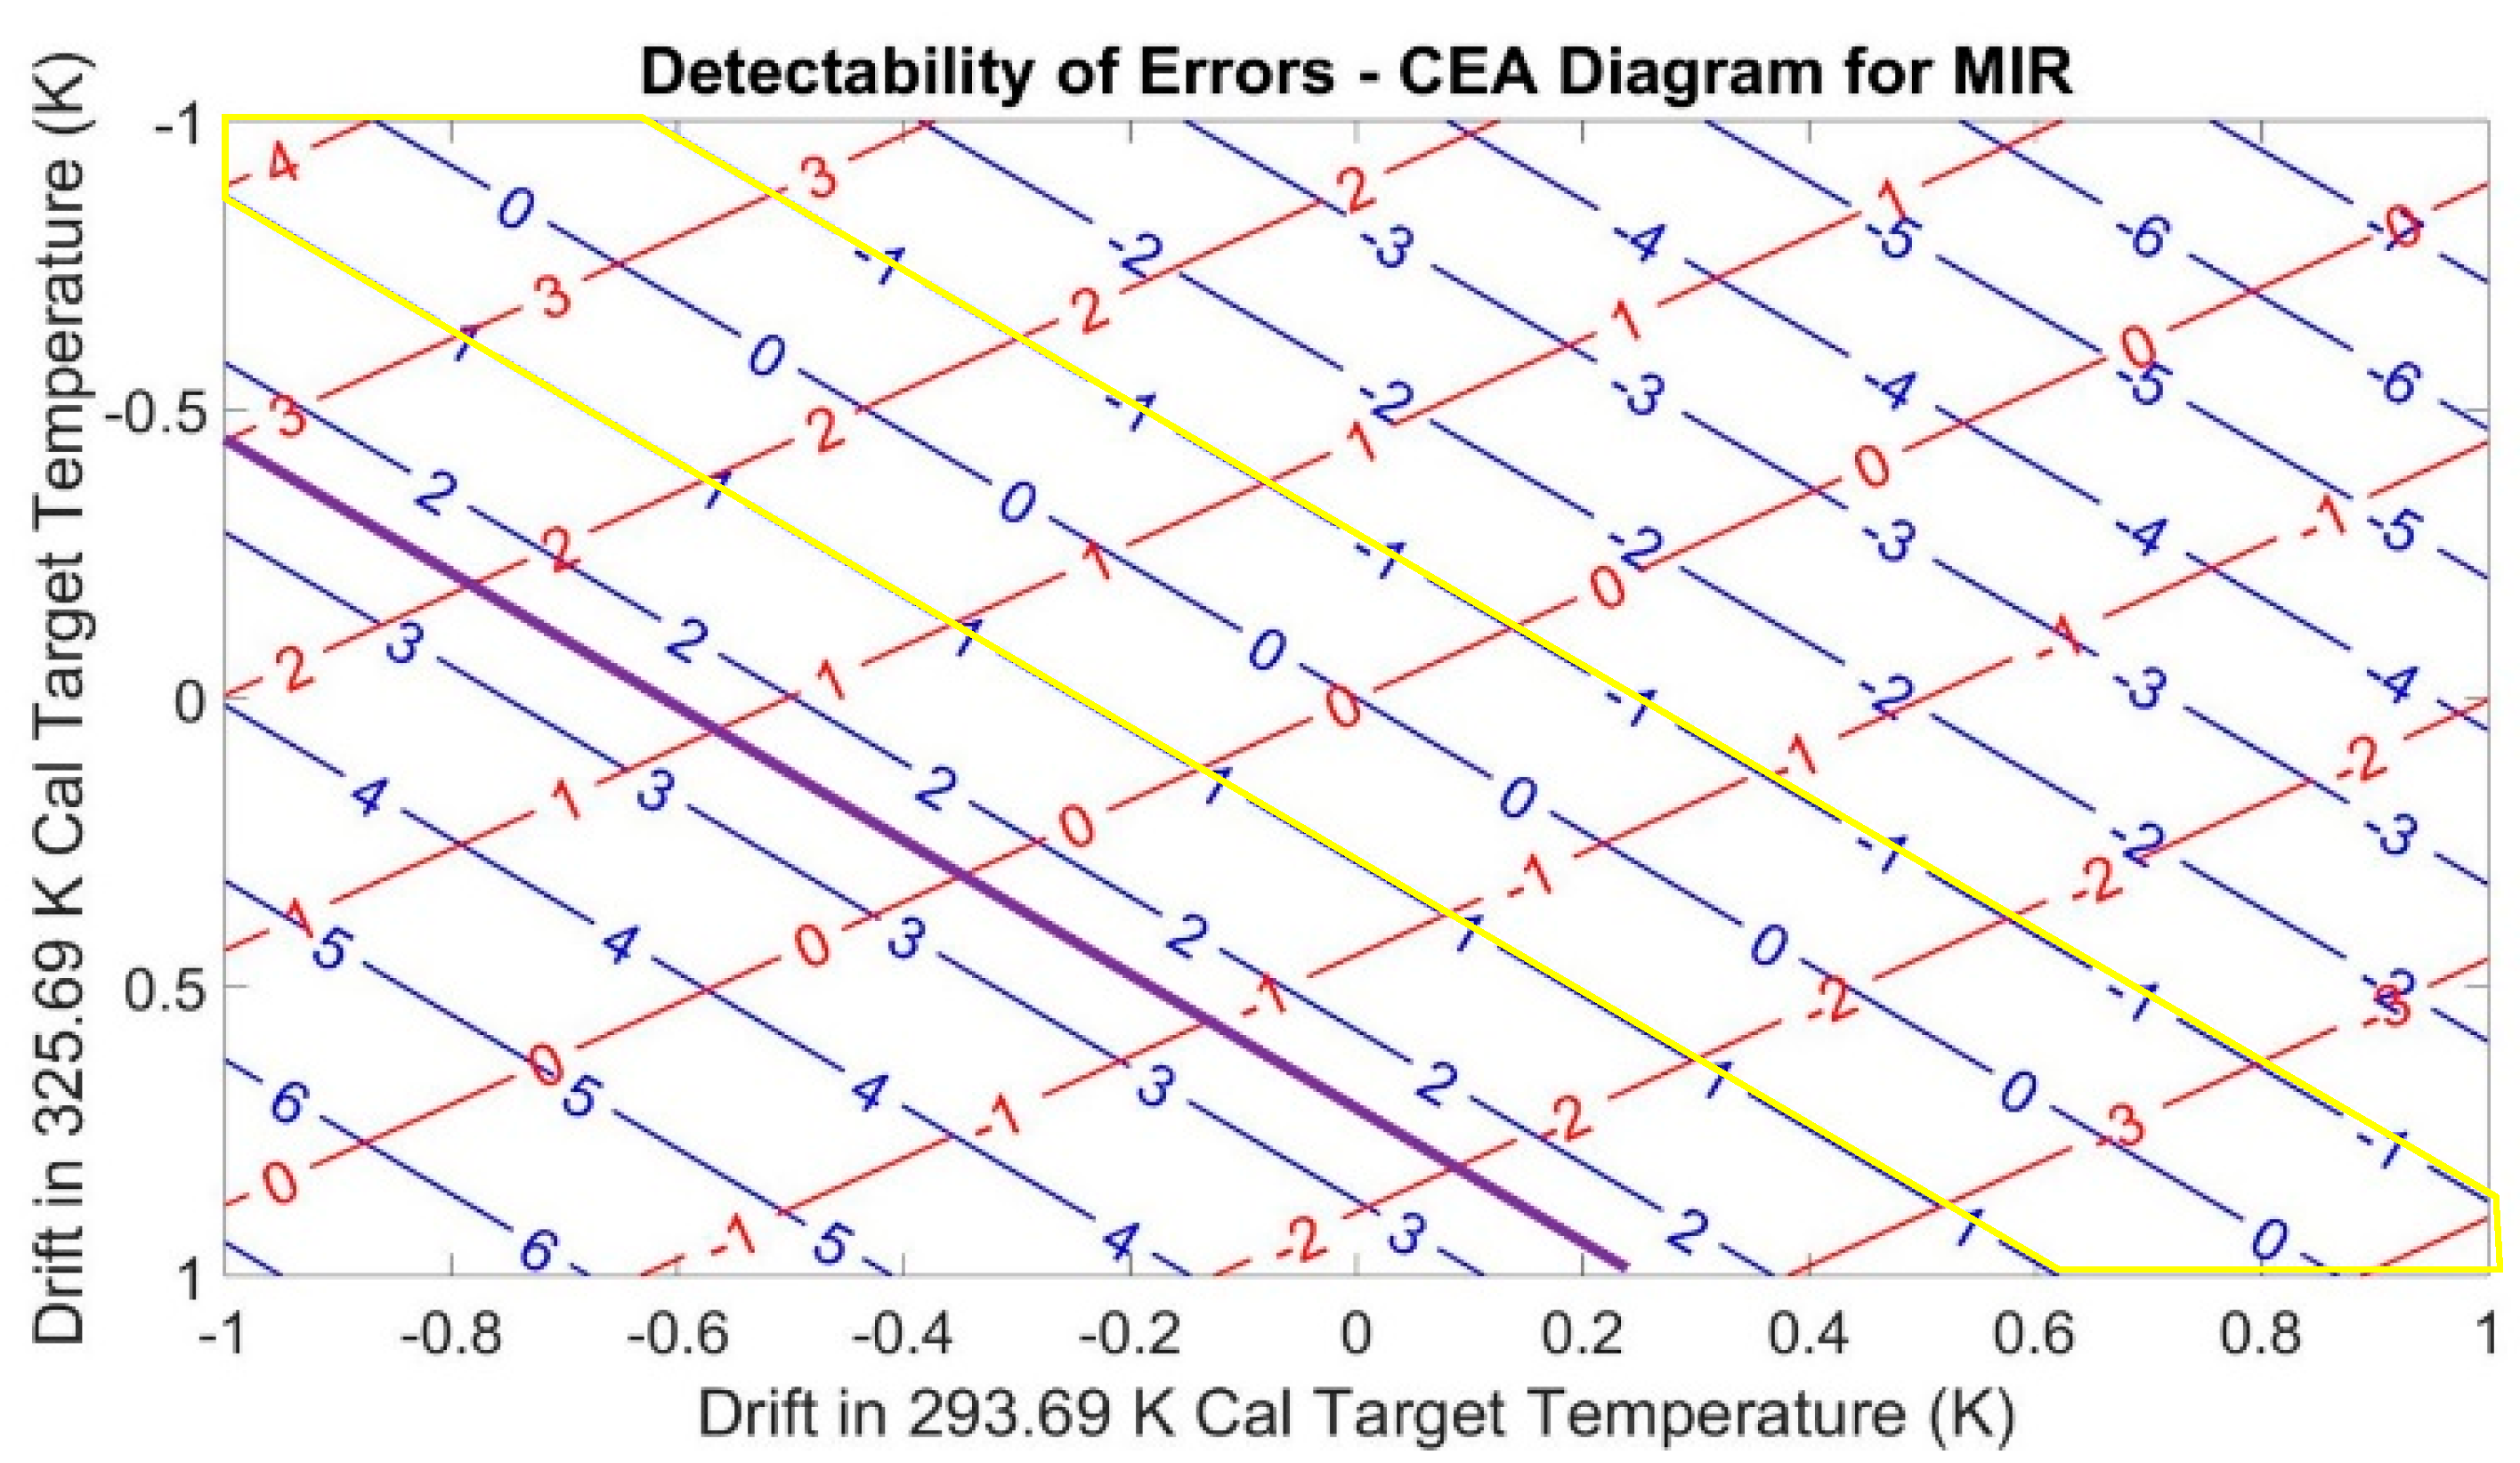
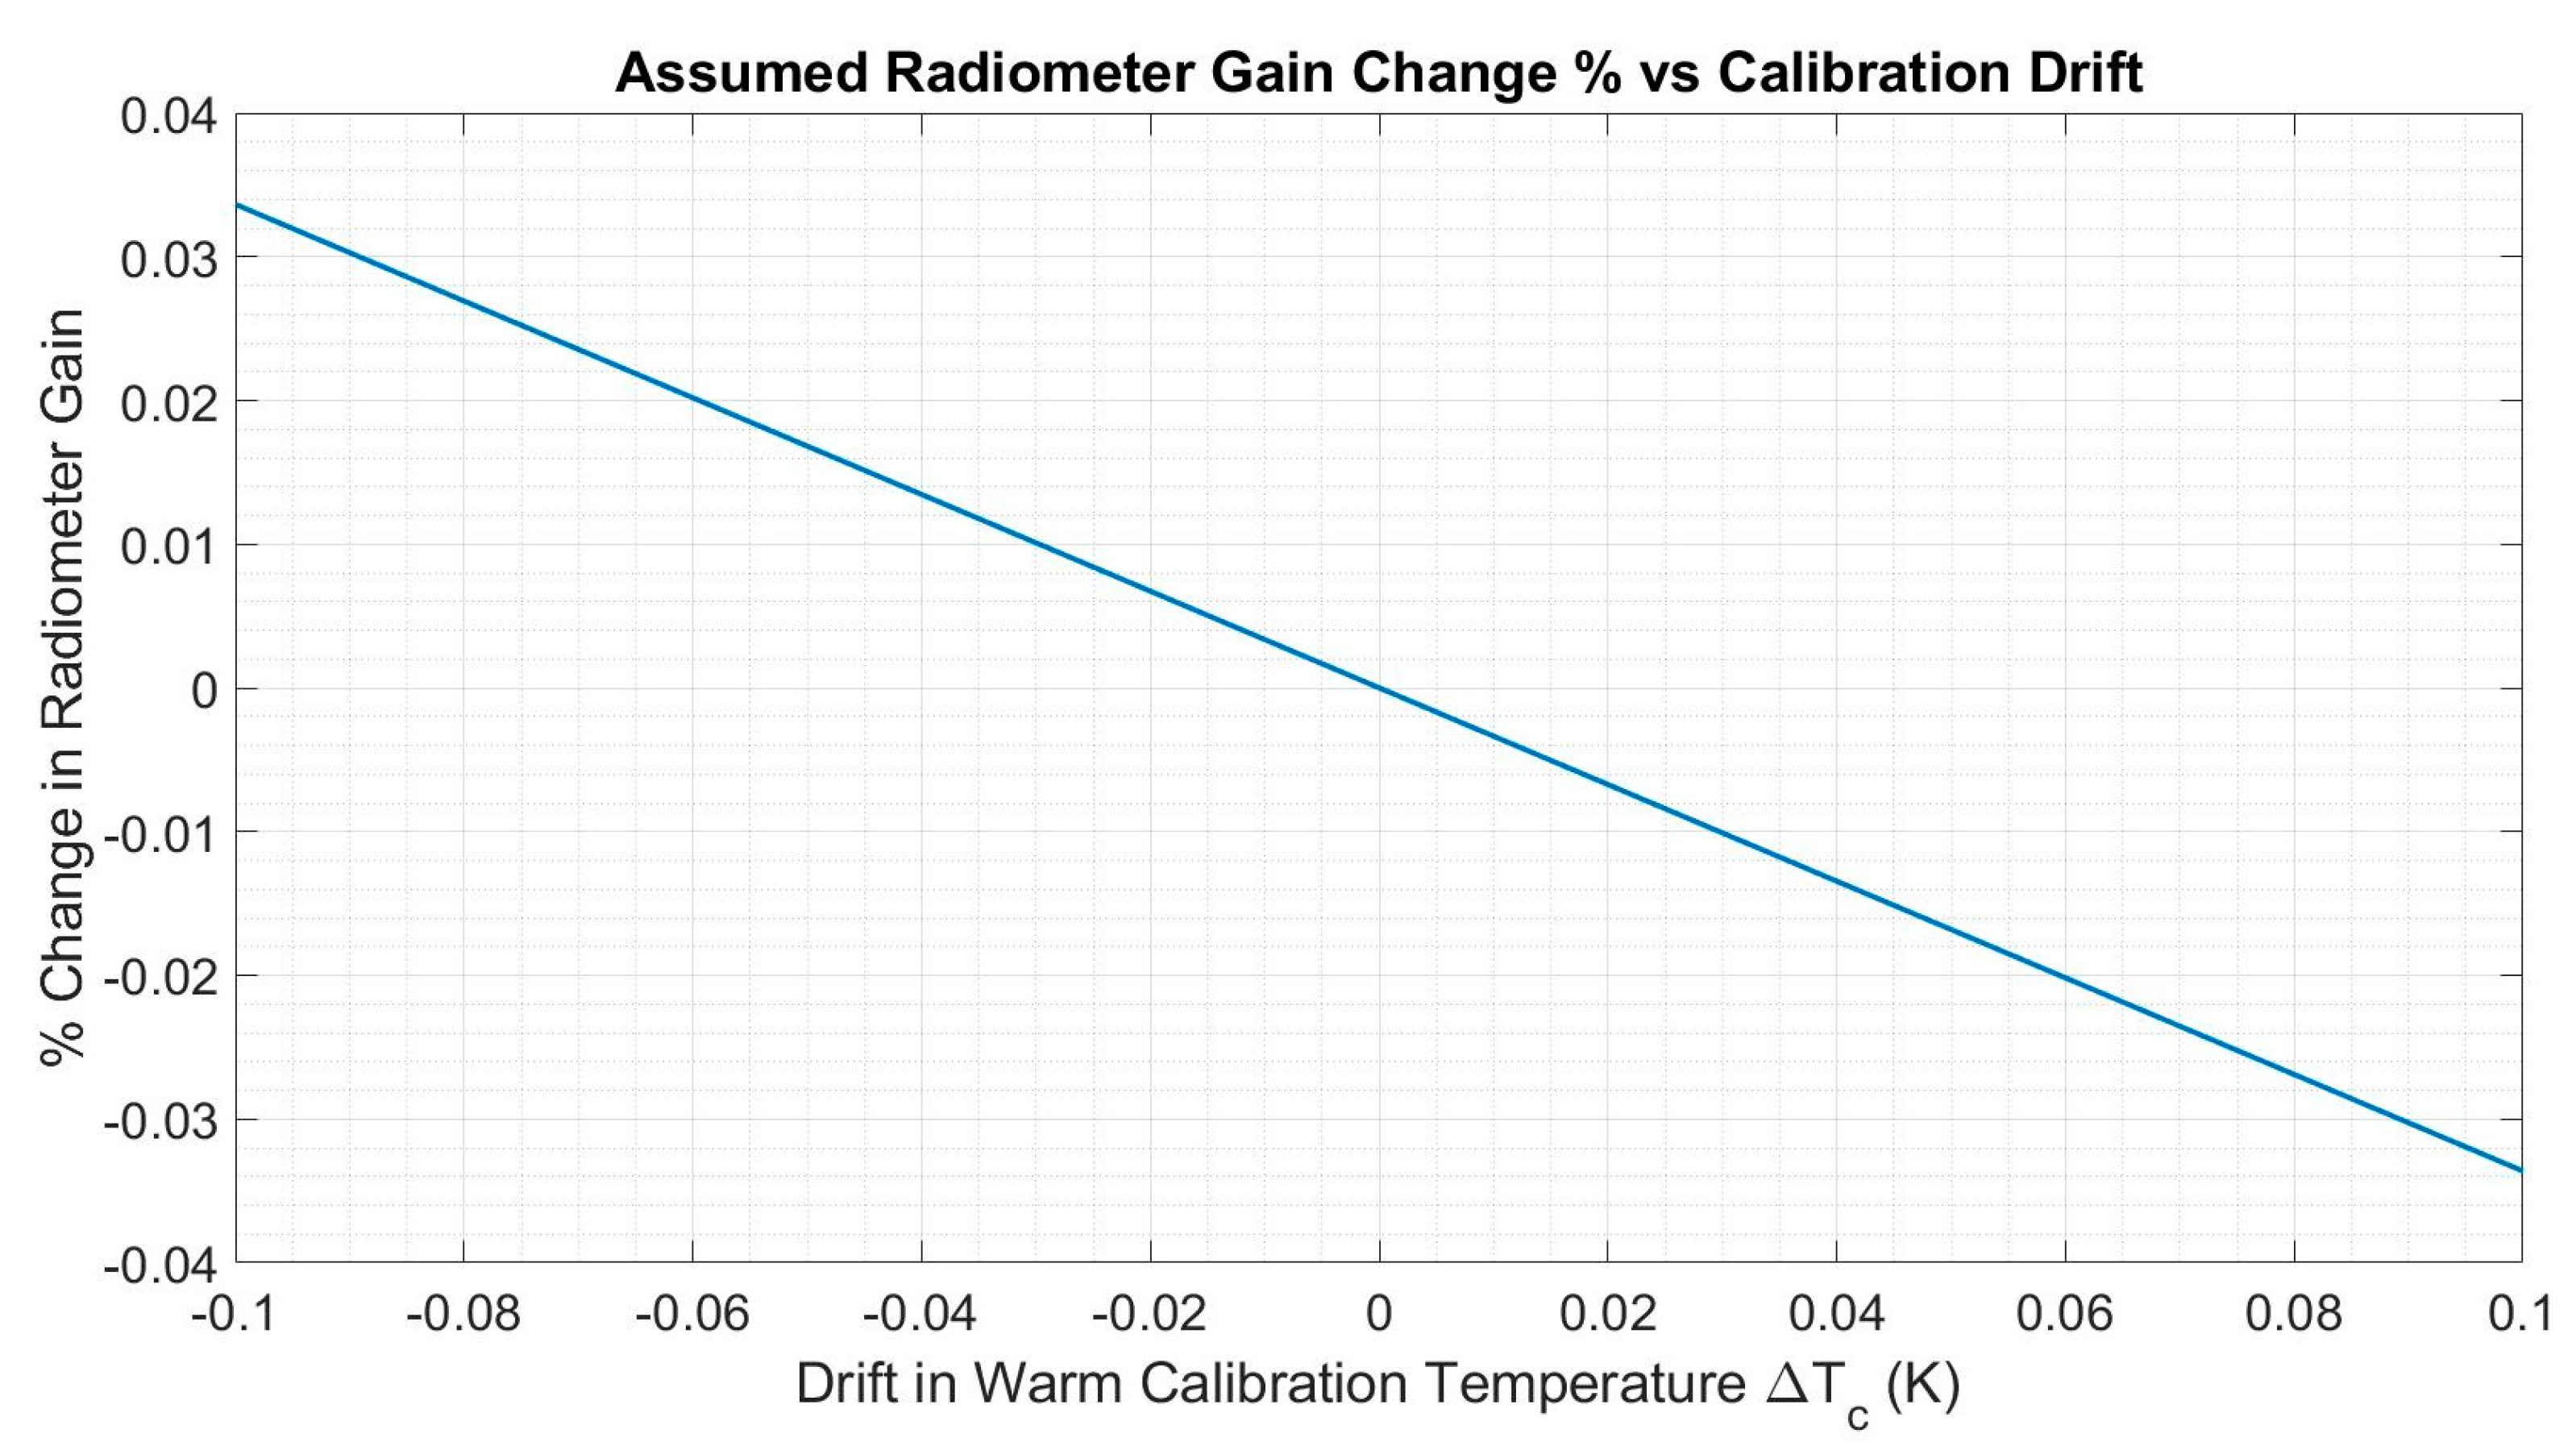
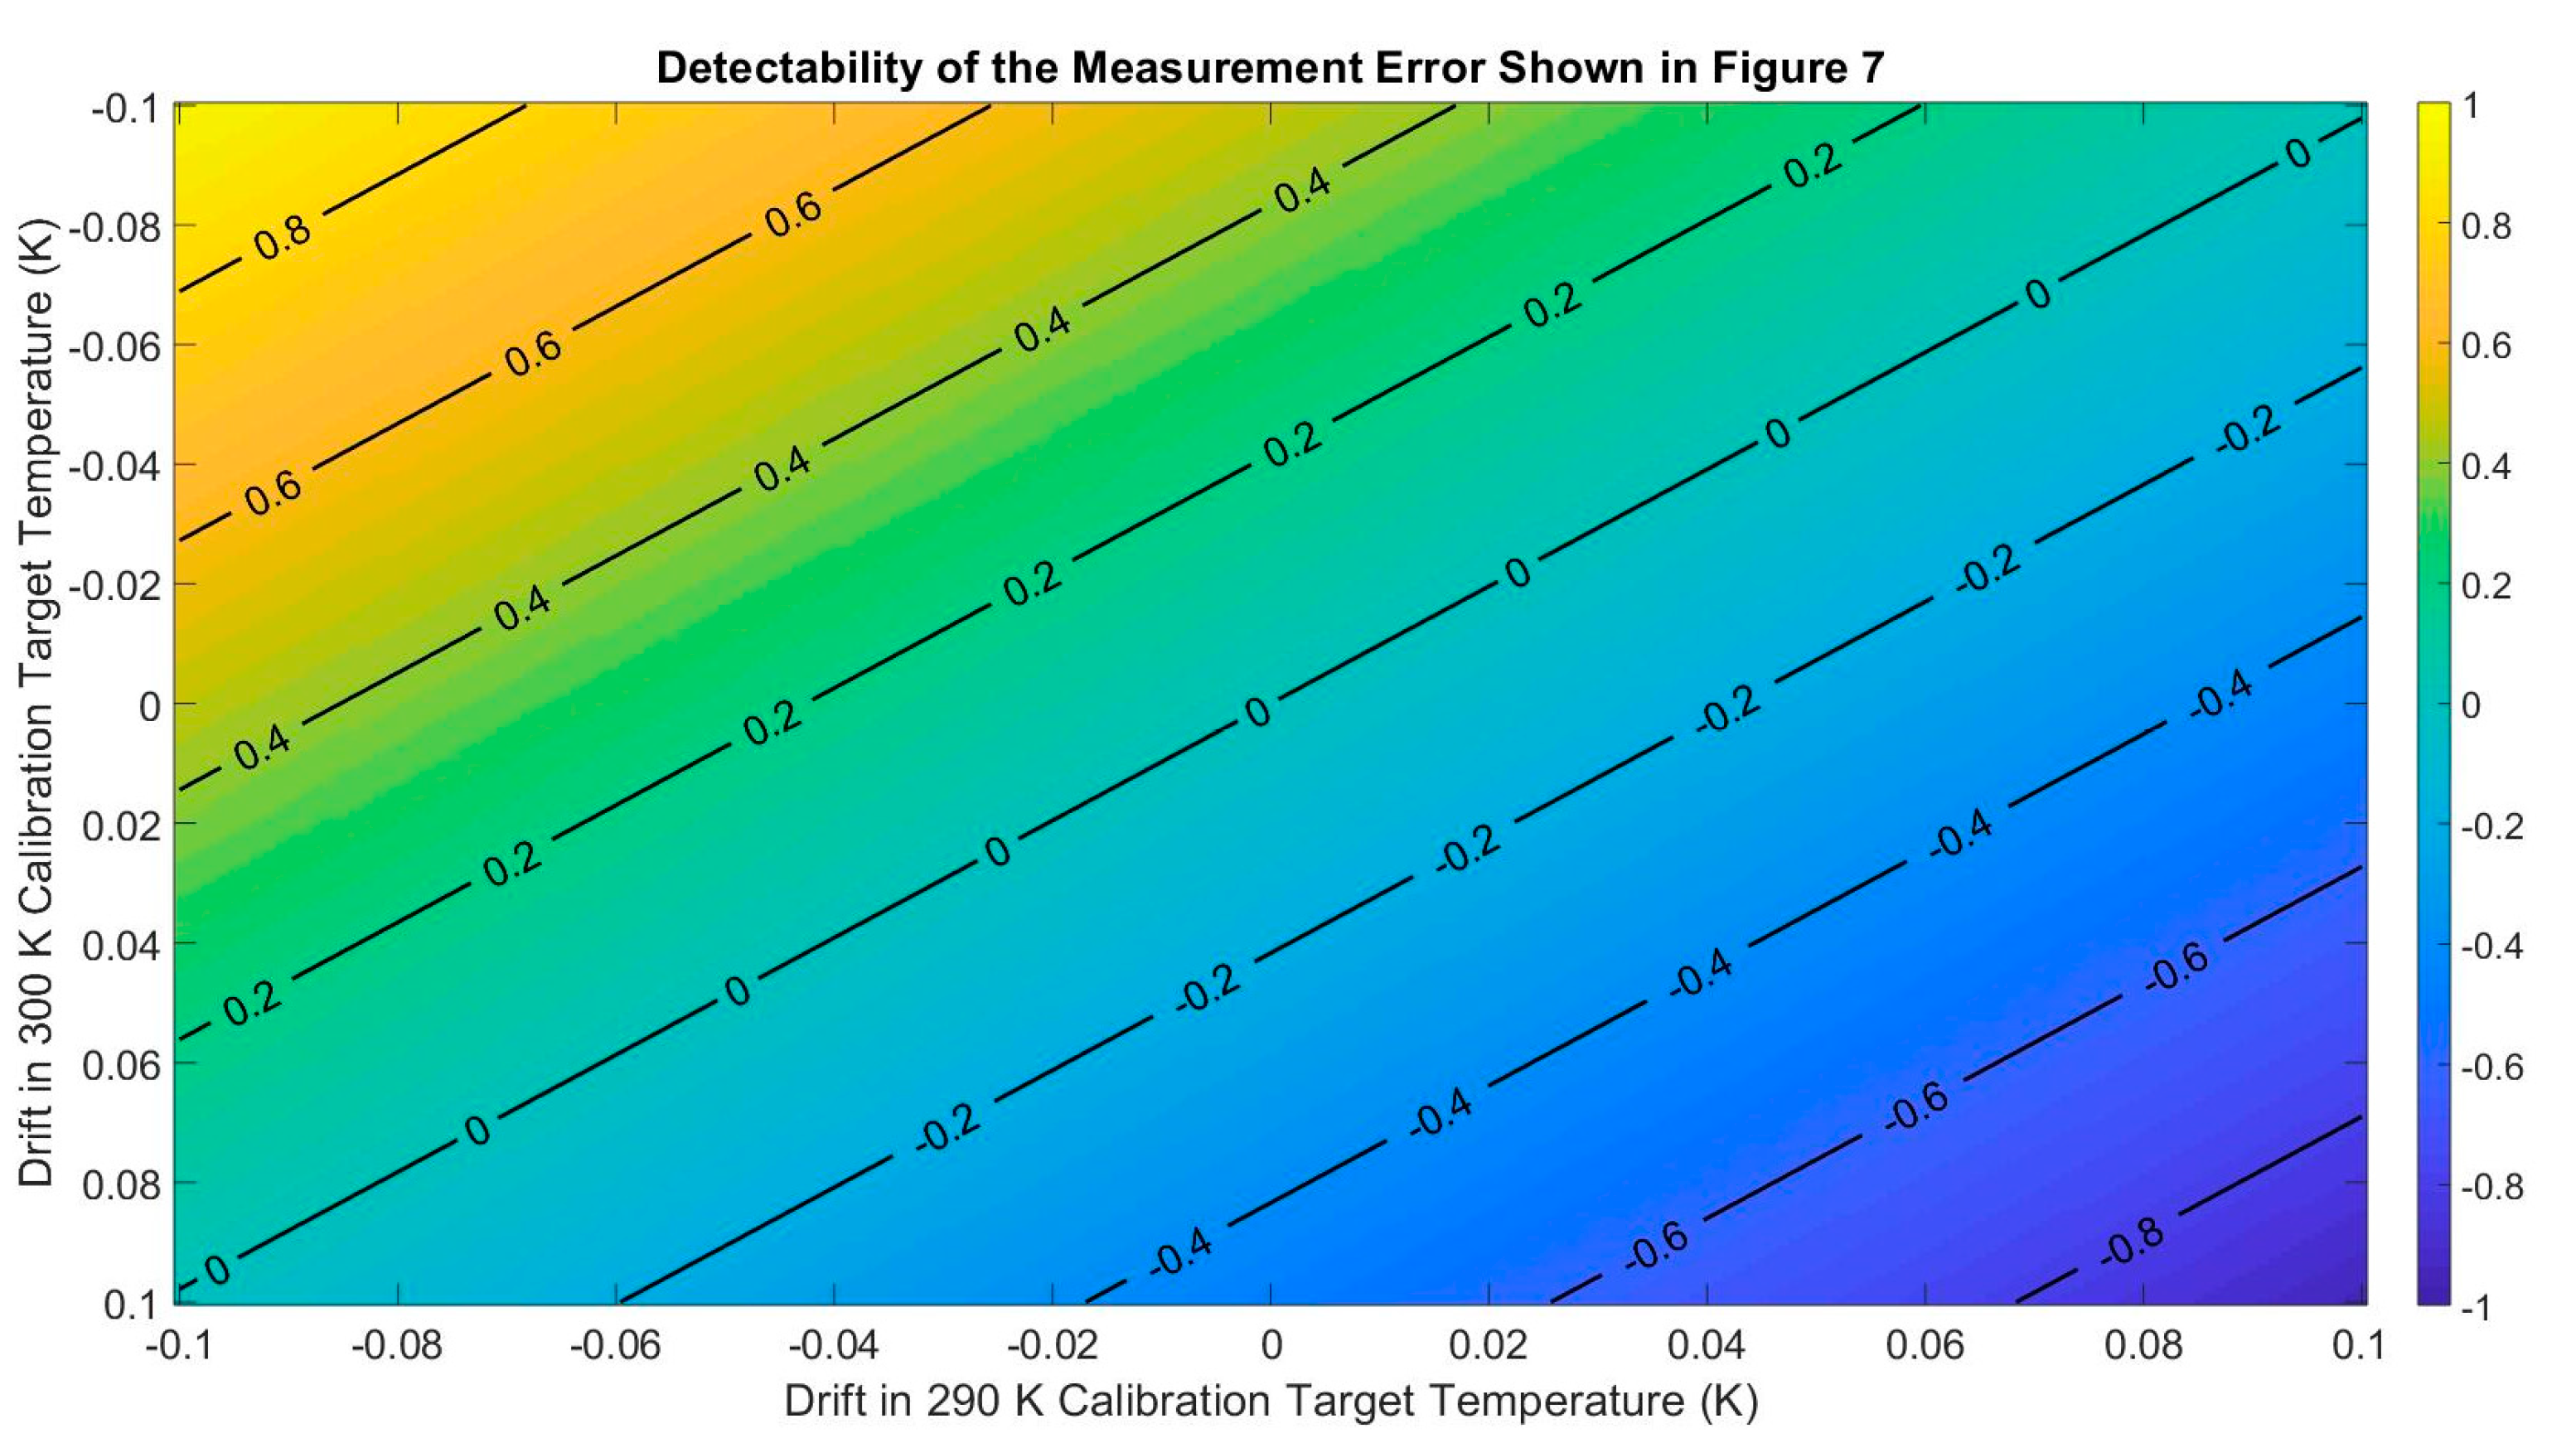
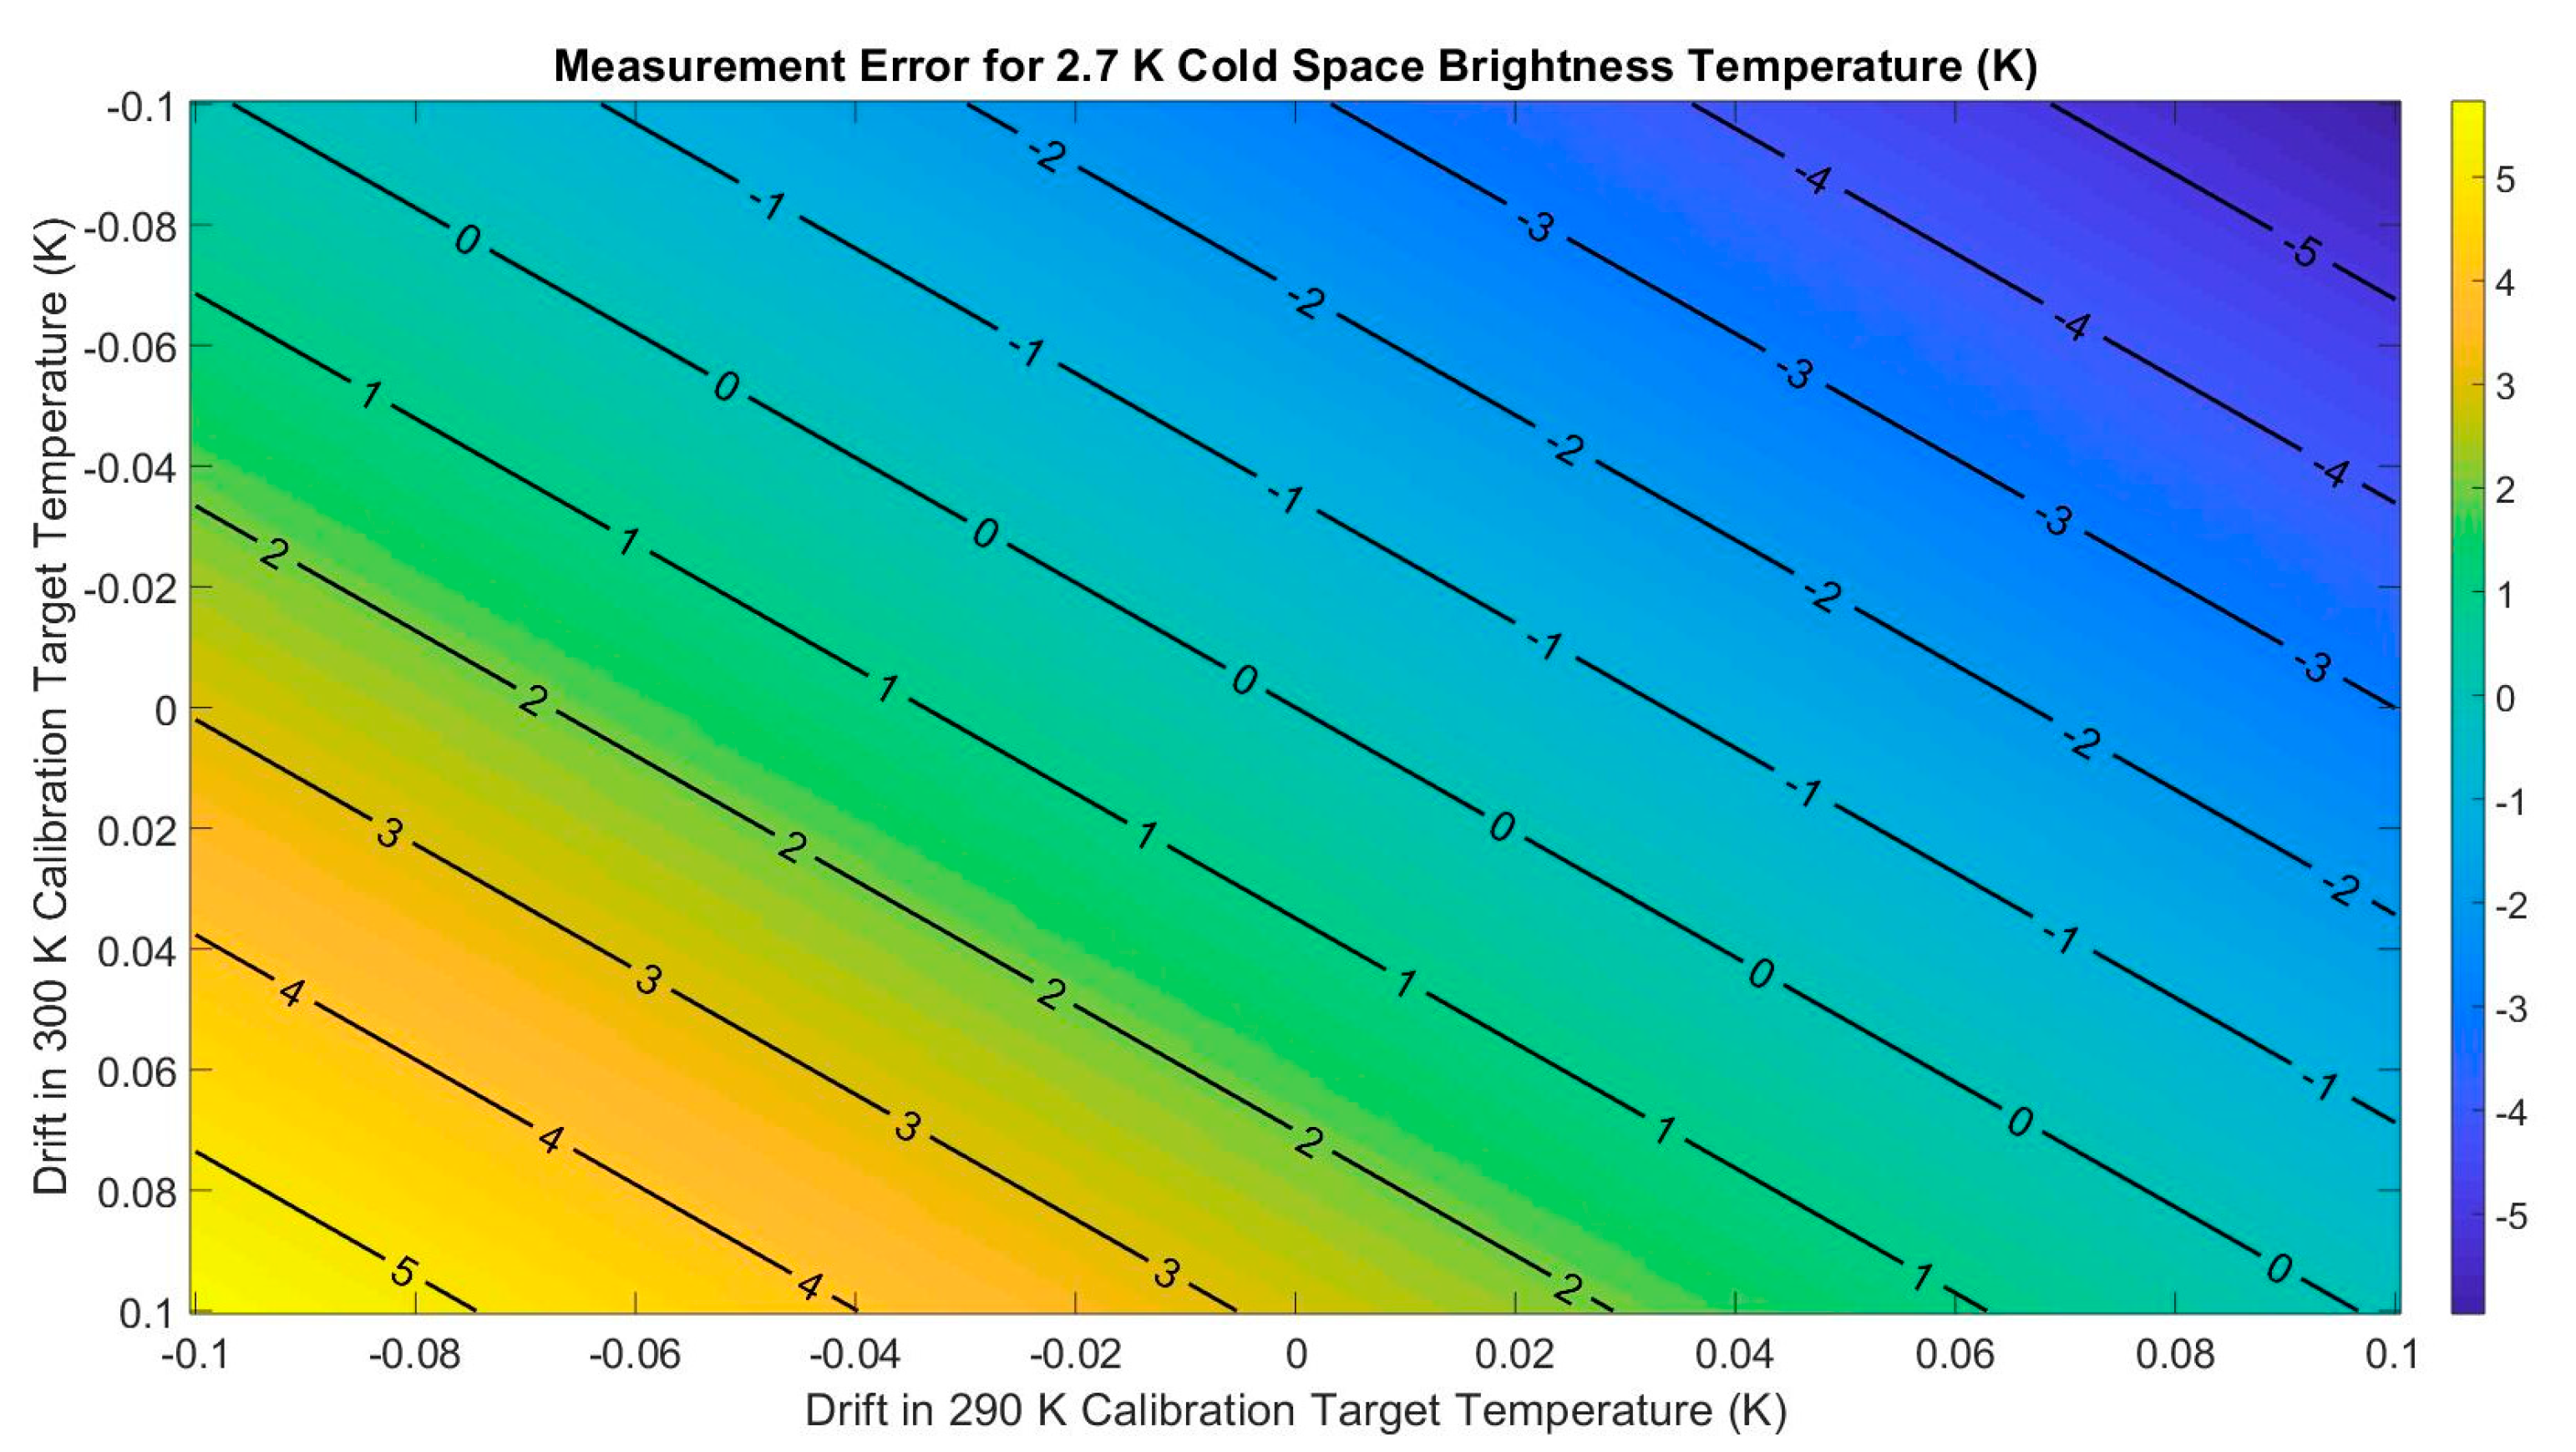
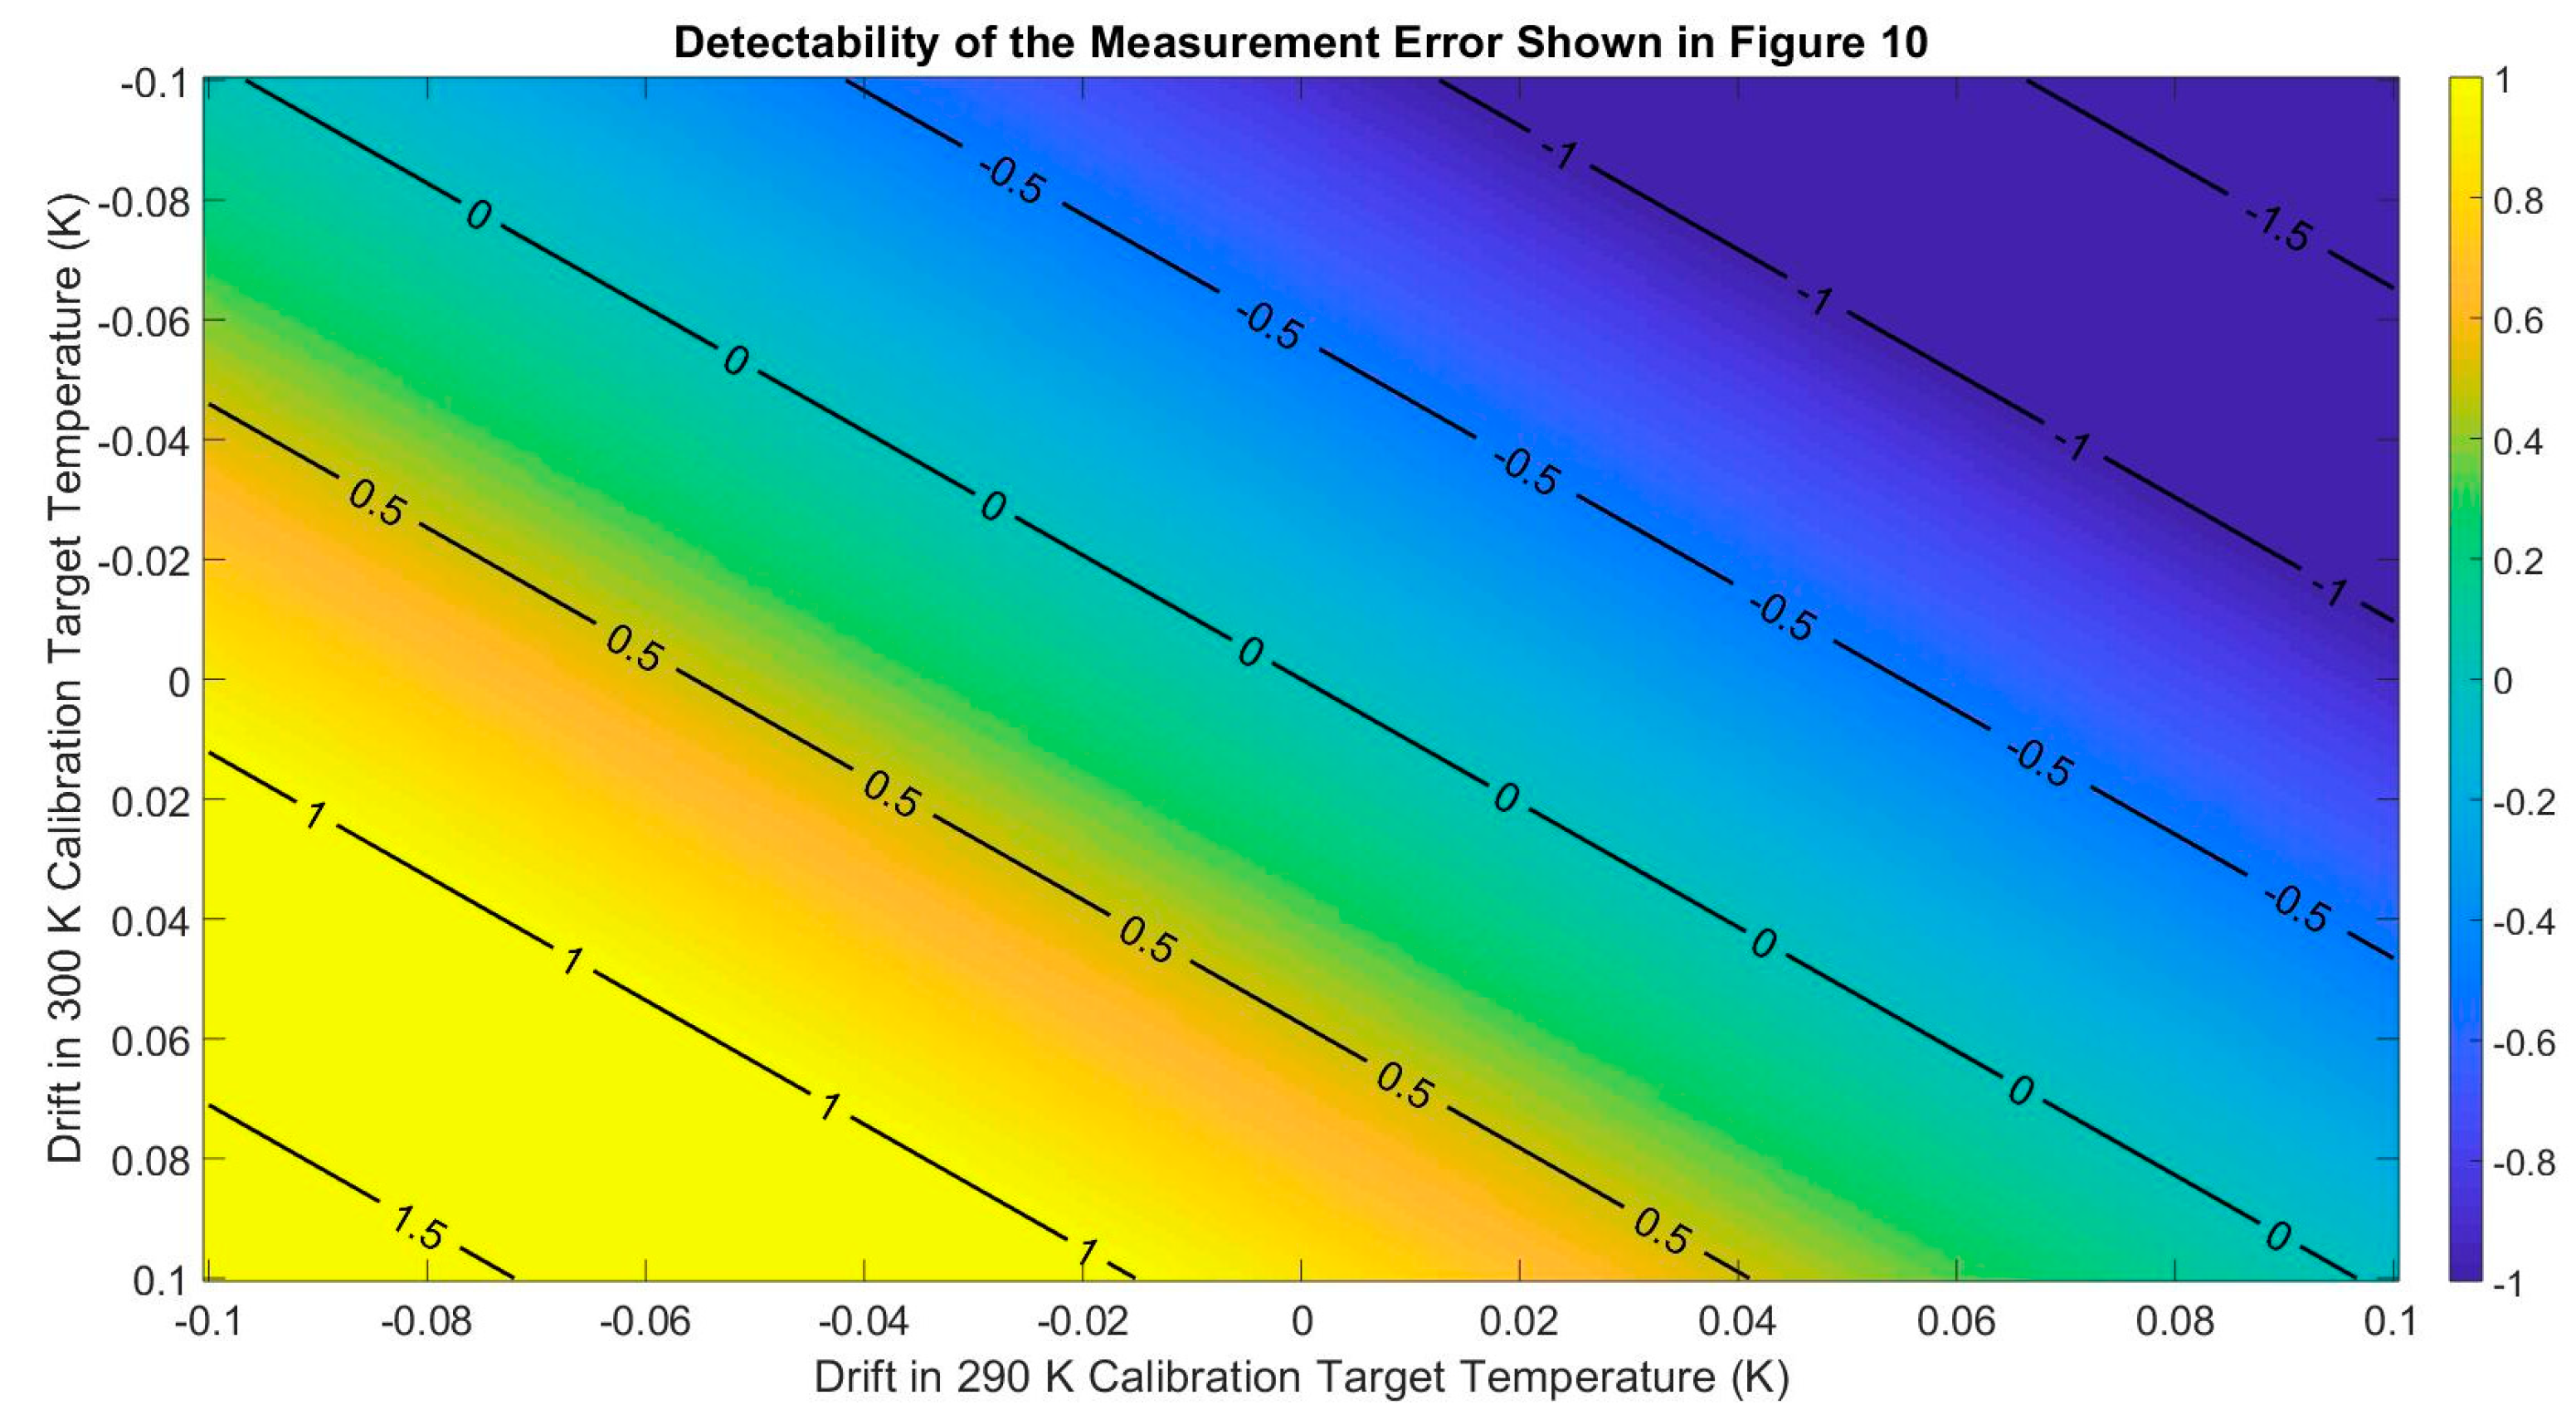
6.3. MIR Calibration Drifts

Assuming a 295.85 K atmospheric scene was observed, an analytical CEA diagram was created for MIR using Equations (1)–(6) with ± 1   K possible drifts in its 325.59 K and 293.69 K calibration targets whereas 79.02 K target was considered drift free. Figure 18 depicts this CEA diagram. To calculate post-gain voltages in these equations, mean radiometer gain and offset detected during the experiment were used. As described in Section 4 and Section 5, blue lines are detectability lines corresponding to calibration validation data processing path wherein 79.02 K target was calibrated using the remaining blackbodies. Red lines, on the other hand, indicates detectability values for the atmospheric brightness temperature measurements where all three calibration targets are utilized for calibration in the measurement data processing path.
Then, using the real post-gain voltages measured during the experiment, the calibration validation data processing path was followed to calculate the detectability of errors in the brightness temperature estimates for the 79.02 K target. The mean detectability, i.e., the ratio of the mean error (average difference between estimated and true temperature values) to the measurement uncertainty, was 2.4, which suggested significant calibration drifts. The corresponding line in the CEA diagram is shown in Figure 18 as well. The line, as described in Section 5, reveals the possible temperature drifts in 325.59 K and 293.69 K calibration targets. Indeed, as discussed in [22], MIR calibration target temperatures could not be measured accurately because of imperfect antenna beam efficiency and contributions of background emissions; thus, calibration drifts between ~1–3 K existed at the 89 GHz channel. The red lines in the CEA diagram also indicate that the error in the 295.85 K atmospheric brightness temperature measurements would be less than three standard deviations of the same measurements with these possible calibration drifts. The region inside the yellow lines, on the other hand, demonstrate that undetected calibration drifts in the MIR system may lead to even higher errors in atmospheric brightness temperature measurements relative to the measurement uncertainty.

7. Conclusions

Assuming a linear radiometer system, this paper presents a three-point onboard external calibration scheme with calibration error analysis (CEA) diagrams which provide means to quantify the calibration temperature drifts and associated measurement errors. It has been shown that the small temperature drifts in the external calibration targets may be mistaken for radiometer gain and offset fluctuations in two-point calibration algorithms. Furthermore, these algorithms are inadequate to evaluate temporal calibration stability, as the measurand is unknown. On the other hand, radiometer systems with three external calibration targets can track calibration drifts by calibrating one calibration target measurements using the other two. Also, the impact of the calibration drifts on the measurand observations can be quantified by establishing upper bounds using CEA diagrams. Temporal stability of such three-point external calibration algorithms depends on the stability of individual external calibration reference targets and radiometer gain stability, and can also be analyzed using the three known calibration targets by varying their observation times with respect to one another. Calibration accuracy, on the other hand, would be similar to that of two-point algorithms under ideal circumstances (i.e., linear system, accurate measurement of calibration reference temperatures, and stable radiometer gain), yet influenced by several factors such as calibration reference temperatures, thermal homogeneity of the calibration references, non-linearity of the radiometer gain, calibration reference observation, and integration times under non-ideal conditions. Therefore, analysis of accuracy of the proposed technique regarding these factors require further investigations in future work. It is also important to note that CEA diagrams presented in this paper do not reveal the exact amounts of temperature drifts in each calibration target, and do not provide means to correct the errors in the measurand estimates because of the calibration drifts. CEA diagrams only provide quantitative bounds for such errors to assess the reliability of the radiometer measurements.
It has been discussed that the CEA diagrams depend on the measurand brightness temperature. Different measurand temperatures lead to different levels of impact that calibration drifts may have on the calibrated measurand temperatures. Although, the measurand brightness temperature is usually unknown in almost all radiometer applications, a rough estimate can be enough to quantify the errors because of calibration drifts with acceptable inaccuracies.
Additionally, the selection of calibration target temperatures determines the sensitivity of system to any drifts in those calibration target temperatures. Thus, if a particular calibration target is believed to be more susceptible to drifts, the calibration target temperatures can be adjusted accordingly to detect drifts in its temperature. Moreover, the integration times can be adjusted to increase the resolution of the error detectability in CEA diagrams. Longer integration times lead to more precise quantifications in calibration errors.
Note that three or more calibration targets are usually used in pre-launch characterization of radiometers to test their linearity and stability [10,23]. Also, as previously mentioned, internal noise diodes have been used in radiometers to create additional calibration targets to track calibration stability and linearity [24,25]. On the other hand, this paper discusses an onboard absolute calibration implementation using external references where the errors in calibration measurements and unknown geophysical measurements are characterized using CEA diagrams. More than two external calibration targets have been already utilized in some radiometer systems onboard, such as the National Polar-Orbiting Operational Environmental Satellite System (NPOESS) aircraft sounder testbed (NAST) to correct thermal gradients in one of the external targets [26]; thus, the three-point calibration technique presented in this paper to detect such gradients during onboard calibration, quantify the impact of them on the radiometric measurements, and investigate if the temporal calibration stability is feasible for hardware realizations. However, it should be noted that external calibrations are usually more time consuming and infrequent compared to internal calibrations; thus, rapid calibration drifts and errors associated with them may not be fully captured by the proposed method.
As future work, a similar study will be carried out for non-linear systems, a cost analysis for having an additional calibration target will be performed, and inclusion of the third external calibration target for current systems through vicarious calibration and inter-calibration techniques with other radiometers will be studied. The authors also plan to validate the theoretical results presented in this paper experimentally using a real radiometer system observing three external calibration reference targets and an unknown scene, and analyze the stability and accuracy of the proposed calibration technique under different scenarios.

Author Contributions

Conceptualization, M.A. and P.E.R.; methodology, M.A. and P.E.R.; software, M.A.; validation, M.A.; formal analysis, M.A.; investigation, M.A.; resources, M.A. and P.E.R.; data curation, M.A. and P.E.R.; writing—original draft preparation, M.A.; writing—review and editing, M.A. and P.E.R.; visualization, M.A.; supervision, M.A.; project administration, M.A.; funding acquisition, M.A.

Funding

This research received no external funding.

Acknowledgments

The authors would like to acknowledge the National Aeronautics and Space Administration (NASA) for providing radiometer measurements performed in 2002 by the Millimeter-wave Imaging Radiometer (MIR).

Conflicts of Interest

The authors declare no conflict of interest.

References

  1. Ohring, G.; Wielicki, B.; Spencer, R.; Emery, B.; Datla, R. Satellite Instrument Calibration for Measuring Global Climate Change. Report of a Workshop. Bull. Am. Meteorol. Soc. 2005, 86, 1303–1314. [Google Scholar] [CrossRef]
  2. Guenther, B.; Butler, J.; Ardanuy, P. Workshop on strategies for calibration and validation of global change measurements. NASA Ref. Publ. 1997, 1397, 125. [Google Scholar]
  3. Ruf, C.S. Detection of calibration drifts in spaceborne microwave radiometers using a vicarious cold reference. IEEE Trans. Geosci. Remote Sens. 2000, 38, 44–52. [Google Scholar] [CrossRef]
  4. Draper, D.W.; Newell, D.A.; Wentz, F.J.; Krimchansky, S.; Skofronick-Jackson, G.M. The global precipitation measurement (GPM) microwave imager (GMI): Instrument overview and early on-orbit performance. IEEE J. Sel. Top. Appl. Earth Obs. Remote Sens. 2015, 8, 3452–3462. [Google Scholar] [CrossRef]
  5. Njoku, E.; Stacey, J.M.; Barath, F.T. The Seasat scanning microwave radiometer (SMMR): Instrument description and performance. IEEE J. Oceanic Eng. 1980, 5, 100–115. [Google Scholar] [CrossRef]
  6. Hollinger, J.P.; Pierce, J.L.; Poe, G.A. SSM/I instrument evaluation. IEEE Trans. Geosci. Remote Sens. 1990, 28, 781–790. [Google Scholar] [CrossRef]
  7. Ruf, C.S.; Keihm, S.J.; Janssen, M.A. TOPEX/POSEIDON microwave radiometer (TMR)—I: Instrument description and antenna temperature calibration. IEEE Trans. Geosci. Remote Sens. 1995, 33, 125–137. [Google Scholar] [CrossRef]
  8. Wilson, W.J.; Tanner, A.B.; Pellerano, F.A.; Horgan, K.A. Ultra Stable Microwave Radiometers for Future Sea Surface Salinity Missions; Jet Propulsion Laboratory, National Aeronautics and Space Administration: Pasadena, CA, USA, 2005.
  9. Racette, P.; Lang, R.H. Radiometer design analysis based upon measurement uncertainty. Radio Sci. 2005, 40, 1–22. [Google Scholar] [CrossRef]
  10. Draper, D.W.; Newell, D.A.; McKague, D.S.; Piepmeier, J.R. Assessing calibration stability using the Global Precipitation Measurement (GPM) Microwave Imager (GMI) noise diodes. IEEE J. Sel. Top. Appl. Earth Obs. Remote Sens. 2015, 8, 4239–4247. [Google Scholar] [CrossRef]
  11. Weissbrodt, E. Active Electronic loads for Radiometric Calibration. Ph.D. Thesis, University of Stuttgart, Stuttgart, Germany, 2017. [Google Scholar] [CrossRef]
  12. Fernandez, S.; Murk, A.; Kämpfer, N. Design and characterization of a Peltier-cold calibration target for a 110-GHz radiometer. IEEE Trans. Geosci. Remote Sens. 2015, 53, 344–351. [Google Scholar] [CrossRef]
  13. Jewell, P. Millimeter Wave Calibration; Single Dish Summer School, National Radio Astronomy Observatory: Green Bank, WV, USA, 2003. [Google Scholar]
  14. Murk, A.; Reveles, J.R.; Wylde, R.; Bell, G.; Zivkovic, I.; McNamara, A.; de Maagt, P. Low mass calibration target for MM-wave remote sensing instruments. IEEE Trans. Antennas Propag. 2013, 61, 1547–1556. [Google Scholar] [CrossRef]
  15. Houtz, D.A. NIST Microwave Blackbody: The Design, Testing, and Verification of a Conical Brightness Temperature Source. Ph.D. Thesis, University of Colorado, Boulder, CO, USA, 2017. [Google Scholar]
  16. Draper, N.R.; Smith, H. Applied Regression Analysis, 3rd ed.; John Wiley: Hoboken, NJ, USA, 1998. [Google Scholar]
  17. Aksoy, M.; Racette, P.E. Tracking Radiometer Calibration Stability Using Three-Point Onboard Calibration. In Proceedings of the 2018 IEEE 15th Specialist Meeting on Microwave Radiometry and Remote Sensing of the Environment (MicroRad), Cambridge, MA, USA, 27–30 March 2018; pp. 1–4. [Google Scholar] [CrossRef]
  18. Aksoy, M.; Racette, P.E. Tracking calibration stability in climate monitoring microwave radiometers using onboard 3-point calibration. In Proceedings of the 2017 IEEE International Geoscience and Remote Sensing Symposium (IGARSS), Fort Worth, TX, USA, 23–28 July 2017; pp. 2118–2120. [Google Scholar] [CrossRef]
  19. Racette, P.E. Application of Ensemble Detection and Analysis to modeling uncertainty in non stationary processes. In Proceedings of the 2010 IEEE International Geoscience and Remote Sensing Symposium (IGARSS), Honolulu, HI, USA, 25–30 July 2010; pp. 582–585. [Google Scholar] [CrossRef]
  20. Racette, P.E.; Adler, R.F.; Wang, J.R.; Gasiewski, A.J.; Zacharias, D.S. An airborne millimeter-wave imaging radiometer for cloud, precipitation, and atmospheric water vapor studies. J. Atmos. Oceanic Technol. 1996, 13, 610–619. [Google Scholar] [CrossRef]
  21. Racette, P.E. Radiometer Design Analysis Based on Measurement Uncertainty. Ph.D. Thesis, George Washington University, Washington, DC, USA, 2005. [Google Scholar]
  22. Racette, P.E.; Wang, J.; Evans, P.; Saunders, R.; Gasiewski, A.; Jackson, D. A calibration experiment using the millimeter-wave imaging radiometer at the UK Meteorological Office calibration facility. In Proceedings of the 1995 International Geoscience and Remote Sensing Symposium (IGARSS): Quantitative Remote Sensing for Science and Applications, Firenze, Italy, 10–14 July 1995; pp. 809–811. [Google Scholar] [CrossRef]
  23. Saunders, R.W.; Hewison, T.J.; Stringer, S.J.; Atkinson, N.C. The radiometric characterization of AMSU-B. IEEE Trans. Microw. Theory Tech. 1995, 43, 760–771. [Google Scholar] [CrossRef]
  24. Brown, S.T.; Desai, S.; Lu, W.; Tanner, A. On the Long-Term Stability of Microwave Radiometers Using Noise Diodes for Calibration. IEEE Trans. Geosci. Remote Sens. 2007, 45, 1908–1920. [Google Scholar] [CrossRef]
  25. Draper, D.W.; Newell, D.A. Global Precipitation Measurement (GPM) Microwave Imager (GMI) calibration features and predicted performance. In Proceedings of the 2010 IEEE 11th Specialist Meeting on Microwave Radiometry and Remote Sensing of the Environement, Washington, DC, USA, 1–4 March 2010; pp. 236–240. [Google Scholar] [CrossRef]
  26. Blackwell, W.J.; Barrett, J.W.; Chen, F.W.; Leslie, R.V.; Rosenkranz, P.W.; Schwartz, M.J.; Staelin, D.H. NPOESS Aircraft Sounder Testbed-Microwave (NAST-M): Instrument description and initial flight result. IEEE Trans. Geosci. Remote Sens. 2001, 39, 2444–2453. [Google Scholar] [CrossRef]
Figure 1. A radiometer system which calibrates the measurand (with temperature Tm) observations using n external calibration reference targets (with temperatures T1,…,Tn).
Remotesensing 11 02790 g001
Figure 2. Two-point onboard external calibration configuration. Atmospheric brightness temperature measurements are calibrated using cold space and warm blackbody targets, i.e., implementing a two-point algorithm.
Remotesensing 11 02790 g002
Figure 3. Errors in 250 K atmospheric measurements because of slight drifts in 300 K warm blackbody calibration reference temperatures.
Remotesensing 11 02790 g003
Figure 4. Detectability of the measurement errors shown in Figure 3. Note that the absolute values of detectabilities are below 1, which implies undetectable errors.
Remotesensing 11 02790 g004
Figure 5. Assumed percentage changes in the radiometer gain if the atmospheric brightness temperature measurements were considered error free. Notice that the change values are small enough to be considered as acceptable gain fluctuations in a radiometer system.
Remotesensing 11 02790 g005
Figure 6. A radiometer with three calibration reference targets in the measurement data processing path. Atmospheric measurements are calibrated using cold space and two warm blackbody targets.
Remotesensing 11 02790 g006
Figure 7. Errors in 250 K atmospheric brightness temperature measurements due to slight drifts in 290 K and 300 K blackbody calibration reference temperatures in the measurement data processing path.
Remotesensing 11 02790 g007
Figure 8. Detectability of the measurement errors shown in Figure 7. Note that the absolute detectability values are below 1, which implies undetectable errors.
Remotesensing 11 02790 g008
Figure 9. The radiometer shown in Figure 6 in the calibration validation data processing path. Atmospheric measurements are not considered, and cold space is calibrated using two blackbody targets.
Remotesensing 11 02790 g009
Figure 10. Errors in 2.7 K cold space brightness temperature measurements because of slight drifts in 290 K and 300 K blackbody calibration reference temperatures in the calibration validation data processing path.
Remotesensing 11 02790 g010
Figure 11. Detectability of the measurement errors shown in Figure 10. Note that some absolute value of some detectabilities are larger than 1, which implies detectable errors.
Remotesensing 11 02790 g011
Figure 12. Calibration error analysis (CEA) diagram generated by combining detectability of errors shown in Figure 8 (red) and Figure 11 (blue) in measurement and calibration and validation data processing paths, respectively.
Remotesensing 11 02790 g012
Figure 13. (a) 4 K error detected in the calibration validation data processing path of the radiometer system described in Section 4. The magenta line demonstrates the possible calibration temperature drifts which would cause it. (b) Detectability of the error. (c) The CEA diagram which reveals that the error in the 250 K atmospheric brightness temperature measurements because of the calibration drifts would be less than 0.4 times the standard deviation of the measurements. Yellow lines on the other hand cover the region for which no errors are detected in the calibration validation data processing path. The maximum possible error in the atmospheric brightness temperatures within this region is ~0.9 times the standard deviation of the measurements.
Remotesensing 11 02790 g013
Figure 14. Calibration error analysis (CEA) diagram for the 100 K (cyan), 250 K (red), and 400 K (green) atmospheric brightness temperature measurements. The magenta line again represents a 4 K error detected in the calibration validation data processing path. Yellow lines cover the region for which no errors are detected in the calibration validation data processing path. The maximum possible error in the atmospheric brightness temperatures within this region increases from ~0.5 times to ~1.2 times the standard deviation of the measurements as the atmospheric brightness temperature increase from 100 K to 400 K.
Remotesensing 11 02790 g014
Figure 15. CEA diagrams for a radiometer system calibrating 250 K atmospheric brightness temperature measurements with 2.7 K cold space, 300 K blackbody, and (a) 80 K, (b) 150 K, and (c) 290 K blackbody calibration reference targets. Notice that the temperature of the second blackbody target determines the sensitivity of the error to the temperature drifts in both blackbodies. Also notice the slight change of the maximum possible error in the atmospheric brightness temperatures as a result of undetected drifts in the calibration validation data processing path.
Remotesensing 11 02790 g015
Figure 16. CEA diagrams for the radiometer system described in Section 4 with (a) 1 s and (b) 5 s integration time. Notice that the longer integration times result in detectable errors even for very small calibration temperature drifts. On the other hand, drifts go undetected in the calibration validation data processing path may lead to higher errors in the atmospheric brightness temperature measurements.
Remotesensing 11 02790 g016
Figure 17. Temporal calibration stability can be evaluated through the calibration validation data processing path. MIR data shows that the uncertainty in the measurand estimates highly depend on the measurand and calibration observation times, implying unstable calibration, i.e., non-stationary radiometer gain and offset. Stationary radiometer characteristics and stable calibration would yield to constant uncertainty regardless of the observation times.
Remotesensing 11 02790 g017
Figure 18. CEA diagram for MIR assuming 295.85 K atmospheric brightness temperature (Note that 79.02 K calibration target was considered drift free). Detectability of the error in 79.02 K target measurements was ~2.4 which is shown by the purple line in the CEA diagram. This line indicates possible temperature drifts in 325.59 K and 293.69 K calibration targets. Potential drift amounts are consistent with the values given in [22]. The CEA diagram shows that the errors in the 295.85 K atmospheric brightness temperature measurements are less than three standard deviation of the measurements. It is also depicted that undetected drifts in the calibration validation data processing path may lead to even higher errors in the atmospheric brightness temperature measurements relative to the measurement uncertainty.
Remotesensing 11 02790 g018
Table 1. Symbols used for the radiometer calibration parameters in Equations (1)–(5).
SymbolParameter
n Number of external calibration targets
T m Temperature of the measurand
T m ^ Estimate of the measurand temperature as the result of calibration
T i Temperature of the ith calibration target
T i m Mean temperature of the ith calibration target
v m Post-gain voltage associated with the measurand observation
v i Post-gain voltage associated with the ith calibration target observation
T i n Average temperature of the n calibration targets
T i m n Average of the mean temperatures of the n calibration references
v i n Average of the voltage counts associated with n calibration targets
σ T m ^ Uncertainty associated with the measurand temperature estimate
σ T m Radiometric resolution for the measurand observation
σ T i Radiometric resolution for the ith calibration target
σ T i m Uncertainty associated with the mean temperature of the ith calibration target
T r e c Radiometer receiver temperature
B Radiometer receiver bandwidth
τ Radiometer integration time
g Radiometer gain
o Radiometer offset

