Article

Improvement of Air Pollution in China Inferred from Changes between Satellite-Based and Measured Surface Solar Radiation

1
Guangdong Province Key Laboratory for Climate Change and Natural Disaster Studies, School of Atmospheric Sciences, Sun Yat-Sen University, Zhuhai 519082, China
2
Southern Marine Science and Engineering Guangdong Laboratory (Zhuhai), Zhuhai 519000, China
3
Deutscher Wetterdienst, 63067 Offenbach, Germany
4
Institute for Atmospheric and Climate Science, ETH Zurich, 8092 Zurich, Switzerland
*
Author to whom correspondence should be addressed.
Remote Sens. 2019, 11(24), 2910; https://doi.org/10.3390/rs11242910
Submission received: 15 November 2019 / Revised: 3 December 2019 / Accepted: 3 December 2019 / Published: 5 December 2019
(This article belongs to the Section Atmospheric Remote Sensing)

Abstract

:
The air pollution crisis in China has become a global concern due to its profound effects on the global environment and human health. To significantly improve the air quality, mandatory reductions were imposed on pollution emissions and energy consumption within the framework of the 11th and 12th Five Year Plans of China. This study takes the first step to quantify the implications of recent pollution control efforts for surface solar radiation (SSR), the primary energy source for our planet. The observed bias between satellite-retrieved and surface-observed SSR time series is proposed as a useful indicator for the radiative effects of aerosol changes. This is due to the fact that the effects of temporal variations of aerosols are neglected in satellite retrievals but well captured in surface observations of SSR. The implemented pollution control measures and actions have successfully brought back SSR by an average magnitude of 3.5 W m−2 decade−1 for the whole of China from 2008 onwards. Regionally, effective pollution regulations are indicated in the East Coast regions of South and North China, including the capital Beijing, with the SSR brightening induced by aerosol reduction of 7.5 W m−2 decade−1, 5.2 W m−2 decade−1, and 5.9 W m−2 decade−1, respectively. Seasonally, the SSR recovery in China mainly occurs in the warm seasons of spring and summer, with the magnitudes induced by the aerosol radiative effects of 5.9 W m−2 decade−1 and 4.7 W m−2 decade−1, respectively.

Graphical Abstract

1. Introduction

During the last decades, China has received worldwide attention due to severe air pollution. The air pollutant emissions in China have contributed to a great extent to the global emissions [1,2]. Pollution has no borders. Hence, its impacts can reach far beyond the territory of China and affect global climate and living organisms [3,4]. Almost no regulations were imposed on air pollution in China before the 1980s [5]. The first official document aiming at improving ambient air quality in China was the National Ambient Air Quality Standards, originally formulated in 1982 [6]. Afterwards, in 1987, the basic system for air pollution control was established in the Law on the Prevention and Control of Atmospheric Pollution, which, however, turned out to be ineffective in reducing emissions [7]. Effective polices were implemented in the 11th Five-Year-Plan framework of China (http://www.gov.cn) starting in 2006, which was a milestone since, for the first time, several quantitative targets on energy saving and emission controls became mandatory. Besides the national environmental plans, special actions were conducted to temporarily reduce regional pollution at any cost for grand events such as the 2008 Olympics, the 2010 World Exposition, and the 2014 APEC Conference, etc. [6,7]. The overall effectiveness of recent pollution control policies in China and the impacts on the environment are still under investigation.
A profound environmental implication of air pollution is the modification of the energy flows, which in turn could alter diverse processes in the climate system, including the hydrological and carbon cycles [8]. Aerosols can attenuate solar radiation reaching the Earth’s surface, i.e., surface solar radiation (SSR), by scattering and absorbing radiation (direct radiative effect), or by increasing cloud reflectivity and lifetime (indirect radiative effect) [9,10]. A globally widespread reduction in SSR was observed between the 1950s and 1980s, popularly known as “global dimming” [11]. The largest rate of solar dimming was reported in China [12,13,14]. In line with more effective clean-air regulations in industrialized nations, the global SSR trend started to recover since the late 1980s, the so-called “global brightening” [12,15,16]. Correspondingly, the significant decline in SSR over China slowed down since the 1990s and turned into a slight increase with a rate of 2.1 W m−2 decade−1 [17]. Recent updates noticed an even stronger recovery of SSR over China since the mid-2000s with a rate of 6.1 W m−2 decade−1 [18].
The detection of global dimming and brightening was based on ground observations, which are, however, sparse in space and not evenly distributed [19,20]. Satellite data offer an alternative to estimate the SSR trends since the early 1980s, with a spatial coverage from the regional to the global scales and a high spatio-temporal resolution down to a few kilometers and 15 min [21,22]. Consistent with surface observations, a global-scale increase in SSR since the 1980s has also been detected in satellite retrievals [23,24,25]. Over Europe, satellite and surface SSR trends generally agree during the brightening phase when cloud radiative effects mainly dominate the variations of SSR [19,26,27]. However, large discrepancies have been widely noted over China in various satellite products [28,29,30,31], pointing to a common issue in current satellite retrievals of lacking reliable information on temporal variations of aerosols [32]. Nevertheless, a comparison between surface-observed and satellite-derived SSR trends offers a unique opportunity to disentangle the aerosol effects, especially the direct radiative forcing.
Previous assessments of the stability of satellite-derived SSR trends over China were generally for short-time periods and/or before the mid-2000s, because of the limited temporal coverage of previous satellite-derived SSR products. With an improved spatial resolution of 0.25° × 0.25°, the CM SAF cLoud, Albedo and surface RAdiation dataset from AVHRR data—Edition 2 (CLARA-A2) enables the estimation of SSR trends over the globe till 2015 [33]. This research, therefore, aims to: (1) estimate up-to-date satellite-derived CLARA-A2 SSR trends over China at different spatial and temporal scales, (2) assess the response of SSR to the enhanced air pollution control in China.

2. Materials and Methods

2.1. Data

Monthly SSR data were collected from 59 stations across China (Figure 1) for the period 1993–2015, as determined by the availability and homogeneity of both CLARA-A2 and surface reference SSR datasets. Satellite-based SSR data were extracted for the grid point closest to the location of the stations. Comprehensive information on potential driving factors of SSR was derived for Beijing, the capital of China. Details of the datasets are provided in the following subsections.

2.1.1. The CLARA-A2 SSR Dataset

Derived from the advanced very high resolution radiometer (AVHRR) sensors onboard the polar-orbiting NOAA and METOP satellites, CLARA-A2 provides global information on SSR in terms of daily and monthly means with a spatial resolution of 0.25° × 0.25° for 1982–2015 (http://www.cmsaf.eu/). The measurement periods and orbits for all satellites covered by CLARA-A2 are illustrated in Figure 1 of Karlsson et al. [33]. Only one satellite in orbit was providing measurements during the time period 1982–1991, which was excluded from this study to limit the impact of missing data in the analysis. The retrieval of CLARA-A2 SSR was based on a look-up-table approach that relates, in cloudy situations, the reflected fluxes at the top of the atmosphere to the surface fluxes. For clear-sky situations, the mesoscale atmospheric global irradiance code (MAGIC, http://gnu-magic.sourceforge.net/) was used to derive the clear-sky surface irradiance. In both cases, a monthly aerosol climatology from a slightly modified-version of GADS/OPAC database [34] was used as auxiliary data, due to the lack of high-quality aerosol information for the full data-generation period covered by CLARA-A2 [19]. Detailed information on the retrieval scheme and homogenization can be found in the product user manual, validation report and the algorithm theoretical baseline document for the CLARA-A2 surface radiation products at http://www.cmsaf.eu/.

2.1.2. The CMA SSR Dataset

The surface reference SSR data were obtained from the China Meteorological Data Service Center (CMDC, http://data.cma.cn) governed by the China Meteorological Administration (CMA). The measurements started in 1957 but underwent a nationwide reorganization in both instruments and stations during 1990–1993 [18,30]. To avoid inhomogeneity, only the period after 1993 using consistent instruments of the Chinese-developed thermopile pyranometers with an uncertainty of 3.4% (~5 W m−2) [35] was analyzed. The instruments were calibrated against the national reference standards of China every other year, and then against the references at the World Radiation Center (WRC) every five years [30]. Basic data quality controls (i.e., checks on the climatic range, spatial consistency, and time continuity) were applied by the CMA [18]. Efforts were made to further homogenize the datasets by picking out long-term records, and applying the physical threshold test [36,37] as well as the standard normal homogeneity test (SNHT, [38]). For details about the homogenization process, please refer to our previous study [39]. In the end, 59 stations across China were selected, as shown in Figure 1.

2.1.3. Cloud and Aerosol-related Information

Annual aerosol optical depth (AOD) data at 550 nm over China from the reanalysis product of the Modern Era Retrospective-Analysis for Research and Applications (MERRA-2) and the combined satellite products of the along-track scanning radiometers (ATSR: ATSR-2 and AATSR combined) and the moderate resolution imaging spectroradiometer on Terra (MODIS/Terra) were digitized from Figure 5 of Qin et al. [40] for 1993–2017 and Figure 9 of Sogacheva et al. [41] for 1995–2017, respectively. The MERRA-2 product, with a spatial resolution of 0.50° × 0.625° for 1980–2017, was provided by the Global Modelling and Assimilation Office (GMAO) at NASA (https://gmao.gsfc.nasa.gov/reanalysis/MERRA-2/). The combined satellite AOD dataset by Sogacheva et al. [41] was retrieved on a grid of 1° × 1° from ATSR (1995–2011, http://www.icare.univ-lille1.fr/) and MODIS (2000–2017, https://ladsweb.modaps.eosdis.nasa.gov/). Beijing is the only station in China with long-term (>10 years) ground-based aerosol optical depth (AOD) data available from the AERONET since 2001 (https://aeronet.gsfc.nasa.gov/). Monthly AERONET AOD data at 500 nm were derived for the Beijing site for 2001–2015. AOD represents the wavelength-dependent aerosol extinction in the atmospheric column, including the influences from relative humidity, vertical structure, and height of the atmospheric mixing layer [42,43]. Mainly representing the effect of aerosols near the surface, the data of air pollution index (API), a non-dimensional number calculated from 24-h ground-measured mass concentrations of three fundamental air pollutants SO2, NO2, and PM10, were also collected at the Beijing site for 2001–2012 from the Datacenter of the Ministry of Ecology and Environment of China (http://datacenter.mep.gov.cn/). Considering the limitation of both AOD and API data due to the availability only since the 2000s, an alternative index, namely the diffuse fraction (%, the ratio of diffuse to total radiation), was calculated for the whole examined period based on data collected from the CMA. In addition, total cloud cover (TCC) data were collected from the CMA, to assist the identification of the main drivers, i.e., clouds and aerosols, the two most likely candidates for explaining global dimming and brightening [8]. TCC was visually estimated by experienced observers based on the standards of the World Meteorological Organization (WMO).

2.2. Methods

2.2.1. Calculation of SSR Trends

The SSR trend calculations conducted in this study were based on monthly anomalies with reference to the 1993–2015 means, in order to exclude the effect of the annual SSR cycle. A linear regression analysis was performed to determine the trend slope and its 95% confidence upper and lower limits. The confidence limits may tell whether the examined trend is statistically significantly positive/negative, or whether the compared trends derived from surface and satellite datasets are statistically different [19]. The Mann–Kendall–Sneyers method [44] and moving average filters were used to smooth the trends of the SSR anomalies and identify possible turning-points. The running-trend analysis [45], or Trendraster-plot, was applied to double-check possible transitions in the trends by representing all trends for different subperiods in a n×n raster-plot, with the y-axis, x-axis and the color of each pixel denoting the starting year, the ending year and the linear trend slope for the considered period, respectively.
Besides the annual trend averaged over the whole of China, trends were also analyzed at seasonal and regional scales, to provide new insights into the satellite-derived variability in SSR. The seasons are defined as spring (MAM, March to May), summer (JJA, June to August), autumn (SON, September to November) and winter (DJF, December to February). Regionally, we divided China into four geographical regions, namely North China (NC), South China (SC), Northwest China (NW), and Southwest China (SW), based on regional climate and topographic features (Figure 1).

2.2.2. Investigation of Aerosol Effects

Using a temporally-constant aerosol climatology, the anomalies and the temporal variability of the satellite-derived SSR were mainly driven by the corresponding satellite-derived cloud coverage data. Assuming that the consideration of cloud effects in the satellite-derived SSR data is realistic, information about remaining effects on SSR (e.g., from temporal variations of aerosols) can be derived by assessing the time series of the differences between satellite- and surface-based SSR anomalies. To justify this assumption, in the first step, the trends in AOD and SSR biases were compared over China. The comparisons of this “SSR bias series” at seasonal and regional scales may also give an indication of the significance of the aerosol effects. This is based on the fact that aerosol distributions have typical seasonal and regional patterns over China. At seasonal scale, surface aerosol mass concentrations are on average the highest in winter, followed by spring, autumn and summer [46]. An almost opposite seasonal cycle is shown for column-integrated AOD, due to seasonal variations in the atmospheric mixing layer height and relative humidity that result in aerosol hygroscopic growth, based on AERONET data in Beijing [47,48]. With respect to the four regions considered here, anthropogenic aerosols mainly influence the densely populated areas of eastern China, i.e., NC and SC, where heavy and light industries dominate the economy, respectively. In the NW region, the frequent occurrence of dust storms poses a challenge to accurately retrieve SSR based on satellite and station data. In the SW region, the high elevation and perennial snow-covered surface might degrade the quality of satellite SSR data. Therefore, examining the seasonal and regional performances of satellite products can help to identify the main reasons behind the remaining differences between surface and satellite observations in China.
To further clarify the effect of aerosols indicated in the SSR bias series, a case study was applied for the station of Beijing with the most comprehensive availability of data sources. The climatologies of AOD and cloud fractional cover (CFC) used in CLARA-A2 were compared with those derived from surface-observed AERONET AOD and CMA TCC, respectively. This allows to check the representation of cloud and aerosol effects in SSR retrievals by the CLARA-A2 product. Then, annual and seasonal trends of SSR (from CMA, CLARA-A2, and their bias), cloud (TCC, CFC, and their bias) and aerosol (AOD, API and diffuse fraction) were compared to examine the responses of SSR to changes in climate and air quality. Correlations between the deseasonalized SSR bias series and changes in TCC, AOD, and API were calculated at both annual and seasonal scales.

3. Results and Discussion

The overall accuracy of the CLARA-A2 SSR data records for China is documented in Wang et al. [39]. We showed that the CLARA-A2 data overestimate the surface irradiance over China on average by 10.0 W m−2. The biases have been found to be significantly different between urban and rural regions, with the latter showing lower biases. The correlation of the deseasonalized surface irradiance (i.e., the anomalies) with the surface data is almost 0.8, sufficiently high to assess the quality of the temporal trends of CLARA-A2 SSR data records during 1993–2015.

3.1. Transition in the Annual SSR Bias Series since 2008

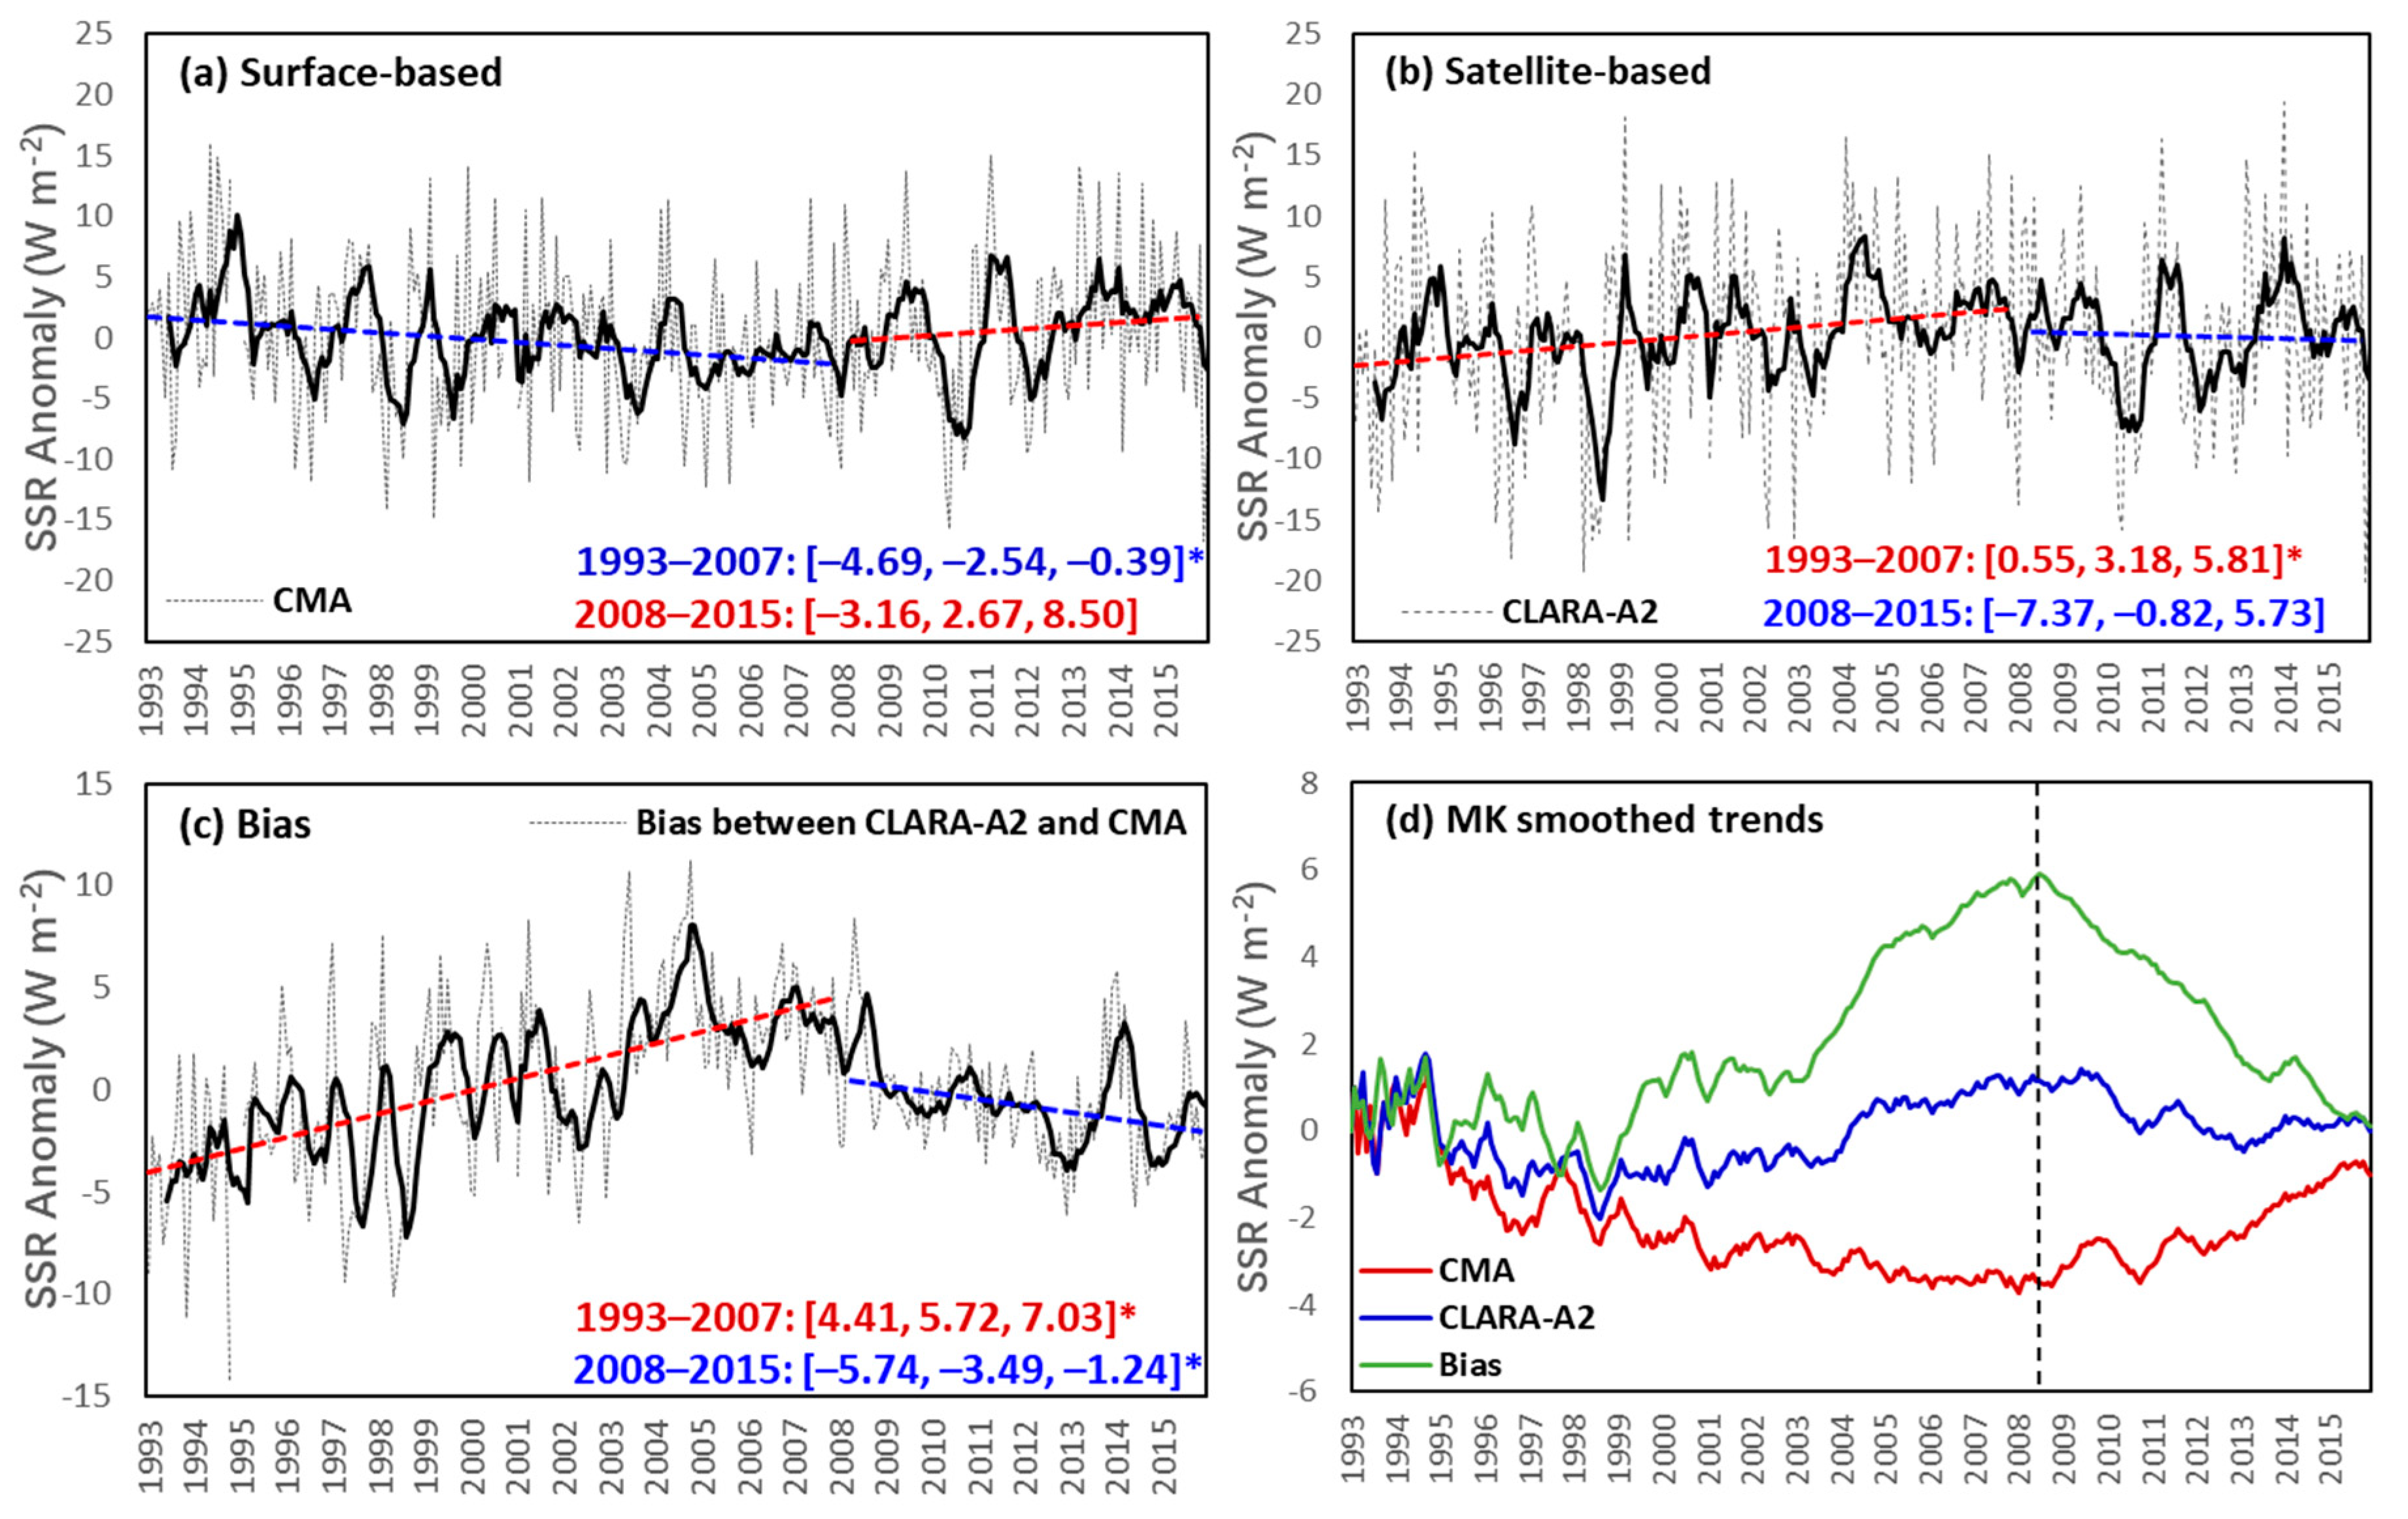
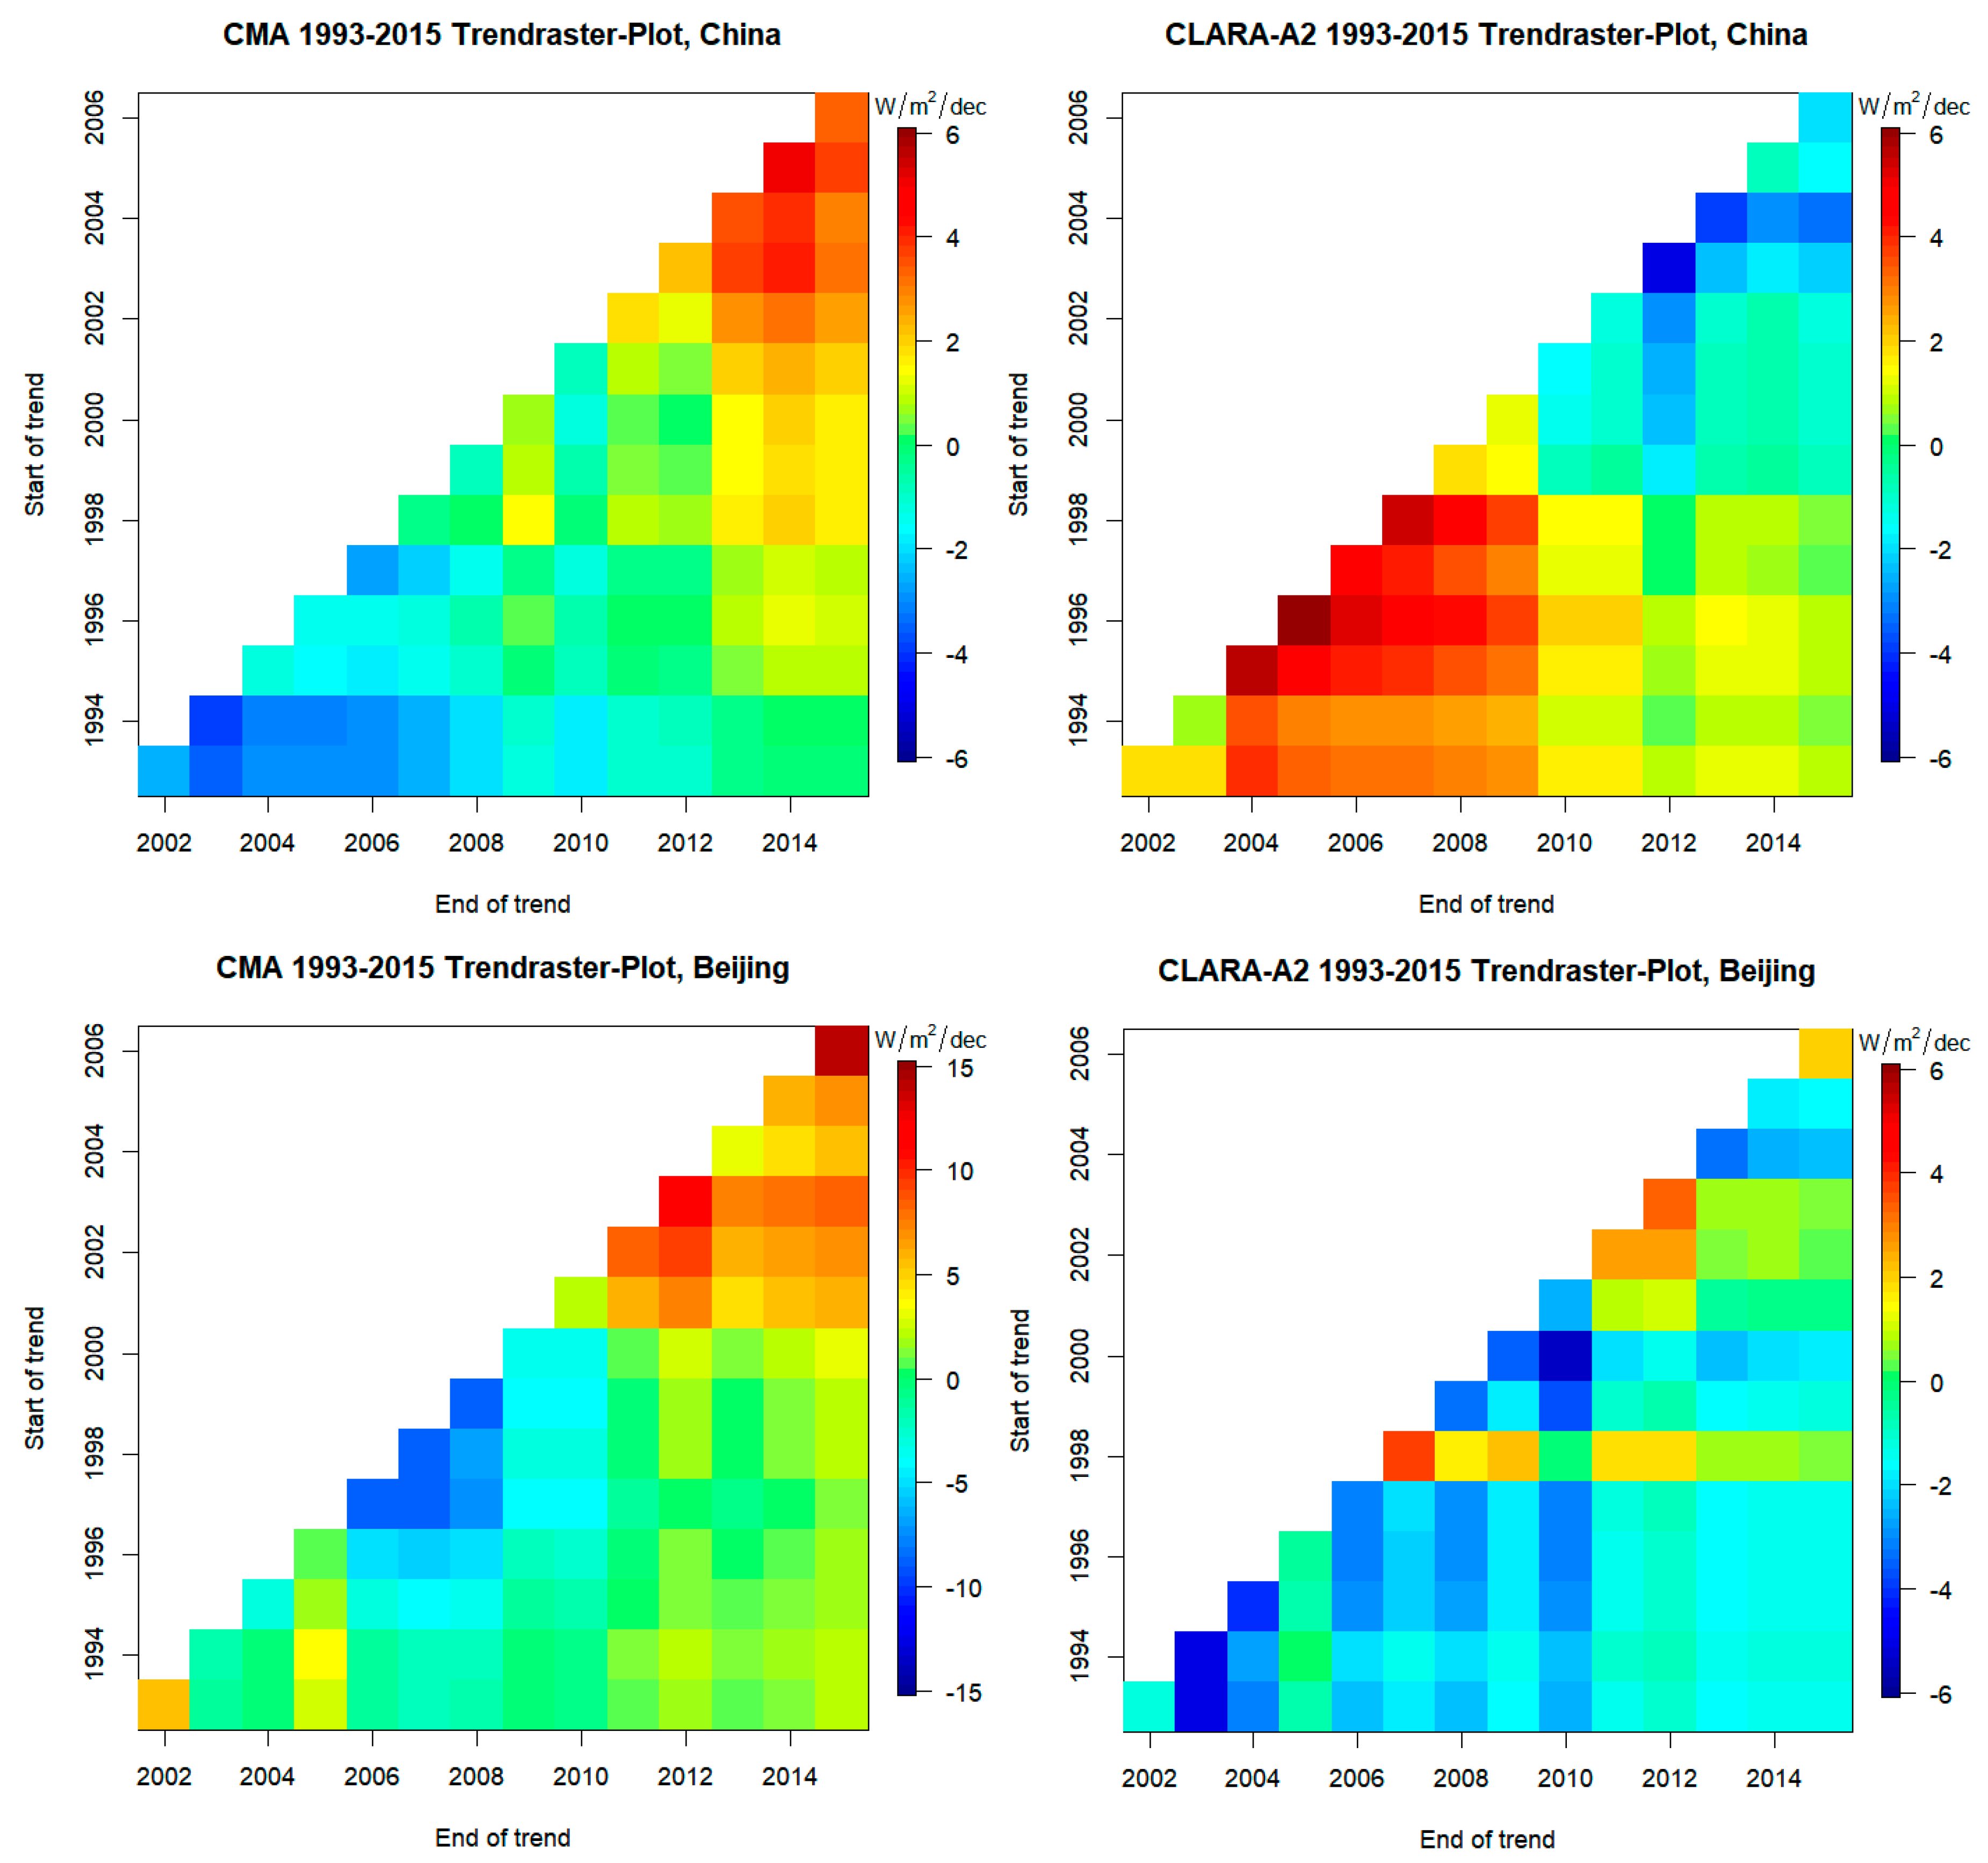
The surface-based CMA SSR trend averaged over the 59 stations across China for 1993–2015 is presented in Figure 2a. The variations of surface-based SSR undergo a transition from decrease to increase since the mid-2000s, consistent with the analysis of Yang et al. [18] based on an SSR dataset homogenized with reference to sunshine duration. Such a transition is also indicated in the Trendraster-plot shown in Figure 3. The red, blue, and yellow/green colors of the pixels represent SSR trends of brightening, dimming, and leveling off, respectively, for the subperiods with the starting year shown on the y-axis and ending year shown on the x-axis. Dimming trends up to −4 W m−2 decade−1 can generally be noted in the early periods (shown in the lower-left pixels of the Trendraster-plot), which then transitioned into brightening trends of up to 5 W m−2 decade−1 since the mid-2000s (shown in the upper-right pixels of the Trendraster-plot). When smoothing the CMA SSR anomalies by the forward sequence of the Mann–Kendall–Sneyers test as shown in Figure 2d, the transition occurs in 2008 from a significant (p > 0.05) decrease of –2.5 W m−2 decade−1 to an increase of 2.7 W m−2 decade−1.
Interestingly, the trend of satellite-based CLARA-A2 SSR shows an almost opposite transition from a significant increase of 3.2 W m−2 decade−1 for 1993–2007 to a slight decrease/leveling-off of −0.8 W m−2 decade−1 for 2008–2015 (Figure 2b). The analysis of short-term periods illustrated in the Trendraster-plot of Figure 3 also shows that positive trends up to 6 W m−2 decade−1 are prevalent in the early years, while negative trends down to –5 W m−2 decade−1 are mainly shown for the latter period. These analyses indicate that the decadal trends in surface-observed SSR, i.e., dimming and brightening, cannot accurately be reproduced by the satellite retrievals over China. Similar conclusions have been drawn for China based on the satellite products of the Global Energy and Water Cycle Experiment—Surface Radiation Budget (GEWEX-SRB) [29,30,31], the International Satellite Cloud Climatology Project—Flux Data (ISCCP-FD) [31], the University of Maryland—Shortwave Radiation Budget (UMD-SRB) [28,31], and the Goddard Institute for Space Studies (GISS) [28]. Through including the interannual variability of aerosol properties, a better agreement with surface-observed SSR trends over China was reported to be achieved by the product of the Clouds and Earth’s Radiant Energy System—Energy Balanced And Filled (CERES-EBAF), which has, however so far, only been analyzed between 2001 and 2010 [30,31].
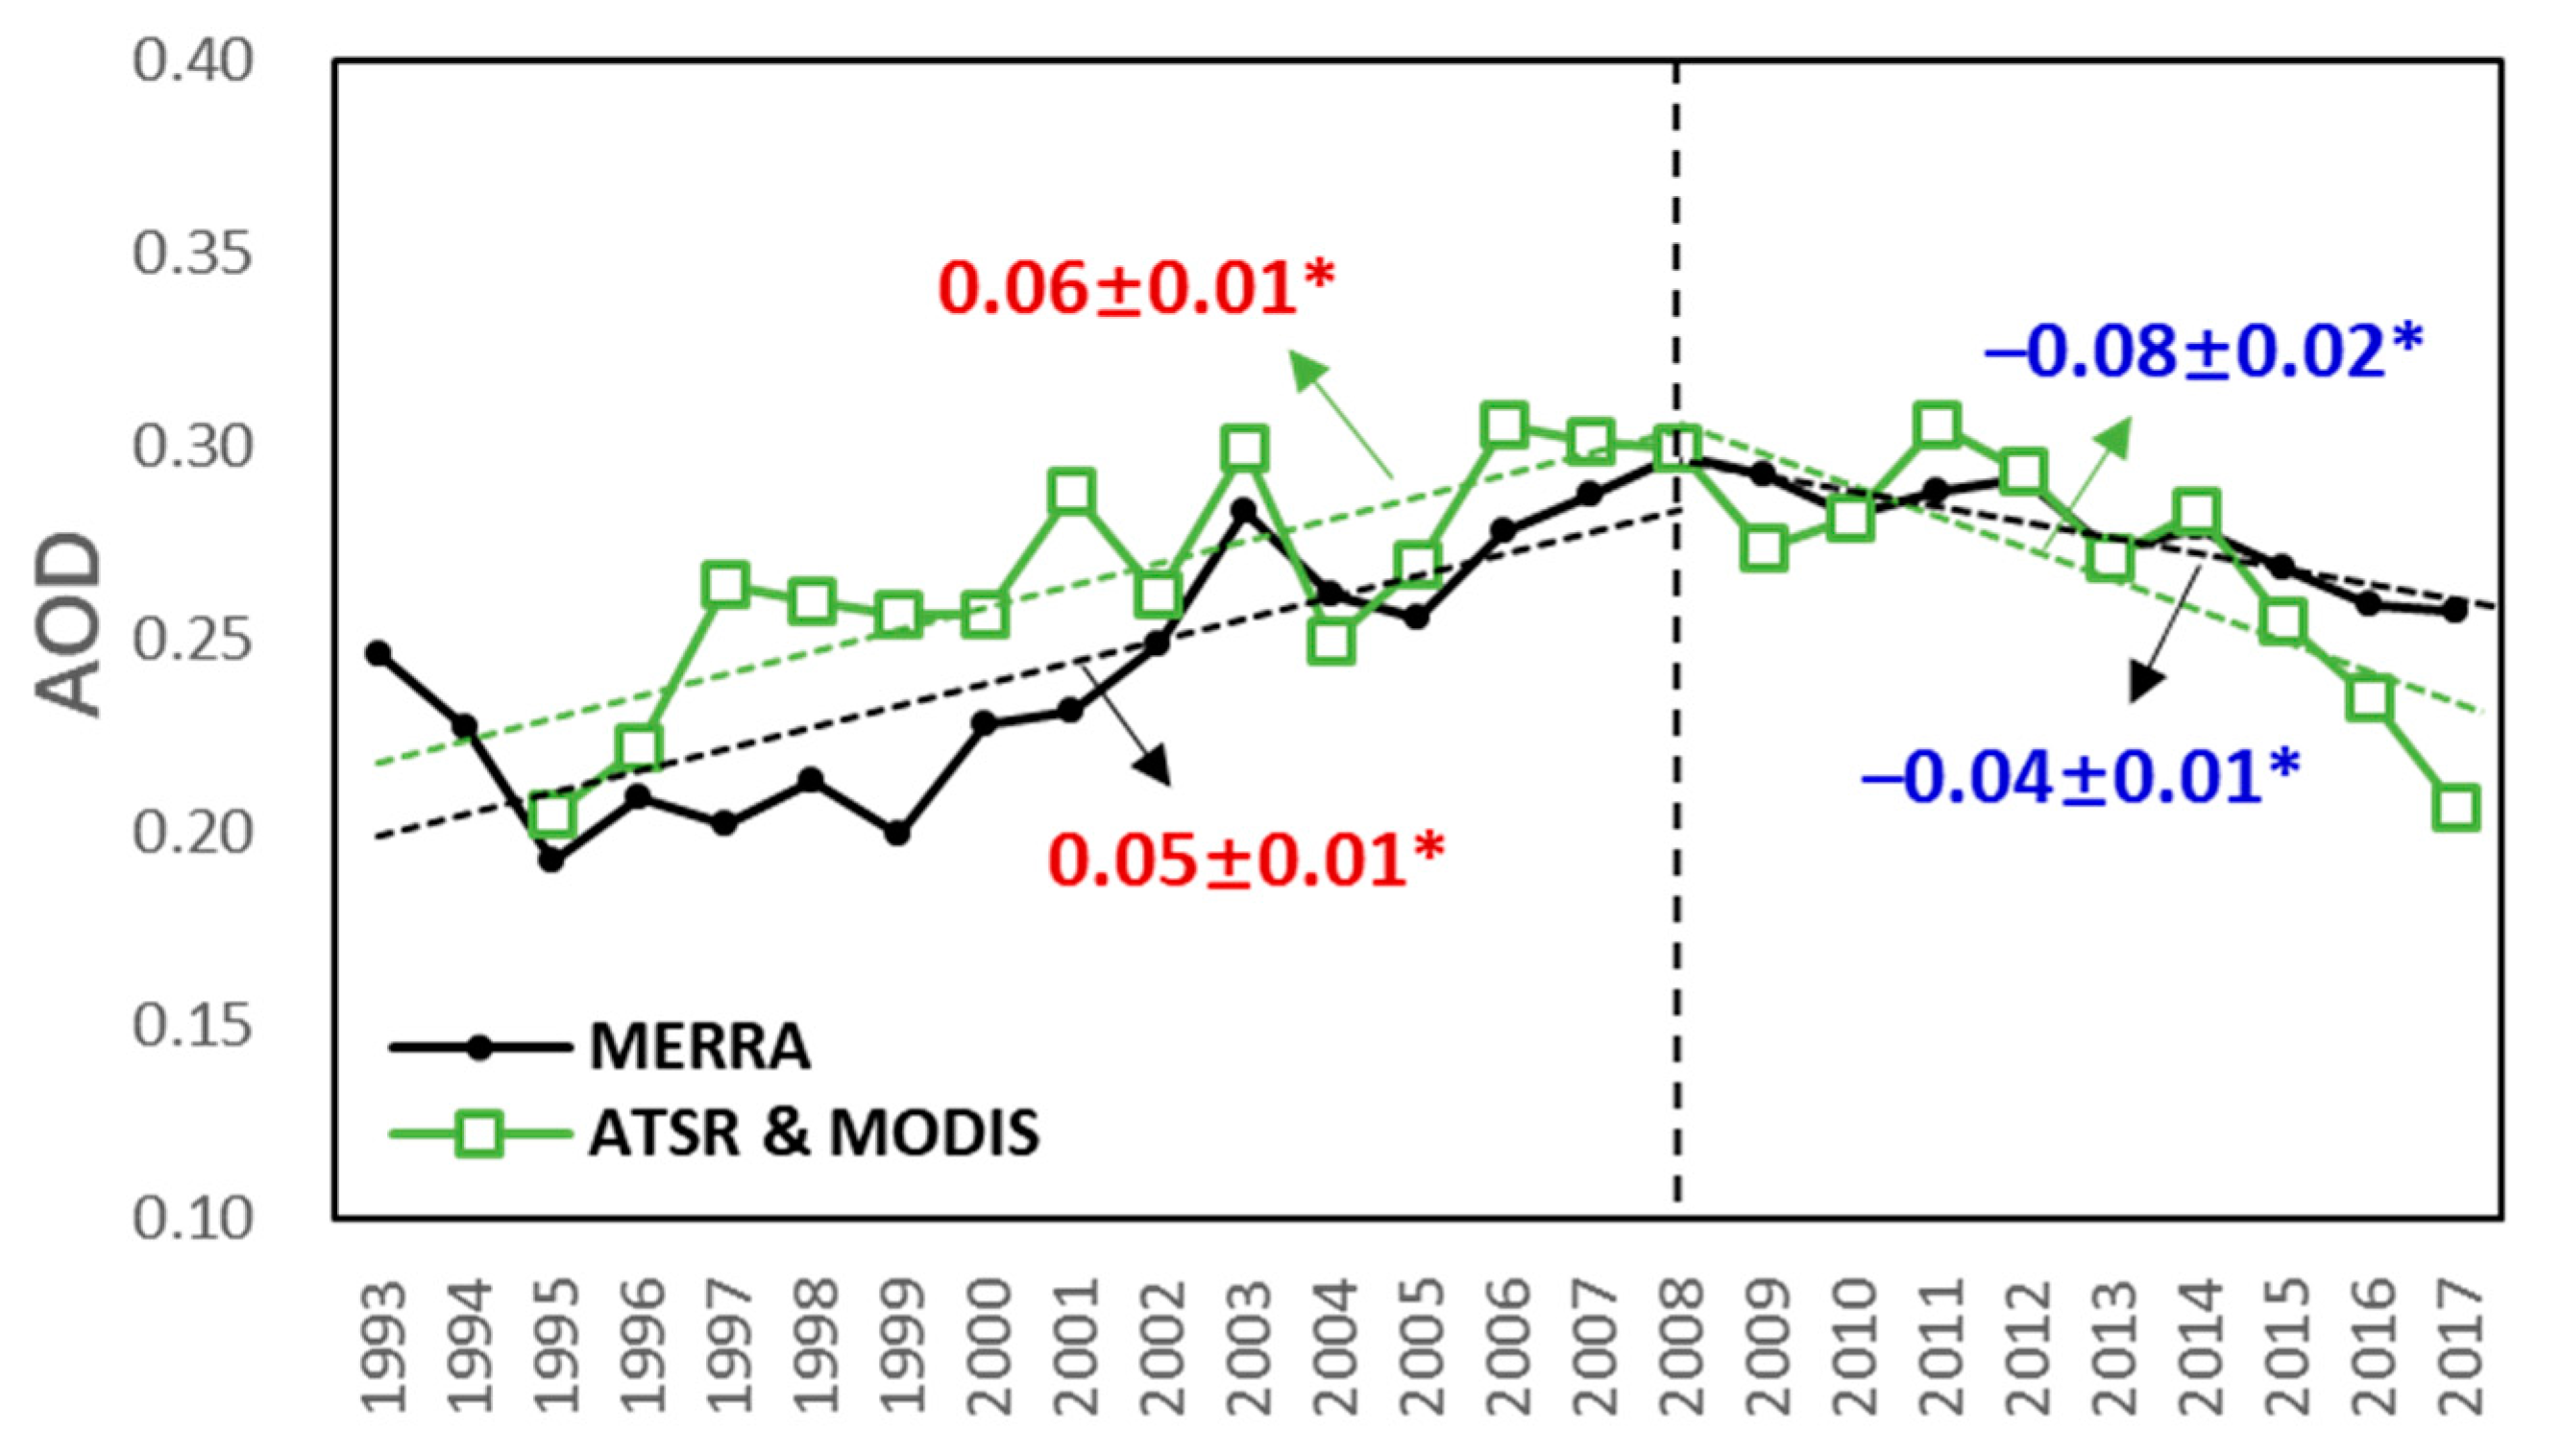
Consequently, the biases between the CLARA-A2 SSR estimates and surface CMA observations show significant trends with an increase of 5.7 W m−2 decade−1 and afterwards, a decrease of −3.5 W m−2 decade−1 for the pre- and post-2008 periods, respectively (Figure 2c). Based on the methods of accumulated deviation curve and the Mann–Whitney U test [17], the change point in the year of 2008 is statistically significant. The transition in the SSR bias series is generally consistent with the gradual reduction in the emissions of SO2 and total suspended particulates over China since around 2006 [7,49,50]. This is within the 11th (2006–2010) and 12th (2011–2015) Five-Year-Plan framework to quantitatively reduce pollutant emissions and energy consumptions [1,7,51]. It is well known that the dominant contributing source of SO2 pollutant emissions in China is coal-dominated fossil fuel burning. To achieve the quantitative target on reducing total SO2 emissions by 10% and 8% during the 11th and 12th Five-Year-Plan periods, respectively, a series of measures were adopted including the application of desulfurization facilities in the coal-fired power sector and other major industrial sectors, the implementation of emission control policies for key industrial pollution sources, restrictions on the establishment and extension of energy-intensive industries, and improvements in the quality and efficiency of gasoline, etc. Besides, to enhance PM pollution control, efforts were made to control construction and road dust, restrict vehicle use and pollutant emissions, etc. Moreover, control of NOx emissions of vehicles and the implementation of denitration facilities in key industrial sectors were added in the 12th Five-Year-Plan since 2011. Accordingly, the AOD trend over China declined since a pivot point ~2006–2011, according to various data sources such as reanalysis data (e.g., MERRA) and satellite data (e.g., MODIS, MISR, ATSR) [40,41,49,52,53,54], despite the differences in sampling and calibration. This is manifested in Figure 4, which illustrates that both reanalysis and satellite AOD trends over China show an increase on the order of 0.05~0.06 decade−1 since the 1990s, which then transitioned into a decrease by –0.04~0.08 decade−1 from 2008 onwards. As indicated in the scatter plots of Figure 5 from Sogacheva et al. [41], the satellite-derived AOD combined from ASTR and MODIS shows a good agreement with surface-measured AOD from AERONET, with a correlation coefficient, standard deviation, and root mean square error of 0.54, 0.02 and 0.19, respectively, at annual scale. The good agreement between satellite-derived and surface-measured AOD is also shown in all seasons especially summer. A comparison of Figure 2c with 4 suggests that the decadal changes in the SSR bias series and AOD time series are in good correspondence. As a consequence, it is likely that the transition in the SSR bias series is related to the reversal in the aerosol trend over China. The decreasing aerosol trend may have induced the recent brightening trend in SSR, which is however not reproduced by satellite retrievals using aerosol climatology. Similarly, a transition from leveling off to a sharp increase in the trend of satellite- minus surface-based SSR biases has been noted in the year 2009 for India, with a possible reason being the changes in aerosol loading or properties over India unresolved by an aerosol climatology used in the satellite retrievals [55].

3.2. Analysis on Seasonal and Regional Scales

Uncertainties, however, still exist with respect to the causes of the disagreement in the SSR trends between satellite retrievals and surface observations. An analysis of the bias series was then performed at seasonal and regional scales. The hypothesis is that, if the bias was a systematic artifact in the satellite product, no seasonal/regional differences would be found [26].
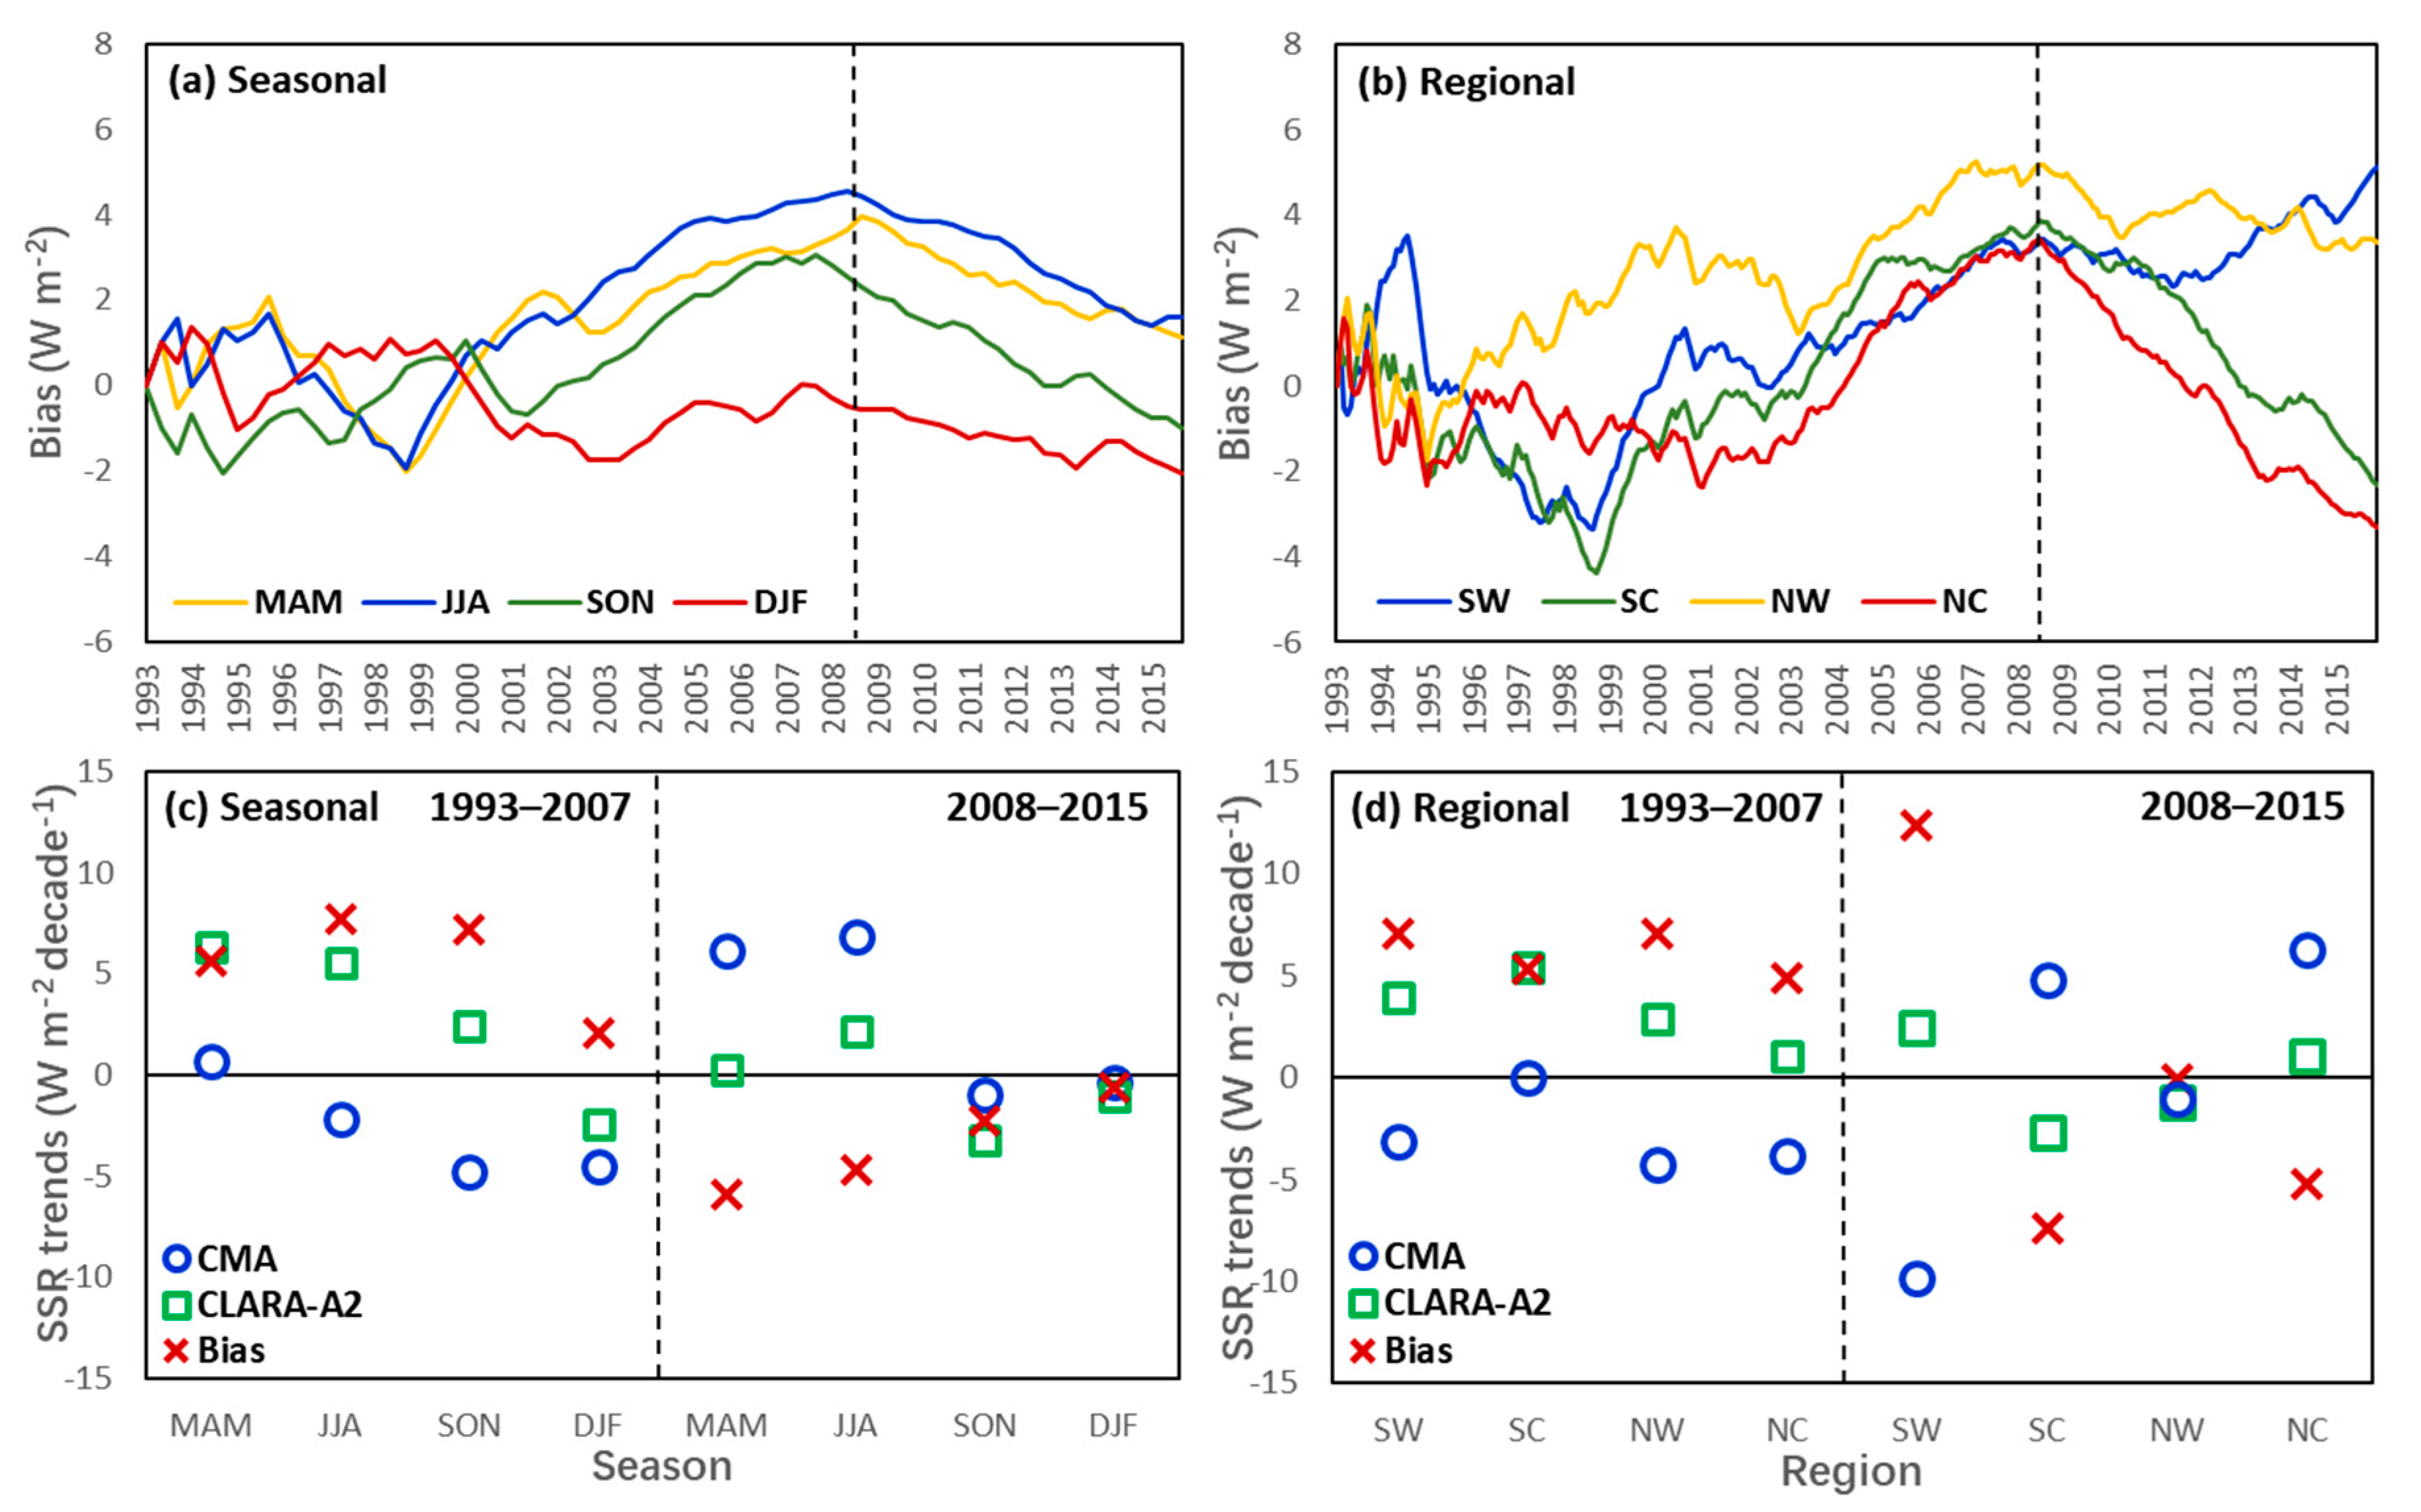
Figure 5a shows the smoothed bias series of satellite- minus surface-based SSR for the four seasons. A transition around 2008 can be detected during all seasons except winter. The satellite product is capable of reproducing surface-observed SSR tends in winter, with slight differences in the trends of only 1.2 W m−2 decade−1 and −0.7 W m−2 decade−1 for the pre- and post-2008 periods, respectively (Figure 5c). This indicates that there was no significant change in aerosol trends during winter. The absence of obvious pollution trends in winter is confirmed in the combined MODIS and MISR data, which showed a decline in the AOD trend since around 2008 in all seasons except winter over the most populated east coast of China [52]. The air pollution control efforts seem to be largely counteracted by the soaring energy demand and fossil fuel burning for winter heating with the growth of population and the improvement of living standards [56]. This situation can be worsened by the existence of frequent temperature inversions in winter, which act as a lid and prevent the dispersion of air pollutants [47,52]. Therefore, wintertime PM2.5 pollution episodes are still being reported in China even after the implementation of the 11th Five-Year-Plan [57]. The detected transition in the trend of the SSR bias series since 2008 is mainly evident in the warm seasons of spring and summer, due to a recovery in surface-observed SSR but a leveling off in satellite retrievals (Figure 5c). The spring season in China is characterized by frequent dust storm events, which are largely attributed to human-induced desertification, e.g., overgrazing and land reclamation for agriculture [58]. The observed brightening trend in spring might then be an effect from the decreased intensity of dust storms and reduced soil erosion, which might be related to the mitigation strategies (e.g., returning grazing and farmland to forestland and grassland) defined in the 11th Five-Year-Plan. During the humid summer season, declining hygroscopic sulfate aerosols might have played a role in the brightening SSR trend, due to the effective SO2 emission regulations during the 11th and 12th Five-Year-Plan periods [7]. In autumn, the transition in the SSR trend is more evident in the satellite-based CLARA-A2 product with an increase of 2.4 W m−2 decade−1 for 1993–2007 and afterwards, a decrease of −3.2 W m−2 decade−1 for 2008–2015 (Figure 5c). This might be explained by the variations in the cloud optical depth over China, which showed an increasing trend in autumn from the mid-2000s onwards [59]. Such an increase in the cloud optical depth might have also partially compensated the brightening trend in surface-observed SSR driven by decreased aerosols in autumn (Figure 5c). Overall, the detected transition in the bias series since 2008 applies mainly for the warm seasons of spring and summer with a recent recovery in surface-based SSR, rather than the cold seasons of autumn and winter with a continued dimming.
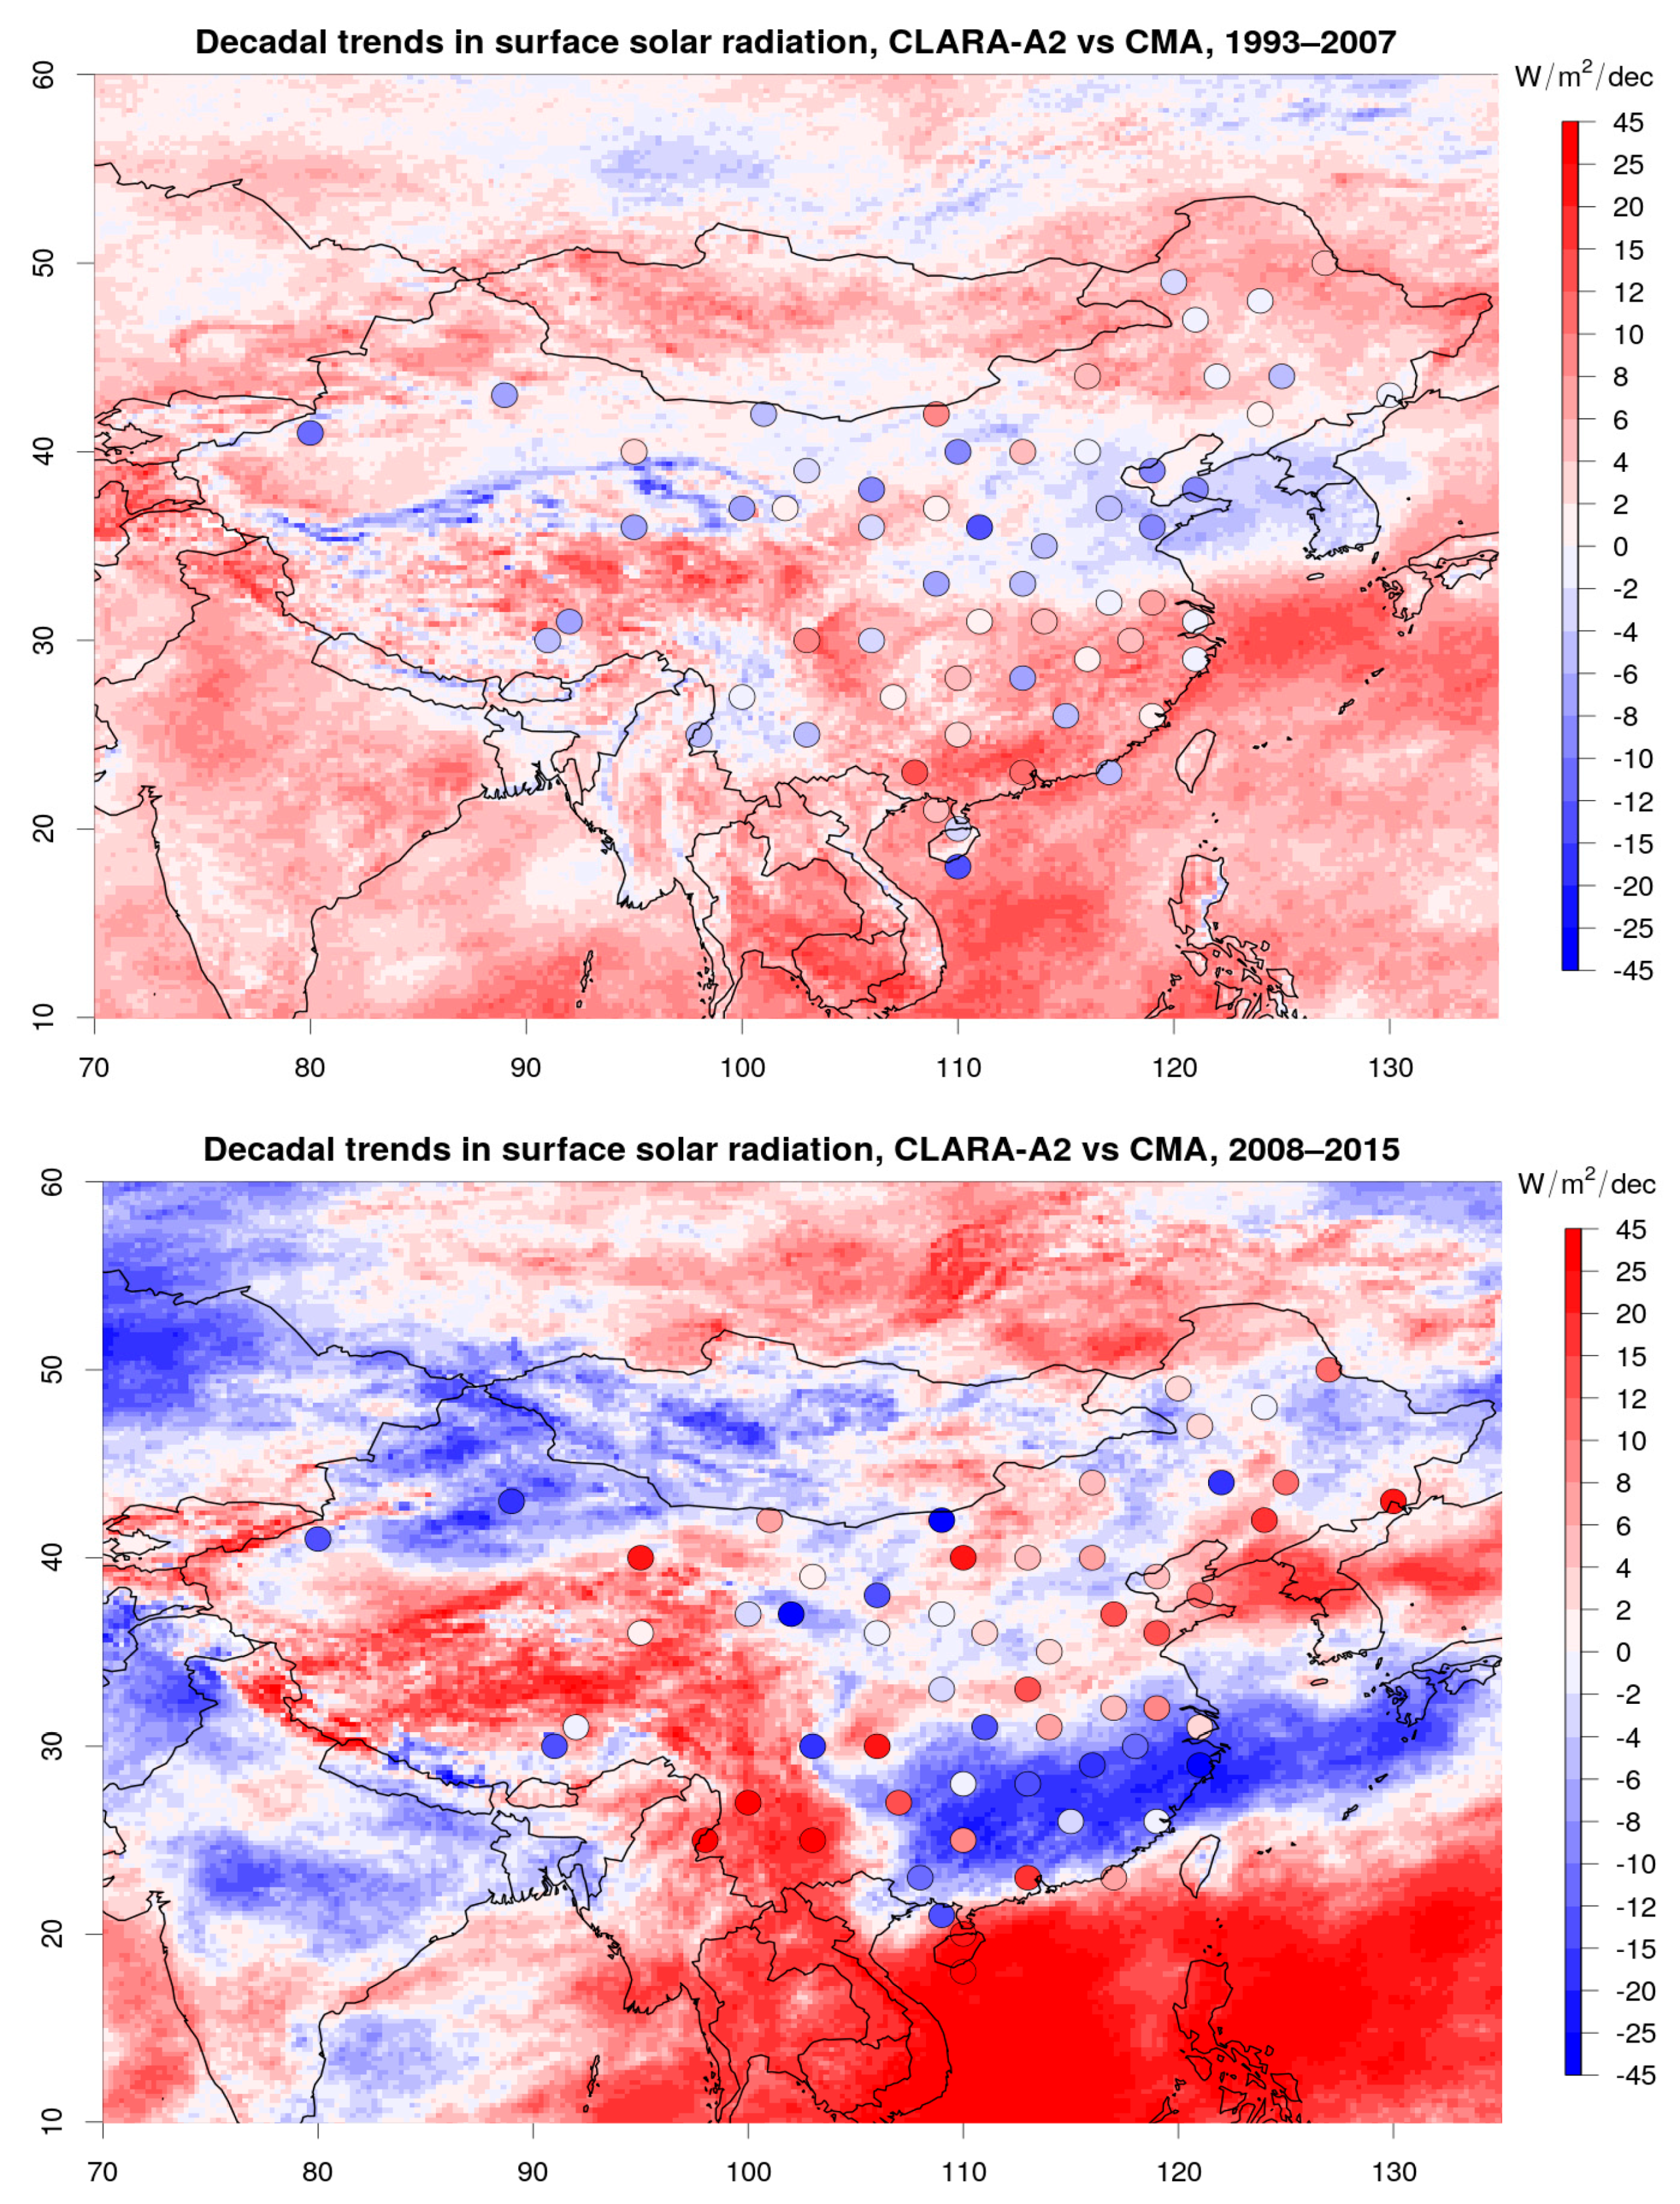
Similarly, on a regional basis, the transition in the bias series since 2008 mainly occurs in the eastern part of China (i.e., SC and NC) with a brightening trend in surface-observed SSR, rather than in the western part of China (i.e., SW and NW) with a continued dimming (Figure 5b,d). During 1993–2007, an overestimation of surface-based SSR trends by the satellite product can be observed in all regions (Figure 5d). For SSR observed at the CMA sites, dimming trends are prevalent, covering 65% of the 59 examined stations, with exceptions mainly shown in SC (Figure 6). Shown as the background layer in Figure 6, the satellite-retrieved SSR trends, however, increase over the majority of China, with exceptions appearing mostly in NC and the desert region of NW. SC is the region with the most significant satellite-derived brightening trend over 1993–2007 by an average rate of 5.4 W m−2 decade−1, which, however, turns into a strong dimming of −2.7 W m−2 decade−1 during 2008–2015. This might be related to the strong El Niño event in 2015, the last year for the trend calculations, which brought about abnormal southerlies and substantially increased precipitation leading to decreased SSR in SC [60]. Both satellite and reanalysis AOD data over SC decrease from ~2008 onwards, in line with the reduction in pollutant emissions of SO2, NOx and soot (dust) and the special clean air actions for international events, e.g., the Shanghai 2010 World EXPO and the Guangzhou 2010 Asian Games [54,61,62]. Accordingly, SSR, as observed at the CMA sites, shows an average increasing trend of 4.8 W m−2 decade−1 during 2008–2015, resulting in an obvious transition in the SSR bias series over the SC region (Figure 5b). An even stronger SSR recovery at an average rate of 6.3 W m−2 decade−1 occurs in NC, with 75% of the CMA stations over NC showing an increasing trend (Figure 6). Because of domestic heating and heavy industrial development, NC is the main region for coal-dominated fossil fuel consumption in China. Reacting to the “Coal-fired power plants SO2 emission control” issued in the 11th Five-Year-Plan, as well as special clean air actions for the 2008 Olympic Games, the 2014 APEC Conference, and the 2015 Military Parade held in Beijing, a reversal to decrease in the AOD trends derived from various satellite products has been widely reported over the NC region since ~2008 [41,52,63]. In line with the national goal of reducing NOx by 10% during the 12th Five-Year-Plan period, a transition to decrease in satellite-based tropospheric NO2 observations since 2011 has also been detected especially over NC [64,65]. Neglecting the temporal variations of aerosols, the satellite-derived SSR trend over NC generally levels off at ~1 W m−2 decade−1 for both sub-periods, resulting in a transition from increase to decrease in the satellite- minus surface-based SSR bias series (Figure 5d). Such transition is hard to be perceived over the SW and NW regions (Figure 5b), where a generally leveling off trend has been noted in the combined ATSR and MODIS AOD data for 1995–2017 [66]. Remaining differences in the surface- and satellite-based SSR trends might be related to the high elevation and snow-covered surfaces in the Tibet region of SW and the varying surface albedo in the desert regions of NW, which add difficulties to accurately retrieve SSR by satellite products.
To sum up, the seasonal and regional differences indicate that the transition in the SSR bias series is probably not due to a systematic artifact in measurements or calibrations applied to the SSR products, but mainly driven by a change in the aerosol trends over the most populated East Coast of China during the warm seasons. SSR has been brought back to these regions and seasons in response to the strengthened pollution control efforts during the recent decade.

3.3. A Case Study of Beijing

In this section, the effectiveness of air pollution control efforts and the environmental implications for solar radiation are further tested in Beijing station, which possesses the longest continuous surface-based AERONET AOD data records over China. In Beijing, China’s capital where on-going air pollution episodes are drawing considerable attention, air pollution control is a top priority in environmental management [7]. One typical example was the remarkably effective improvement of Beijing’s air quality during the 2008 Olympic Games, attributed to the “Green Olympics” concept raised by the Beijing Organizing Committee for the Games and the corresponding stringent control actions before and during the Games [67]. The effect of temporal clear air actions, however, could not last long. Together with a sharp growth in the vehicle fleet, a severe PM2.5 crisis struck Beijing in 2013 [6]. Since then, the Chinese government issued the National Action Plan and Beijing’s government accordingly formulated the Clean Air Action Plan and the Air Pollution Prevention and Control regulations, to strengthen the prevention of pollution [6,7].
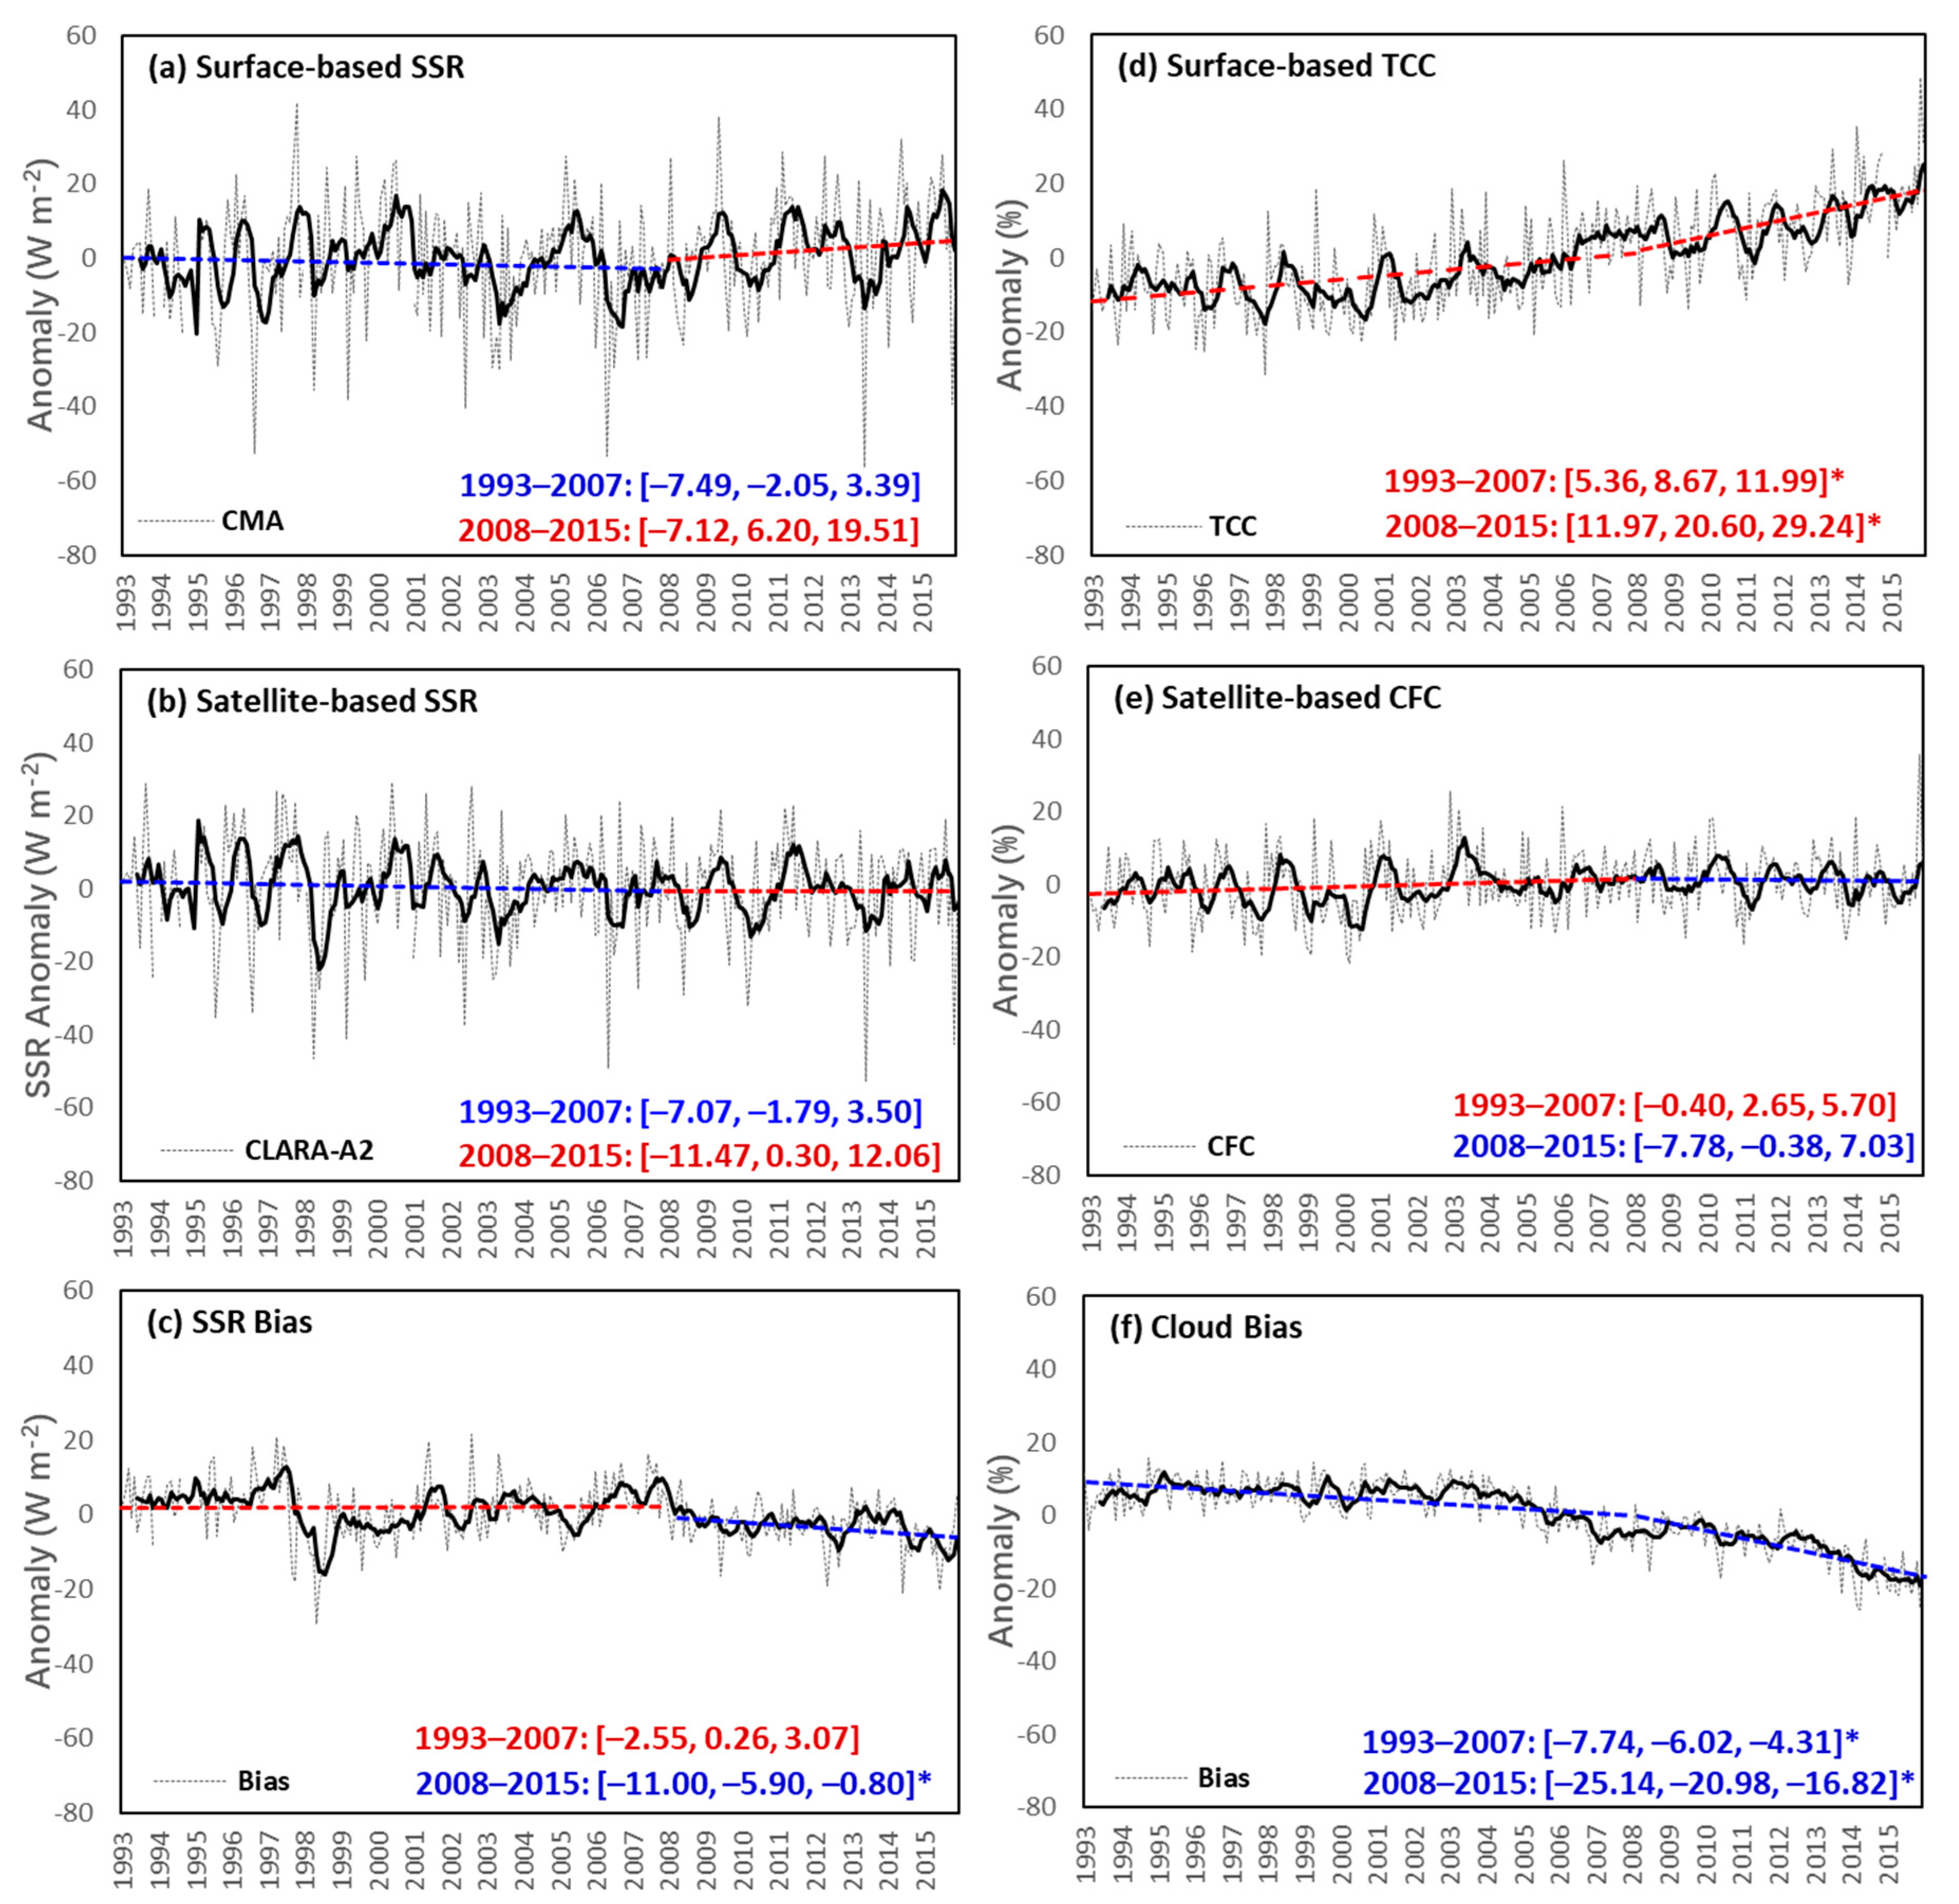
Likely as a response to the governmental regulations on air quality, Beijing’s SSR reversed to an increase since 2008 with a rate of 6.2 W m−2 decade−1 (Figure 7a), higher than the brightening rate averaged over the 59 stations across China (Figure 2a). The recovery of surface-observed SSR in Beijing is also indicated in the Trendraster-plots shown in Figure 3, which shows that brightening trends up to 14 W m−2 decade−1 are prevalent since the early 2000s. Meanwhile, the satellite-based SSR in Beijing levels off at a rate of 0.3 W m−2 decade−1 for the period 2008–2015 (Figure 7b), significantly underestimating the surface-based SSR trend by –5.9 W m−2 decade−1 (Figure 7c). The dimming trend in surface observations during the pre-2008 period can generally be reproduced by the satellite data. The deseasonalized correlation in the monthly anomalies of CLARA-A2 and CMA SSR in Beijing is almost 0.9 for 1993–2015, indicating common interannual variabilities.
Cloud variations can hardly explain the recent brightening in surface-observed SSR of Beijing. As seen from Figure 7d, surface-observed TCC keeps increasing during 1993–2015 with an even stronger increase in the latter period, which could not explain the increase in SSR. An increasing trend in TCC since the 1990s is also evidenced over China by Xia [68], Liu et al. [69], and Wang et al. [5]. Changes in satellite-derived CLARA-A2 SSR are generally in good agreement with the trends of CFC used in CLARA-A2 (Figure 7b,e), suggesting a good representation of cloud effects in the satellite-retrieved SSR, as expected from the satellite-retrievals. The CLARA-A2 CFC can generally reproduce the annual cycle of the CMA TCC with a peak in summer and a trough in winter (Figure 8). The decadal trends in satellite-based CFC and surface-based TCC are not totally consistent (Figure 7d,e), possibly due to missing clouds with optical thickness below 0.15 in the CFC estimations and/or the potential errors due to the subjective human eye observations of TCC. Despite these, the bias in the cloud time series of CFC minus TCC decreases in the latter period, which supposes to induce a positive bias in SSR trends between CLARA-A2 and CMA rather than the negative bias depicted in Figure 7c. Therefore, the transition from increase to decrease in the SSR bias series should not be driven by changes in clouds. Such information is also indicated in Table 1 by the negligible correlation between the SSR bias and TCC.
In comparison, the decadal trends of surface-based SSR are in accordance with the changes of aerosols. AERONET AOD at 500 nm shows an increase of 9.3% decade−1 during the pre-2008 period and thereafter a decrease of −4.4% decade−1 in Beijing (Figure 9a). The transition is also detectable in the AERONET AOD at 440 nm in Beijing and its nearby county site of Xianghe [48,62]. Mainly representing pollutant mass concentrations of SO2, NO2, and PM10 near the surface, API keeps decreasing in Beijing during 2001–2012, with a stronger decrease in the post-2008 period (Figure 9b). A reduction in the PM2.5 concentrations has also been reported in Beijing since around 2008 [70]. Considering the temporal limitation in air pollution monitoring, which is available only since the 2000s, the index of diffuse fraction was analyzed to estimate the effects of scattering aerosols. An increase in diffuse fraction is generally accompanied by an increase in scattering aerosols and vice versa. Indeed, where we see a transition from dimming to brightening in SSR, i.e., total radiation, the corresponding decadal trends of diffuse fraction show an opposite change from increase to decrease (Figure 9c). The reversal to decrease in the trend of diffuse fraction could not be explained by the significant increase in TCC and thus mainly implies a decrease in scattering aerosols in Beijing. This is consistent with the national control of SO2 and NOX emissions [6,64,65]. The neglect of varying aerosol burden in satellite SSR retrievals could then be the main reason behind the detected transition in the SSR bias series of Beijing since 2008. This is also indicated by the significantly positive correlations between the CLARA-A2 minus CMA SSR biases and the changes of AOD and API shown in Table 1. In addition to this, averaged for Beijing, the AOD climatology used in CLARA-A2 with a mean of 0.19 has largely underestimated the surface-based AERONET AODs with a mean of 0.71 (Figure 8), which could explain the large overestimation of SSR by 19.2 W m−2 [39]. Therefore, aerosols mainly dominate the bias series between surface- and satellite-based SSR, which in turn, could be used to infer aerosol information and quantify aerosol-driven changes in SSR.
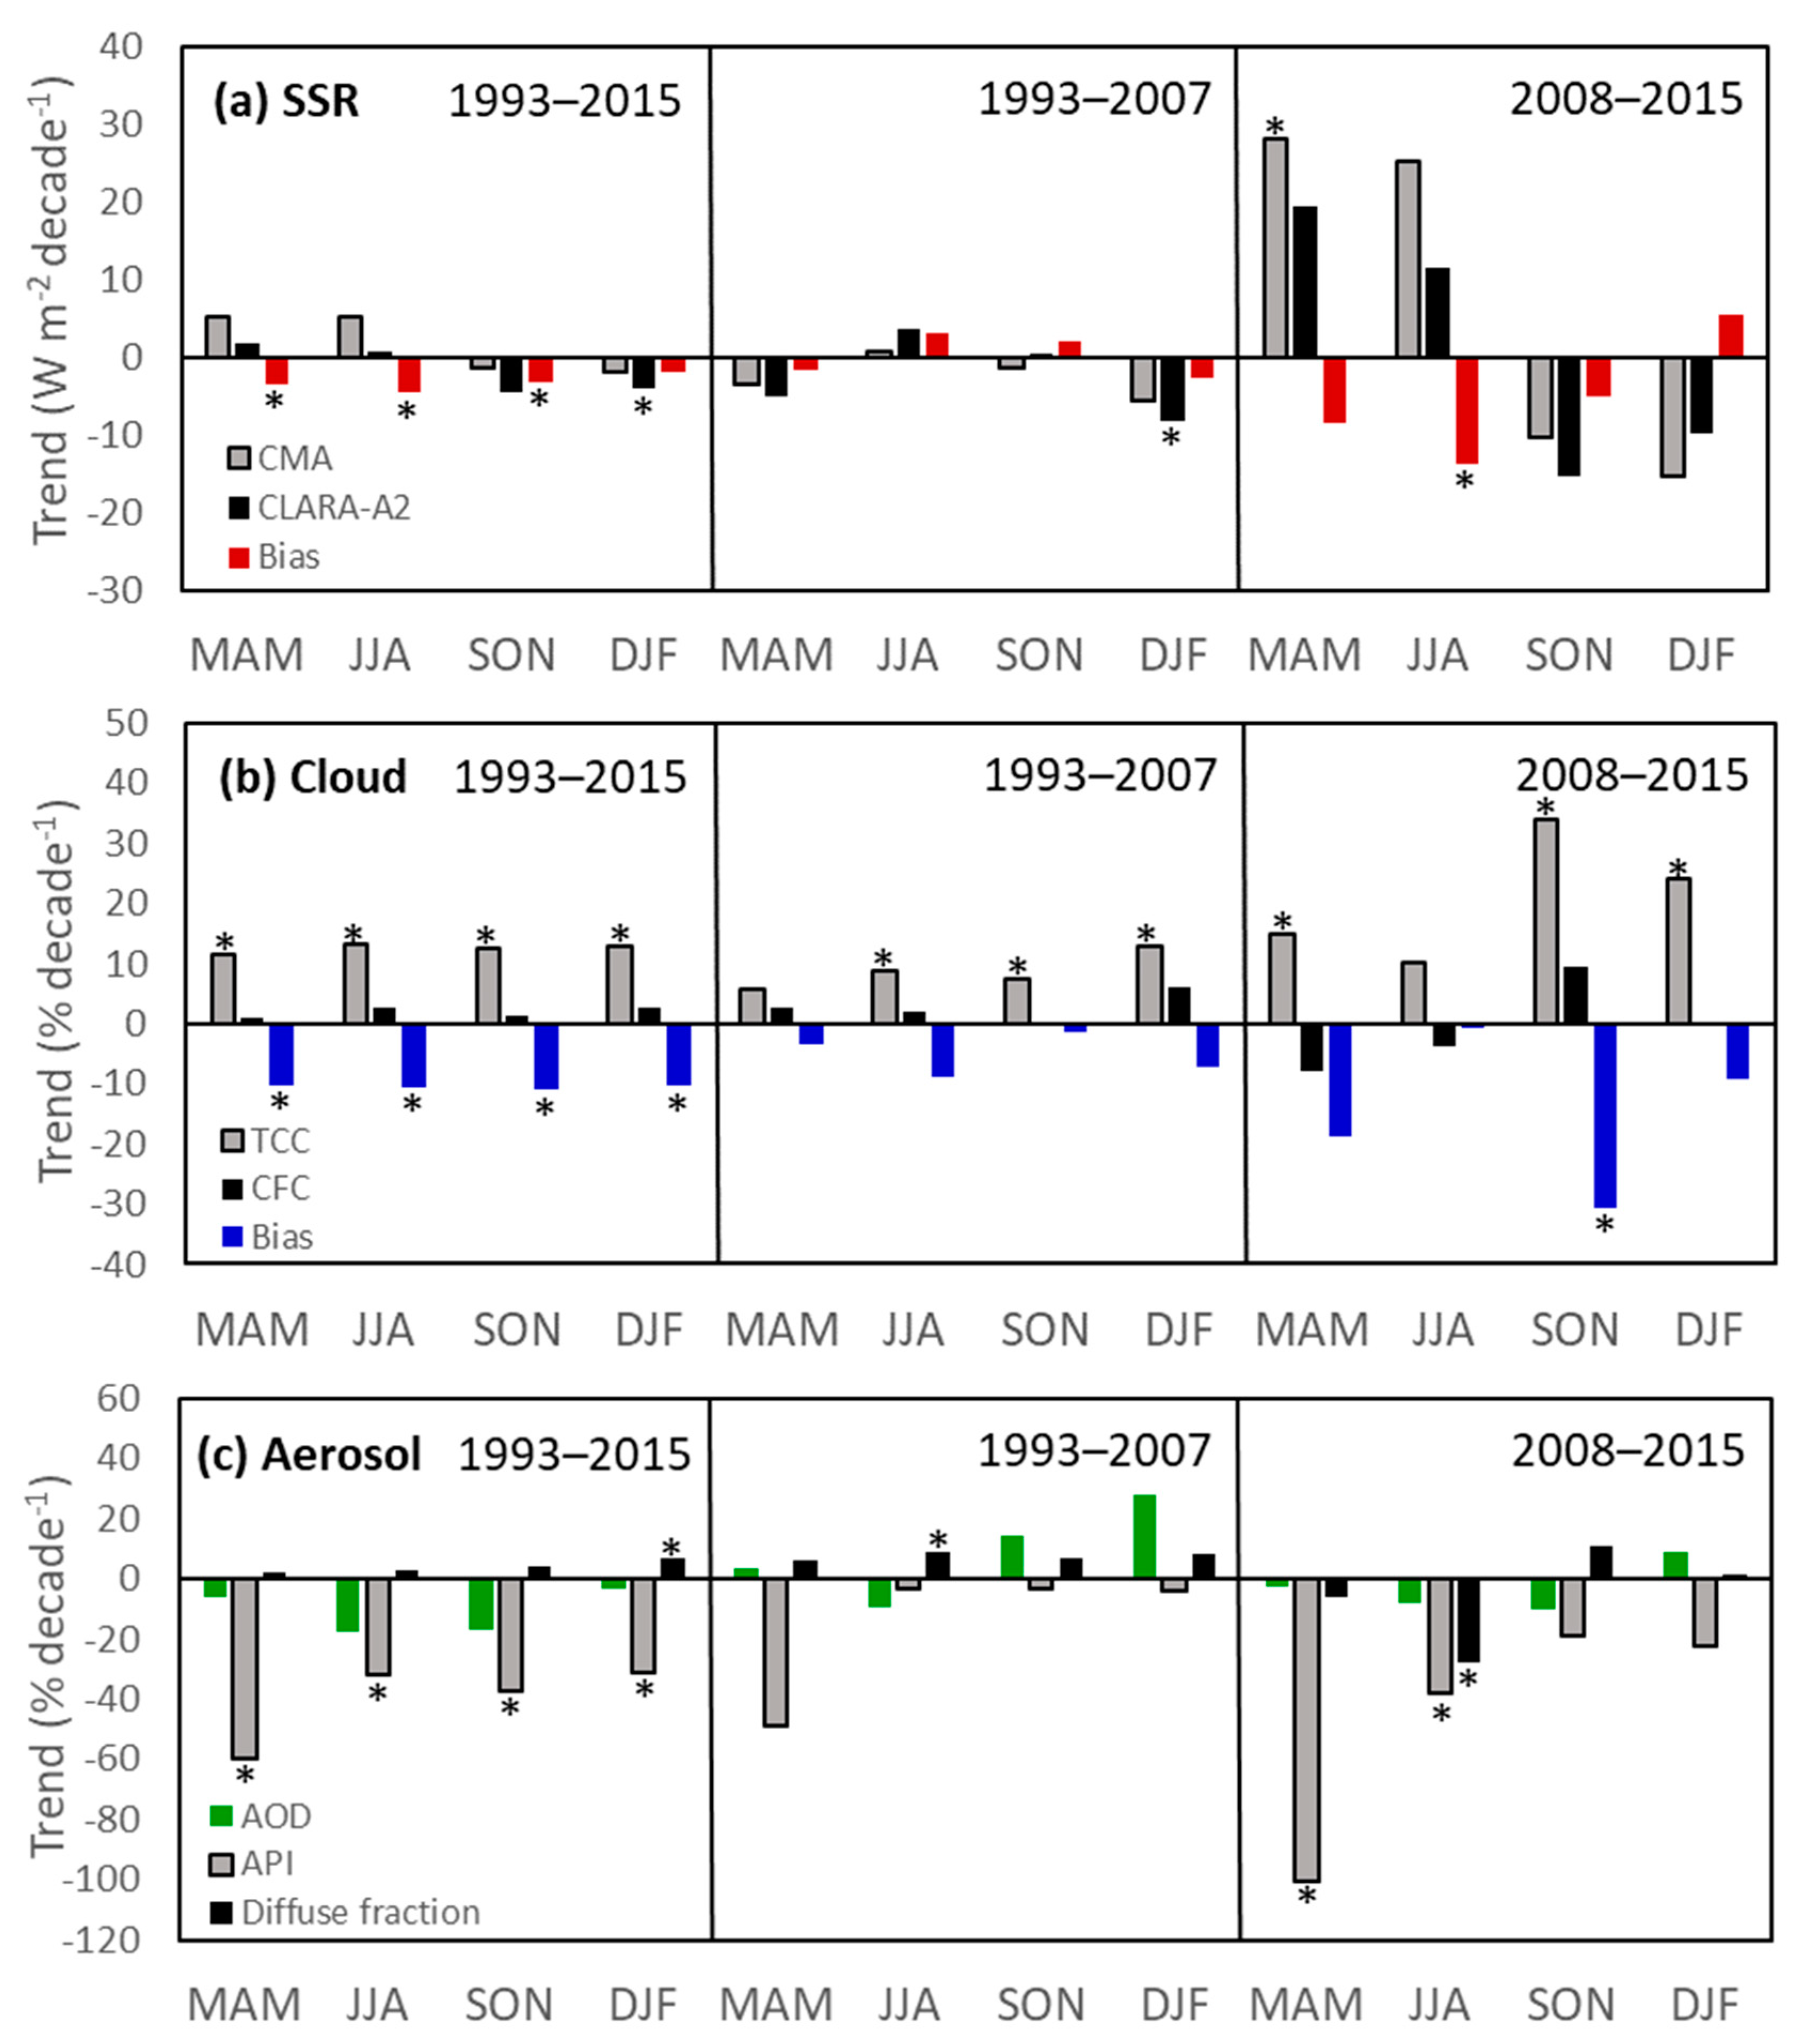
The trends in SSR, clouds, and aerosols were also compared in Beijing at a seasonal scale. Seen from Figure 10a, signs of the seasonal trends of CMA SSR can generally be reproduced by CLARA-A2 for all the examined subperiods but with different magnitudes. The largest bias occurs in summer and spring seasons of the 2008–2015 period, induced by stronger brightening trends in surface- than satellite-based SSR. The variations in clouds, i.e., increasing surface-based TCC and decreasing satellite-based CFC (Figure 10b), would, however, lead to the opposite result. Insignificant correlations between the SSR bias and TCC are shown for the spring and summer seasons of the post-2008 period (Table 1). The decline in aerosol burden, indicated by all the indices of AERONET AOD, API, and diffuse fraction, can then be the main reason behind the spring and summer brightening in Beijing (Figure 10c). As shown in Table 1, spring brightening correlates the most with API, the indicator of pollution concentrations near the surface, indicating an effective control of dust pollution [6]. In summer, intensive atmospheric convection due to heating of the atmosphere from below results in aerosol transports to higher levels of the atmosphere [47]. Therefore, summer brightening is mainly driven by decreased pollutants aloft in the atmosphere, which can be indicated by the significant correlation with AOD but the negligible correlation with API (Table 1). In autumn, the most significant increase in clouds largely compensates for the decrease in aerosols and thus results in a continued dimming during the post-2008 period. Dimming also continues in winter, the only season with continued increasing trend of AOD from 2008 onwards. The SSR bias in winter shows a transition from decrease to increase, opposite to the one observed in other seasons. Consistent with the seasonal analysis at the national scale, the transition in the bias series of satellite- minus surface-based SSR mainly occurs in the warm seasons when pollution control measures and actions effectively trigger a recovery in surface-based SSR.

4. Conclusions and Outlook

The CM SAF CLARA-A2 solar radiation dataset allowed the calculation of long-term satellite-derived SSR trends over China. On average, the CLARA-A2 SSR significantly increased by 3.2 W m−2 decade−1 during 1993–2007 and then decreased by −0.8 W m−2 decade−1 during 2008–2015, contrary to the transition from dimming to brightening observed in the CMA SSR over 59 homogeneous stations across China. Accordingly, a transition from increase to decrease was noted in the time series of the biases between satellite- and surface-based SSR, i.e., the “SSR bias series”, in 2008. This is especially the case in the warm seasons of spring and summer and the East Coast regions of North and South China. In line with the implementation of the 11th (2006–2010) and 12th (2011–2015) Five-Year-Plan to strengthen the controls on air pollution, surface-observed SSR recovered in the above-mentioned seasons and regions, which is, however, not reproduced by satellite retrievals using a constant aerosol climatology. In China, with high concentrations and temporal variations of aerosols, the solar dimming and brightening phenomena have thus not yet been accurately reproduced by satellite retrievals ignoring aerosol variations.
Based on comprehensive comparisons between time series of surface- and satellite-based SSR, cloud cover, and aerosol (represented by AOD, API and diffuse fraction) in Beijing at both annual and seasonal scales, the main reason behind the detected transition in the SSR bias series in 2008 has been further evidenced to be related to the reversal in the aerosol trend towards a decrease. From 2008 onwards, TCC shows an even stronger increase, which thus cannot explain the recent brightening trend in surface-observed SSR. Meanwhile, all indices of AOD, API and diffuse fraction suggest a decrease in the aerosol concentration over Beijing. Significant correlations of the SSR biases with the changes in AOD and API can be noted at all temporal scales, while the correlations with TCC are generally negligible. At seasonal scales, the recent brightening occurs in the warm seasons of spring and summer, which show the highest agreement with decreases in the trends of API and AOD, respectively, in Beijing. Therefore, mainly the temporal variations of aerosols may determine the bias series between surface- and satellite-based SSR, which in turn can be used to quantify aerosol-driven changes in SSR.
The conducted pollution control measures and actions since the 11th Five-Year-Plan have successfully brought back SSR by 3.5 W m−2 decade−1, 7.5 W m−2 decade−1, 5.2 W m−2 decade−1, and 5.9 W m−2 decade−1 for the whole China, the regions of SC and NC, and Beijing, respectively. Based on the methods applied in this study, the spring and summer brightening trends induced by aerosol reduction are 5.9 W m−2 decade−1 and 4.7 W m−2 decade−1, respectively, for the whole China, and 8.6 W m−2 decade−1 and 13.7 W m−2 decade−1, respectively, for Beijing. Uncertainties remain in the estimated magnitudes of aerosol driven changes in SSR due to the facts that (1) the effects of other radiative factors (e.g., surface albedo, water vapor, etc.) may also play a role, and (2) instrument/retrieval related inhomogeneities in the time series cannot be fully excluded.
A continued increasing trend in AOD derived from both ground observations and satellite retrievals, and correspondingly a continued dimming trend in SSR, are still prevalent in the winter season when domestic heating is important. Evidence collected in the referred references indicates an effective control of primary aerosols (e.g., SO2, NOx, PMs) by the Chinese government during the 11th and 12th Five-Year-Plan periods. However, with increasing energy demands and rapid formation of secondary aerosols, the improvement of the complex air pollution in China still has a long way to go. Considering this, a correction of the aerosol climatology used in the satellite algorithms to allow for the inclusion of aerosol variability is highly recommended for accurate reproduction of the solar dimming/brightening phenomenon in regions like China with non-negligible aerosol radiative effects. This, in turn, would allow a better estimation of the implications of global dimming and brightening for energy applications, hydrological processes, crop growth, etc.

Author Contributions

Conceptualization, J.T. and M.W.; writingoriginal draft preparation, Y.W.; writing—review & editing, J.T., U.P., W.Y. and M.W.; funding acquisition, Y.W., J.T. and W.Y.

Funding

This research is funded by the National Key Basic Research Program of China (Grant No. 2016YFA0602701), the National Natural Science Foundation of China (41971018 and 41501036), National Youth Top-Notch Talent Support Program (2015-48), Changjiang Young Scholars Program of China (Q2016161) and the EUMETSAT SAF on Climate Monitoring (CM_VS18_03).

Acknowledgments

We acknowledge the provision of surface solar radiation data by the EUMETSAT Satellite Application Facility on Climate Monitoring (CM SAF) and the China Meteorological Administration (CMA).

Conflicts of Interest

The authors declare no conflict of interest.

References

  1. Wang, S.; Zhao, B.; Cai, S.; Klimont, Z.; Nielsen, C.; Morikawa, T.; Woo, J.; Kim, Y.; Fu, X.; Xu, J. Emission trends and mitigation options for air pollutants in east asia. Atmos. Chem. Phys. 2014, 14, 6571–6603. [Google Scholar] [CrossRef] [Green Version]
  2. Cofala, J.; Borken-Kleefeld, J.; Heyes, C.; Klimont, Z.; Rafaj, P.; Sander, R.; Schöpp, W.; Amann, M. Emissions of Air Pollutants for the World Energy Outlook 2011 Energy Scenarios; International Energy Agency: Paris, France, 2011. [Google Scholar]
  3. Zhang, Q.; Jiang, X.; Tong, D.; Davis, S.J.; Zhao, H.; Geng, G.; Feng, T.; Zheng, B.; Lu, Z.; Streets, D.G.; et al. Transboundary health impacts of transported global air pollution and international trade. Nature 2017, 543, 705–709. [Google Scholar] [CrossRef] [PubMed] [Green Version]
  4. Verstraeten, W.W.; Neu, J.L.; Williams, J.E.; Bowman, K.W.; Worden, J.R.; Boersma, K.F. Rapid increases in tropospheric ozone production and export from china. Nat. Geosci. 2015, 8, 690–695. [Google Scholar] [CrossRef]
  5. Wang, Y.; Wild, M.; Sanchezlorenzo, A.; Manara, V. Urbanization effect on trends in sunshine duration in china. Ann. Geophys. 2017, 35, 839–851. [Google Scholar] [CrossRef] [Green Version]
  6. Zhang, H.; Wang, S.; Hao, J.; Wang, X.; Wang, S.; Chai, F.; Li, M. Air pollution and control action in beijing. J. Clean. Prod. 2016, 112, 1519–1527. [Google Scholar] [CrossRef]
  7. Jin, Y.; Andersson, H.; Zhang, S. Air pollution control policies in china: A retrospective and prospects. Int. J. Environ. Res. Public Health 2016, 13, 1219. [Google Scholar] [CrossRef] [Green Version]
  8. Wild, M. Global dimming and brightening: A review. J. Geophys. Res. Atmos. 2009, 114. [Google Scholar] [CrossRef] [Green Version]
  9. Ramanathan, V.; Crutzen, P.J.; Kiehl, J.T.; Rosenfeld, D. Atmosphere—Aerosols, climate, and the hydrological cycle. Science 2001, 294, 2119–2124. [Google Scholar] [CrossRef] [Green Version]
  10. Charlson, R.J.; Schwartz, S.E.; Hales, J.M.; Cess, R.D.; Coakley, J.A.; Hansen, J.E.; Hofmann, D.J. Climate forcing by anthroogenic aerosols. Science 1992, 255, 423–430. [Google Scholar] [CrossRef]
  11. Stanhill, G.; Cohen, S. Global dimming: A review of the evidence for a widespread and significant reduction in global radiation with discussion of its probable causes and possible agricultural consequences. Agric. For. Meteorol. 2001, 107, 255–278. [Google Scholar] [CrossRef]
  12. Wild, M. Enlightening global dimming and brightening. Bull. Am. Meteorol. Soc. 2012, 93, 27–37. [Google Scholar] [CrossRef]
  13. Ohmura, A. Observed decadal variations in surface solar radiation and their causes. J. Geophys. Res. 2009, 114. [Google Scholar] [CrossRef] [Green Version]
  14. Kambezidis, H.D.; Kaskaoutis, D.G.; Kharol, S.K.; Moorthy, K.K.; Satheesh, S.K.; Kalapureddy, M.C.R.; Badarinath, K.V.S.; Sharma, A.R.; Wild, M. Multi-decadal variation of the net downward shortwave radiation over south asia: The solar dimming effect. Atmos. Environ. 2012, 50, 360–372. [Google Scholar] [CrossRef]
  15. Wild, M.; Gilgen, H.; Roesch, A.; Ohmura, A.; Long, C.N.; Dutton, E.G.; Forgan, B.; Kallis, A.; Russak, V.; Tsvetkov, A. From dimming to brightening: Decadal changes in solar radiation at earth’s surface. Science 2005, 308, 847–850. [Google Scholar] [CrossRef] [PubMed] [Green Version]
  16. Kambezidis, H.D.; Kaskaoutis, D.G.; Kalliampakos, G.K.; Rashki, A.; Wild, M. The solar dimming/brightening effect over the mediterranean basin in the period 1979–2012. J. Atmos. Sol. Terr. Phys. 2016, 150–151, 31–46. [Google Scholar] [CrossRef]
  17. Wang, Y.; Wild, M. A new look at solar dimming and brightening in china. Geophys. Res. Lett. 2016, 43, 11777–11785. [Google Scholar] [CrossRef]
  18. Yang, S.; Wang, X.L.; Wild, M. Homogenization and trend analysis of the 1958–2016 in situ surface solar radiation records in china. J. Clim. 2018, 31, 4529–4541. [Google Scholar] [CrossRef]
  19. Pfeifroth, U.; Sanchez-Lorenzo, A.; Manara, V.; Trentmann, J.; Hollmann, R. Trends and variability of surface solar radiation in europe based on surface- and satellite-based data records. J. Geophys. Res. Atmos. 2018, 123, 1735–1754. [Google Scholar] [CrossRef]
  20. Sanchez-Lorenzo, A.; Wild, M.; Brunetti, M.; Guijarro, J.A.; Hakuba, M.Z.; Calbó, J.; Mystakidis, S.; Bartok, B. Reassessment and update of long-term trends in downward surface shortwave radiation over europe (1939–2012). J. Geophys. Res. Atmos. 2015, 120, 9555–9569. [Google Scholar] [CrossRef] [Green Version]
  21. Urraca, R.; Gracia-Amillo, A.M.; Koubli, E.; Huld, T.; Trentmann, J.; Riihelä, A.; Lindfors, A.V.; Palmer, D.; Gottschalg, R.; Antonanzas-Torres, F. Extensive validation of cm saf surface radiation products over europe. Remote Sens. Environ. 2017, 199, 171–186. [Google Scholar] [CrossRef] [Green Version]
  22. Posselt, R.; Mueller, R.W.; Stöckli, R.; Trentmann, J. Remote sensing of solar surface radiation for climate monitoring—The cm-saf retrieval in international comparison. Remote Sens. Environ. 2012, 118, 186–198. [Google Scholar] [CrossRef]
  23. Hinkelman, L.M.; Stackhouse, P.W., Jr.; Wielicki, B.A.; Zhang, T.; Wilson, S.R. Surface insolation trends from satellite and ground measurements: Comparisons and challenges. J. Geophys. Res. Atmos. 2009, 114. [Google Scholar] [CrossRef] [Green Version]
  24. Pinker, R.; Zhang, B.; Dutton, E. Do satellites detect trends in surface solar radiation? Science 2005, 308, 850–854. [Google Scholar] [CrossRef] [PubMed] [Green Version]
  25. Hatzianastassiou, N.; Matsoukas, C.; Fotiadi, A.; Pavlakis, K.; Drakakis, E.; Hatzidimitriou, D.; Vardavas, I. Global distribution of earth’s surface shortwave radiation budget. Atmos. Chem. Phys. 2005, 5, 2847–2867. [Google Scholar] [CrossRef] [Green Version]
  26. Sanchez-Lorenzo, A.; Enriquez-Alonso, A.; Wild, M.; Trentmann, J.; Vicente-Serrano, S.M.; Sanchez-Romero, A.; Posselt, R.; Hakuba, M.Z. Trends in downward surface solar radiation from satellites and ground observations over europe during 1983–2010. Remote Sens.Environ. 2017, 189, 108–117. [Google Scholar] [CrossRef] [Green Version]
  27. Riihelä, A.; Carlund, T.; Trentmann, J.; Müller, R.; Lindfors, A. Validation of cm saf surface solar radiation datasets over finland and sweden. Remote Sens. 2015, 7, 6663–6682. [Google Scholar] [CrossRef] [Green Version]
  28. Xia, X.A.; Wang, P.C.; Chen, H.B.; Liang, F. Analysis of downwelling surface solar radiation in china from national centers for environmental prediction reanalysis, satellite estimates, and surface observations. J. Geophys. Res. Atmos. 2006, 111, 2105–2117. [Google Scholar] [CrossRef] [Green Version]
  29. Wu, F.; Fu, C. Assessment of gewex/srb version 3.0 monthly global radiation dataset over china. Meteorol. Atmos. Phys. 2011, 112, 155–166. [Google Scholar] [CrossRef]
  30. Wang, K.; Ma, Q.; Li, Z.; Wang, J. Decadal variability of surface incident solar radiation over china: Observations, satellite retrievals, and reanalyses. J. Geophys. Res. Atmos. 2015, 120, 6500–6514. [Google Scholar] [CrossRef]
  31. Zhang, X.; Liang, S.; Wild, M.; Jiang, B. Analysis of surface incident shortwave radiation from four satellite products. Remote Sens. Environ. 2015, 165, 186–202. [Google Scholar] [CrossRef]
  32. Alexandri, G.; Georgoulias, A.K.; Meleti, C.; Balis, D.; Kourtidis, K.A.; Sanchez-Lorenzo, A.; Trentmann, J.; Zanis, P. A high resolution satellite view of surface solar radiation over the climatically sensitive region of eastern mediterranean. Atmos. Res. 2017, 188, 107–121. [Google Scholar] [CrossRef]
  33. Karlsson, K.G.; Anttila, K.; Trentmann, J.; Stengel, M.; Fokke Meirink, J.; Devasthale, A.; Hanschmann, T.; Kothe, S.; Jääskeläinen, E.; Sedlar, J.; et al. Clara-a2: The second edition of the cm saf cloud and radiation data record from 34 years of global avhrr data. Atmos. Chem. Phys. 2017, 17, 5809–5828. [Google Scholar] [CrossRef] [Green Version]
  34. Hess, M.; Koepke, P.; Schult, I. Optical properties of aerosols and clouds: The software package opac. Bull. Am. Meteorol. Soc. 1998, 79, 831–844. [Google Scholar] [CrossRef]
  35. Yang, Y.; Ding, L.; Quan, J.; Cheng, X. Uncertainty analysis of calibration results of homemade pyranometers. Meteorol. Sci. Technol. 2012, 40, 20–24. [Google Scholar]
  36. Shi, G.; Hayasaka, T.; Ohmura, A.; Chen, Z.; Wang, B.; Zhao, J.; Che, H.; Xu, L. Data quality assessment and the long-term trend of ground solar radiation in china. J. Appl. Meteorol. Clim. 2008, 47, 1006–1016. [Google Scholar] [CrossRef]
  37. Tang, W.; Yang, K.; He, J.; Qin, J. Quality control and estimation of global solar radiation in china. Sol. Energy 2010, 84, 466–475. [Google Scholar] [CrossRef]
  38. Alexandersson, H. A homogeneity test applied to precipitation data. Int. J. Climatol. 1986, 6, 661–675. [Google Scholar] [CrossRef]
  39. Wang, Y.; Trentmann, J.; Yuan, W.; Wild, M. Validation of cm saf clara-a2 and sarah-e surface solar radiation datasets over china. Remote Sens. 2018, 10, 1977. [Google Scholar] [CrossRef] [Green Version]
  40. Qin, W.; Liu, Y.; Wang, L.; Lin, A.; Xia, X.; Che, H.; Bilal, M.; Zhang, M. Characteristic and driving factors of aerosol optical depth over mainland china during 1980–2017. Remote Sens. 2018, 10, 1064. [Google Scholar] [CrossRef] [Green Version]
  41. Sogacheva, L.; Rodriguez, E.; Kolmonen, P.; Virtanen, T.H.; Saponaro, G. Spatial and seasonal variations of aerosols over china from two decades of multi-satellite observations. Part ii: Aod time series for 1995–2017 combined from atsr adv and modis c6. 1 for aod tendencies estimation. Atoms. Chem. Phys. 2018, 18, 16631–16652. [Google Scholar] [CrossRef] [Green Version]
  42. Bellouin, N.; Boucher, O.; Haywood, J.; Reddy, M.S. Global estimate of aerosol direct radiative forcing from satellite measurements. Nature 2005, 438, 1138–1141. [Google Scholar] [CrossRef]
  43. Qu, W.J.; Arimoto, R.; Zhang, X.Y.; Zhao, C.H.; Wang, Y.Q.; Sheng, L.F.; Fu, G. Spatial distribution and interannual variation of surface pm(10) concentrations over eighty-six chinese cities. Atmos. Chem. Phys. 2010, 10, 5641–5662. [Google Scholar] [CrossRef] [Green Version]
  44. Sneyers, R. Sur L’analyse Statistique des Séries D’observations; Secrétariat de l’Organisation Météorologique Mondiale: Geneva, Switzerland, 1975. [Google Scholar]
  45. Brunetti, M.; Maugeri, M.; Nanni, T.; Auer, I.; Böhm, R.; Schöner, W. Precipitation variability and changes in the greater alpine region over the 1800–2003 period. J. Geophys. Res. Atmos. 2006, 111. [Google Scholar] [CrossRef]
  46. Wang, Y.W.; Yang, Y.H.; Han, S.M.; Wang, Q.X.; Zhang, J.H. Sunshine dimming and brightening in chinese cities (1955–2011) was driven by air pollution rather than clouds. Clim. Res. 2013, 56, 11–20. [Google Scholar] [CrossRef] [Green Version]
  47. Xia, X.A.; Chen, H.B.; Wang, P.C.; Zhang, W.X.; Goloub, P.; Chatenet, B.; Eck, T.F.; Holben, B.N. Variation of column-integrated aerosol properties in a chinese urban region. J. Geophys. Res. Atmos. 2006, 111. [Google Scholar] [CrossRef]
  48. Yu, X.; Lü, R.; Liu, C.; Yuan, L.; Shao, Y.; Zhu, B.; Lei, L. Seasonal variation of columnar aerosol optical properties and radiative forcing over beijing, china. Atmos. Environ. 2017, 166, 340–350. [Google Scholar] [CrossRef]
  49. Zhao, B.; Jiang, J.H.; Gu, Y.; Diner, D.; Worden, J.; Liou, K.-N.; Su, H.; Xing, J.; Garay, M.; Huang, L. Decadal-scale trends in regional aerosol particle properties and their linkage to emission changes. Environ. Res. Lett. 2017, 12, 054021. [Google Scholar] [CrossRef]
  50. Li, C.; McLinden, C.; Fioletov, V.; Krotkov, N.; Carn, S.; Joiner, J.; Streets, D.; He, H.; Ren, X.; Li, Z.; et al. India is overtaking china as the world’s largest emitter of anthropogenic sulfur dioxide. Sci. Rep. 2017, 7, 14304. [Google Scholar] [CrossRef] [Green Version]
  51. Ma, Z.; Liu, R.; Liu, Y.; Bi, J. Effects of air pollution control policies on pm2.5 pollution improvement in china from 2005 to 2017: A satellite-based perspective. Atmos. Chem. Phys. 2019, 19, 6861–6877. [Google Scholar] [CrossRef] [Green Version]
  52. Zhang, J.; Reid, J.S.; Alfaro-Contreras, R.; Xian, P. Has china been exporting less particulate air pollution over the past decade? Geophys. Res. Lett. 2017, 44, 2941–2948. [Google Scholar] [CrossRef]
  53. He, Q.; Zhang, M.; Huang, B. Spatio-temporal variation and impact factors analysis of satellite-based aerosol optical depth over china from 2002 to 2015. Atmos. Environ. 2016, 129, 79–90. [Google Scholar] [CrossRef]
  54. Filonchyk, M.; Yan, H.; Zhang, Z.; Yang, S.; Li, W.; Li, Y. Combined use of satellite and surface observations to study aerosol optical depth in different regions of china. Sci. Rep. 2019, 9, 6174. [Google Scholar] [CrossRef] [PubMed]
  55. Riihelä, A.; Kallio, V.; Devraj, S.; Sharma, A.; Lindfors, A. Validation of the sarah-e satellite-based surface solar radiation estimates over india. Remote Sens. 2018, 10, 392. [Google Scholar] [CrossRef] [Green Version]
  56. Xiao, Q.; Ma, Z.; Li, S.; Liu, Y. The impact of winter heating on air pollution in china. PLoS ONE 2015, 10, e0117311. [Google Scholar] [CrossRef] [Green Version]
  57. Cheng, Y.; He, K.-b.; Du, Z.-y.; Zheng, M.; Duan, F.-k.; Ma, Y.-l. Humidity plays an important role in the pm2.5 pollution in beijing. Environ. Pollut. 2015, 197, 68–75. [Google Scholar] [CrossRef]
  58. Liu, J.; Diamond, J. China’s environment in a globalizing world. Nature 2005, 435, 1179–1186. [Google Scholar] [CrossRef]
  59. Li, X.; Che, H.; Wang, H.; Xia, X.a.; Chen, Q.; Gui, K.; Zhao, H.; An, L.; Zheng, Y.; Sun, T.; et al. Spatial and temporal distribution of the cloud optical depth over china based on modis satellite data during 2003–2016. J. Environ. Sci. 2019, 80, 66–81. [Google Scholar] [CrossRef]
  60. Zhai, P.; Yu, R.; Guo, Y.; Li, Q.; Ren, X.; Wang, Y.; Xu, W.; Liu, Y.; Ding, Y. The strong el niño of 2015/16 and its dominant impacts on global and china’s climate. J. Meteorol. Res. 2016, 30, 283–297. [Google Scholar] [CrossRef]
  61. He, L.; Wang, L.; Lin, A.; Zhang, M.; Xia, X.; Tao, M.; Zhou, H. What drives changes in aerosol properties over the yangtze river basin in past four decades? Atmos. Environ. 2018, 190, 269–283. [Google Scholar] [CrossRef]
  62. Li, J.; Jiang, Y.; Xia, X.; Hu, Y. Increase of surface solar irradiance across east china related to changes in aerosol properties during the past decade. Environ. Res. Lett. 2018, 13, 034006. [Google Scholar] [CrossRef]
  63. Liu, H.; Gao, X.; Xie, Z.; Li, T.; Zhang, W. Spatio-temporal characteristics of aerosol optical depth over beijing-tianjin-hebei-shanxi-shandong region during 2000–2013. Huanjing Kexue Xuebao 2015, 35, 1506–1511. [Google Scholar]
  64. Georgoulias, A.; van der A, R.; Stammes, P.; Boersma, K.; Eskes, H. Trends and trend reversal detection in 2 decades of tropospheric no2 satellite observations. Atmos. Chem. Phys. 2019, 19, 6269–6294. [Google Scholar] [CrossRef] [Green Version]
  65. Wang, C.; Wang, T.; Wang, P. The spatial–temporal variation of tropospheric no2 over china during 2005 to 2018. Atmosphere 2019, 10, 444. [Google Scholar] [CrossRef] [Green Version]
  66. Sogacheva, L.; Leeuw, G.d.; Rodriguez, E.; Kolmonen, P.; Georgoulias, A.K.; Alexandri, G.; Kourtidis, K.; Proestakis, E.; Marinou, E.; Amiridis, V. Spatial and seasonal variations of aerosols over china from two decades of multi-satellite observations—Part 1: Atsr (1995–2011) and modis c6. 1 (2000–2017). Atmos. Chem. Phys. 2018, 18, 11389–11407. [Google Scholar] [CrossRef] [Green Version]
  67. Wang, S.; Zhao, M.; Xing, J.; Wu, Y.; Zhou, Y.; Lei, Y.; He, K.; Fu, L.; Hao, J. Quantifying the air pollutants emission reduction during the 2008 olympic games in beijing. Environ. Sci. Technol. 2010, 44, 2490–2496. [Google Scholar] [CrossRef]
  68. Xia, X. Variability and trend of diurnal temperature range in china and their relationship to total cloud cover and sunshine duration. Ann. Geophys. 2013, 31, 795–804. [Google Scholar] [CrossRef] [Green Version]
  69. Liu, Y.; Wang, N.; Wang, L.; Guo, Z.; Wu, X. Variation of cloud amount over china and the relationship with enso from 1951 to 2014. Int. J. Climatol. 2016, 36, 2931–2941. [Google Scholar] [CrossRef]
  70. Lang, J.; Zhang, Y.; Zhou, Y.; Cheng, S.; Chen, D.; Guo, X.; Chen, S.; Li, X.; Xing, X.; Wang, H. Trends of pm2. 5 and chemical composition in beijing, 2000–2015. Aerosol. Air Qual. Res. 2017, 17, 412–425. [Google Scholar] [CrossRef]
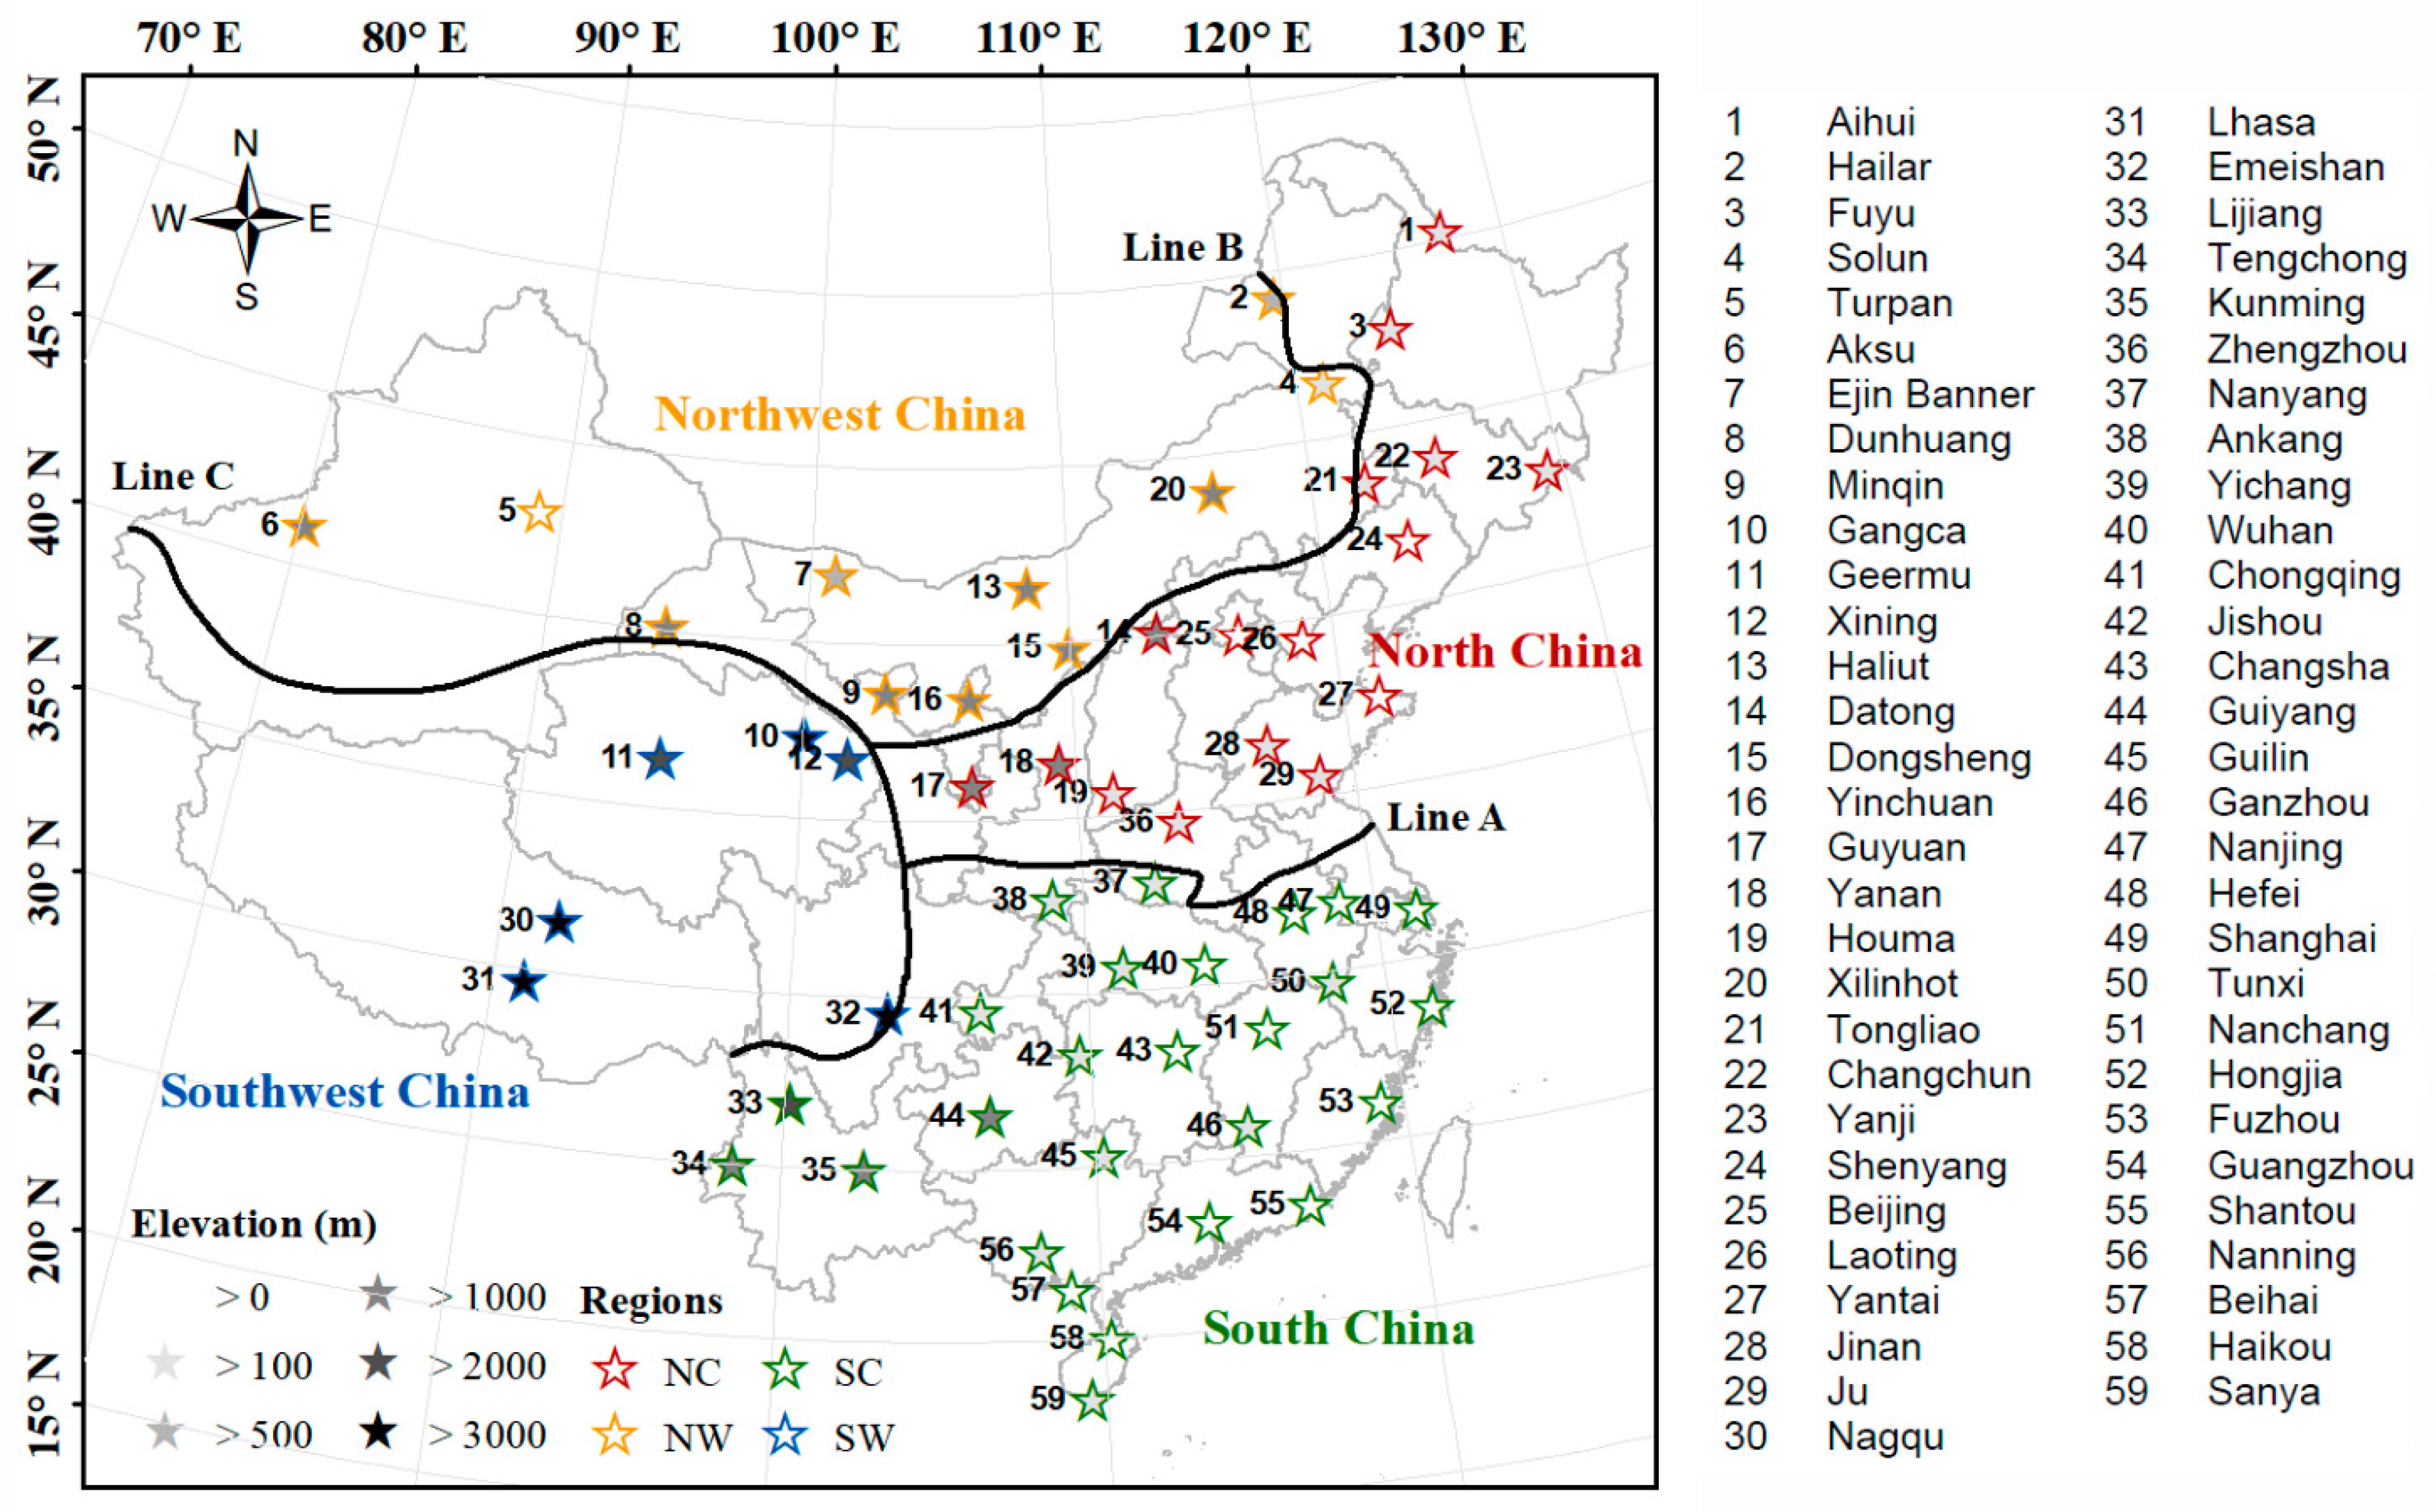
Figure 1. Map showing the location of the 59 surface solar radiation stations across China, divided into four geographical regions: North China (NC, colored in red), South China (SC, green), Northwest China (NW, yellow), and Southwest China (SW, blue). Regional divisions are based on the three lines: Line A, also called Qinling-Huaihe Line, approximates the 0 °C January isotherm and the 800 mm isohyet in China. Line B represents the 400 mm isohyet and the boundary between monsoon and non-monsoon regions in China. Line C is the boundary between the first and second steps of China’s terrain with average elevation over 4000 m and around 1000~2000 m, respectively. The grey scale of the star symbols indicates the elevation (m) of the stations.
Remotesensing 11 02910 g001
Figure 2. Monthly anomalies of surface solar radiation (SSR, W m−2) for surface-based CMA (a) and collocated satellite-based CLARA-A2 (b) datasets, and their biases (c), averaged over the 59 stations across China for 1993–2015, plotted together with six-month moving average filters (thick black line). A stepwise linear regression has been applied for the periods of 1993–2007 and 2008–2015, respectively. Red and blue dashed lines denote upward and downward linear trends, respectively. Values given in the lower left corners of the panels represent the linear decadal trend slopes and the 95% confidence intervals (W m−2 decade−1), marked with an asterisk * denoting significant trends (p < 0.05). (d) shows the smoothed trends of the monthly SSR anomalies for CMA, CLARA-A2 and their biases as determined by the Mann–Kendall–Sneyers method.
Remotesensing 11 02910 g002
Figure 3. Trendraster-plots of mean SSR trends (W m−2 decade−1): comparison between CMA and CLARA-A2 datasets for 1993–2015 over the 59 stations across China (upper panels) and Beijing (lower panels). The y and x axes show the starting and ending years, respectively, of the individual linear trend shown in each pixel. Please note that a different color-scale for the trend slopes is given to the CMA SSR of Bejing (lower left panel).
Remotesensing 11 02910 g003
Figure 4. Annual AOD time series derived from the reanalysis product of MERRA [40] and the combined satellite products of ASTR and MODIS [41] for 1993–2017 over China. Values are the decadal trend slopes and corresponding standard errors, red and blue colored values represent increasing and decreasing trends for the periods of 1993–2007 and 2008–2017, respectively, marked with an asterisk * denoting significant trends at the 95% confidence level.
Remotesensing 11 02910 g004
Figure 5. Seasonal (a) and regional (b) comparisons of the smoothed bias series between CLARA-A2 and CMA SSR determined by the Mann–Kendall–Sneyers method for 1993–2015. Subfigures (c) and (d) compare the seasonal and regional SSR trends (W m−2 decade−1) of CMA (denoted by blue circle), CLARA-A2 (green squares) and their bias (red crosses) for the periods of 1993–2007 and 2008–2015, respectively. Seasons are defined as spring (MAM, March to May), summer (JJA, June to August), autumn (SON, September to November) and winter (DJF, December to February). The defined four regions are SW (Southwest China), SC (South China), NW (Northwest China), and NC (North China).
Remotesensing 11 02910 g005
Figure 6. Spatial patterns of the decadal trends (W m−2 decade−1) in the monthly SSR anomalies of CLARA-A2 (shown as the background layer) compared against the CMA surface observations (points) over China for the periods of 1993–2007 (upper panel) and 2008–2015 (lower panel), respectively.
Remotesensing 11 02910 g006
Figure 7. Comparison of the monthly anomalies of surface solar radiation (SSR, W m−2, ac) and cloud (represented by total cloud cover, TCC, and cloud fractional cover, CFC, %, df) between surface-based CMA and satellite-based CLARA-A2 datasets over Beijing for 1993–2015, plotted together with six-month moving average filters (thick black line). A stepwise linear regression has been applied for the periods of 1993–2007 and 2008–2015, respectively. Red and blue dashed lines denote upward and downward linear trends, respectively. Values stand for the linear decadal trend slopes and the 95% confidence intervals (W m−2 decade−1 for a-c, and % decade−1 for df), marked with an asterisk * denoting significant trends (p < 0.05).
Remotesensing 11 02910 g007
Figure 8. Comparison of the aerosol (a) and cloud (b) climatologies used in CLARA-A2 (blue line) with the ones derived from surface observations of the AERONET and CMA networks (red line) for Beijing. The aerosol climatology used in CLARA-A2 is a slightly modified version of the monthly mean aerosol fields from the GADS/OPAC climatology [34], while the AERONET aerosol climatology is averaged over 2001–2015. Both of the CMA and CLARA-A2 cloud climatologies are calculated over 1993–2015.
Remotesensing 11 02910 g008
Figure 9. Monthly anomalies of aerosol-related information in terms of AOD (aerosol optical depth, a), API (air pollution index, b) and diffuse fraction (the ratio of diffuse to total radiation, %, c) in Beijing for 1993–2015, plotted together with six-month moving average filters (thick black line). A Stepwise linear regression has been applied for the periods of 1993–2007 and 2008–2015, respectively. Red and blue dashed lines denote upward and downward linear trends, respectively. Values correspond to the linear decadal trend slopes and the 95% confidence intervals in both absolute and relative (%) terms, marked with an asterisk * denoting significant trends (p < 0.05).
Remotesensing 11 02910 g009
Figure 10. Comparison of the seasonal trends in SSR (surface solar radiation (a) for CMA, CLARA-A2 and their bias, in W m−2 decade−1), clouds (b) represented by total cloud cover (TCC) and cloud fractional cover (CFC), in % decade−1) and aerosol information (c) represented by aerosol optical depth (AOD), air pollution index (API), and the ratio of diffuse to total radiation (diffuse fraction), in % decade−1) in Beijing for the periods of 1993–2015, 1993–2007 and 2008–2015, respectively. Please note that AOD and API are only available for the periods of 2001–2015 and 2001–2012, respectively. * indicates significant trends at a 95% confidence level.
Remotesensing 11 02910 g010
Table 1. Deseasonalized correlation coefficients in the anomaly time series of the bias between CLARA-A2 and CMA SSR (surface solar radiation, W m−2) and changes in TCC (total cloud cover, %), AOD (aerosol optical depth), and API (air pollution index) at both annual and seasonal scales for the common periods.
SSR Bias vs.PeriodsAnnualSpringSummerAutumnWinter
TCC1993–2015−0.12 *−0.23 *−0.13−0.180.06
1993–20070.09−0.090.23 *0.170.08
2008–20150.08−0.050.21−0.160.49 *
AOD2001–20150.47 *0.49 *0.47 *0.40 *0.61 *
2001–20070.53 *0.69 *0.44 *0.340.57 *
2008–20150.40 *0.240.42 *0.38 *0.69 *
API2001–20120.48 *0.48 *0.59 *0.54 *0.51 *
2001–20070.24 *0.140.52 *0.250.56 *
2008–20120.43 *0.70 *0.080.30−0.12
* significant at 95% confidence level.