Article

A Point-Wise LiDAR and Image Multimodal Fusion Network (PMNet) for Aerial Point Cloud 3D Semantic Segmentation

1
AIST-Tokyo Tech Real World Big-Data Computation Open Innovation Laboratory (RWBC-OIL), Tokyo 152-8550, Japan
2
National Institute of Advanced Industrial Science and Technology (AIST), Tokyo 135-0064, Japan
*
Author to whom correspondence should be addressed.
Remote Sens. 2019, 11(24), 2961; https://doi.org/10.3390/rs11242961
Submission received: 12 November 2019 / Revised: 3 December 2019 / Accepted: 6 December 2019 / Published: 10 December 2019

Abstract

:
3D semantic segmentation of point cloud aims at assigning semantic labels to each point by utilizing and respecting the 3D representation of the data. Detailed 3D semantic segmentation of urban areas can assist policymakers, insurance companies, governmental agencies for applications such as urban growth assessment, disaster management, and traffic supervision. The recent proliferation of remote sensing techniques has led to producing high resolution multimodal geospatial data. Nonetheless, currently, only limited technologies are available to fuse the multimodal dataset effectively. Therefore, this paper proposes a novel deep learning-based end-to-end Point-wise LiDAR and Image Multimodal Fusion Network (PMNet) for 3D segmentation of aerial point cloud by fusing aerial image features. PMNet respects basic characteristics of point cloud such as unordered, irregular format and permutation invariance. Notably, multi-view 3D scanned data can also be trained using PMNet since it considers aerial point cloud as a fully 3D representation. The proposed method was applied on two datasets (1) collected from the urban area of Osaka, Japan and (2) from the University of Houston campus, USA and its neighborhood. The quantitative and qualitative evaluation shows that PMNet outperforms other models which use non-fusion and multimodal fusion (observational-level fusion and feature-level fusion) strategies. In addition, the paper demonstrates the improved performance of the proposed model (PMNet) by over-sampling/augmenting the medium and minor classes in order to address the class-imbalance issues.

Graphical Abstract

1. Introduction

The development of remote sensing techniques in recent years led to the rapid formation of the various aerial multimodal datasets in urban areas, such as aerial images, UAV images, aerial point clouds, satellite images, etc. Multimodal geospatial data is of paramount importance as it plays a crucial role in many important applications such as urban planning, environmental monitoring, assessment of urban expansion, etc., [1,2]. Observation and monitoring of the urban environment is a major challenge for remote sensing and geospatial analysis with tremendous need for working solutions and many potential applications. Urban planning benefits from keeping track of city center evolution or knowing how the land is used (for public facilities, apartments or commercial areas, etc.). Quantifying various classes in the urban environment can be used for accurate change analysis, which helps further urban planning, creating a database for developing countries where no such accurate dataset is available.
Nowadays, multiple sensors are used to measure scenes from the air, including sensors for multispectral and hyperspectral imaging (HSI), very high-resolution (VHR), and light detection and ranging (LiDAR). They bring different and complementary information such as spectral characteristics, height variations, etc., which may help to distinguish between various materials that may not be possible by single modality data. However, the availability of large scale multimodal geo-spatial data alone cannot serve any of the above-mentioned purposes, sophisticated models are also essential to automatically categorize the data. Semantic segmentation is a technique for categorizing information which assigns each pixel/point a semantic label.
In remote sensing and computer vision literature, commonly seen deep learning approaches for segmentation are binary segmentation [3] (e.g., building or not) and multiclass segmentation [4,5,6,7]. Apart from 2D based images, 3D point clouds are also available due to the recent surge in outdoor LiDAR scanning technologies. The 3D point cloud is an important geometric data structure with an irregular format. Unlike 2D images, which are stored in a structured manner that provide explicit neighborhood relations point clouds in the general case have only implicit neighborhood relations and are therefore considered as unstructured data. Due to the lack of explicit neighborhood relations point cloud segmentation is a distinct and comprehensive research field [8]. In general, there are 2D and 3D based segmentation approaches which are briefly explained in the following section.

2. Related Works

In this section, we describe recent 2D segmentation with multimodal fusion and 3D point cloud segmentation approaches in detail since those researches are closely related to our proposed method.

2.1. Image and Digital Elevation Data Fusion for 2D Segmentation Approaches

Several previous studies [9,10,11] have been proposed multimodal aerial data usage for segmentation, where, the point cloud is directly interpolated to the resolution of aerial images and further segmented by considering it as a 2.5D data [12,13]. Pan et al. [12] uses fully connected layers for fusing CNN derived multimodal features, while improved method [13] uses an end-to-end multi-level fusion using Fully Convolutional Network (FCN). These approaches use the Digital Surface Model (DSM) and multispectral data for multimodality fusion. Kampffmeyer et al. [14] have presented a FCN model that uses RGB, DSM and normalized DSM data and are concatenated into a 5-channel vector used as input. Audebert et al. [15] introduced an improved model based on SegNet, which includes multi-kernel convolution layers for multi-scale prediction.
However, in theses fusion approaches, the network has the advantage to utilize the convolution operation for both image and 2.5D elevation data. In such cases, data may be distorted especially in case of sparse data interpolation [16] and hence, the segmentation is also depending upon the efficacy of the interpolation or transformation methods. In terms of deep learning fusion model perspectives, these approaches are relatively easier, since they consider the elevation as a 2D image representation. Moreover, the transformation from LiDAR point clouds to 2.5D data or the DSM model may provide obscurity in data.

2.2. 3D Point Cloud Segmentation Approaches

Due to the non-uniform distribution and irregular sampling of points (various density across space), several previous researches transform it into regular 3D voxel grids (SEGCloud [17]) or 2D-snapshots (SnapNet [18]) before feeding into deep networks. This data transformation renders unnecessarily volume in the resulting data and also introducing quantization artifacts that can obscure such as in case of interpolation [16]. Point cloud processing in a deep learning network without generating regular data format is considered a challenging task [19]. In light of the irregular format of point cloud data, a novel approach, named PointNet that consumes raw point cloud directly has proposed by Qi et al. [20]. Such networks can provide an end-to-end classification, object detection or segmentation without the memory overheads of voxel grids or the potential loss of information from 2D image representations. PointNet++ [21] is proposed as an extension of PointNet to be able to learn deep point set features more efficiently. However, PointNet is a straight forward 3D point cloud processing platform which consumes relatively much less memory compared to PointNet++. Some researches [22,23] are also observed that PointNet++ does not provide much significant improvement in accuracy with respect to the higher memory requirement. In general, deep learning architectures such as [21,24,25], specifically designed for 3D point clouds display good results, but are limited by the size of inputs they can handle at once.
However, these deep learning networks [20,21,22,23,24,25] were not originally proposed for multimodal fusion approaches, therefore this paper proposes a Point-wise LiDAR and Image Multimodal Fusion Network (PMNet). This paper explores the 3D segmentation of large-scale airborne point cloud collected over the complex urban region with the assistance of high-resolution aerial images. The recent rapid development and availability of LiDAR survey techniques provide large scale high-resolution point clouds, which can be directly used as 3D representation instead of performing classification on 2.5D for 3D data [26]. Therefore, this research aims at considering urban aerial point cloud data as 3D representation and further utilizes the 3D geometry for point cloud segmentation by fusing features of 2D RGB aerial image.
The key contributions of our work are as follows:
  • We design an end-to-end deep neural network architecture for LiDAR point cloud and 2D image point-wise feature fusion, which is suitable for directly consuming unordered point cloud.
  • To the best of our knowledge, this is the first approach to use multimodal fusion network for aerial point cloud 3D segmentation which well respects the permutation invariance of point cloud.
  • PMNet has an advantage over 2D based models that it can incorporate multi-view 3D scanned data if available.
  • The study also evaluated the robustness of multimodality fusion by using fusion layer feature activation maps.
  • Study introduced a dataset collected from Osaka, Japan region for urban 3D/2D segmentation with detailed class labels.

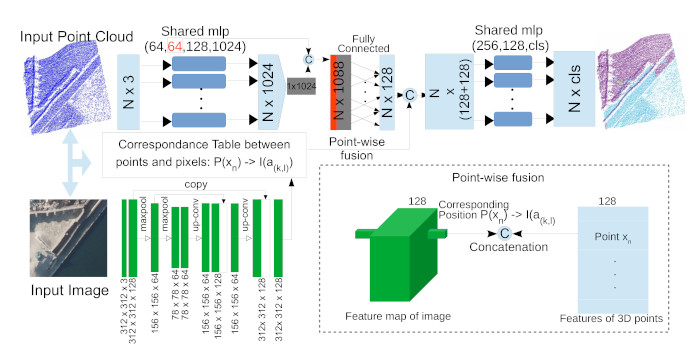
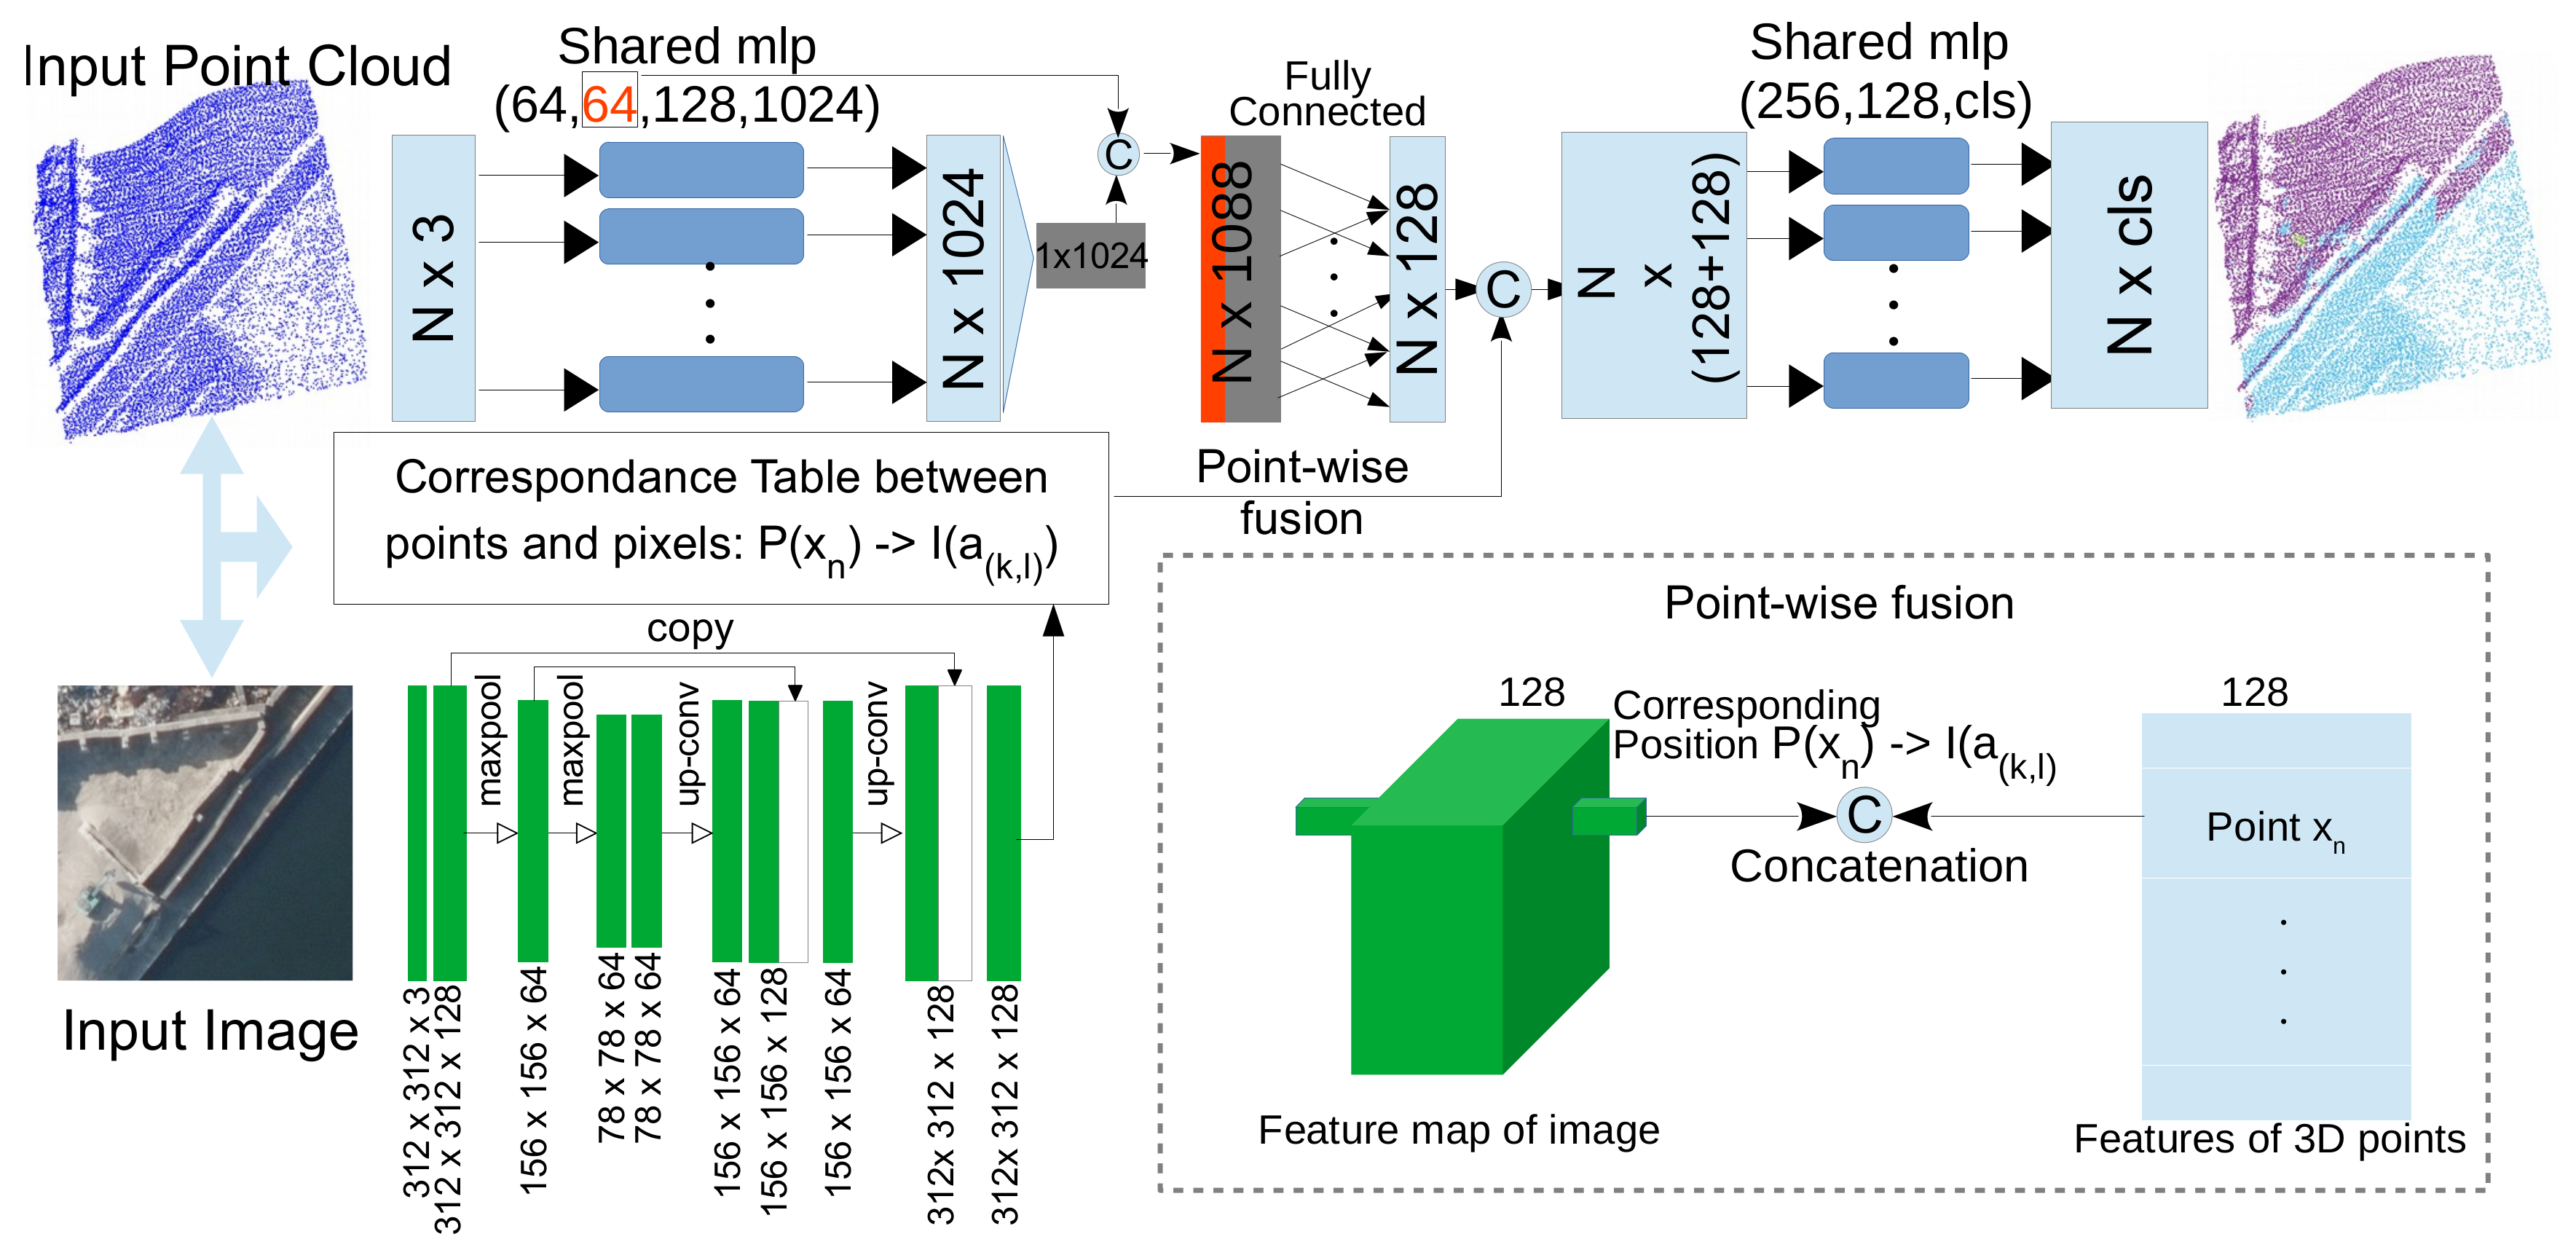
3. Methodology and Conceptual Framework

Multimodal data fusion integrates multiple data sources and produces more useful information for better performance. It can be mainly categorized into two types: (1) observational-level fusion and (2) feature-level fusion [27]. While the observational-level fusion directly combines raw datasets, the feature-level fusion integrates the feature sets derived from multimodal into a single feature set. Several researchers demonstrated the improved performance by multimodality fusion approaches [13,14,15,27]. However, the performance varies depends upon the robustness of fusion strategies and its efficacy to combine multimodal information in a more complimentary manner.
However, it is essential to evaluate whether multi-modal data fusion is necessary for the given dataset or task. In order to address this fundamental query, this research focuses on the 3D point cloud segmentation with various fusion and non-fusion approaches and evaluated the performance. If the data representation similar or transformed into a similar representation as in the case of [10,13], multimodality fusion can be carried out in numerous ways. Nonetheless, both data representation and range of values are different in LiDAR point cloud and images, and hence, the fusion approach has to respect the characteristics of both modality. In fact, the major challenges of the proposed model come from not only the multimodality of the datasets but also the shape of the data in a tensor. The point cloud has the shape of (number of patches, number points (N), feature column) and the 2D aerial image has the shape of (number of patches, rows, columns, feature column). Where, the feature column of point cloud are X,Y,Z, Intensity information and the feature column of 2D images are spectral information (R,G,B). Hence the shape of the tensor is also different from each other.
Therefore, this research adopted the basic characteristics of PointNet [20] and Encoder-Decoder Convolutional Neural Network (CNN) [4] in order to address these challenges, where, PointNet respects the permutation invariance of point cloud and CNN Encoder-Decoder used to retain the original shape of the input 2D-images. As shown in Figure 1 the proposed PMNet architecture has two backbones, one for point cloud feature extraction (PointNet part) and the other for image feature extraction (CNN Encoder-Decoder part). The proposed point-wise fusion strategy incorporates features derived from PointNet part and CNN Encoder-Decoder part. Exactly the same number as points in a patch are extracted from image-based CNN Encoder-Decoder features using a spatial correspondence table (XY coordinates index from original point cloud data). Thus, the shape of the extracted point wise image feature will be exactly similar to the point cloud (number of patches, number points (N), feature column). Further, we fuse 128 features form 2D aerial image and 128 features from point cloud using point-wise fusion and feed into the MLP. The following subsections explains the PointNet part and the Encoder-Decoder part of the PMNet in detail.

3.1. Pointnet Part of PMNet

PointNet [20] is a path-breaking deep learning network that directly consumes raw point cloud as input and output per point segment labels for each point without the need to generate regular voxels or images prior to pre-processing. However, PointNet is not proposed for multimodality fusion approaches, nonetheless, it is very suitable for unordered point cloud segmentation by respecting the permutation invariance. In its simplest form, each point is represented by its X, Y, Z coordinates in a Euclidean space. For segmentation purposes, the network aims to learn a spatial encoding for each point which is aggregated into a global point cloud signature, features are generated using multi-layer perceptrons (MLPs) and aggregated using a single symmetric function, max pooling. Per-point features are obtained by concatenating global and local feature vectors. The proposed PMNet architecture adopts PointNet as a backbone to extract point cloud features as shown in left top portion of the Figure 1.

3.2. CNN Encoder-Decoder Part of PMNet

Several novel Encoder-Decoder networks were proposed for mainly image segmentation tasks [4,28,29]. These networks are convolution-based and therefore not suitable to use as an end-to-end point cloud segmentation network, but suitable for deep feature generation from images with the same shape of the input. Therefore, this research utilizes this characteristic of the Encoder-Decoder network to extract the point-wise image features. The proposed PMNet architecture adopts CNN Encoder-Decoder as a backbone to extract image features as shown in left bottom portion of the Figure 1. Compared to other CNN networks, Encoder-Decoder could retain the original shape of the input image (e.g., 312 × 312), which makes it technically easier to extract pixel-wise features, then fuse the point-wise features by using the spatial correspondence table.

3.3. Concept of the Point-Wise Feature Fusion Strategy of PMNet

The proposed PMNet belongs to the feature-level fusion category. Fusion generally means the feature vector concatenation, in this case, we fuse image feature vector ( I ( a ) ) and point cloud feature vector ( P ( x ) ) for 3D semantic segmentation of point cloud. This section also introduces a most commonly used straight forward fusion approach Global Multimodal Fusion (GMNet). It is used to show the efficacy of the proposed point-wise fusion strategy (PMNet) by comparing with the proposed GMNet. There is a significant difference between fusion approaches of PMNet and GMNet. GMNet fuses the global feature of the whole image to point cloud features, while PMNet fuses CNN extracted local feature of spatially corresponding pixel to the point cloud. The following part briefly illustrates the formulation of PMNet and GMNet.
Deep network derived image features ( I ( a ) ) and point cloud features P ( x ) are used. 2D image features ( I ( a ) ) are derived from a deep 2D CNN Equation (1).
I ( a ( 0 , 0 ) , , a ( k , l ) ) = c o n v ( a ( 0 , 0 ) , , a ( k , l ) )
where, k , l are spatial coordinates of the pixels, c o n v is the 2D convolution operation and I ( a ) is the deep 2D features of aerial images. Point cloud features ( P ( x ) ) are derived from Multi Layer Perceptron (MLP) Equation (2).
P ( x 0 , , x N ) = g ( h ( x 0 ) , , h ( x N ) )
where, N is the number of points, h is an MLP function, g is a global max-pooling function and P ( x ) is the deep features of the point cloud. In order to fuse the multimodal features, a straight forward approach is that to flatten the 2D features ( I ( a ) ), use a fully connected layer and concatenate them as shown in Equation (3).
f ( x a 0 , , x a N ) = P ( x 0 , , x N ) f c ( I ( a ( 0 , 0 ) , , a ( k , l ) ) )
where, f c ( I ( a ( 0 , 0 ) , , a ( k , l ) ) ) is a fully connected layer which generates global image feature for each patch and concatenated (⊕) with point cloud features. Hereafter, we refer Global Multimodal feature fusion network as GMNet. GMNet contains four convolution layers with ReLU activation function, consecutive max-pooling operations and following a fully connected layer for aerial image and PointNet-like network to MLP features for point clouds and further concatenated these features. GMNet fusion strategy is more or less similar to fully connected fusion approach such as in [12], the main difference is that [12] used for 2D segmentation while GMNet used for 3D segmentation. In the case of GMNet, fusion parameters are determined by the fully connected function, and hence, local image feature representation may not be effectively fused.
However, image features are derived from a CNN with 3 × 3 kernel and therefore, it carries neighboring pixels information in a particular pixel. Therefore, it is more meaningful to fuse point cloud features with spatially corresponding pixels (Equation (4)) unlike just global image features in GMNet. Therefore, this paper proposed PMNet, which can jointly train and fuse point-wise features of 3D point clouds and corresponding 2D image for semantic segmentation with an end-to-end manner. In order to extract corresponding pixels, we need to retain the original shape of the aerial images, hence we adopted an Encoder-Decoder network which can retain the original shape of images using deconvolution/upsampling operation as in UNet [4]. In order to fuse the point-wise correspondence features, we defined a correspondence table using point cloud coordinates which have provided in the feature column of the original point cloud (input) and the aerial image patch. Point cloud index ( P ( x n ) ) has developed using a correspondence table which used for point-wise feature fusion. Fused features further processed using two MLP layers finally a softmax cross-entropy activation function for defined number classes was carried out as shown in the architecture of PMNet (Figure 1).
f ( x a 0 , , x a N ) = P ( x 0 ) I ( a ( 0 , 0 ) ) , , P ( x n ) I ( a k , l )
where, n is the index for spatial correspondence of point cloud and k , l are the coordinates of the pixels in image features and concatenated.

4. Datasets

The study applied the proposed model (PMNet) and compared it with other models at two study areas in urban environment of Osaka, Japan and University of Houston campus, USA.

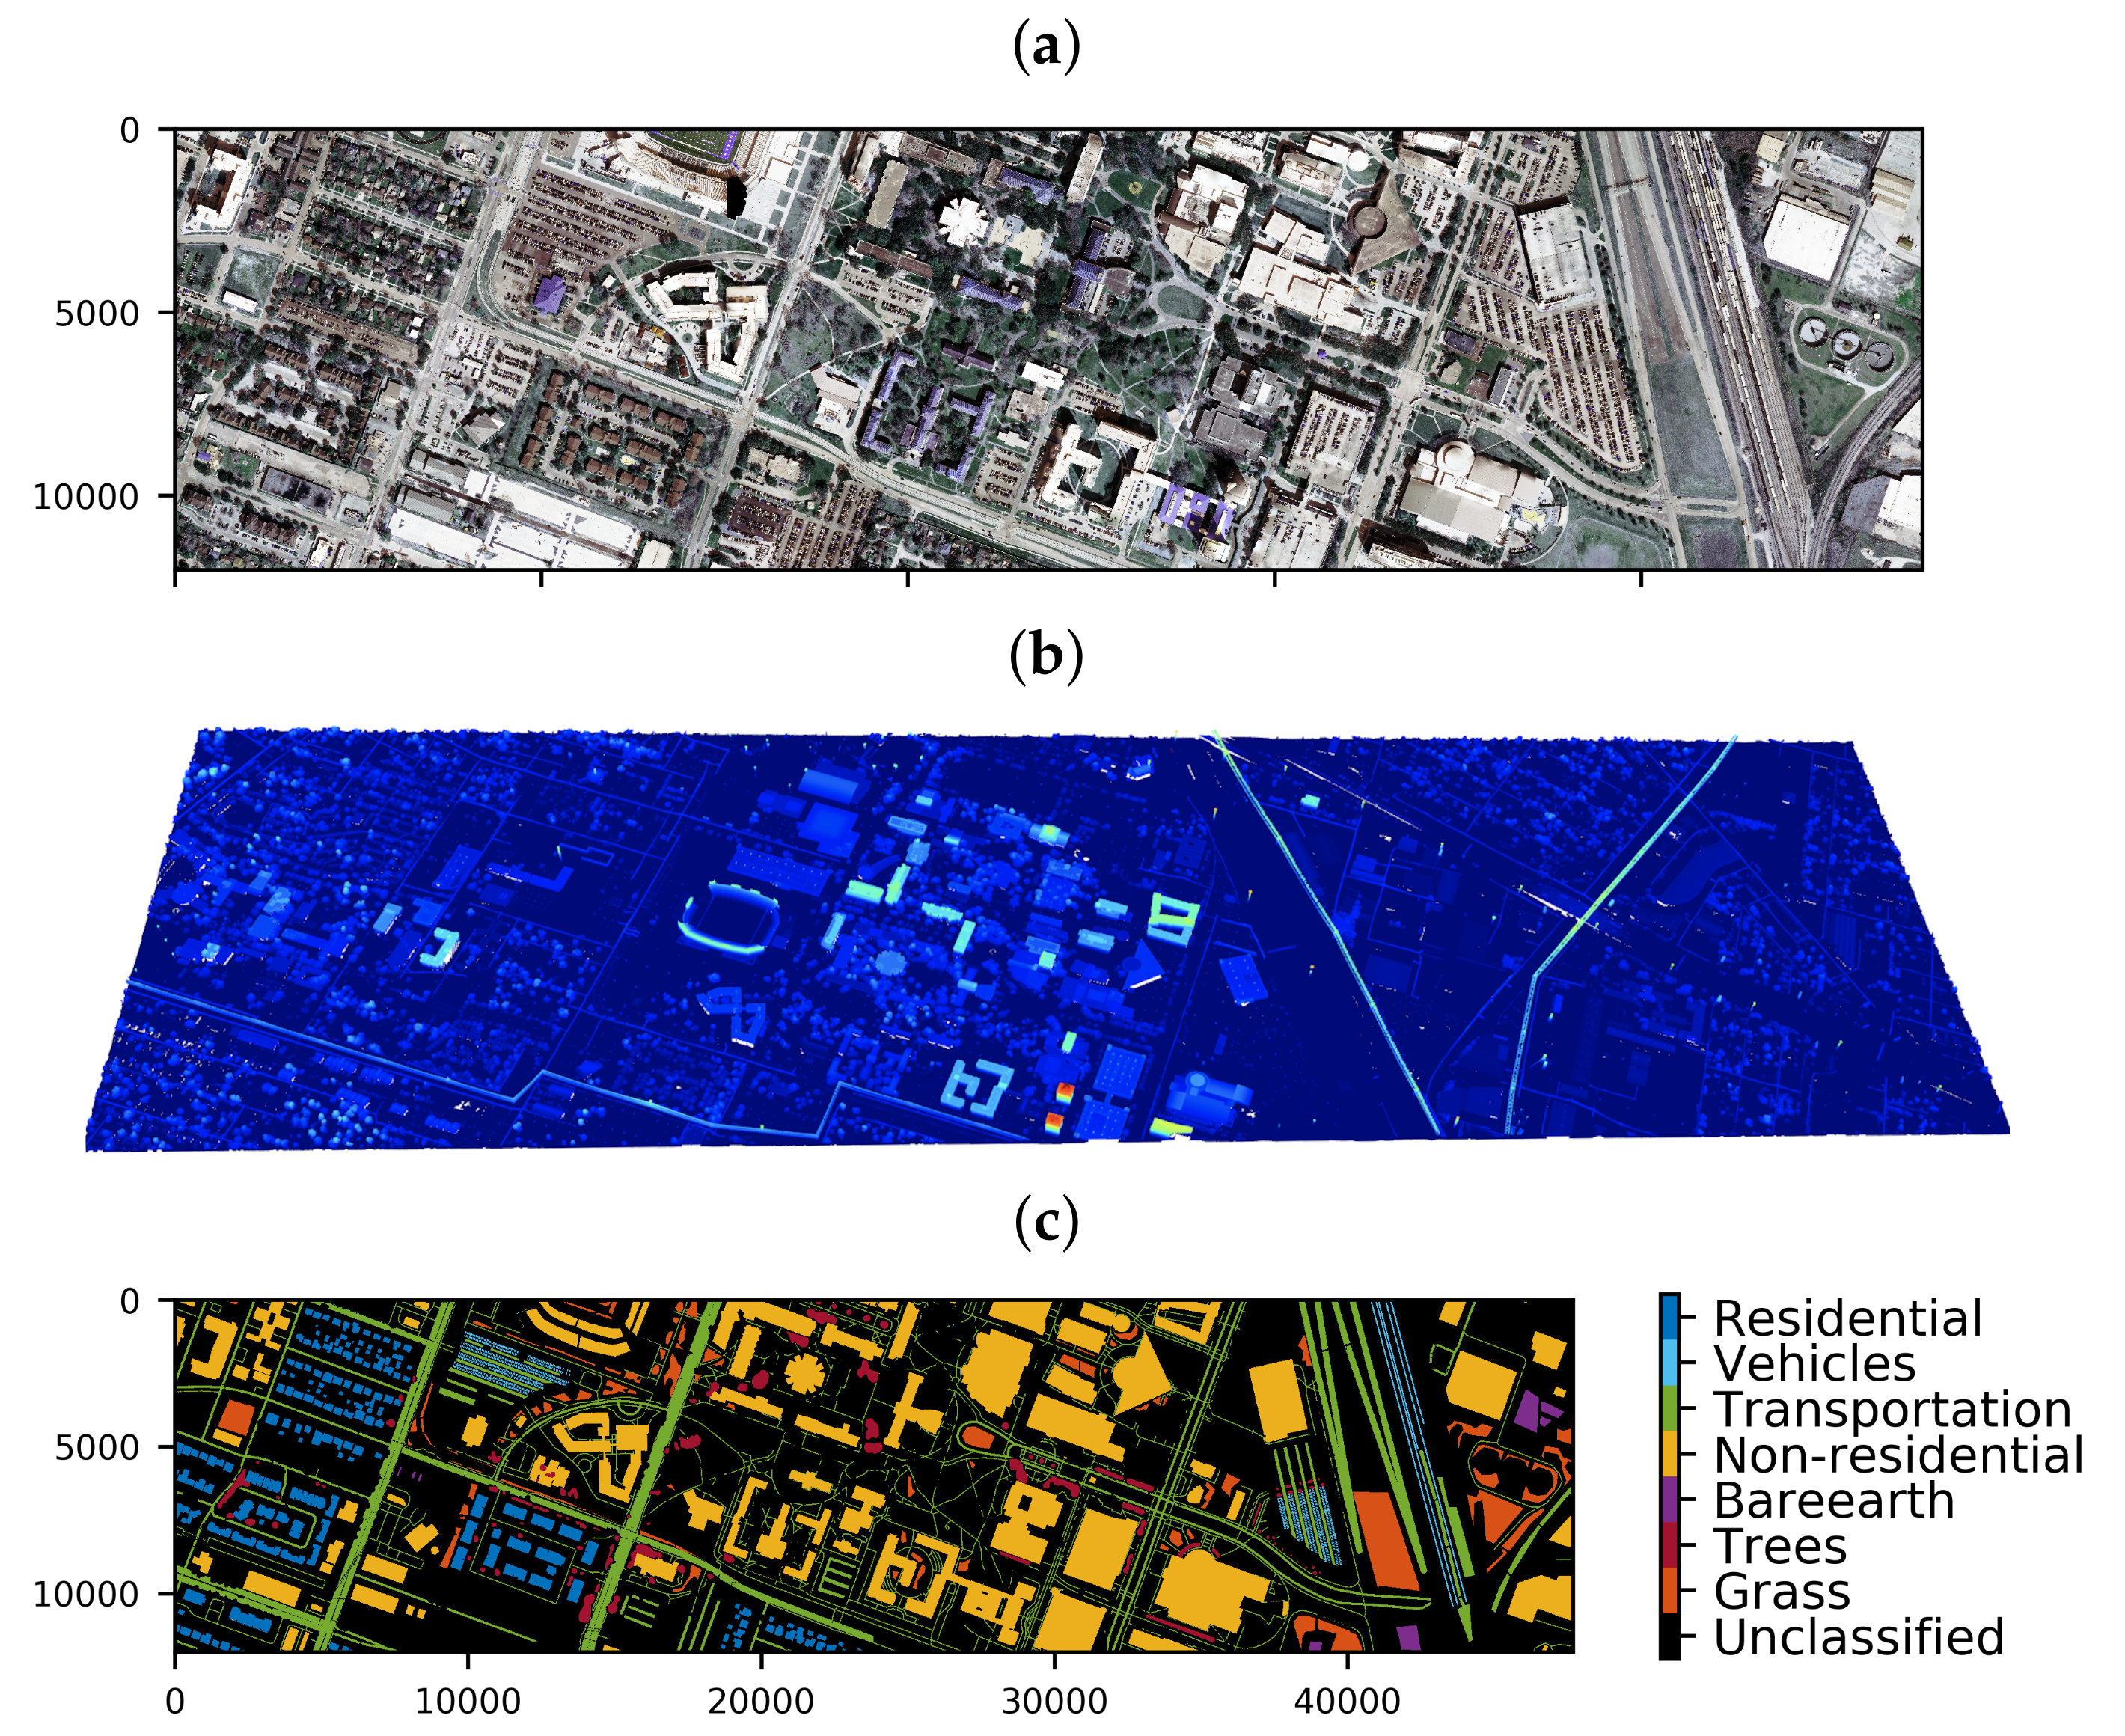
4.1. University of Houston Campus, USA Dataset

IEEE-GRSS Data Fusion is well known in remote sensing society and well organized benchmark dataset for multi-modal fusion challenges [30,31,32,33]. The University of Houston campus dataset has provided by the National Center for Airborne Laser Mapping (NCALM). Multi-sensor optical geospatial data collected from the University of Houston for a challenging urban land-cover land-use classification task. The University of Houston campus dataset is a unique dataset used for several multimodal fusion and segmentation researches [31] and the data provided as part of well known 2018 IEEE-GRSS Data Fusion Contest [32,33]. Data were acquired over the University of Houston campus, USA and its neighborhood on 16 February 2017. Ground truth (GT) labels were prepared by the organizer based on a field survey, open map information (OpenStreetMap), and visual inspection of the datasets distributed in the contest [31]. The data originally provided for urban area 2D segmentation using multimodal fusion techniques, however, this research used this dataset for the 3D point cloud segmentation task. Hence there is no direct scope for a comparative analysis with IEEE-GRSS Data Fusion challenge results.
Spatial coverage of point cloud data (“LidarPointCloudTiles”) and the aerial images were slightly different, hence, in this research, overlapping regions of “LidarPointCloudTiles” and aerial images were used (see Figure 2). The point cloud has spatial resolution of ≈0.45 m resolution with ≈11 million points and a higher resolution of aerial images (0.05 m) with pixels of 12,020 × 47,680 (0.61 km × 2.2 km). In fact, the GT label contained 20 detailed urban LULC classes with a spatial resolution of 0.5 m. Corresponding labels for point cloud are extracted by overlaying “LidarPointCloudTiles” on geo-referenced GT label. Since the GT labels are originally provided for 2D-segmentation, derived point cloud-based labels were a few for some classes. Hence, this study further merged some classes together to make more reliable classes with enough number of point clouds as well as to reduce the imbalance in the dataset. Eight classes are created such as Unclassified, Grass, Trees, Bareearth, Non-residential building, Transportation network, Vehicles, and Residential building by merging some of the relevant classes. Figure 2 shows (a) RGB, (b) LiDAR point clouds and (c) corresponding label data used in the University of Houston campus, USA dataset. Hereafter, University of Houston campus, USA dataset will be refered as UHC dataset.

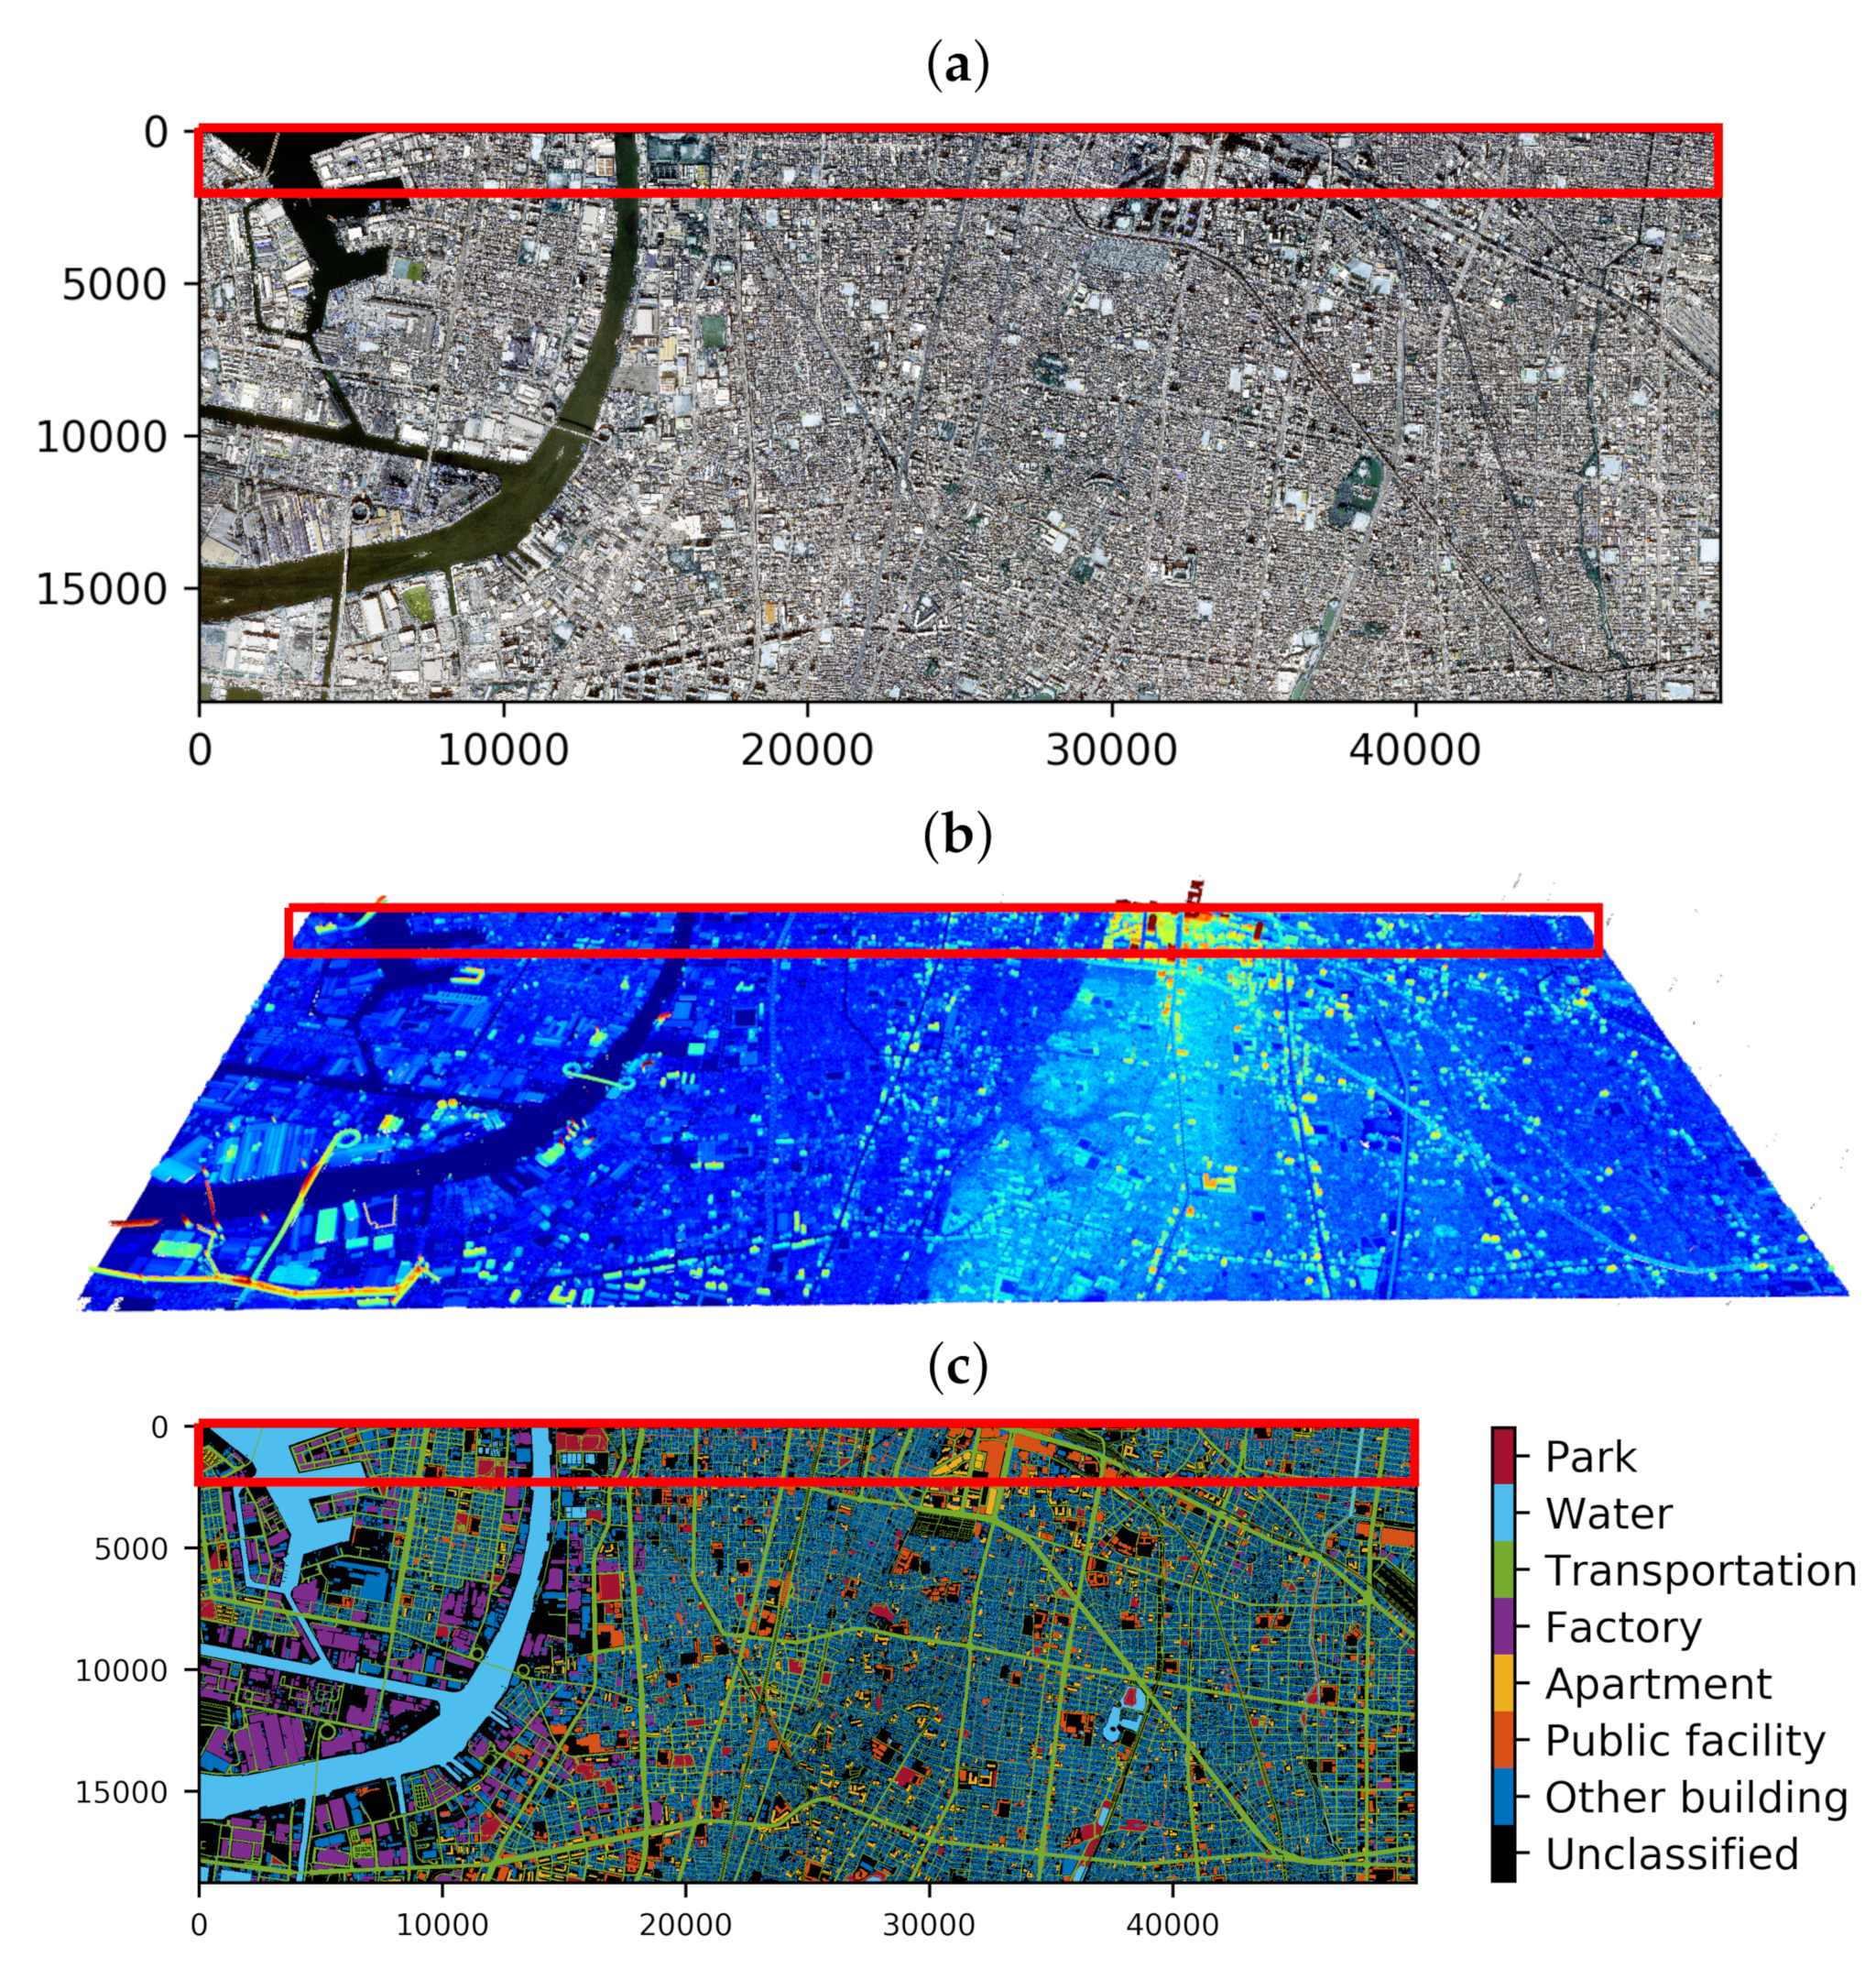
4.2. Osaka, Japan Dataset

Two separate surveys were carried out for aerial images and point clouds with a small time difference which covers a 24 km 2 area of Osaka City, Japan. Point cloud is ≈0.5 m resolution with ≈200 million points and a high resolution aerial images (0.16 m) with pixels of 18,750 × 50,000 . The accuracy of point cloud is 15 cm (vertical) and 30 cm (planimetric). Three visible channels (RGB) are available for aerial images. Both aerial images and point cloud are geo-referenced and belong to the same geographic coordinate system (Japan Plane Rectangular CS VI) and hence it is aligned perfectly in the spatial domain. Therefore, it is reliable to use for multimodality analysis for 3D segmentation. This dataset collected from a typical densely built urban area, containing hundreds of buildings per square kilometer. Eight semantic labels are defined such as Unclassified, Public facility, Apartments, Factory, Other building, Transportation network, Water and Park. Where, the Transportation network includes various roads (major highway, minor highway, primary street roads, residential roads) and railway tracks. The public facility includes hospitals, schools, and stations. Buildings which do not belong to any of the defined classes are labeled as Other building. Figure 3 illustrates the Osaka, Japan dataset, where (a) RGB, (b) point cloud and (c) corresponding labels. Hereafter, Osaka, Japan dataset will be referred as Osaka dataset.

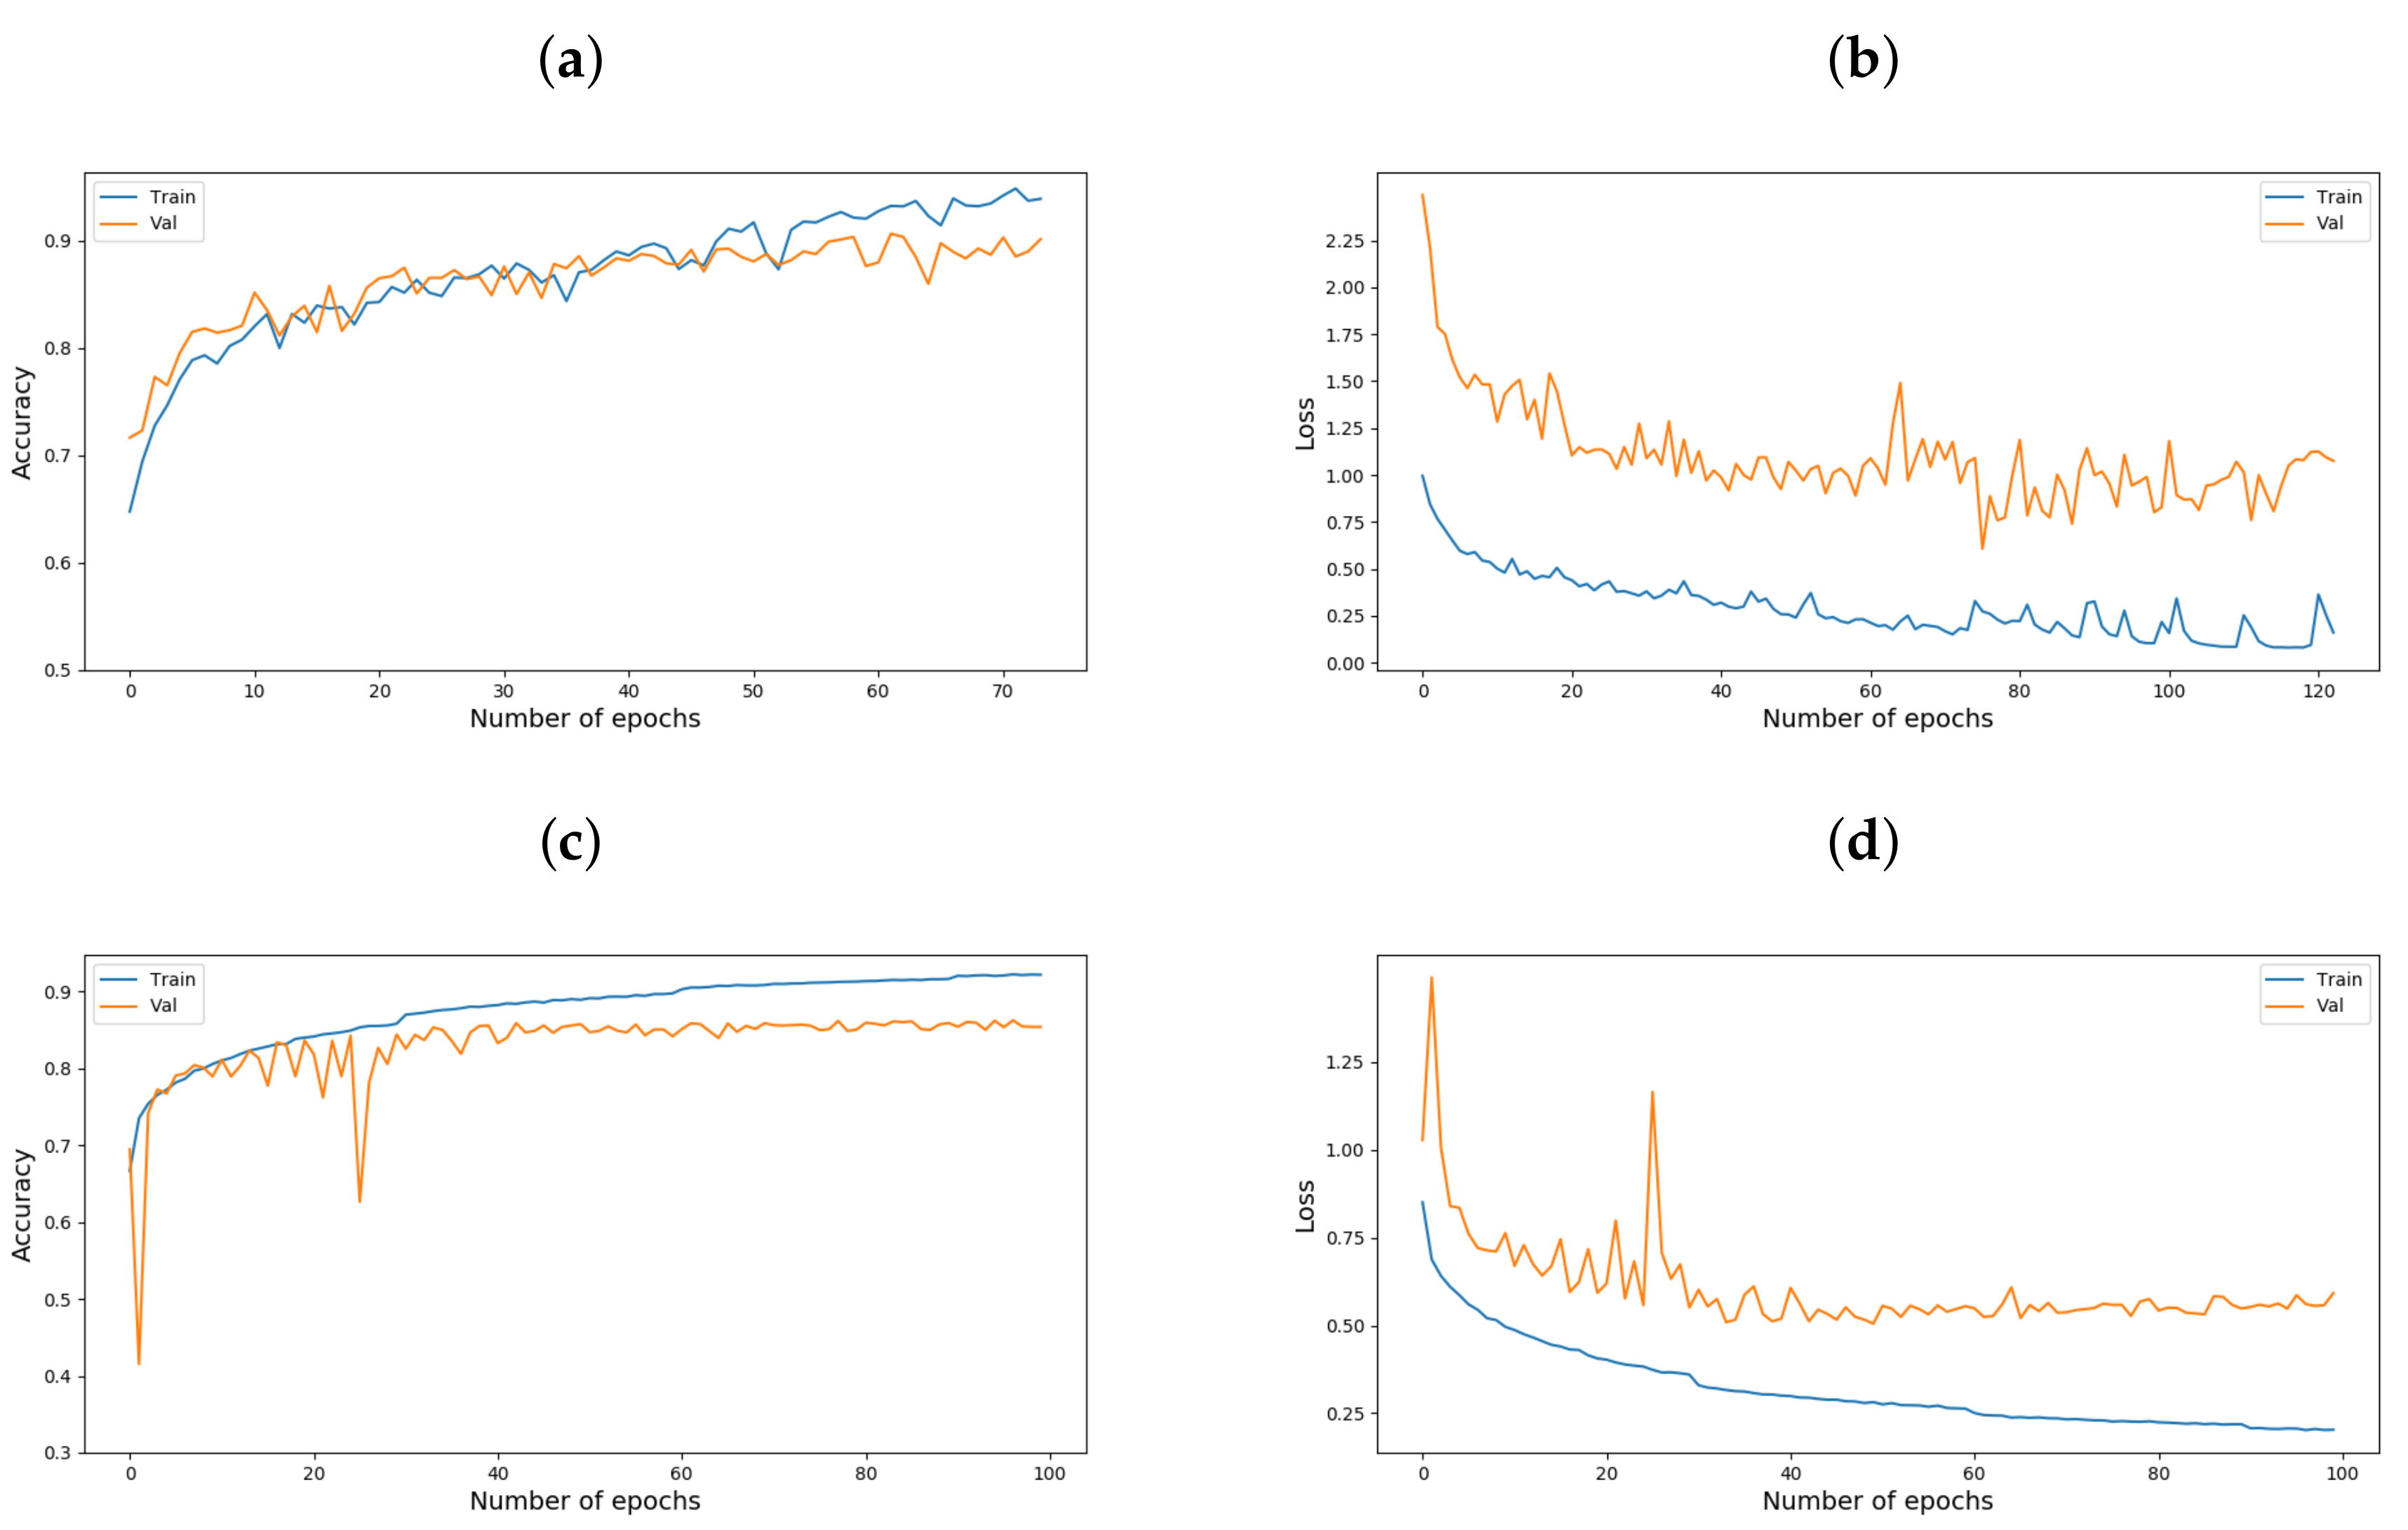
4.3. Training Set Up

Spatially aligned image and point cloud patches were created for training and validation. The patch size is defined by considering the density of the point clouds and memory constraints of the machine. Area covered by a patch in the ground varies depends upon the spatial resolution of the aerial image and point clouds. In the case of the point cloud, each patch may have a different number of points since the density of the points varies spatially. Therefore an average number of points maintained in all the patches, in some patches, points are randomly removed if the number of points is more than the average value. On the other hand, points are duplicated and appended to the available points if the number points are less than the average value.
In the case of UHC dataset, a patch (512 × 512) covers an area of 25 m × 25 m (length * width) in the ground. An average number of points (4000) maintained in all the patches. Randomly selected 60% of the whole data used for training, 20% data used for validation and 20% data are used for testing. Classes in the dataset are highly imbalanced and hence used a stratified random split of the train/validate/test dataset to represent the percentage of each class similar in train/validate/test. In case of Osaka dataset, one patch (312 × 312) covers an area of 50 m × 50 m (length * width) in the ground. An average number of points (21,463) maintained in all the patches. First of all, data of 100 m × 8 km area is separated for testing/prediction the results (see red boxes shown in Figure 3). Unlike the UHC dataset, the study could find a portion of the Osaka dataset where all the eight classes are available (red boxes are shown in Figure 3). From the remaining data (2.9 km × 8 km), patches are generated by a 20% overlap, about 80% of the data used for training and 20% data used for evaluation.
Three models (PointNet(XYZI), PointNet(XYZIRGB), GMNet) are trained to compare the performance with the proposed PMNet. Models are trained for 100 to 125 epochs with Adam optimizer and weighted softmax cross-entropy loss function (Equation (5)). In case of UHC dataset, the accuracy and loss in validation show no significant improvement from around 80 to 125 epochs and furthers indicates a slight over-fitting (Figure A1). The accuracy and loss in validation show no significant improvement from around 80 to 100 epochs and also indicates a slight over-fitting in case of the Osaka datasets (Figure A1). Hence, this study selected the best epoch among them for testing/prediction. The accuracy and loss plots of training phases are shown in the Appendix A (Figure A1) for UHC and Osaka datasets. In both the datasets, notably, the Unclassified label covers much higher percentage of points compared to other classes as shown in Figure 2 and Figure 3. Unclassified label points are not used to calculate the loss function and therefore, the final prediction results assign either of these seven classes.
l o s s = i C t i l o g ( q i )
where t i ground truth label and q i is the network derived softmax probability score for each class i in C.

5. Results and Discussion

Performance of the PMNet for 3D point cloud segmentation by fusing 2D aerial image was evaluated using two datasets. Moreover, compared the results with other models such as non-fusion (PointNet(XYZI)), observational-level fusion (PointNet(XYZIRGB)) and feature-level global fusion (GMNet) approaches. The study also compared the efficacy of the fusion strategies of the models by evaluating fusion layer feature maps. In addition, the complexities of the network also compared using computational parameters and memory requirement. This section demonstrates the results in detail, and provide a comparative analysis with other models.

5.1. 3D Segmentation Accuracy Assessment

The proposed PMNet has compared with three other point cloud 3D segmentation deep learning networks. PointNet (XYZI); which uses only point cloud, no RGB bands from aerial images are used. PointNet (XYZIRGB); used both point cloud and aerial image RGB bands and trained as 3D data. Each coordinate of LiDAR point clouds are concatenated with the spectral information and class label extracted from aerial images as well as the intensity, and hence, each point represents by XYZIRGB values. Therefore, PointNet (XYZIRGB) is considered as an observational-level fusion and vector stacking approach ([27,34,35]). GMNet, a deep feature-based fusion approach that fuses features from the point cloud and global features from aerial images. Hence GMNet is considered as a feature-level global fusion approach, these kind of approaches are generally used in multimodality fusion networks for 2D-segmentation [12,13,14,15]. The following section qualitatively and quantitatively evaluate the performance of 3D segmentation for each model.

5.1.1. Quantitative Analysis

Table 1 and Table 2 show the quantitative evaluation of the test results for different deep learning models. The Table 1 and Table 2 use matrices such as class-based accuracy, average class accuracy (Avg.CA) and overall accuracy (OA) to evaluate the performance in detail.
In the case of UHC dataset, PointNet(XYZIRGB) shows significant improvement compared to PointNet(XYZI) in terms of both Avg.CA (0.68) and overall accuracy (0.82), and hence, it is evidenced that the even simple observational-level fusion improves the performance than using only XYZI data (Table 1). However, Table 1 also clearly shows that the PMNet significantly outperforms other models in terms of Avg.CA (0.77) and OA (0.89). GMNet and PointNet(XYZIRGB) perform more or less similar in the case of UHC dataset. Except for Bareearth class, PMNet outperforms other GMNet with a significant improvement. However, these analyses show that PMNet seems to be having a more effective fusion strategy compared to the observational-level fusion (PointNet(XYZIRGB)) and global feature-level fusion (GMNet). Some classes like Bareearth show relatively lower accuracy in all the models, since the number of samples much less; this issue has discussed in detail in Section 5.3.
In case of the Osaka dataset, PointNet(XYZIRGB) shows an improvement compared to PointNet(XYZI) in terms of both average class accuracy (0.65) and overall accuracy (0.79), and hence, it is evidenced that the even simple observation-level fusion improves the performance than using only XYZI data (Table 2). Osaka study area is a relatively complex urban area with densely covered buildings. Hence, it is a challenging task to accurately classify more or less similar visual representation classes such as Other buildings, Public facility, Apartment, and Factory. In general, results show that PMNet outperforms all the other models in terms of Avg.CA (0.68) and OA (0.81). PMNet performs better in class-based accuracy for all the classes other than Public facility and Apartment class. However, Table 2 clearly indicates that the usage of RGB information significantly improves performance. Some classes like Apartment and Public facility show very low accuracy in the case of all the models mostly due to the very low percentage of samples, this issue has discussed in detail in Section 5.3.

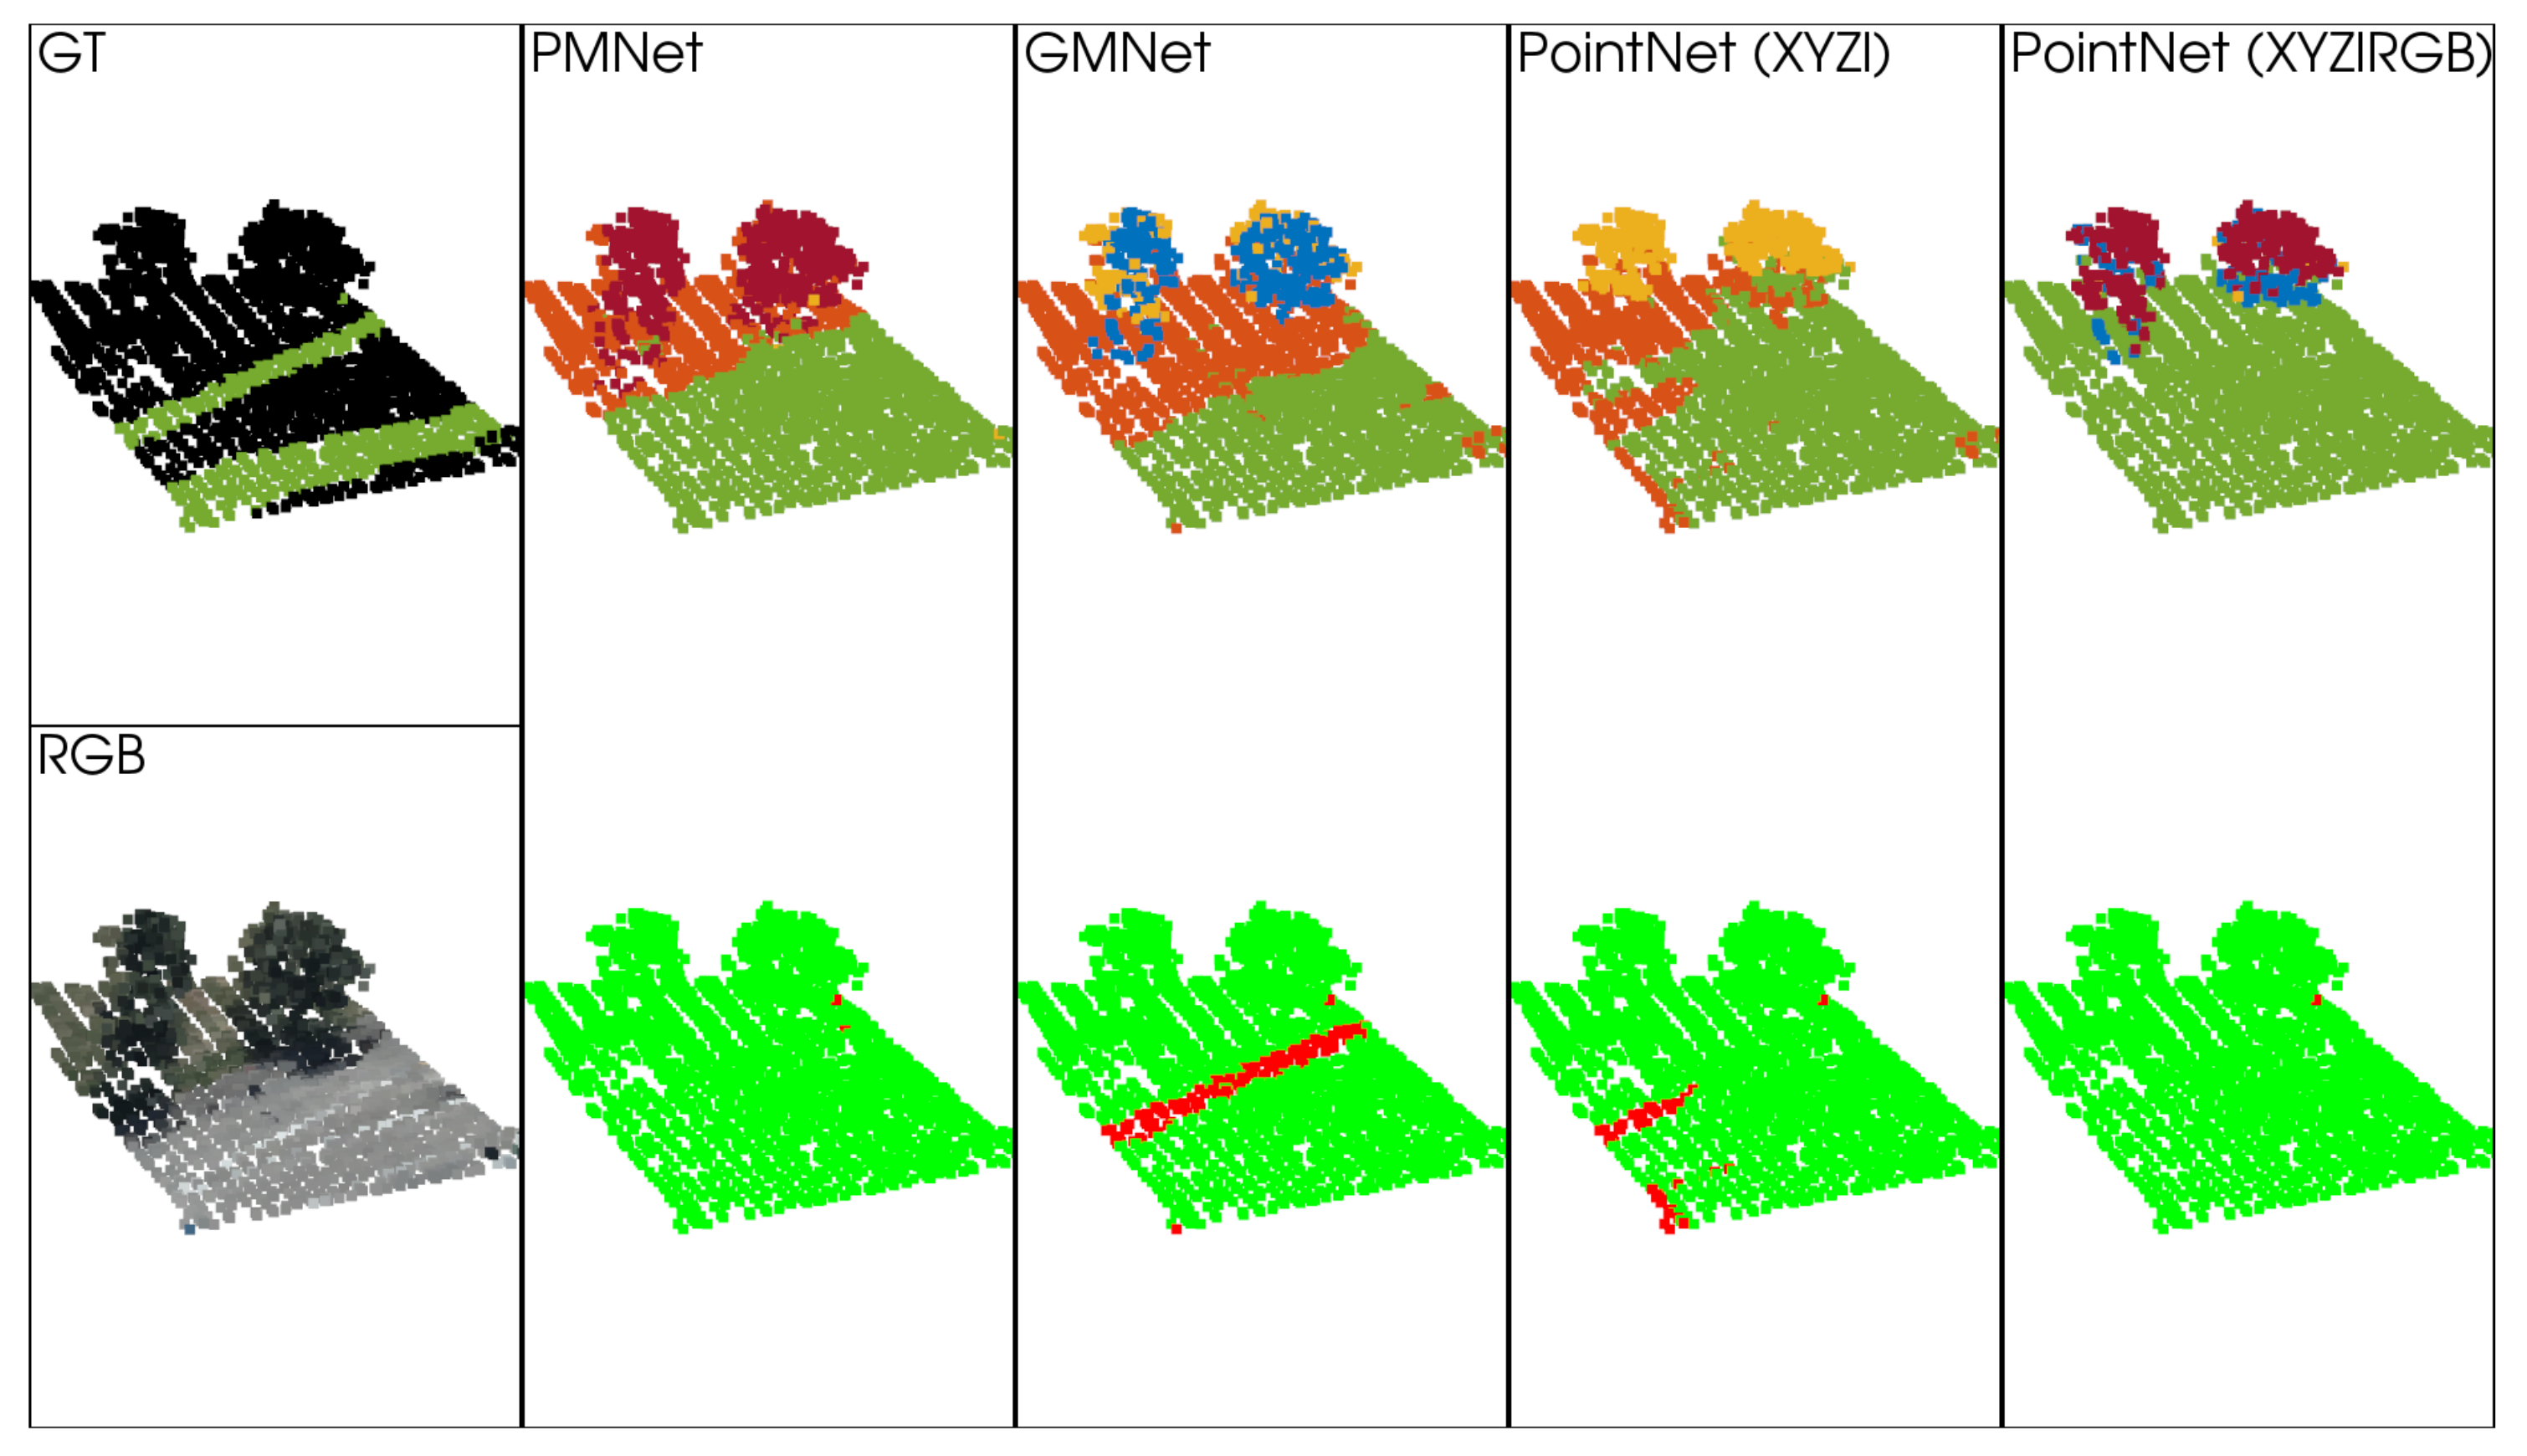
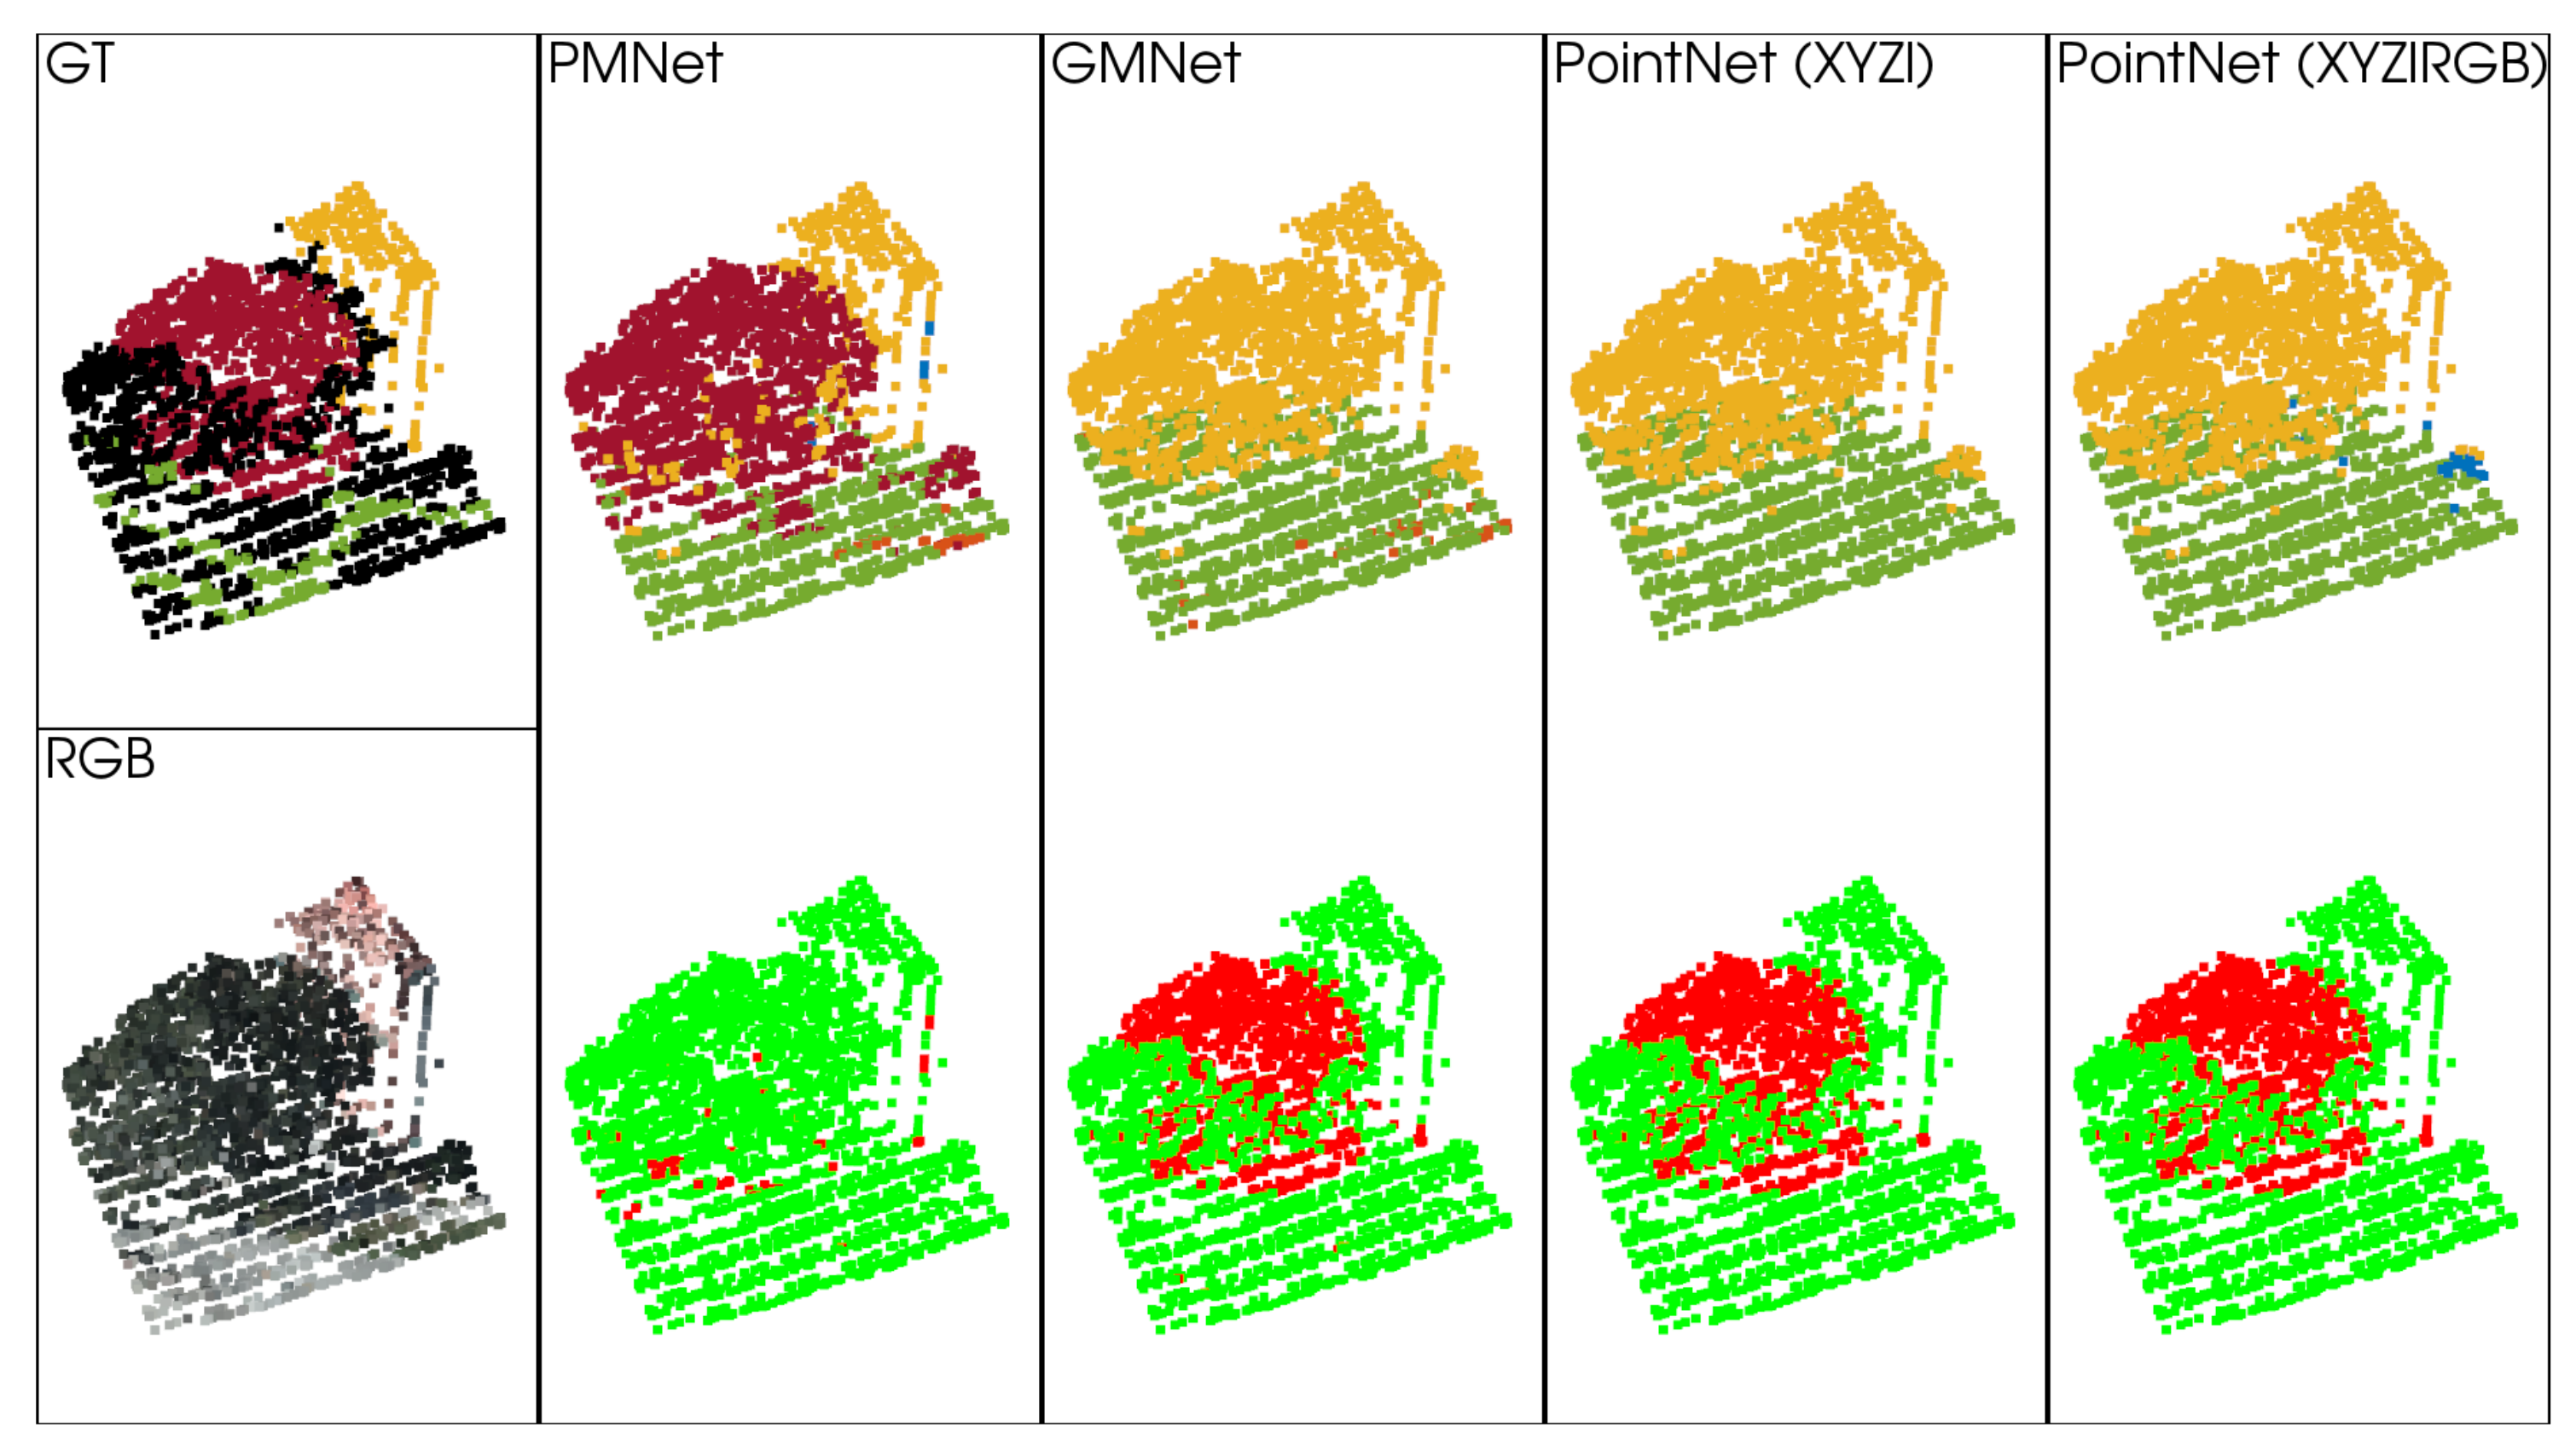
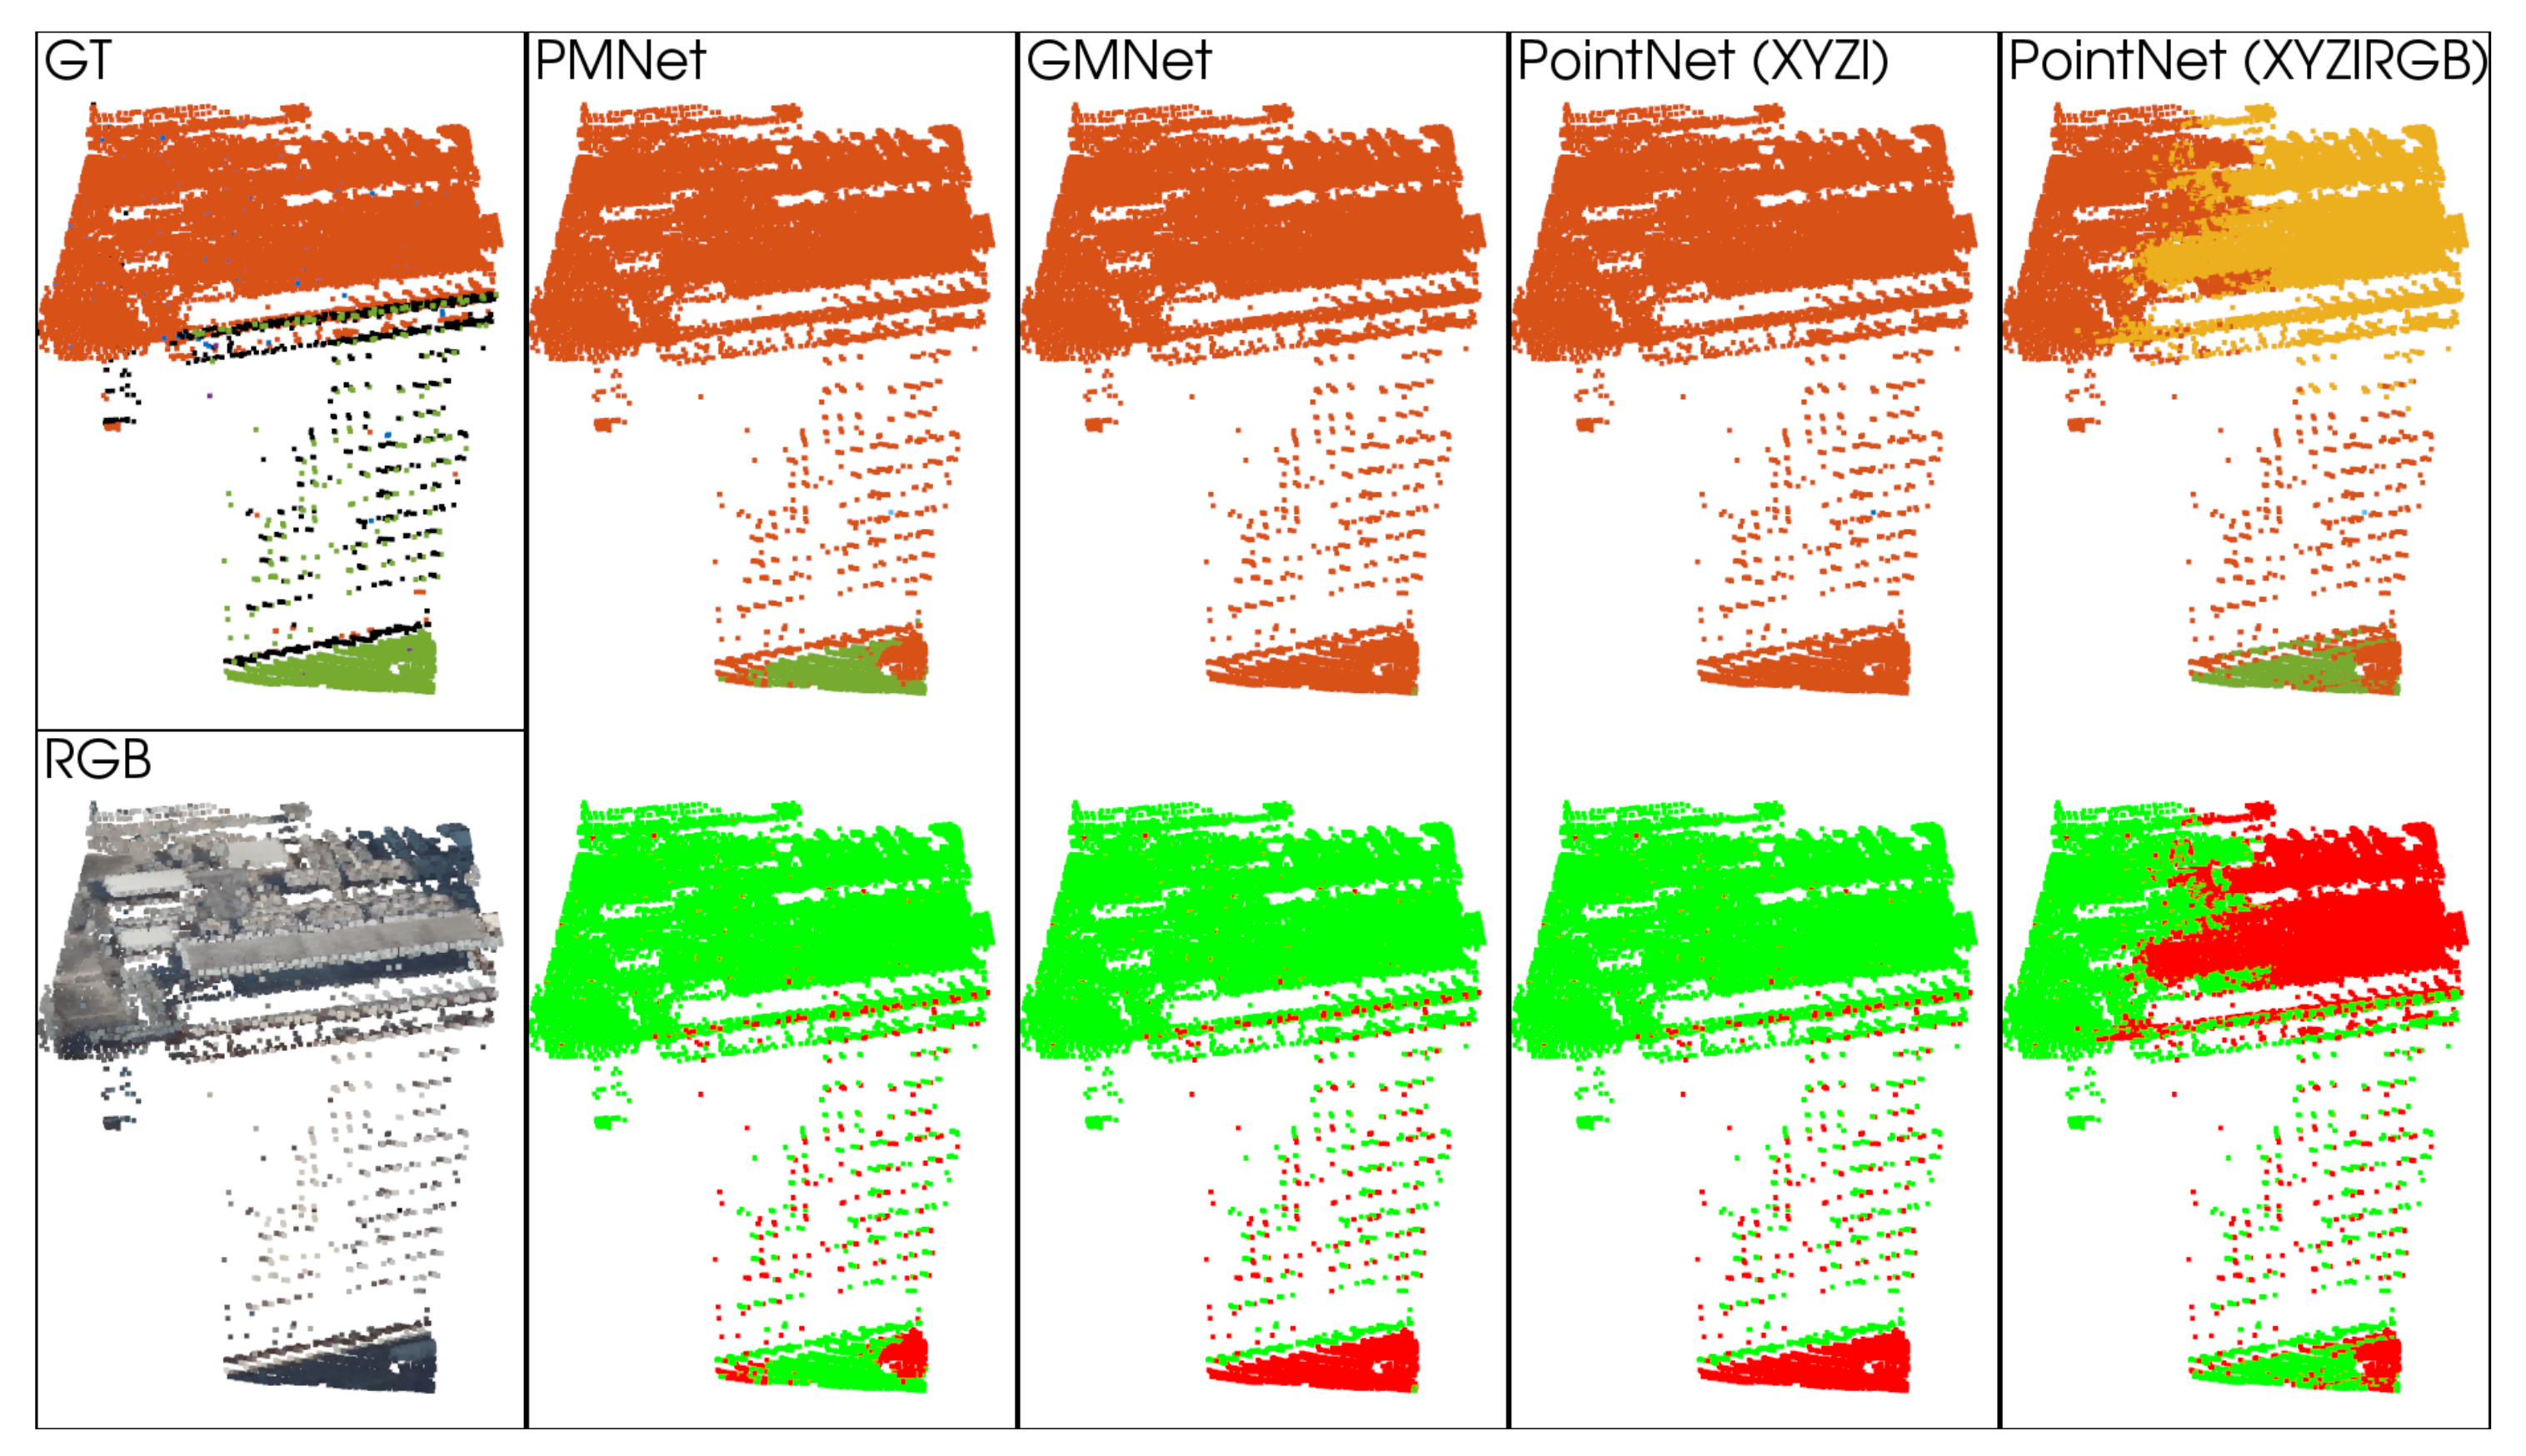
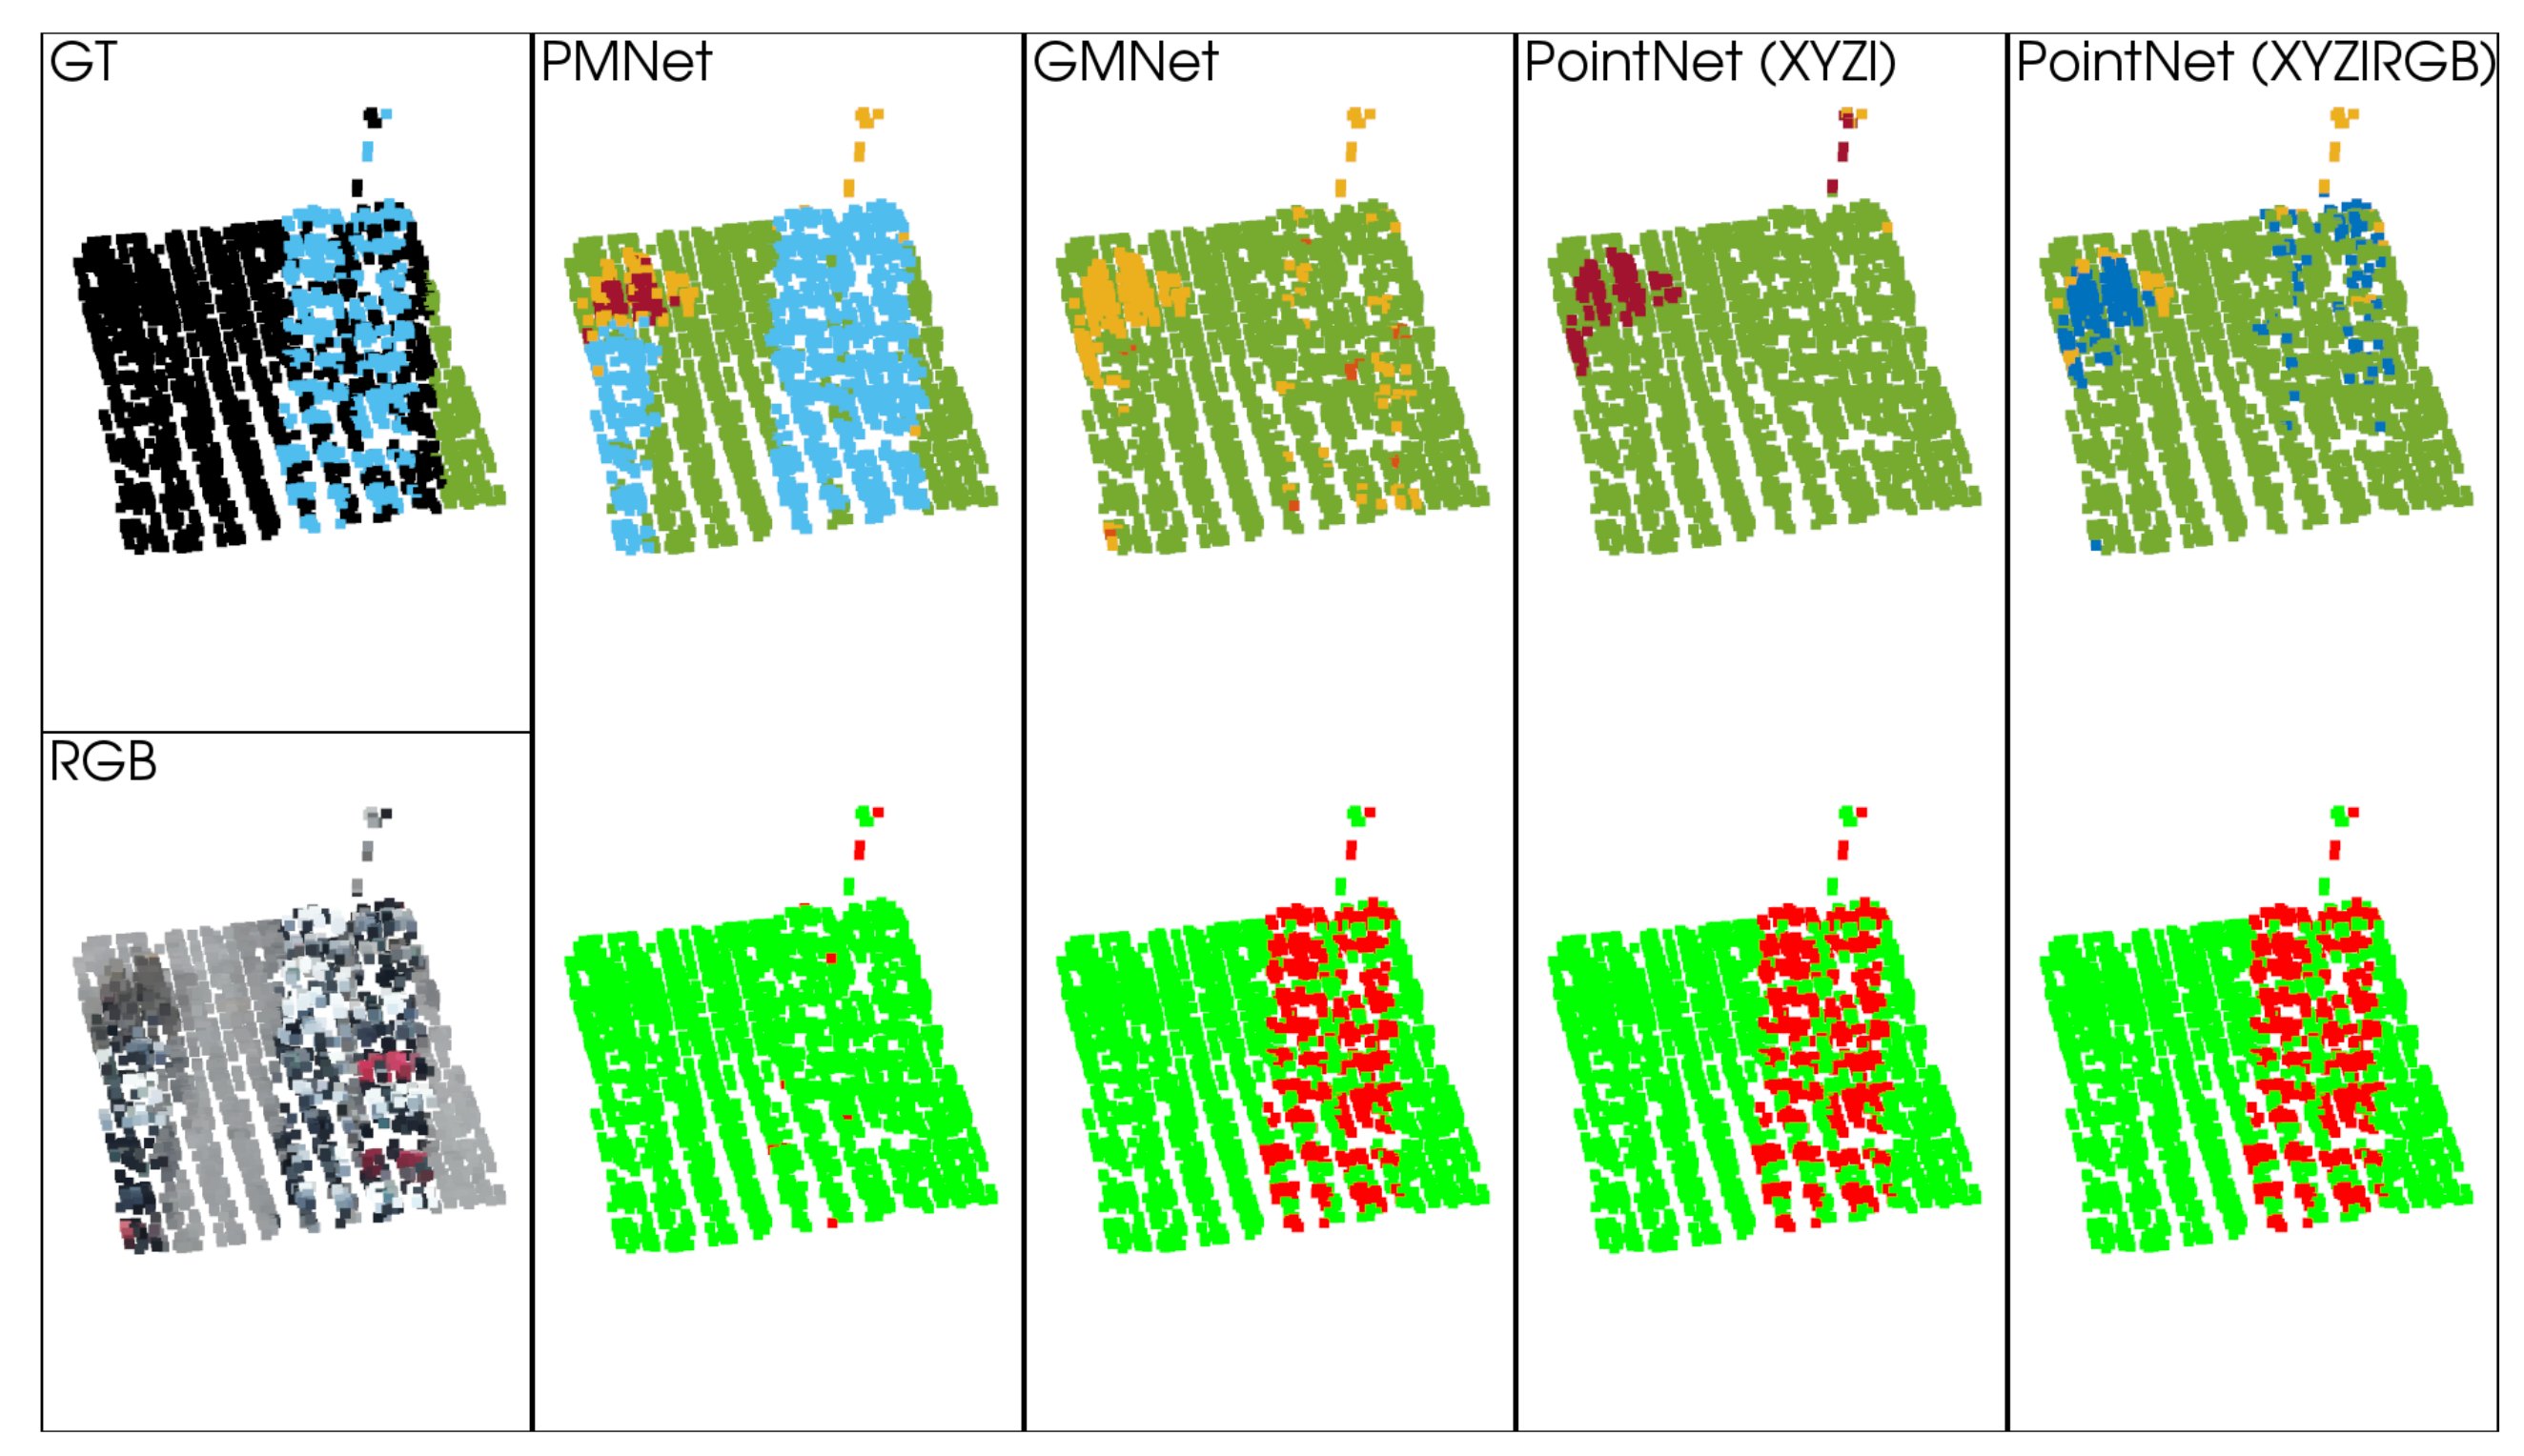
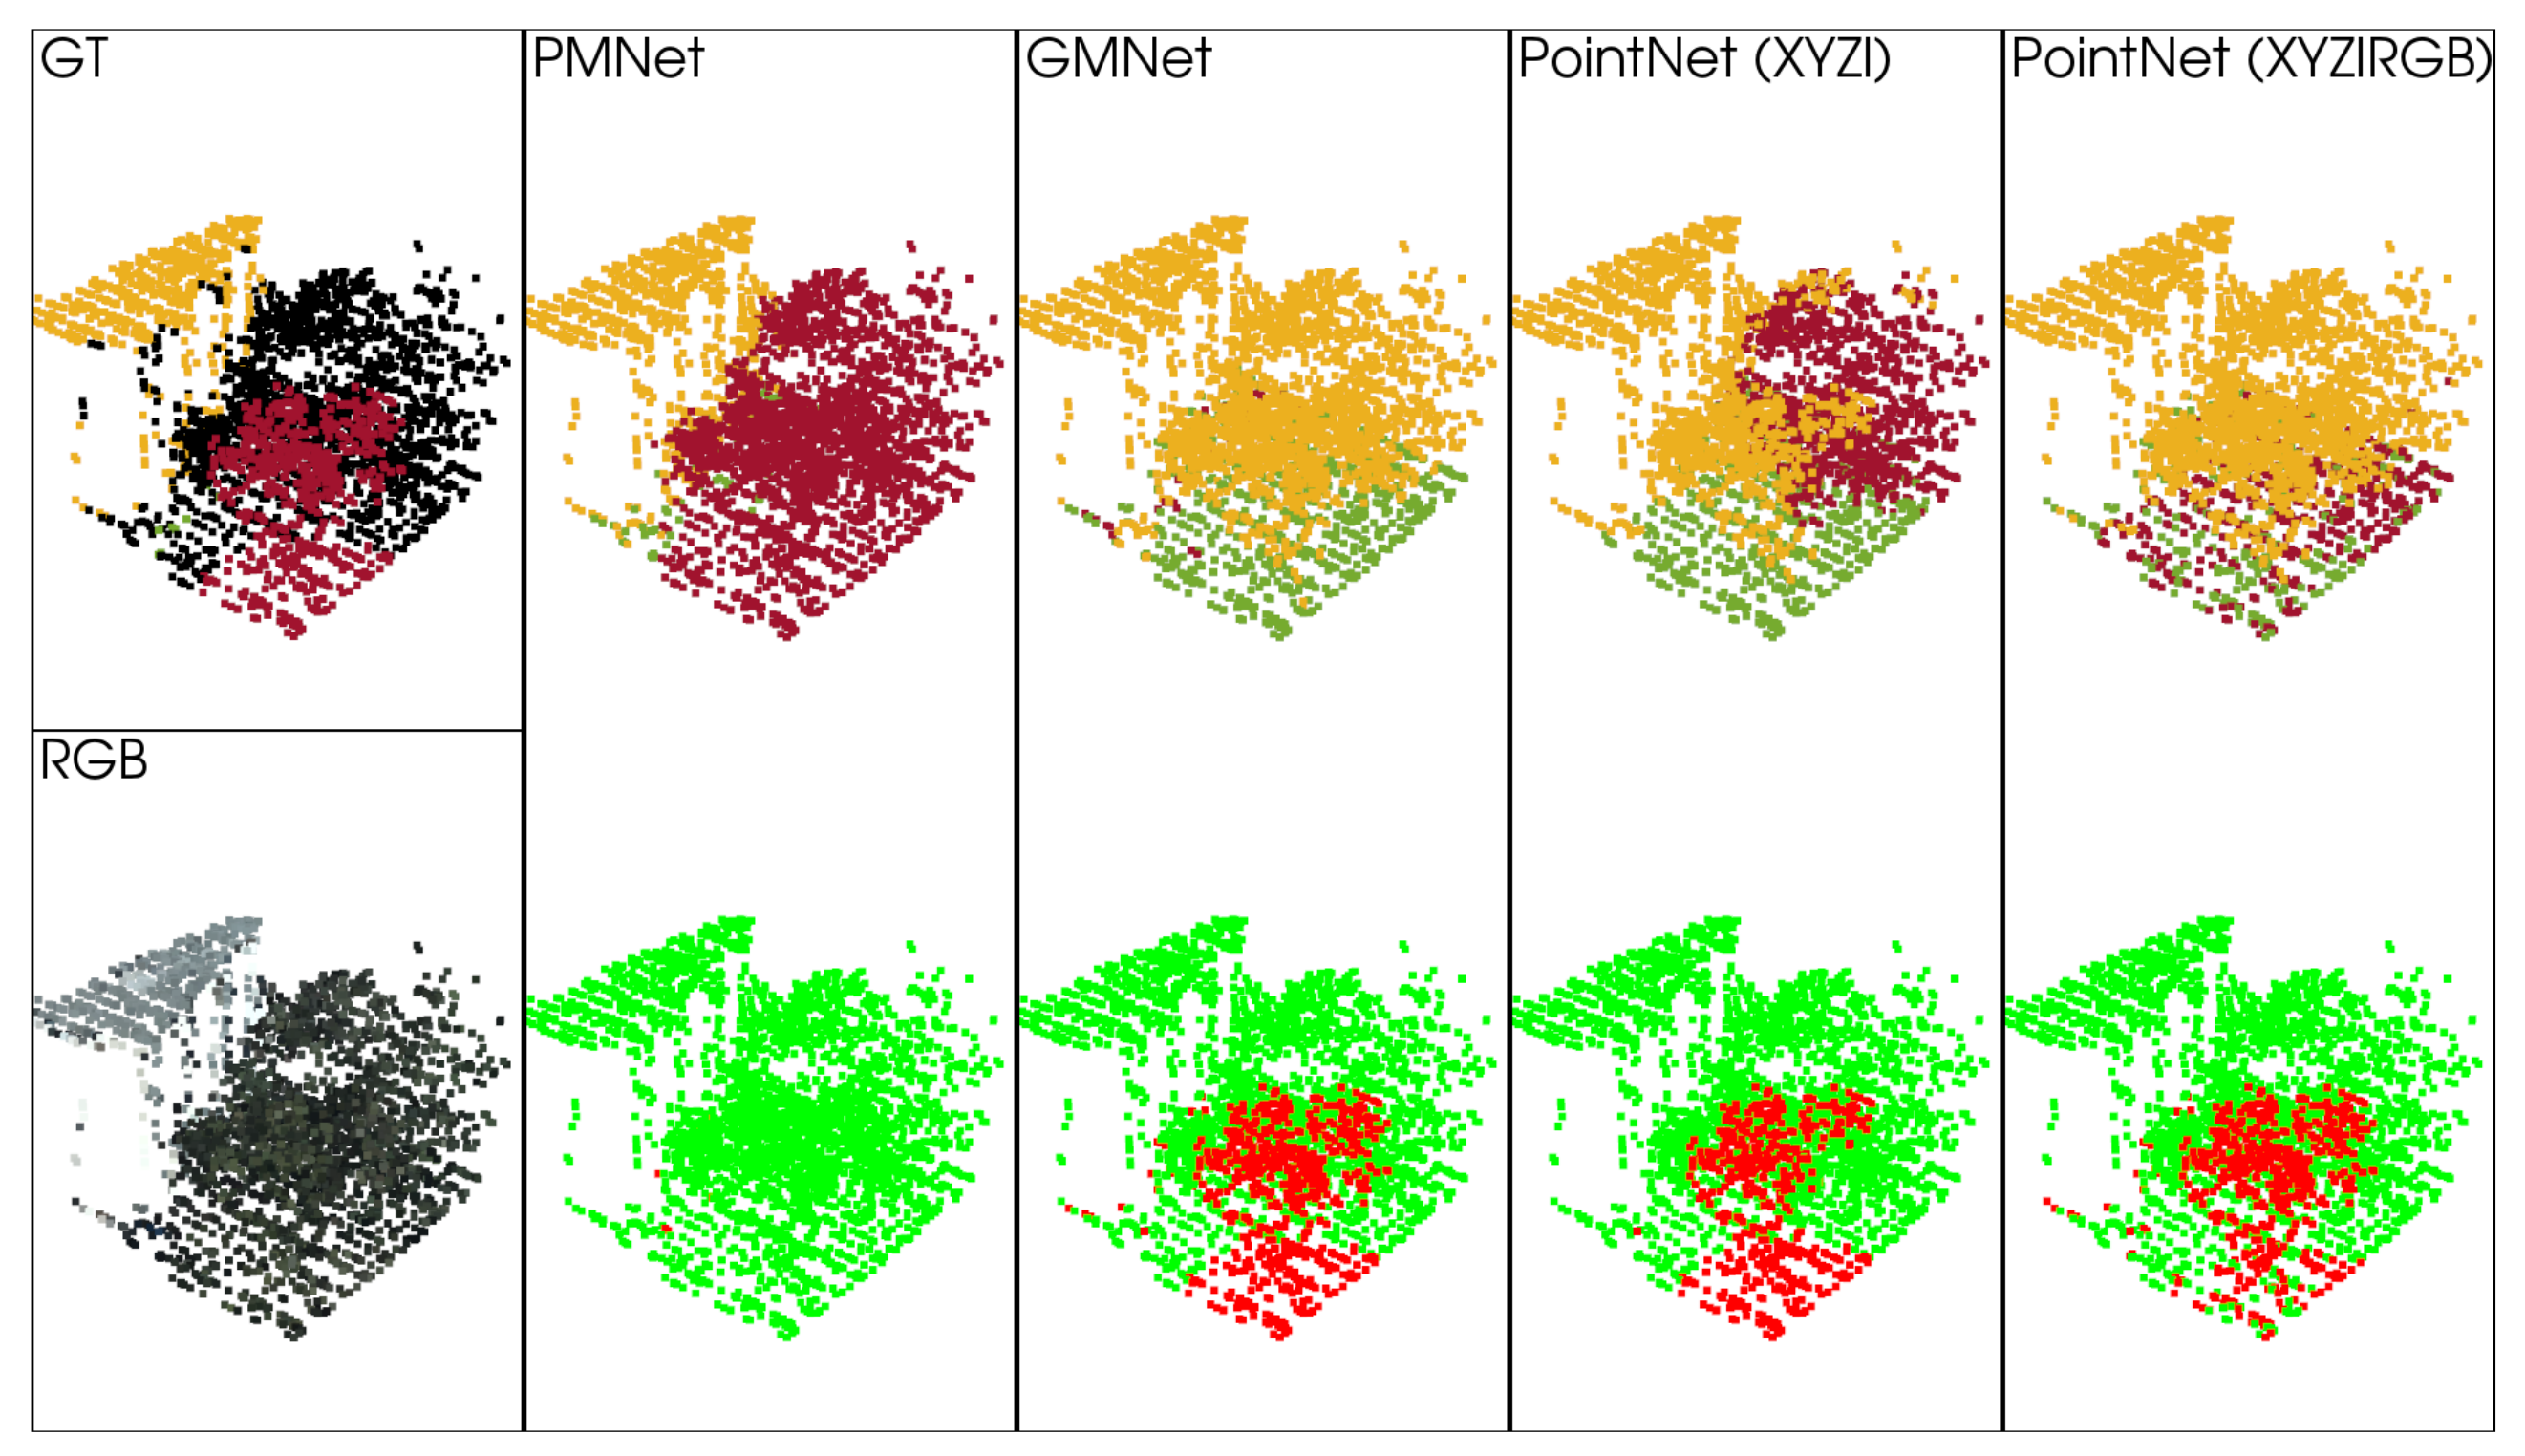
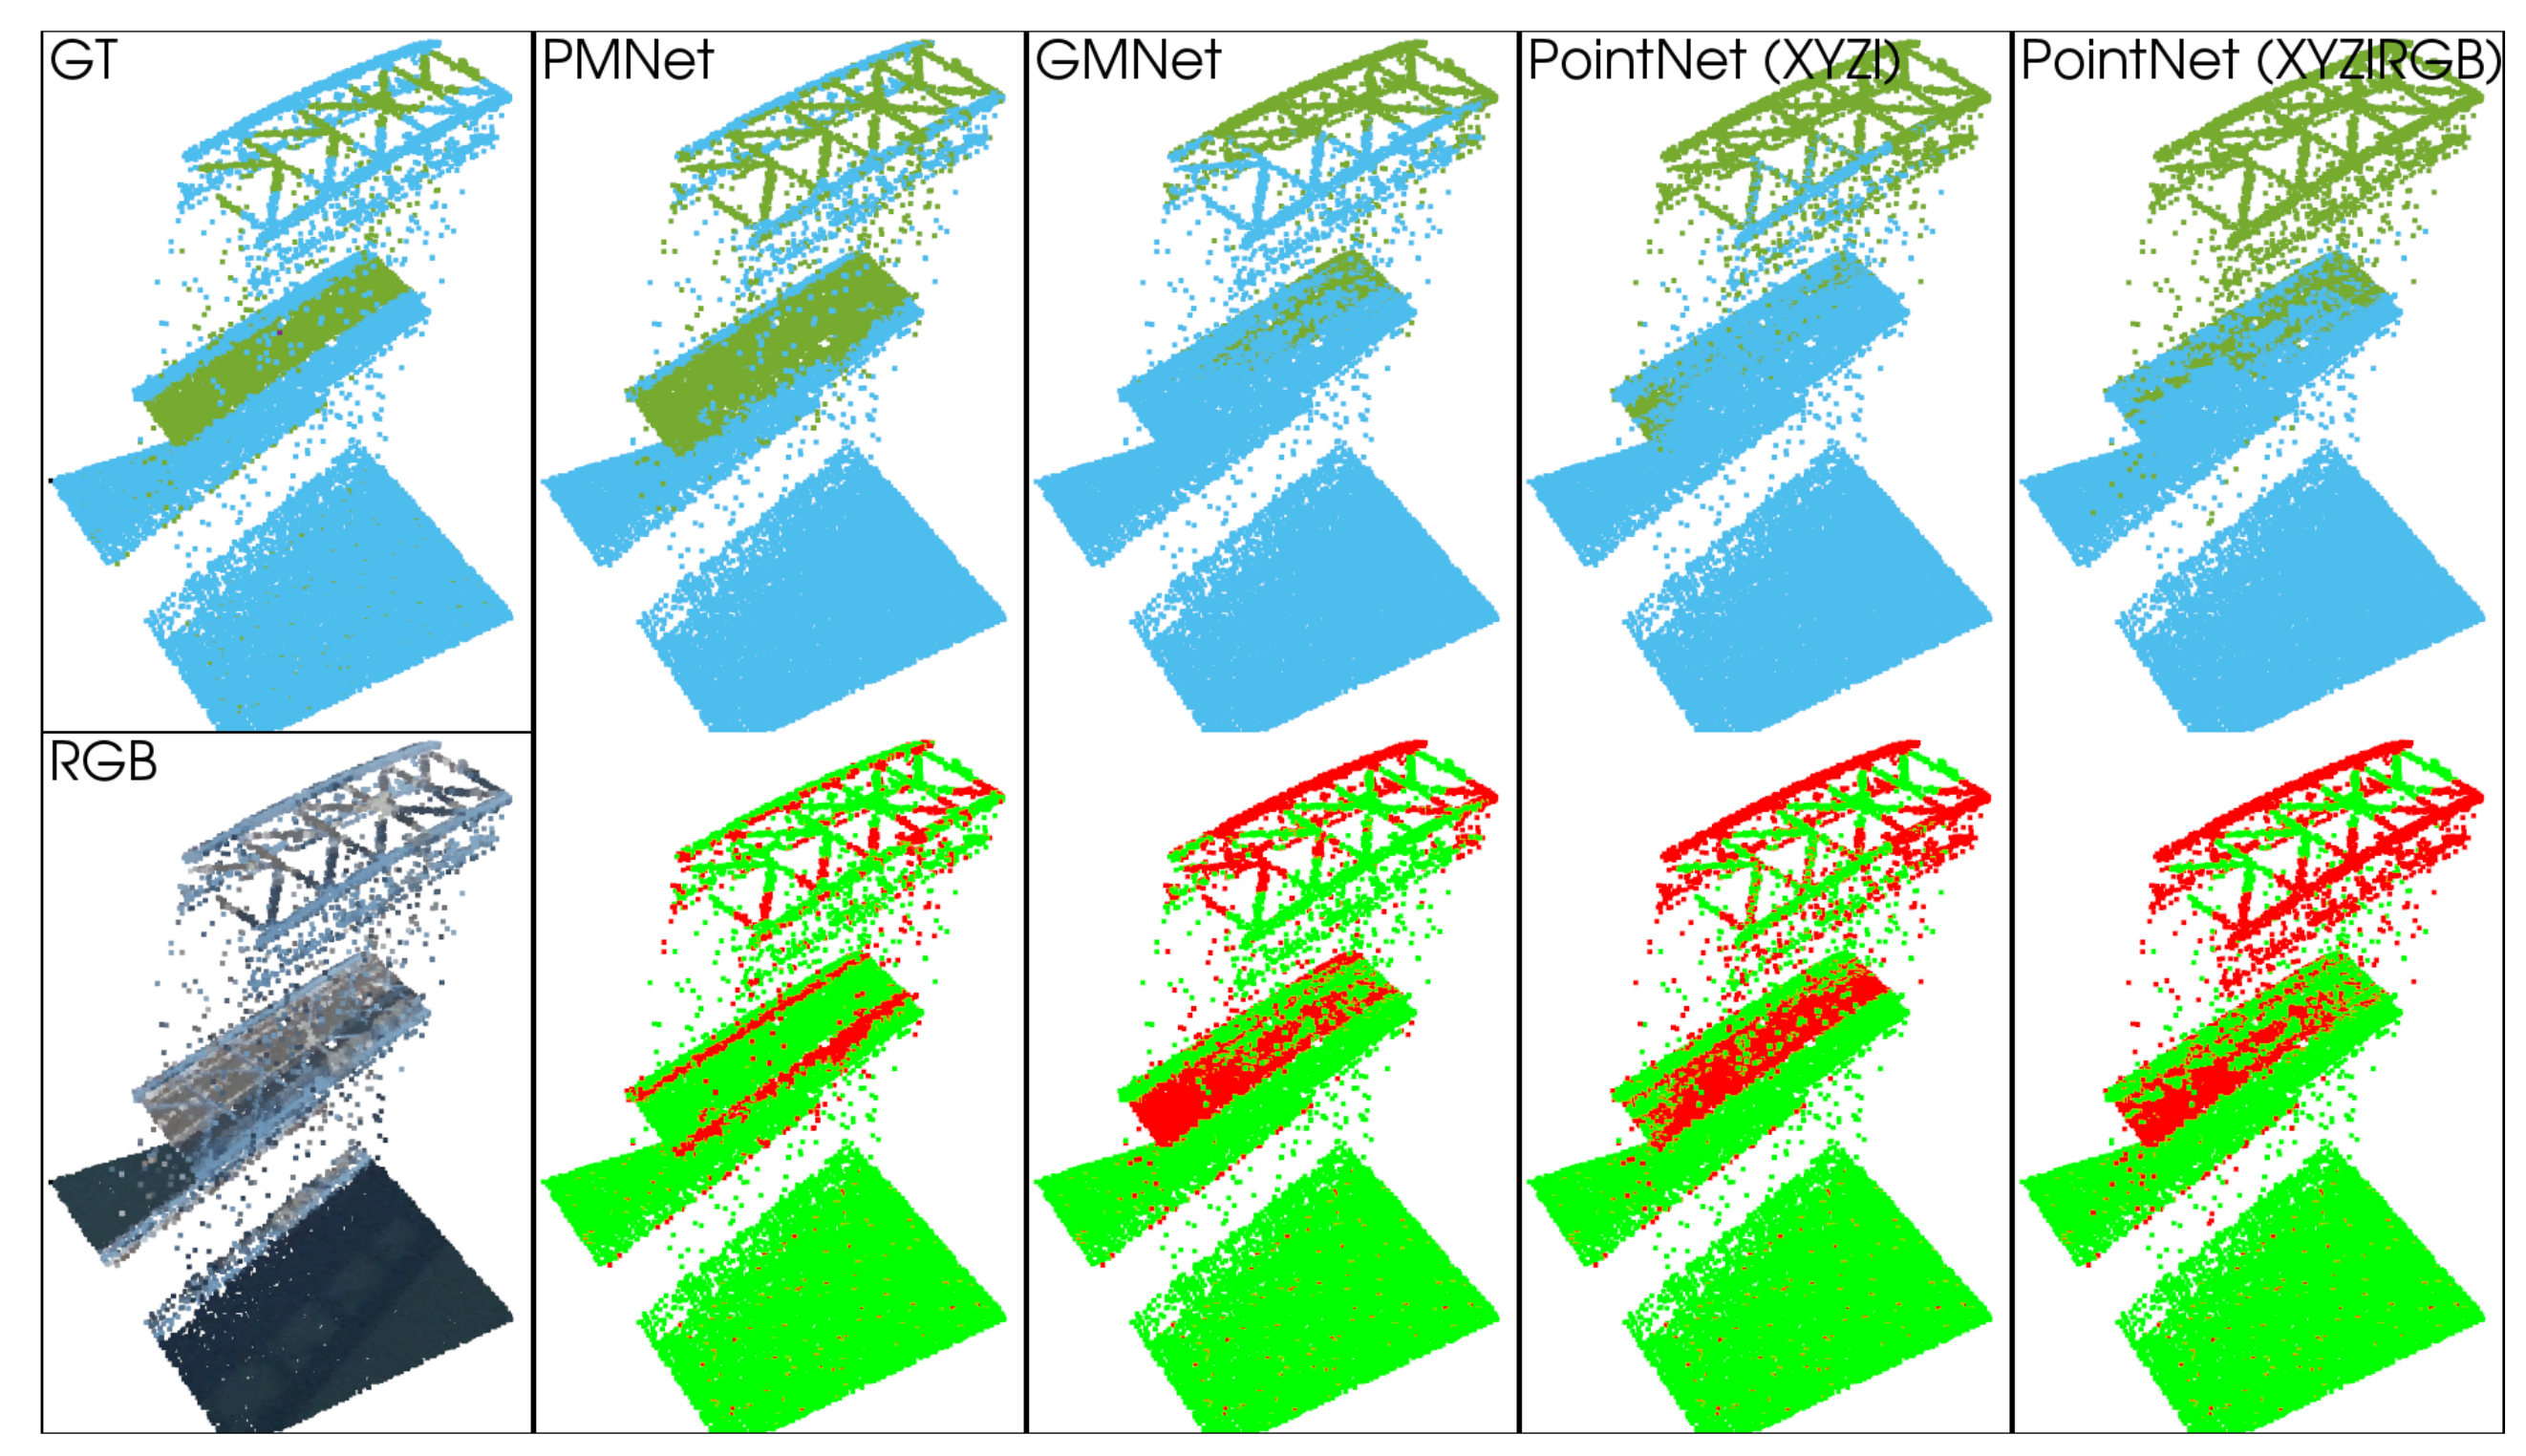
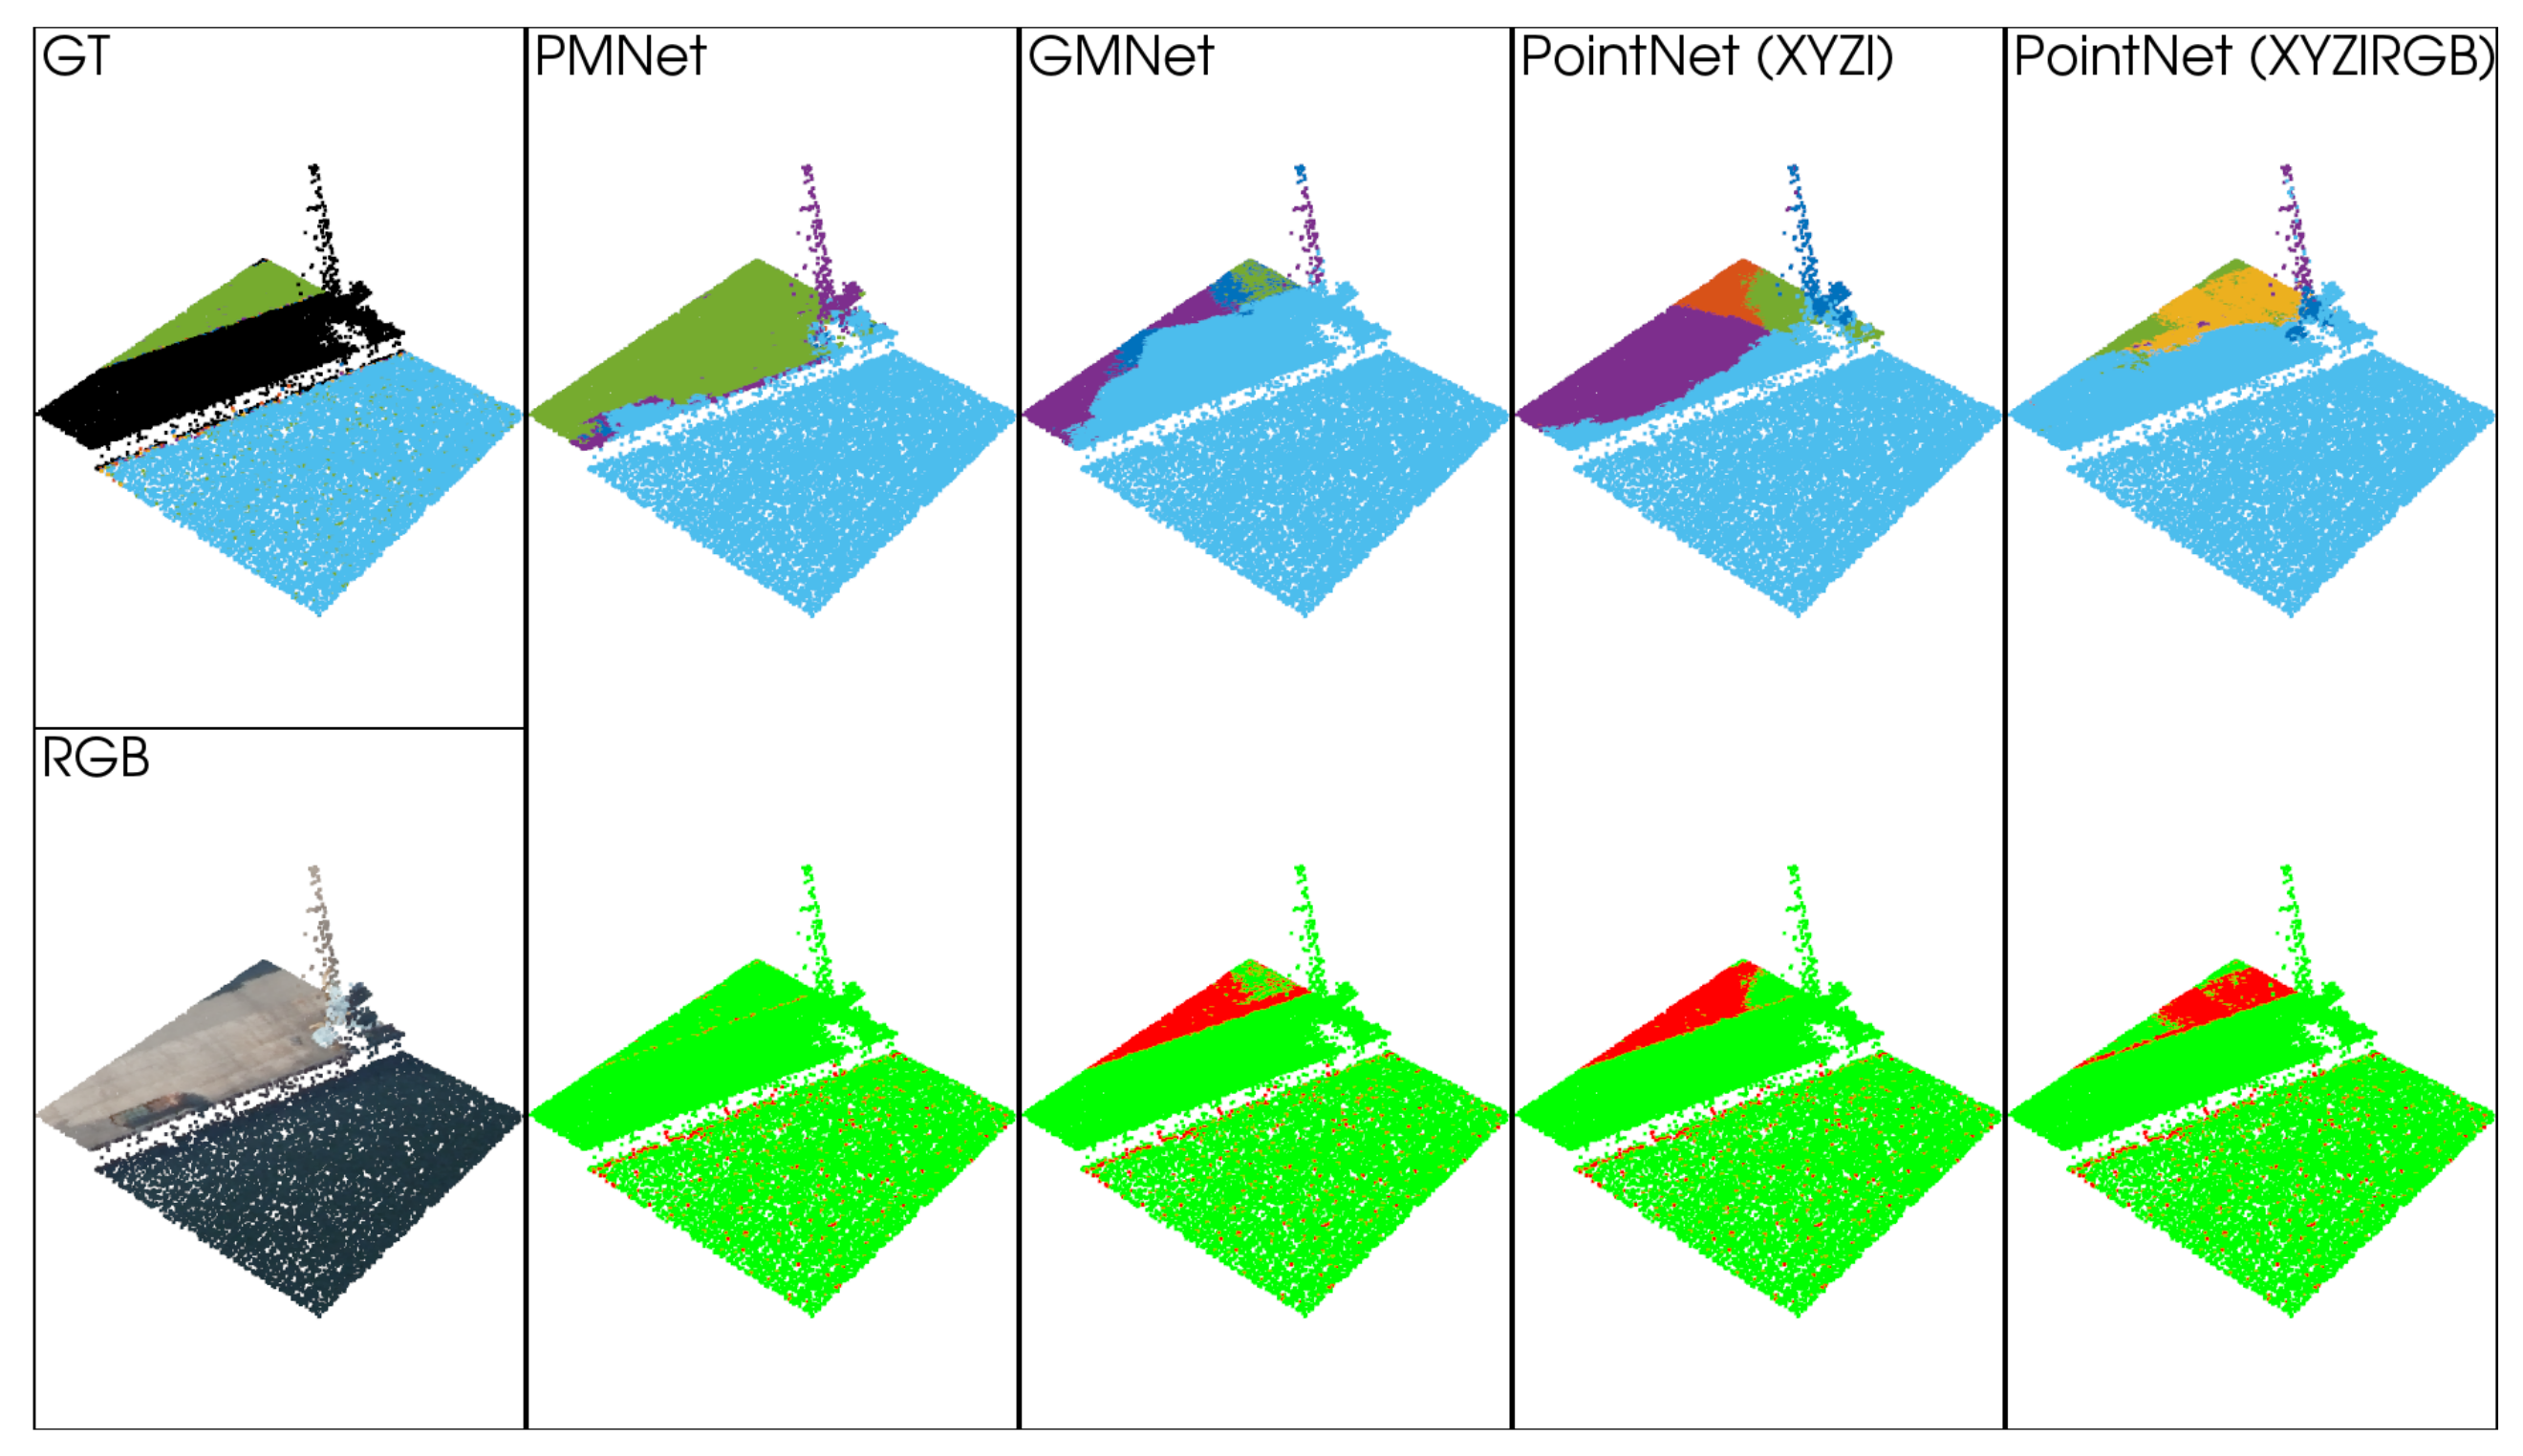
5.1.2. Qualitative Analysis

Qualitative analysis also carried out by visualizing the 3D models to check classification results in detail for both UHC and Osaka datasets. Figure 4 and Figure 5 visualize the results of the 3D segmentation of PMNet and other models for UHC dataset. Figure 4 is a perfect patch that demonstrates mixed classes with a relatively higher variation in terms of elevation and spectral reflectance with classes such as Grass, Trees and Transportation network. PMNet (second column in Figure 4) shows better performance by producing a very few miss-classified points. GMNet has miss-classified the Transportation network as Grass class. In the case of PointNet(XYZI) and PointNet(XYZIRGB), several Grass class points have miss-classified as Transportation classes, maybe due to the lack of potential to utilize RGB information.
By visually comparing with the given RGB image, it is evidenced that PMNet able to correctly classify most of the Unclassified points (black color in the GT label) as well. Most of the Unclassified classes are covered by Grass and Tree classes, PointNet (XYZIRGB) completely miss-classified it as Transportation network, while PointNet (XYZI) miss-classified some of the Tree points as non-residential building. Notably, GMNet also miss-classifies some of the Tree points as Residential building.
Figure 5 is also a typical patch selected form UHC dataset, which shows the example of the mixed class patch such as Non-residential building, Trees and Transportation network. The second row clearly shows that most of the points are correctly classified in the case of PMNet while in other models performance is not as good as PMNet. Especially, Tree points are miss-classified as Non-residential buildings in all the other models might be due to the inability of the networks to effectively utilize RGB information. Even in the case of Unclassified points PMNet correctly classifies the Transportation network, Tree and Non-residential building compared to other models. More examples of 3D segmentation results of UHC dataset patches are added to the Appendix A as Figure A2 and Figure A3.
Figure 6 and Figure 7 visualize the results of the 3D segmentation of PMNet and other models for Osaka dataset. Figure 6 shows a typical patch, which covers points from Public facility and Transportation network class, where the second row shows the miss-classified (red) and correctly (green) classified points and its corresponding GT labels in the first row. These two classes as high variation in terms of elevation value but almost similar spectral reflectance characteristics. Networks that are not fused elevation and spectral information in a complementary manner leads to miss-classification.
However, Figure 6 demonstrates that the PMNet provides much better results compared to other models. Figure 6 also demonstrates that PMNet is more efficient than GMNet. The majority of the points belong to Public facility and hence, Transportation network points not utilized effectively in GMNet since it determines fusion parameters globally. Therefore, in case of global feature-level fusion, if one patch is dominant with one particular class the fusion parameters may be biased to that class, on the other hand, PMNet treats fusion in a point-wise manner and hence the fusion is more robust.
Figure 7 shows a patch that covers mostly Park class with a small portion as Transportation network class. However, the Park class itself has high variance since it includes small trees, grass, soil ground, etc. Hence, this patch is a good example to demonstrate the efficacy of the models, and PMNet shows the potential to classify Park with much higher correctly classified points compared to other models. GMNet mostly miss-classify Park as Transportation class due to the impervious surface in the Park. PointNet(XYZIRGB) shows almost similar representation as GMNet, but slightly better segmentation performance compared GMNet. However, PointNet(XYZI) miss-classifies some of the Park points as even Water class, it might be due to only considering the lower elevation of Park class. More examples of 3D segmentation results of Osaka dataset patches are added to the Appendix A as Figure A4 and Figure A5.

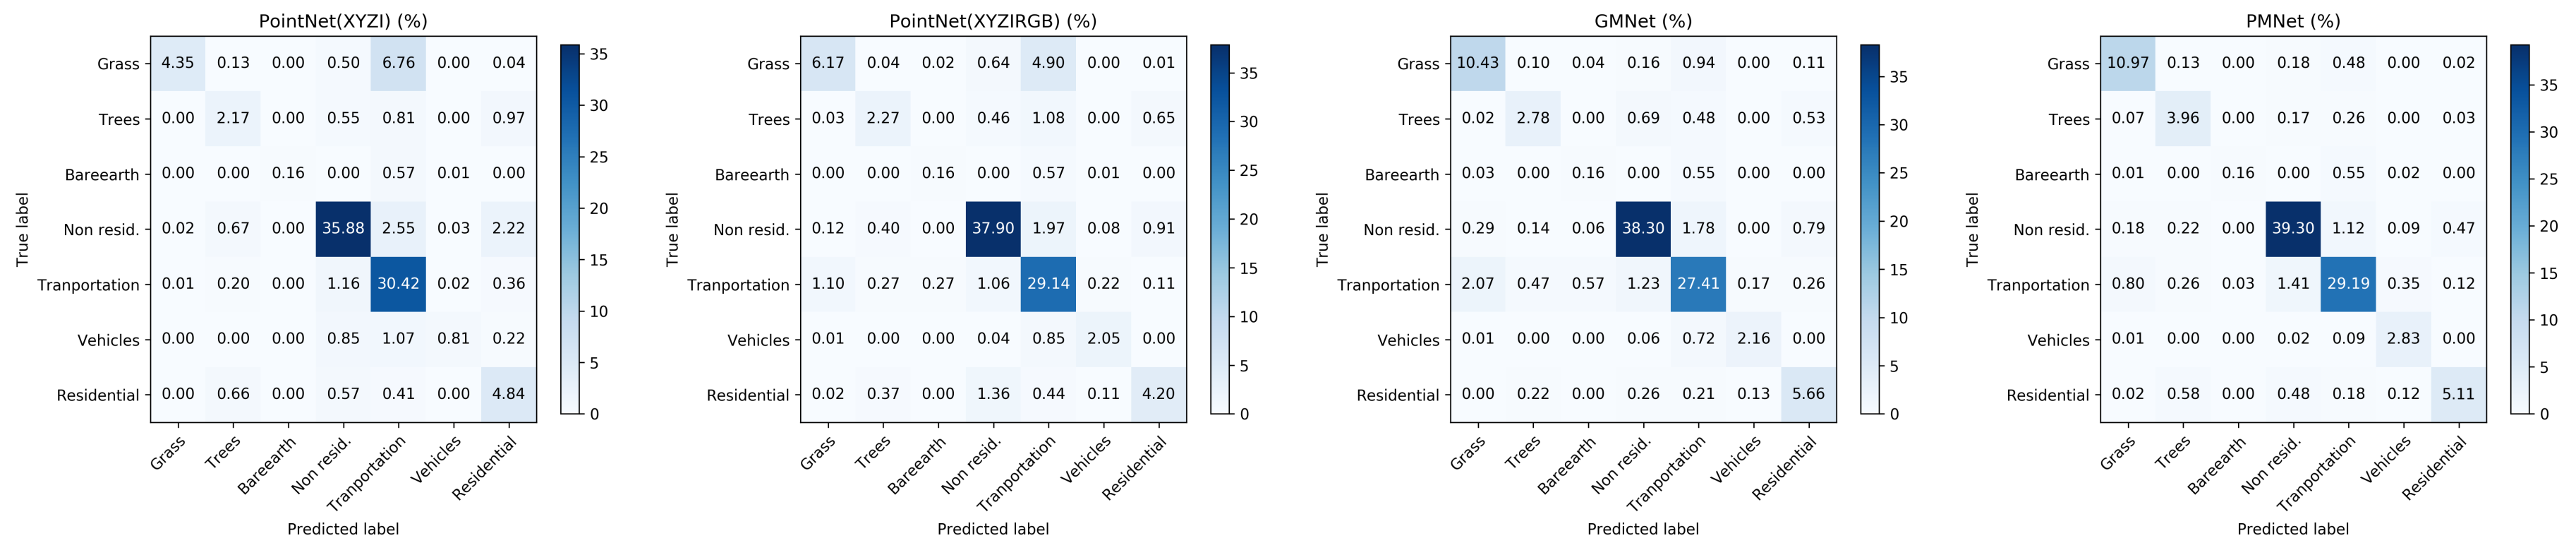
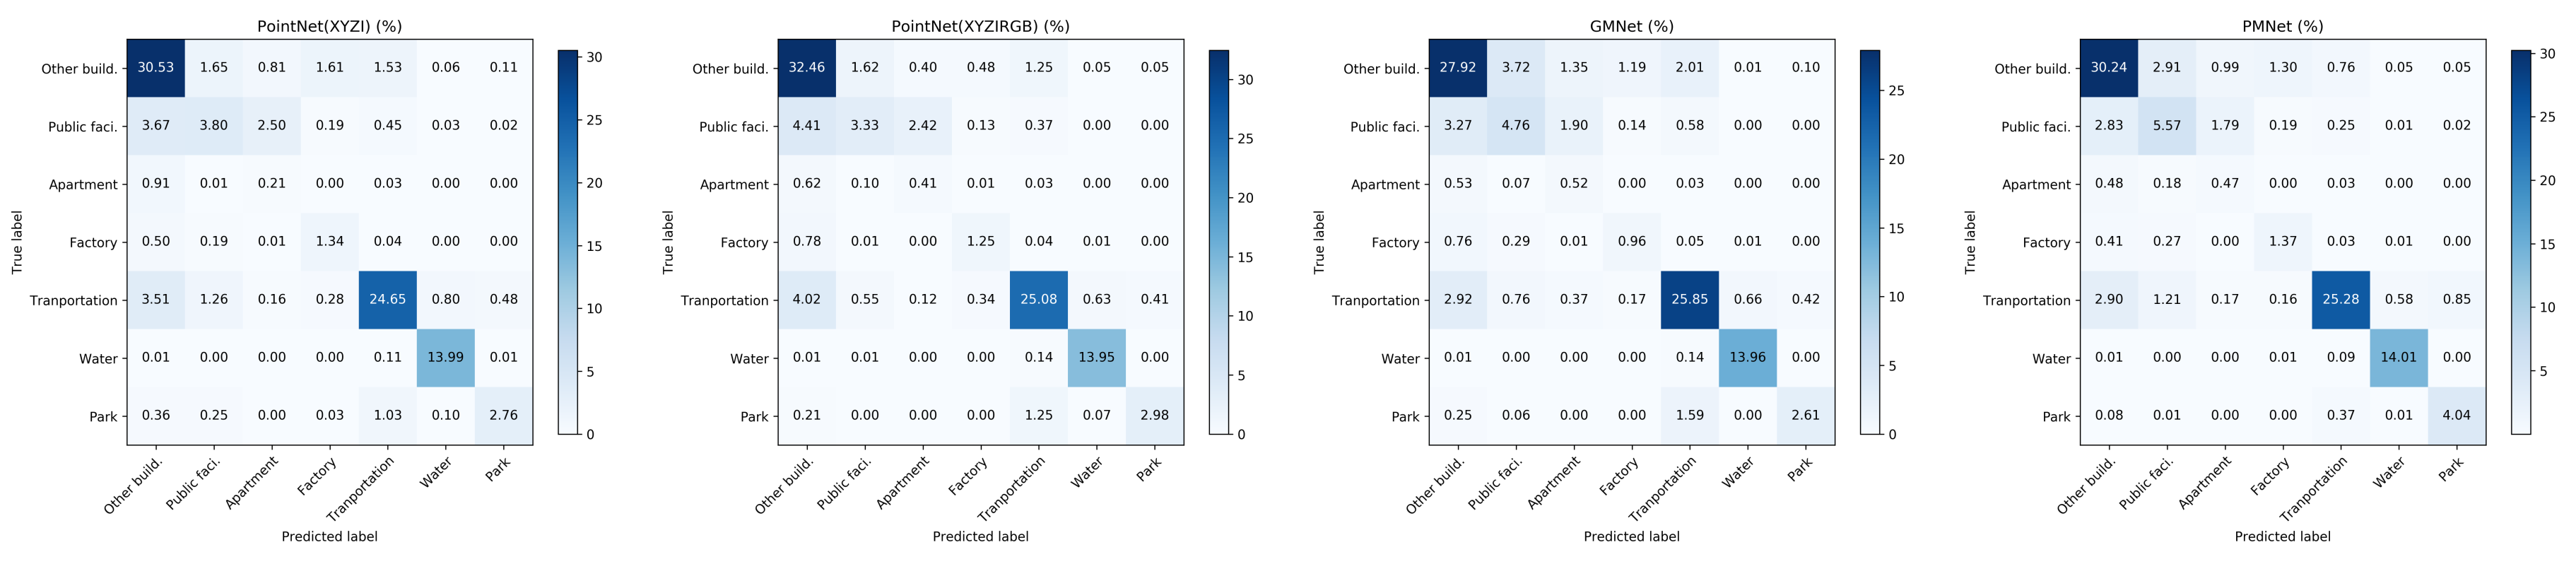
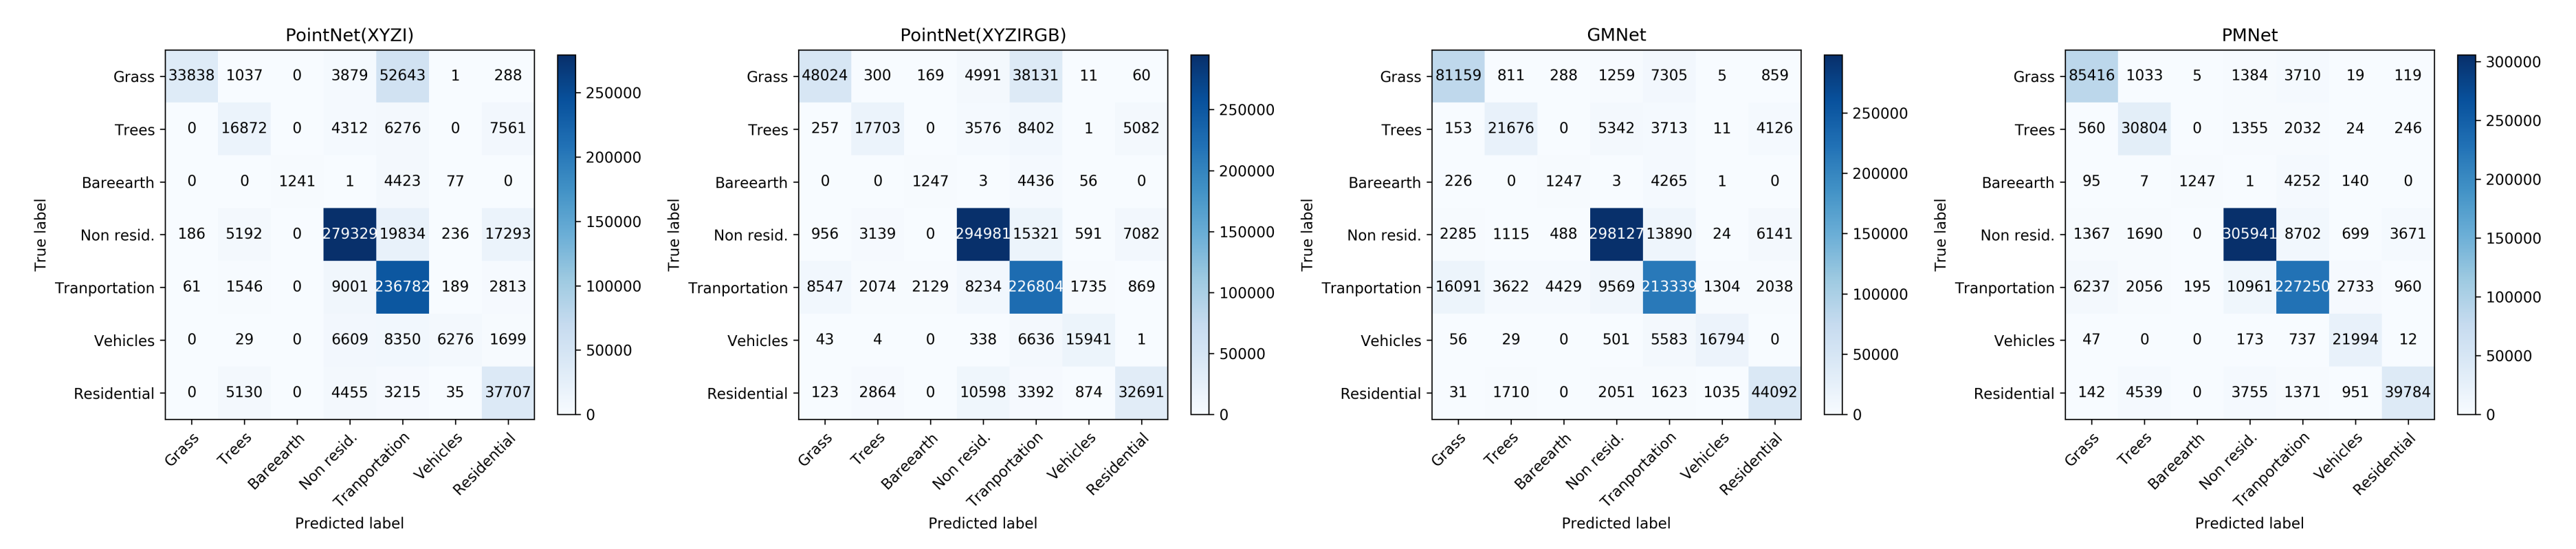
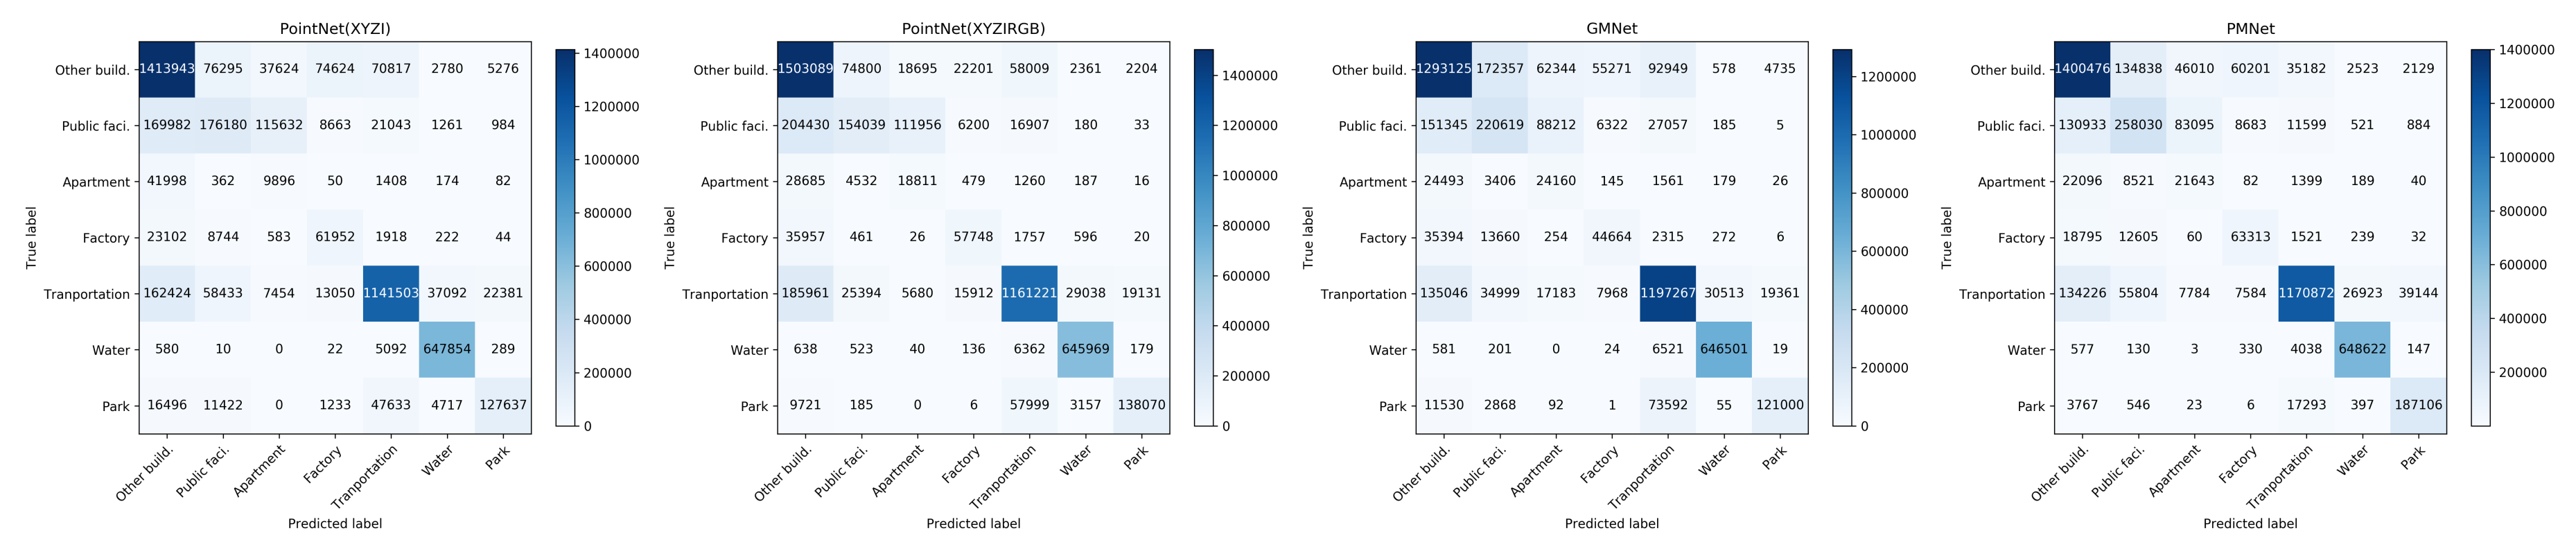
5.2. Detailed Spatial (Per-Point) Comparison Using Confusion Matrix

Several previous studies [36,37] have indicated importance of carrying out the detailed per-point wise consistency analysis. Hence, this study utilizes the confusion matrix and metrics derived from it to asses the constancy of class in the resulted 3D segmentation and GT labels. This section investigates the 3D segmentation results in detail by computing percentage-based confusion matrix with GT label data. Figure 8 and Figure 9 show the percentage-based confusion matrix for UHC dataset and Osaka dataset respectively. Sum of the values in diagonal axis in the confusion matrix shows the percentage of points consistent in both predicted and GT label data. This percentage-based analysis provides a detailed idea about the percentage of points correctly classified (consistent)and miss-classified (non-consistent). In case of UHC dataset around 93% percentage of the points consistent in case of PMNet, while in case of GMNet, PointNet(XYZIRGB), and PointNet(XYZI) show 87%, 82%, and 78% respectively (Figure 8). In case of Osaka dataset around 81% percentage of the points are consistent in case of PMNet, while in case of GMNet, PointNet(XYZIRGB), and PointNet(XYZI) show 76%, 79%, and 77% respectively (Figure 9). PMNet not only shows the higher percentage of consistency but also shows significant improvement in classes which have less percentage of points available compared to the whole data. In order to get an overview of total amount of the data we have attached non-normalized confusion matrix in Appendix A ( Figure A6 and Figure A7) for UHC dataset and Osaka dataset respectively.
In addition, this study also computes metrics derived from confusion matrix such as precision, recall, F-score and Mean Intersection over Union (MIoU) to evaluate the results in detail (Table 3). These metrics have became common evaluation metrics recently [38], and, in fact, these metrics reveal the inherent constancy properties of the confusion matrix. These metrics are also reveal that PMNet reliably outperforms the other methods likewise the observation made in the Section 5.1. MIoU and F-score are also indicates the efficacy of the class based performance and PMNet shows significant improvement in case of MIoU and F-score in both UHC and Osaka dataset. In addition, PMNet shows more balanced precision and recall values than other models. Notably, Table 3 also shows that Osaka dataset and its class differentiation is a more difficult task than in UHC dataset. However, PMNet shows upper hand compared to other methods in both relatively easier and difficult 3D segmentation cases.

5.3. Improved Performance by Over-Sampling the Minor Classes and Medium Classes

Imbalanced datasets problem is one of the most difficult challenges that face not only in semantic segmentation tasks but also machine learning applications in general [39]. Both datasets have encountered the class imbalance issue since the datasets are collected from a highly complex urban environment. This is a common challenge in remote sensing dataset discussed in several papers [40,41]. Data imbalance issue is a more difficult issue in multi-modality fusion approaches [39], however, this cannot be avoided in a real-world urban environment dataset. Therefore, this research evaluated the performance of the models in terms of class-imbalance. Patch based-augmentation technique is a commonly used over-sampling strategy in deep learning to increase the number of samples. However, augmenting all the patches do not address the class-imbalance issue. Hence, the study used a simple over-sampling (augmentation) method to increase the percentage of minor and medium classes. Where we defined minor and medium classes for each dataset by checking the percentage of points available in each class. Further, the study over-sampled the patches only when they occupy more than 70% points by medium and minor classes. The flip operation was used to over-sample the patches only horizontal flip used in case of medium classes but horizontal and vertical flip used in case of minor class. Hence we could increase the percentage of the number of patches of minor and medium classes. The following section will discuss the over-sampling procedure in detail for each study area.
Table 4 shows the percentage of each class before and after the over-sampling operation and the improvement made in the case of UHC dataset. Non-residential building and Transportation classes together cover major parts of the dataset (more than 73%). Bareearth (0.9%) and Vehicle (2.51%) classes have a very less percentage of points compared to other classes and hence these two classes considered minor classes. Meanwhile, Tree (6.9%) class has a relatively less percentage of points and hence the Tree class is considered as a medium class. Study over-sampled these classes and the percentage of points the classes increased for minor classes (Bareearth (1.43%), Vehicle (2.76%)). This also shows an improvement in accuracy of minor, medium classes, the Avg.CA from 0.77 to 0.80 and the OA accuracy improved from 0.89 to 0.91. As Table 4 shows, Bareearth, vehicles, and Trees improved class-based accuracy significantly. In addition, OA also improved, hence this evidenced that, more class-balanced dataset or more robust techniques to address the class-imbalance could improve the performance of PMNet.
Table 5 shows the percentage of each class before and after the over-sampling operation and the improvement made in the case of Osaka dataset. Table 5 shows high accuracy for Other building and Transportation network in all the models. On the other hand Public facility, Residential and Factory are showing lower accuracy. Other building and Transportation network classes have occupied 71% of the whole labeled dataset, and thus model training may bias towards these two classes. Therefore, the study defined major (Other building and Transportation network), medium (Factory and Water) and minor (Public facility, Apartment, and Park) classes according to the percentage of number points available in each class. Table 5 shows the increased percentage of data in medium and minor classes after over-sampling and consequently improved corresponding class-based accuracy. In case of the Apartment class, over-sampling could barely increase the percentage of points, but on the other hand over-sampling could reduce percentage of Other building samples and Transportation samples significantly. Reduction in percentage Other building points might have helped to significantly increase Apartment class segmentation accuracy. The minor classes and medium classes show significant improvement in class based accuracy with an Avg.CA of 0.73 while without decreasing the OA (0.81). Minor class Avg.CA increased from 0.49% to 0.60%, the Avg.CA of specifically public facility and Apartment are improved significantly.

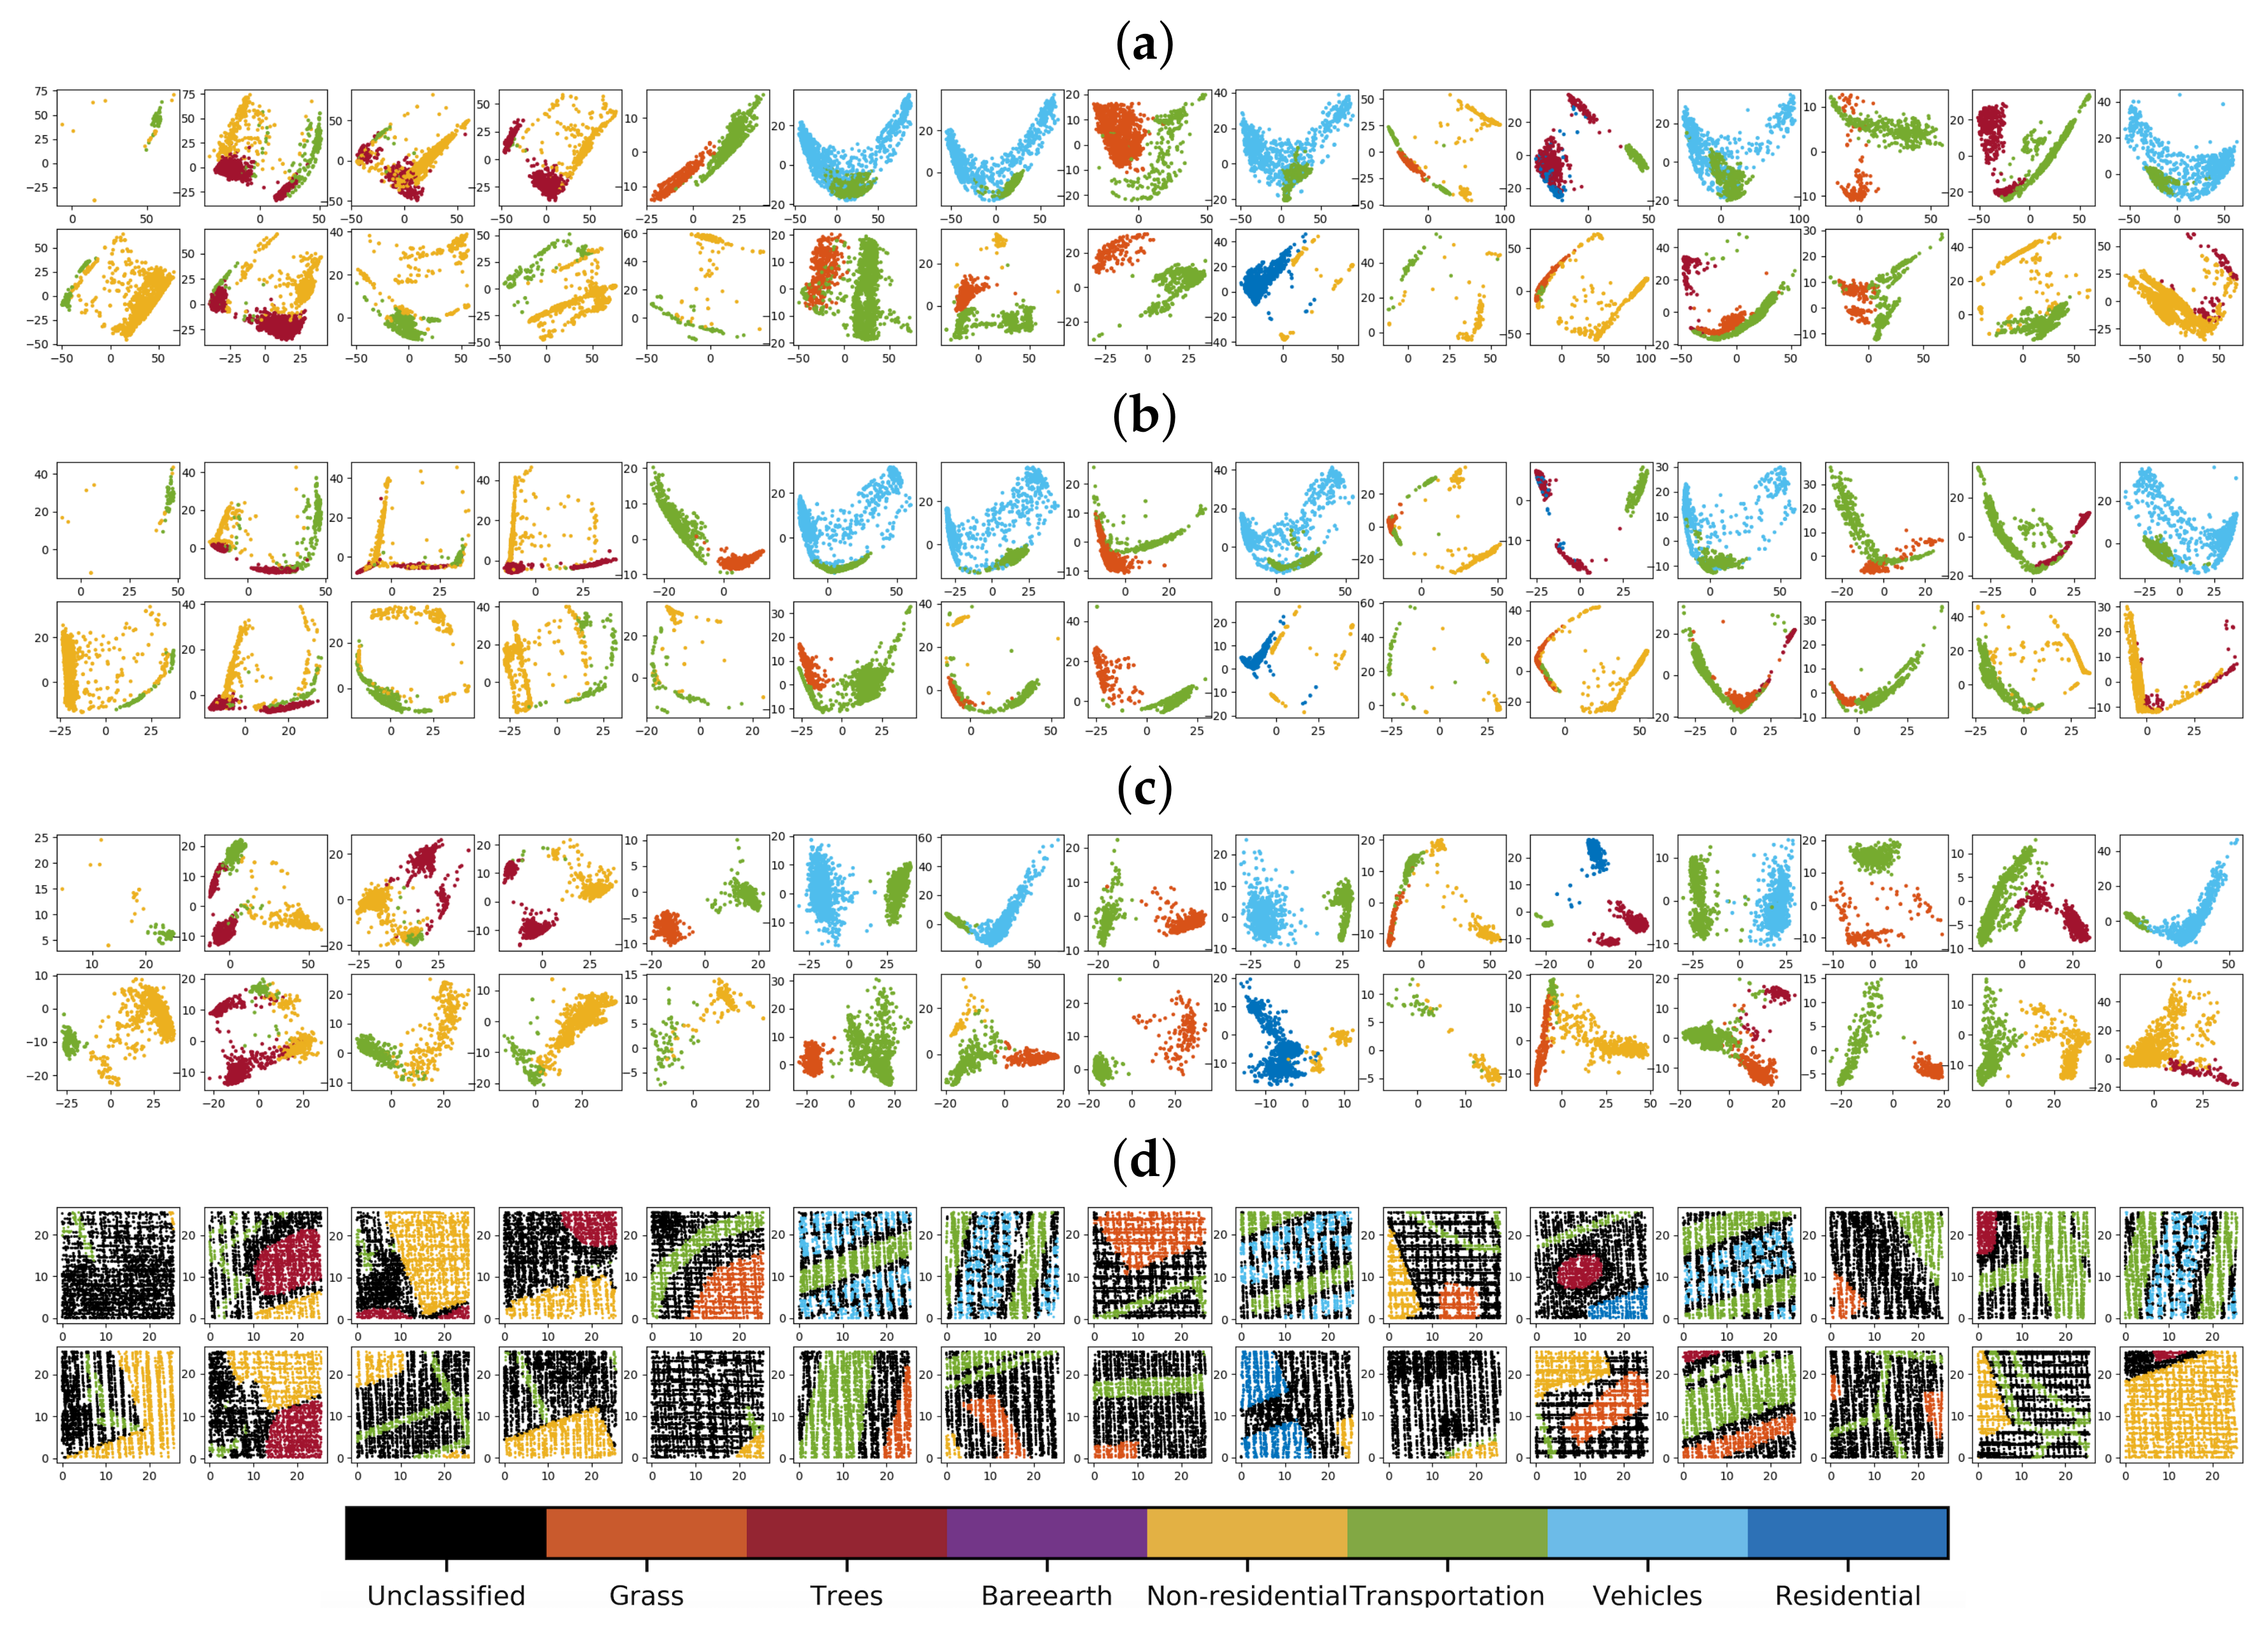
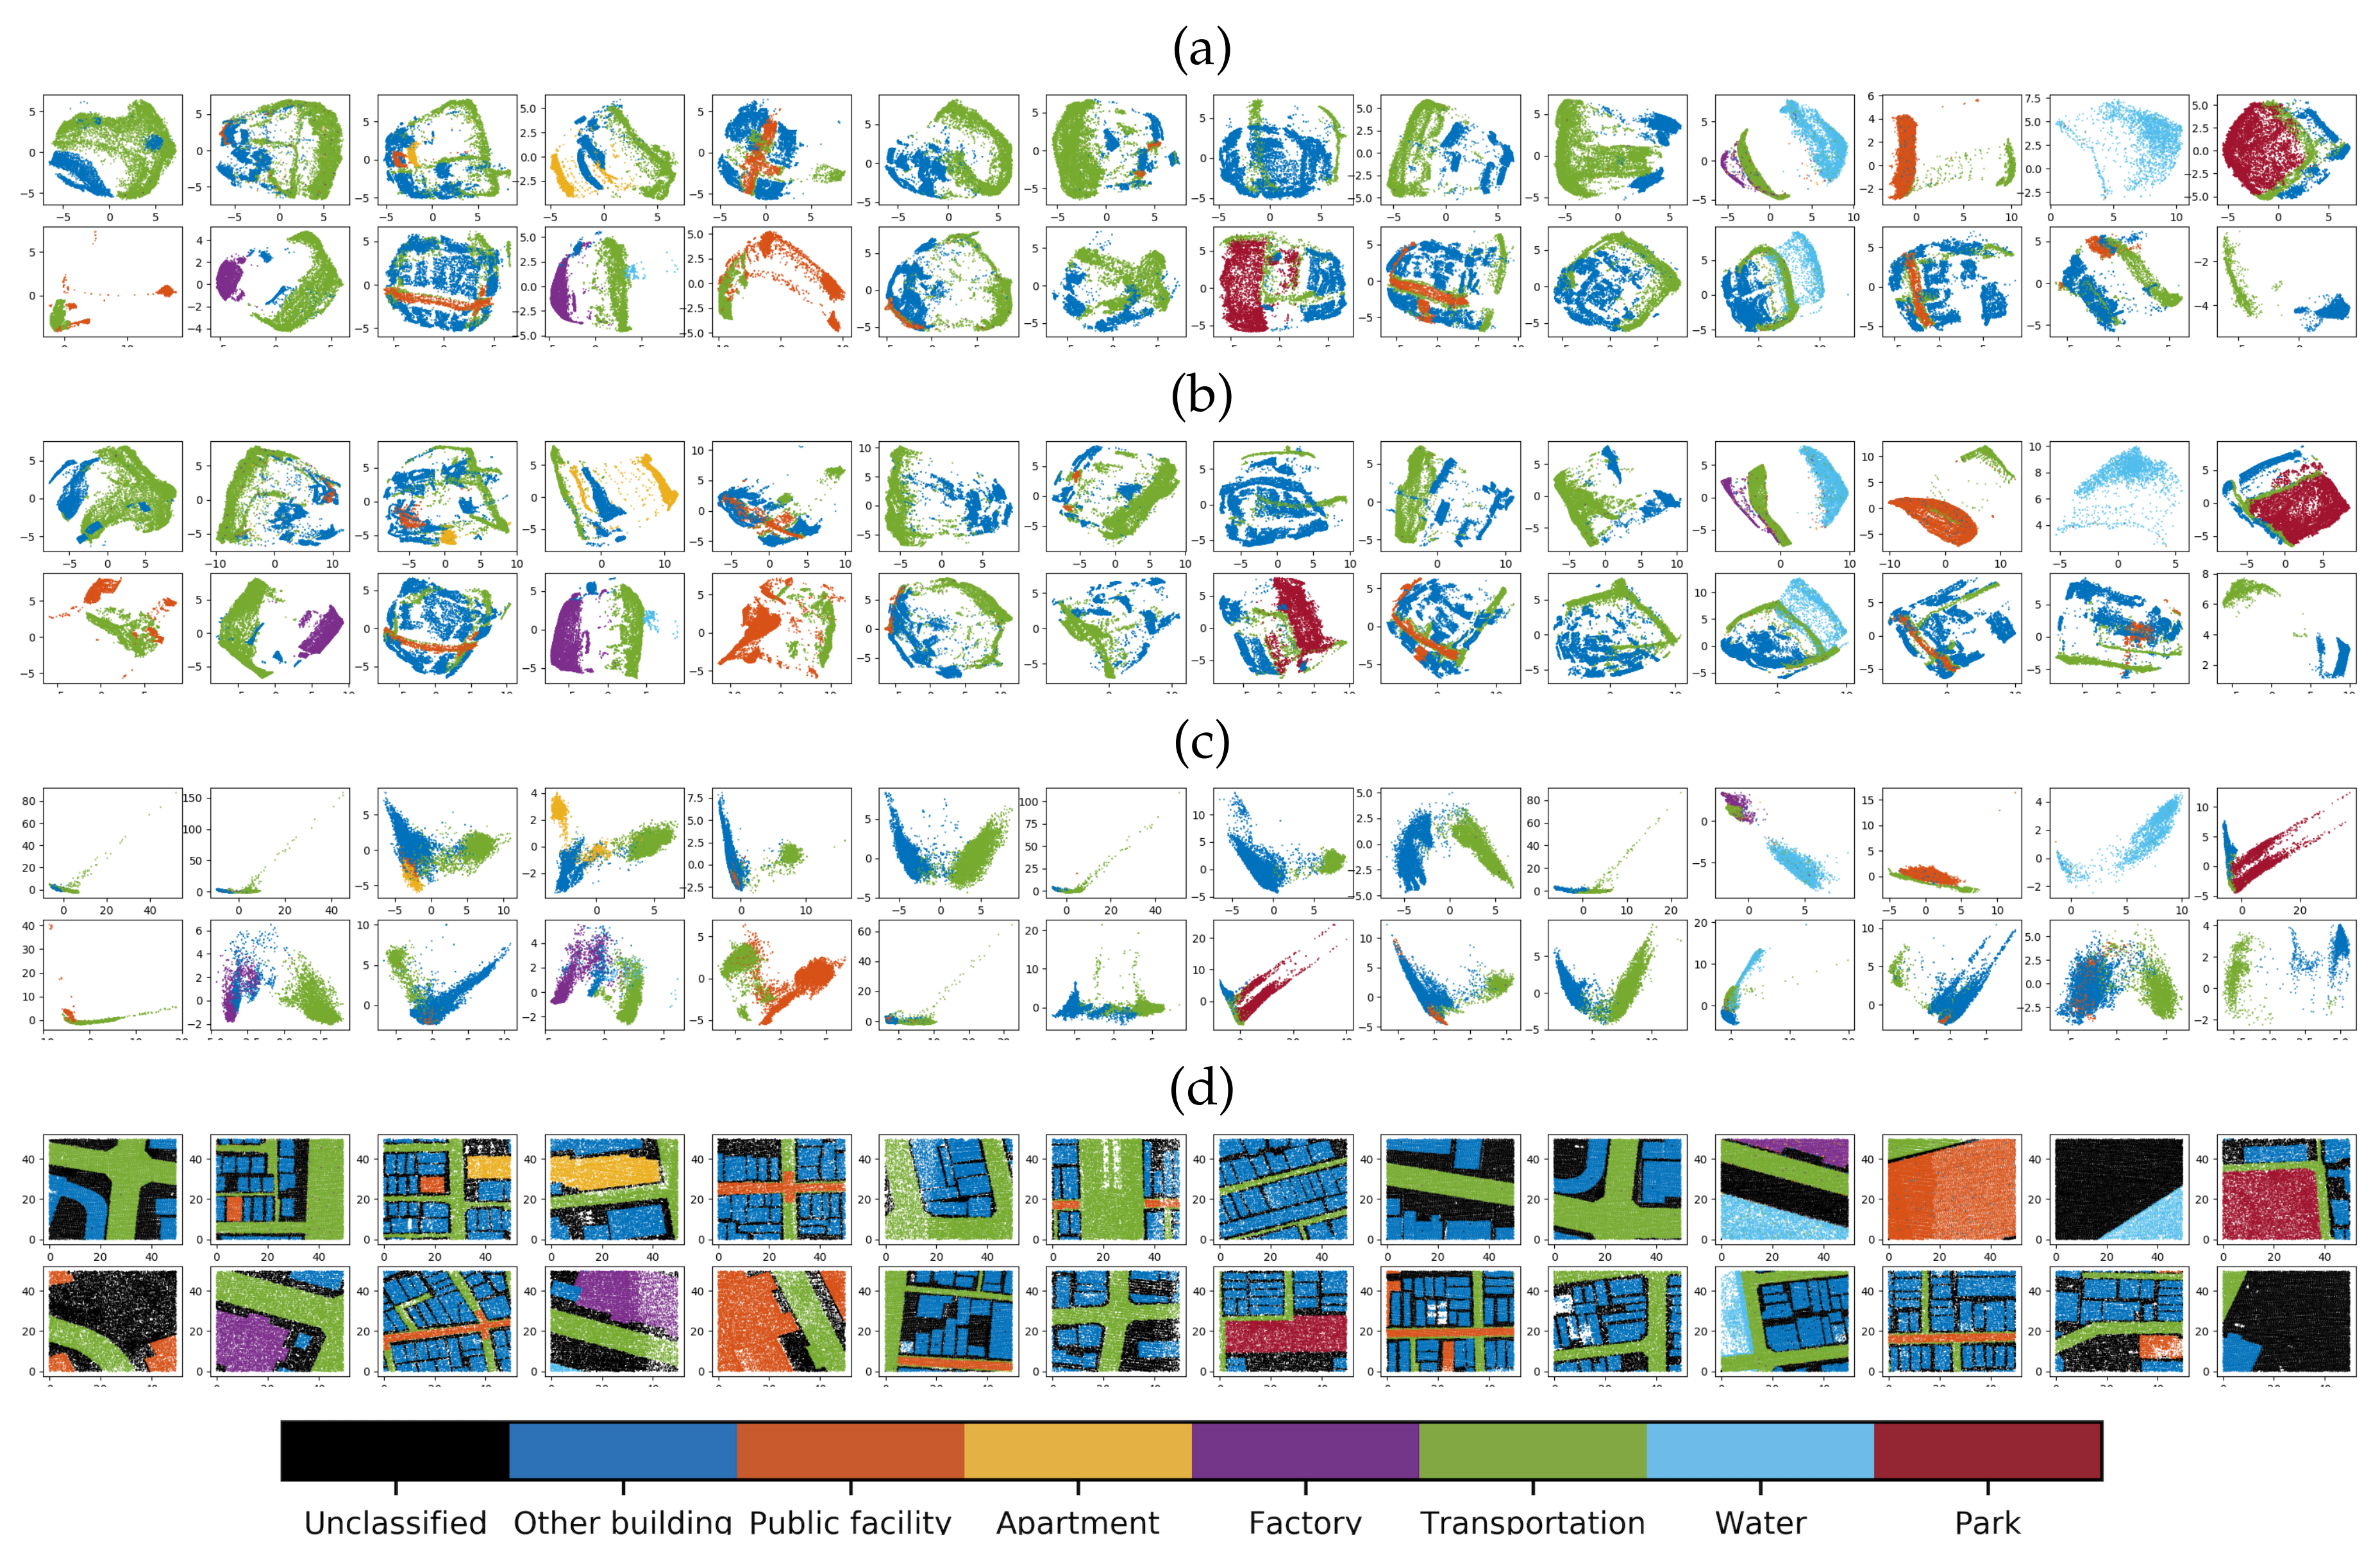
5.4. Evaluate Point-Wise Fusion Strategy Using Feature Activation Maps

This section closely examines whether point-wise fusion has any advantages over observational-level fusion (PointNet(XYZIRGB)) and global feature-level fusion (GMNet). The study assumes that feature layer activation maps extracted just after the fusion process from the network can provide an indication of efficacy of the fusion strategy. Principal Component Analysis (PCA) is a well-known technique for fast and flexible unsupervised method for dimensionality reduction in data and it can also be useful as a tool for visualizing clusters from the derived components. Hence, the study used first and second components of PCA from 256 feature layers just after fusion (as shown in Figure 1 after concatenation layer).
PCA scatter plot with the first component as x-axis, second component as y-axis and GT label used as the base map. PCA scatter plots are used to evaluate the potentiality of 256 features to check the ability to differentiate the clusters of the classes. Figure 10 and Figure 11 show the clusters of several classes and it can be visually evaluated whether these class-based clusters formed in a particular location and separable easily. If the class-based clusters are sparsely distributed and show mixed class representation in PCA plots, it indicates the inefficiency fusion strategy of a particular model. Figure 10 shows the PCA plots of PointNet (XYZIRGB), GMNet and PMNet fusion feature layers for UHC dataset. Random patches are selected to generate the PCA plot from the test dataset. PMNet fusion feature layers form more differentiable clusters compared to PointNet (XYZIRGB) and GMNet. GMNet fusion feature layers show good distribution but class clusters not as differentiable as in the case PMNet, however, GMNet shows better fusion efficacy than PointNet (XYZIRGB). PMNet shows better clustering in cases of almost all the classes as shown in Figure 10, while GMNet struggles in forming clusters in between Non-residential and Tree classes. GMNet and PointNet (XYZIRGB) are not so efficient in separating the Vehicles and Transportation classes. In general, the PCA plot evidenced that the point-wise fusion strategy of PMNet is more effective than observational-level (PointNet (XYZIRGB)) or global feature-level fusion (GMNet) strategies.
Figure 11 demonstrates the PCA plot for activation maps randomly selected patches for PointNet(XYZIRGB), GMNet and PMNet for Osaka dataset. PMNet shows high potential in separating the clusters of each classes compare to PointNet(XYZIRGB) and GMNet. RGB maybe more useful to differentiate between different classes such as Water, Transportation network and Park, while elevation information helps in differentiate other classes such as Transportation network and Building classes. PMNet provides more complementary fusion of RGB and elevation information, which is evidenced by the PCA plot. Classes such as Public facility, Apartment and Other building are relatively difficult to differentiate by only considering the elevation information, hence, the PMNet fusion shows high potential in differentiating clusters of these classes (Figure 11). Other building and Transportation network classes are relatively easy to differentiate using elevation information, however, the distribution of clusters showing more relevant in PMNet compared to GMNet and PointNet(XYZIRGB).

5.5. Model Complexity Evaluation Using Computational Parameters and Memory Requirement

Deep learning networks deliver state-of-the-art accuracy on many images and point cloud segmentation tasks, but it comes at the cost of high computational complexity [42]. While accuracy has steadily increased, the resource utilization of the models are also increased. Hence, it is important to carry out analysis of memory usage for training and testing the model. The number of computational parameters is an important metric to measure the complexity of the method in a deep learning model [43,44]. Hence, this study presents an analysis of metrics such as the total number of weights, biases and memory requirement in Kilobytes. However, PointNet-like network consumes less memory compared to other models such as SEGCloud [17] and since those models transform point cloud into 3D voxels or meshes and it increases the quantity of the data. The proposed model generates even fewer weights and biases hence relatively low memory requirement as shown in Table 6. Notably, GMNet has much more computational parameters compared to PMNet since it uses a fully connected layer for global fusion. However, the increased number of parameters in GMNet does not provide a better performance, hence it is clear that PMNet is efficient not only in terms of performance but also in terms of memory requirement. An Intel(R) Xeon(R) E5-2630 v4 @ 2.20GHz CPU with 10 cores (dual thread) and an NVIDIA Tesla P100 GPU computing processor (Tesla P100 SXM2 16 GB) [45] used for model complexity evaluation.

5.6. Discussions

The extraction of meaningful information from 3D sensed data is a challenging task in the field of remote sensing and computer vision. Much like with 2D image understanding, 3D understanding has greatly benefited from the current technological surge in the field of deep learning. With applications ranging from remote sensing, mapping, monitoring, city modeling, it is clear why robust and autonomous information extraction from 3D data is in high demand [19]. In this research unlike the traditional methods which transform 3D point clouds to DSM data for modeling, we propose a 3D point cloud segmentation method by fusing features from 2D aerial image. This research uses two datasets collected from the University of Houston, USA (UHC dataset) and Osaka, Japan (Osaka dataset) over complex urban environments. The study compared and evaluated the performance of the proposed PMNet with various other non-fusion PointNet (XYZI), observational-level fusion (PointNet (XYZIRGB)) and global feature-level fusion (GMNet).
PMNet shows dominance in the quantitative analysis which evaluates the metrics such as Avg.CA, class-based accuracy, OA. The study also used a progressive over-sampling method to improve the percentage of samples in minor and medium classes to show the improvements in the performance of PMNet. However, tackling the class-imbalance issue was not the prime interest of this paper, nonetheless, the study demonstrated that improved class-balance could further improve the performance of PMNet. Results from both the datasets are consistent in terms of showing the improved 3D segmentation results by PMNet. Visual inspection also shows that the PMNet significantly overcomes other models. Moreover, the study cross-checked the efficacy of fusion strategies by evaluating the PCA plots of fusion feature layer maps. Section 5.4 shows several patches and demonstrated the potentiality of PMNet in differentiating class clusters easier than other models.
This analysis in-fact illustrates the importance of point-wise fusion. Point-wise fusion strategy of PMNet not only shows improved performance but also use less computation parameters and memory usage for processing. In addition, the study randomly shuffled the point order in each patch in order to evaluate whether PMNet respects the permutation invariance. The results show no change even after random shuffling, since, PMNet uses spatial correspondence point-wise fusion, the network could keep track of the index of the XY coordinates of the points and fuse with corresponding pixels. This clearly indicates that the PMNet respects permutation invariance, the point cloud basic characteristics. This paper utilizes PointNet as the backbone to extract deep features from the point cloud, however, future experiments can utilize any other network which consumes raw point cloud directly and networks which respect the permutation invariance.
Even though both datasets collected from the urban environment, Osaka dataset is more densely covered by the buildings. Hence, most of the defined classes belong to building structures such as Public facility, Apartment, Factory and Other building, these characterise of Osaka dataset makes it even more difficult to differentiate the classes compared to UHC dataset. Evaluations by segmentation accuracy comparison and the PCA analysis of feature distribution denote the difficulty of classifying Osaka dataset. Spatial per-point wise analysis using confusion matrix also clearly illustrates that the 3D segmentation of Osaka dataset is relatively difficult task compared to UHC dataset. However, the proposed PMNet shows the potential to differentiate the classes more effectively than other models even in case of Osaka dataset.
However, this study has some limitations, in terms of the labels of datasets. In the case of both datasets, the labels are not directly annotated from 3D point cloud data. Hence, the study projected the point cloud to 2D images, in which the GT labels are available, to obtain labels for 3D point clouds. This may leads to a little discrepancy in some cases such as shown in Figure A4, where the GT label over some points of the Transportation network is shown as Water. Interestingly, our PMNet succeeded to predict correct labels for several points as in case of Transportation network irrespective of the GT label as water. Thus, one of the future perspectives of this research will be focused towards to improve the quality of the GT labels by change/remove such noise point labels to the Unclassified class in the datasets. Another issue was noted, in the case of the Osaka dataset, we collected LiDAR point clouds and aerial images separately at different times. Therefore, the appearance of some moving objects such as vehicles, ships, etc., maybe inconsistent. However, since the GT label is aerial image-based, the network learned to classify points depends upon these image-based GT labels.

6. Conclusions

This paper presents an end-to-end deep neural network for LiDAR point cloud and aerial image point-wise fusion (PMNet), which respects the permutation invariance characteristics of the point cloud. The main purpose of this research is to improve the 3D segmentation of point cloud by fusing additional aerial image collected from the same location. In a complex urban area, aerial surveyed point cloud data has to be considered as a 3D data even though the data is not fully 3D, and hence proposed PMNet can fuse multimodal features by respecting the 3D representation of the data. Therefore, PMNet has an advantage over 2D based methods that it can incorporate multi-view 3D scanned data as well. The performance 3D segmentation of PMNet evaluated over two datasets collected from the complex urban environment of the University of Houston and Osaka, Japan. Compared the performance of PMNet fusion in detail with a non-fusion network (PointNet(XYZI)), observational-level fusion (PointNet(XYZIRGB)) and global feature-level fusion (GMNet) and PMNet outperforms them. This paper also evaluated the class-imbalance issue and used a simple over-sampling method to improve the 3D segmentation accuracy of the proposed PMNet model. Our code and trained model are available at https://github.com/VinayarajPoliyapram/PMNet.

Author Contributions

Conceptualization, V.P. and W.W.; formal analysis and experiments, V.P.; methodology, V.P.; software, V.P.; validation V.P.; writing—original draft preparation, V.P.; Writing—review & editing, V.P. and W.W.; data preparation, W.W.; visualization W.W.; supervision, R.N., project administration, R.N.

Funding

This research received no external funding.

Acknowledgments

Authors Acknowledge IEEE-GRSS IADF and the Hyperspectral Image Analysis Lab at the University of Houston for providing the data. This work is conducted as the research activities of AIST-Tokyo Tech Real World Big-Data Computation-Open Innovation Laboratory (RWBC-OIL) and New Energy and Industrial Technology Development Organization (NEDO).

Conflicts of Interest

The authors declare no conflict of interest.

Abbreviations

The following abbreviations are used in this manuscript:
PMNetPoint-wise Multimodal Fusion Network
GMNetGlobal Multi-modal Fusion Network
PCAPrinciple Component Analysis
LiDARLight Detection and Ranging
UHCUniversity of Houston Campus
VHRVery high-resolution
MLPMulti-layer perceptron
CNNConvolutional Neural Network
ReLURectified Linear Unit

Appendix A

Figure A1. Accuracy and loss plots of the training phase of UHC dataset (a,b) and Osaka dataset (c,d) respectively.
Remotesensing 11 02961 g0a1
Figure A2. Comparative evaluation of results of UHC dataset; first row shows the segmentation results, second row shows binary labels for correctly classified (green) and miss-classified (red).
Remotesensing 11 02961 g0a2
Figure A3. Comparative evaluation of results of UHC dataset; first row shows the segmentation results, second row shows binary labels for correctly classified (green) and miss-classified (red).
Remotesensing 11 02961 g0a3
Figure A4. Comparative evaluation of results of Osaka dataset; first row shows the segmentation results, second row shows binary labels for correctly classified (green) and miss-classified (red).
Remotesensing 11 02961 g0a4
Figure A5. Comparative evaluation of results of Osaka dataset; first row shows the segmentation results, second row shows binary labels for correctly classified (green) and miss-classified (red).
Remotesensing 11 02961 g0a5
Figure A6. Confusion matrix to evaluate the per-point consistency of 3D segmentation result of UHC dataset.
Remotesensing 11 02961 g0a6
Figure A7. Confusion matrix to evaluate the per-point consistency of 3D segmentation result of Osaka dataset.
Remotesensing 11 02961 g0a7

References

  1. Gao, H.; Zhang, H.; Hu, D.; Tian, R.; Guo, D. Multi-scale features of urban planning spatial data. In Proceedings of the 18th International Conference On Geoinformatics, Beijing, China, 18–20 June 2010; pp. 1–7. [Google Scholar]
  2. Gao, Z.; Kii, M.; Nonomura, A.; Nakamura, K. Urban expansion using remote-sensing data and a monocentric urban model. Comput. Environ. Urban Syst. 2019, 77, 101152. [Google Scholar] [CrossRef]
  3. Hamaguchi, R.; Hikosaka, S. Building detection from satellite imagery using ensemble of size-specific detectors. In Proceedings of the IEEE/cvf Conference On Computer Vision And Pattern Recognition Workshops (cvprw), Salt Lake City, UT, USA, 18–22 June 2018; pp. 223–2234. [Google Scholar]
  4. Ronneberger, O.; Fischer, P.; Brox, T. U-net: Convolutional networks for biomedical image segmentation. In Proceedings of the International Conference On Medical Image Computing And Computer-assisted Intervention, Munich, Germany, 1–6 October 2015; pp. 234–241. [Google Scholar]
  5. Islam, M.; Rochan, M.; Naha, S.; Bruce, N.; Wang, Y. Gated feedback refinement network for coarse-to-fine dense semantic image labeling. In Proceedings of the IEEE Conference on Computer Vision and Pattern Recognition (CVPR), Honolulu, HI, USA, 21–26 July 2017; pp. 3751–3759. [Google Scholar]
  6. He, K.; Gkioxari, G.; Dollár, P.; Girshick, R. Mask r-cnn. In Proceedings of the IEEE International Conference On Computer Vision, Tampa, FL, USA, 5–8 December 2017; pp. 2961–2969. [Google Scholar]
  7. Zhao, H.; Shi, J.; Qi, X.; Wang, X.; Jia, J. Pyramid scene parsing network. In Proceedings of the IEEE Conference on Computer Vision and Pattern Recognition, Honolulu, HI, USA, 21–26 July 2017; pp. 2881–2890. [Google Scholar]
  8. Cruz, C.; Hmida, H.; Boochs, F.; Nicolle, C. From Unstructured 3D Point Clouds to Structured Knowledge-A Semantics Approach. In Semantics-Advances In Theories and Mathematical Models; Afzal, M.T., Ed.; IntechOpen: London, UK, 2012; Chapter 9. [Google Scholar]
  9. Wu, Y.; Qin, H.; Liu, T.; Liu, H.; Wei, Z. A 3D Object Detection Based on Multi-Modality Sensors of USV. Appl. Sci. 2019, 9, 535. [Google Scholar] [CrossRef] [Green Version]
  10. Arief, H.G.; Tveite, H.; Indahl, U. Land cover segmentation of airborne LiDAR data using stochastic atrous network. Remote Sens. 2018, 10, 973. [Google Scholar] [CrossRef] [Green Version]
  11. Lodha, S.; Kreps, E.; Helmbold, D.; Fitzpatrick, D. Aerial LiDAR data classification using support vector machines (SVM). In Proceedings of the Third International Symposium On 3d Data Processing, Visualization, And Transmission (3dpvt’06), Chapel Hill, NC, USA, 14–16 June 2006; pp. 567–574. [Google Scholar]
  12. Pan, X.; Gao, L.; Marinoni, A.; Zhang, B.; Yang, F.; Gamba, P. Semantic labeling of high resolution aerial imagery and LiDAR data with fine segmentation network. Remote Sens. 2018, 10, 743. [Google Scholar] [CrossRef] [Green Version]
  13. Zhang, W.; Huang, H.; Schmitz, M.; Sun, X.; Wang, H.; Mayer, H. Effective fusion of multi-modal remote sensing data in a fully convolutional network for semantic labeling. Remote Sens. 2018, 10, 52. [Google Scholar] [CrossRef] [Green Version]
  14. Kampffmeyer, M.; Salberg, A.; Jenssen, R. Semantic segmentation of small objects and modeling of uncertainty in urban remote sensing images using deep convolutional neural networks. In Proceedings of the IEEE Conference on Computer Vision and Pattern Recognition Workshops, Las Vegas, NV, USA, 26 June–1 July 2016; pp. 1–9. [Google Scholar]
  15. Audebert, N.; Lesaux, B.; Lefèvre, S. Semantic segmentation of earth observation data using multimodal and multi-scale deep networks. In Asian Conference On Computer Vision; Springer: Cham, Switzerland, 2016; pp. 180–196. [Google Scholar]
  16. Ashraf, I.; Hur, S.; Park, Y. An investigation of interpolation techniques to generate 2D intensity image from LIDAR data. IEEE Access 2017, 5, 8250–8260. [Google Scholar] [CrossRef]
  17. Tchapmi, L.; Choy, C.; Armeni, I.; Gwak, J.; Savarese, S. Segcloud: Semantic segmentation of 3d point clouds. In Proceedings of the 2017 International Conference On 3d Vision (3dv), Qingdao, China, 10–12 October 2017; pp. 537–547. [Google Scholar]
  18. Boulch, A.; Lesaux, B.; Audebert, N. Unstructured Point Cloud Semantic Labeling Using Deep Segmentation Networks. 3DOR 2017, 7. [Google Scholar] [CrossRef]
  19. Griffiths, D.; Boehm, J. A Review on deep learning techniques for 3D sensed data classification. Remote Sens. 2019, 11, 1499. [Google Scholar] [CrossRef] [Green Version]
  20. Qi, C.; Su, H.; Mo, K.; Guibas, L. Pointnet: Deep learning on point sets for 3d classification and segmentation. In Proceedings of the IEEE Conference On Computer Vision And Pattern Recognition, Honolulu, HI, USA, 21–26 July 2017; pp. 652–660. [Google Scholar]
  21. Qi, C.; Yi, L.; Su, H.; Guibas, L. Pointnet++: Deep hierarchical feature learning on point sets in a metric space. In Proceedings of the Advances In Neural Information Processing Systems, Long Beach, CA, USA, 4–9 December 2017; pp. 5099–5108. [Google Scholar]
  22. Yang, Z.; Sun, Y.; Liu, S.; Shen, X.; Jia, J. Std: Sparse-to-dense 3d object detector for point cloud. In Proceedings of the IEEE International Conference on Computer Vision, Seoul, Korea, 27–29 October 2019; pp. 1951–1960. [Google Scholar]
  23. Behley, J.; Garbade, M.; Milioto, A.; Quenzel, J.; Behnke, S.; Stachniss, C.; Gall, J. SemanticKITTI: A Dataset for Semantic Scene Understanding of LiDAR Sequences. In Proceedings of the IEEE International Conference on Computer Vision, Seoul, Korea, 27–29 October 2019; pp. 9297–9307. [Google Scholar]
  24. Li, Y.; Bu, R.; Sun, M.; Wu, W.; Di, X.; Chen, B. Pointcnn: Convolution on x-transformed points. In Proceedings of the Advances In Neural Information Processing Systems, Montreal, QC, Canada, 3–8 December 2018; pp. 820–830. [Google Scholar]
  25. Riegler, G.; Osmanulusoy, A.; Geiger, A. Octnet: Learning deep 3d representations at high resolutions. In Proceedings of the IEEE Conference on Computer Vision and Pattern Recognition, Honolul, HI, USA, 21–26 July 2017; pp. 3577–3586. [Google Scholar]
  26. Zhou, Q.; Neumann, U. Modeling residential urban areas from dense aerial LiDAR point clouds. In Proceedings of the International Conference On Computational Visual Media, Beijing, China, 8–10 November 2012; pp. 91–98. [Google Scholar]
  27. Huang, X.; Zhang, L.; Gong, W. Information fusion of aerial images and LIDAR data in urban areas: Vector-stacking, re-classification and post-processing approaches. Int. J. Remote Sens. 2011, 32, 69–84. [Google Scholar] [CrossRef]
  28. Badrinarayanan, V.; Kendall, A.; Cipolla, R. Segnet: A deep convolutional encoder-decoder architecture for image segmentation. IEEE Trans. Pattern Anal. Mach. Intell. 2017, 39, 2481–2495. [Google Scholar] [CrossRef] [PubMed]
  29. Noh, H.; Hong, S.; Han, B. Learning deconvolution network for semantic segmentation. In Proceedings of the IEEE International Conference on Computer Vision, Santiago, Chile, 7–13 December 2015; pp. 1520–1528. [Google Scholar]
  30. Lesaux, B.; Yokoya, N.; Hansch, R.; Brown, M.; Hager, G. 2019 Data Fusion Contest [Technical Committees]. IEEE Geosci. Remote Sens. Mag. 2019, 7, 103–105. [Google Scholar] [CrossRef]
  31. Xu, Y.; Du, B.; Zhang, L.; Cerra, D.; Pato, M.; Carmona, E.; Prasad, S.; Yokoya, N.; Hansch, R.; Lesaux, B. Advanced Multi-Sensor Optical Remote Sensing for Urban Land Use and Land Cover Classification: Outcome of the 2018 IEEE GRSS Data Fusion Contest. Ieee J. Sel. Top. Appl. Earth Obs. Remote Sens. 2019, 12, 1709–1724. [Google Scholar] [CrossRef]
  32. Debes, C.; Merentitis, A.; Heremans, R.; Hahn, J.; Frangiadakis, N.; Vankasteren, T.; Liao, W.; Bellens, R.; Pižurica, A.; Gautama, S. Hyperspectral and LiDAR data fusion: Outcome of the 2013 GRSS data fusion contest. IEEE J. Sel. Top. Appl. Earth Obs. Remote Sens. 2014, 7, 2405–2418. [Google Scholar] [CrossRef]
  33. 2018 IEEE GRSS Data Fusion Contest. Available online: http://www.grss-ieee.org/community/technical-committees/data-fusion (accessed on 2 August 2019).
  34. Lowphansirikul, C.; Kim, K.; Vinayaraj, P.; Tuarob, S. 3D Semantic Segmentation of Large-Scale Point-Clouds in Urban Areas Using Deep Learning. In Proceedings of the 11th International Conference on Knowledge and Smart Technology (kst), Phuket, Thailand, 23–26 January 2019; pp. 238–243. [Google Scholar]
  35. Xiu, H.; Vinayaraj, P.; Kim, K.; Nakamura, R.; Yan, W. 3D Semantic Segmentation for High-resolution Aerial Survey Derived Point Clouds Using Deep Learning (Demonstration). In Proceedings of the 26th Acm Sigspatial International Conference On Advances In Geographic Information Systems, Seattle, WA, USA, 6–9 November 2018; pp. 588–591. [Google Scholar]
  36. Giri, C.; Zhu, Z.; Reed, B. A comparative analysis of the Global Land Cover 2000 and MODIS land cover data sets. Remote Sens. Environ. 2005, 94, 123–132. [Google Scholar] [CrossRef]
  37. Kang, J.; Sui, L.; Yang, X.; Wang, Z.; Huang, C.; Wang, J. Spatial Pattern Consistency among Different Remote-Sensing Land Cover Datasets: A Case Study in Northern Laos. ISPRS Int. J. Geo-Inf. 2019, 8, 201. [Google Scholar] [CrossRef] [Green Version]
  38. Dai, A.; Chang, A.; Savva, M.; Halber, M.; Funkhouser, T.; Nießner, M. ScanNet: Richly-annotated 3D Reconstructions of Indoor Scenes. In Proceedings of the IEEE Conference on Computer Vision and Pattern Recognition, Honolulu, HI, USA, 21–26 July 2017. [Google Scholar]
  39. Abdou, M.; Elkhateeb, M.; Sobh, I.; El-sallab, A. Weighted Self-Incremental Transfer Learning for 3D-Semantic Segmentation. Available online: https://pdfs.semanticscholar.org/41b2/c5ad11a3f55d72def07d44cb32a44701ecd1.pdf (accessed on 1 November 2019).
  40. Li, J.; Du, Q.; Li, Y.; Li, W. Hyperspectral image classification with imbalanced data based on orthogonal complement subspace projection. IEEE Trans. Geosci. Remote Sens. 2018, 56, 3838–3851. [Google Scholar] [CrossRef]
  41. Bogner, C.; Seo, B.; Rohner, D.; Reineking, B. Classification of rare land cover types: Distinguishing annual and perennial crops in an agricultural catchment in South Korea. PLoS ONE 2018, 13, e0190476. [Google Scholar] [CrossRef] [PubMed] [Green Version]
  42. Sze, V.; Chen, Y.; Yang, T.; Emer, J. Efficient processing of deep neural networks: A tutorial and survey. Proc. IEEE 2017, 105, 2295–2329. [Google Scholar] [CrossRef] [Green Version]
  43. Canziani, A.; Paszke, A.; Culurciello, E. An analysis of deep neural network models for practical applications. arXiv 2016, arXiv:1605.07678. [Google Scholar]
  44. Alom, M.; Taha, T.; Yakopcic, C.; Westberg, S.; Sidike, P.; Nasrin, M.; Hasan, M.; Vanessen, B.; Awwal, A.; Asari, V. A state-of-the-art survey on deep learning theory and architectures. Electronics 2019, 8, 292. [Google Scholar] [CrossRef] [Green Version]
  45. AIST Artificial Intelligence Cloud (AAIC). Available online: https://www.airc.aist.go.jp/en/info_details/computer-resources.html (accessed on 10 September 2018).
Figure 1. Point-wise LiDAR and Image Multimodal Fusion Network (PMNet) architecture shows with a patch size of 312*312; dotted lines show the spatial correspondence frame used for point-wise fusion.
Remotesensing 11 02961 g001
Figure 2. UHC dataset, where, (a) shows the aerial image, (b) shows the aerial point cloud (the color representing the elevation), and (c) shows the corresponding labels.
Remotesensing 11 02961 g002
Figure 3. Osaka dataset, where (a) shows the aerial image, (b) shows the aerial point cloud and the color representing the elevation, and (c) shows the corresponding labels. The red box shows area used for testing and the remaining area used for training and validation.
Remotesensing 11 02961 g003
Figure 4. Comparative evaluation of selected patch of the UHC dataset; the first row shows the segmentation results, the second row shows binary labels for correctly classified (green) and miss-classified (red).
Remotesensing 11 02961 g004
Figure 5. Comparative evaluation of selected patch of UHC dataset; first row shows the segmentation results, second row shows binary labels for correctly classified (green) and miss-classified (red).
Remotesensing 11 02961 g005
Figure 6. Comparative evaluation of selected patch of Osaka dataset; first row shows the segmentation results, second row shows binary labels for correctly classified (green) and mis-classified (red).
Remotesensing 11 02961 g006
Figure 7. Comparative evaluation of selected patch of Osaka dataset; first row shows the segmentation results, second row shows binary labels for correctly classified (green) and mis-classified (red).
Remotesensing 11 02961 g007
Figure 8. Percentage based confusion matrix to evaluate the consistency of 3D segmentation result of UHC dataset; corresponding non-normalized confusion matrix attached in Appendix A Figure A6.
Remotesensing 11 02961 g008
Figure 9. Percentage based confusion matrix to evaluate the per-point consistency of 3D segmentation result of Osaka dataset; corresponding non-normalized confusion matrix attached in Appendix A (Figure A7).
Remotesensing 11 02961 g009
Figure 10. First and second components Principal Component Analysis (PCA) plots for UHC dataset: (a) is PointNet, (b) is GMNet, (c) PMNet, (d) is corresponding labels; Unclassified labels are not used for PCA plot; Class-based clusters of all the models show fine data distribution, but, PMNet shows more easily separable clusters.
Remotesensing 11 02961 g010
Figure 11. First and second components PCA plots for Osaka dataset: (a) is PointNet, (b) is GMNet, (c) PMNet, (d) is corresponding labels; Unclassified labels are not used for PCA plot; Class-based clusters distribution and clusters separability are much better in PMNet compared to other models.
Remotesensing 11 02961 g011
Table 1. Comparison of 3D segmentation results of various networks using UHC dataset.
MethodGrassTreesBareNonTran.VehicleResidentialAvgOA
EarthResidentialNetwork CA
PointNet (XYZI)0.520.500.210.910.900.690.640.620.63
PointNet0.620.550.300.920.860.900.590.680.82
(XYZIRGB)
GMNet0.830.750.210.880.910.720.410.670.84
PMNet0.850.820.300.920.920.840.770.770.89
Table 2. Comparison of 3D segmentation results of various networks using Osaka dataset.
MethodOtherPublicApartmentFactoryTran.WaterParkAvgOA
BuildingFacility Network CA
PointNet (XYZI)0.850.180.230.580.810.980.820.640.77
PointNet0.890.310.340.590.800.980.660.650.79
(XYZIRGB)
GMNet0.770.440.440.460.830.980.570.650.77
PMNet0.860.410.220.590.840.990.840.680.81
Table 3. Detailed accuracy assessment using various matrices derived from confusion matrix for UHC dataset and Osaka dataset.
Method UHC Dataset Osaka Dataset
MIoUPrecisionRecallF-Score MIoUPrecisionRecallF-Score
PointNet0.450.800.550.59 0.490.620.630.61
(XYZI)
PointNet0.520.720.620.66 0.520.670.650.65
(XYZIRGB)
GMNet0.610.740.720.73 0.500.630.640.62
PMNet0.710.870.800.80 0.570.660.730.68
Table 4. Performance evaluation of PMNet before and after progressively over-sample the medium and minor classes in the case of UHC dataset.
MethodGrassTreesBareNonTran.VehiclesResidentialAvgOA
EarthResidentialNetwork CA
PMNet0.850.820.300.920.920.840.770.770.89
Samples (%)8.10%6.9%0.9%43.4%30.33%2.51 %7.68%
PMNet (Ovr.)0.890.850.320.940.900.900.780.800.91
Samples (%)8.69%6.47%1.43 %43.71%29.90%2.76%7.01%
Table 5. Performance evaluation of PMNet before and after progressively over-sample the medium and minor classes in the case of Osaka dataset.
MethodOtherPublicApartmentFactoryTran.WaterParkAvgOA
BuildingFacility Network CA
PMNet0.860.410.220.590.840.990.840.680.81
Samples (%)40.17%5.23%3.04%7.77%31.66%9.46%2.64%
PMNet (ovr.)0.830.520.400.650.810.990.890.730.81
Samples (%)35.06%5.8%3.05 %8.64%28.41%14.89%4.14%
Table 6. Comparison of parameters used in each network and its memory requirement.
ModelsTotal Number of Weights and BiasesMemory Usage (Kilobytes)
PointNet (XYZI)8,88,3923553
PointNet8,88,5853554
GMNet99,90,09039,960
PMNet8,00,2013200

