Article

Monitoring Post-Fire Recovery of Chaparral and Conifer Species Using Field Surveys and Landsat Time Series

by
Christopher L. Kibler
1,*,
Anne-Marie L. Parkinson
2,
Seth H. Peterson
1,
Dar A. Roberts
1,
Carla M. D’Antonio
3,4,
Susan K. Meerdink
5 and
Stuart H. Sweeney
1
1
Department of Geography, University of California, Santa Barbara, CA 93106, USA
2
Bren School of Environmental Science and Management, University of California, Santa Barbara, CA 93106, USA
3
Department of Ecology, Evolution, and Marine Biology, University of California, Santa Barbara, CA 93106, USA
4
Environmental Studies Program, University of California, Santa Barbara, CA 93106, USA
5
Engineering School of Sustainable Infrastructure and Environment, University of Florida, Gainesville, FL 32611, USA
*
Author to whom correspondence should be addressed.
Remote Sens. 2019, 11(24), 2963; https://doi.org/10.3390/rs11242963
Submission received: 15 November 2019 / Revised: 6 December 2019 / Accepted: 7 December 2019 / Published: 11 December 2019
(This article belongs to the Special Issue State-of-the-Art Remote Sensing in North America 2019)

Abstract

:
Recovery trajectories derived from remote sensing data are widely used to monitor ecosystem recovery after disturbance events, but these trajectories are often retrieved without a precise understanding of the land cover within a scene. As a result, the sources of variability in post-disturbance recovery trajectories are poorly understood. In this study, we monitored the recovery of chaparral and conifer species following the 2007 Zaca Fire, which burned 97,270 ha in Santa Barbara County, California. We combined field survey data with two time series remote sensing products: the relative delta normalized burn ratio (RdNBR) and green vegetation (GV) fractions derived from spectral mixture analysis. Recovery trajectories were retrieved for stands dominated by six different chaparral species. We also retrieved recovery trajectories for stands of mixed conifer forest. We found that the two remote sensing products were equally effective at mapping vegetation cover across the burn scar. The GV fractions (r(78) = 0.552, p < 0.001) and normalized burn ratio (r(78) = 0.555, p < 0.001) had nearly identical correlations with ground reference data of green vegetation cover. Recovery of the chaparral species was substantially affected by the 2011–2017 California drought. GV fractions for the chaparral species generally declined between 2011 and 2016. Physiological responses to fire and drought were important sources of variability between the species. The conifer stands did not exhibit a drought signal that was directly correlated with annual precipitation, but the drought likely delayed the return to pre-fire conditions. As of 2018, 545 of the 756 conifer stands had not recovered to their pre-fire GV fractions. Spatial and temporal variation in species composition were important sources of spectral variability in the chaparral and conifer stands. The chaparral stands in particular had highly heterogeneous species composition. Dominant species accounted for between 30% and 53% of the land cover in the surveyed chaparral patches, so non-dominant land cover types strongly influenced remote sensing signals. Our study reveals that prolonged drought can delay or alter the post-fire recovery of Mediterranean ecosystems. It is also the first study to critically examine how fine-scale variability in land cover affects time series remote sensing analyses.

Graphical Abstract

1. Introduction

Wildland vegetation in Southern California frequently experiences intense crown fires that significantly alter ecosystem function by destroying aboveground biomass and altering soil properties [1]. Fires affect carbon cycling, nutrient cycling, soil water repellency, runoff, erosion, streamflow, and sediment export [2,3,4]. Burned vegetation is also the largest driver of carbon stock loss in California [5]. These effects generally diminish as vegetation regrows [2,4], although fire-induced changes in the composition of vegetation patches can lead to long-term changes in ecosystem structure and function [6].
Monitoring burn severity and post-fire vegetation regrowth are essential for detecting the ecological effects of wildfires, especially as large fires become more frequent in the western United States [7]. Field surveys are a common method of assessing ecological changes after fires, but they are expensive and time consuming, especially for continuous landscape-scale monitoring. Remote sensing is another method of monitoring land cover change, which provides broad spatial and temporal coverage. Landsat imagery covering the entire globe has been collected regularly for over 45 years and is now freely available for public use [8]. Recent studies have taken advantage of this data availability by developing time series data sets to monitor ecosystem recovery after wildfires [9,10,11]. The recovery trajectories derived from these data sets are an improvement over simple two-date change detection models because they capture the temporal variability that occurs after fires, including inter- and intra-annual trends [12].
Various remote sensing products have been used to develop post-fire recovery trajectories. Spectral indices are the most common method of assessing burn severity and post-fire vegetation regrowth using Landsat imagery. Many studies rely on the normalized burn ratio (NBR) and its variants for these purposes [13,14]. Spectral indices such as NBR primarily measure changes in greenness compared to pre-fire conditions. These indices are easy to calculate and are computationally efficient, however they produce unitless values that do not directly measure any biophysical property [15]. Spectral mixture analysis (SMA) is another method of assessing fire effects using remote sensing data [10,16,17,18]. SMA estimates the fractional cover of different materials, such as green vegetation, within a pixel. While spectral indices such as NBR produce unitless measures of vegetation greenness, SMA can generate absolute estimates of green vegetation (GV) cover inside of a pixel. As a result, SMA fractions are physically meaningful values that can be compared with observations by field ecologists [15]. This has obvious advantages for studies that integrate remote sensing and field ecology data. Fire effects also vary at a scale that is finer than the spatial resolution of many spaceborne sensors [19]. Spectral indices that assign a single value to a pixel do not capture this subpixel variability, but SMA can decompose the remote sensing signal in order to determine a pixel’s composition. As a result, SMA is more sensitive to the variability that occurs within vegetation patches after fires. That being said, SMA models require extensive calibration in order to produce accurate retrievals.
While remote sensing trajectories are often used to monitor ecosystem recovery after wildfires, previous studies have retrieved recovery trajectories without a precise understanding of the underlying land cover. Plant species exhibit different physiological responses to fires, so the types and number of species present in a patch affect its recovery behavior. The structure and composition of vegetation patches also change over time as vegetation regrows [20,21]. These factors affect the timing and magnitude of vegetation greenness signals in remote sensing data, but few studies have examined these sources of variability [17]. Likewise, few studies have examined whether individual species or functional types exhibit unique recovery trajectories after the same disturbance event [17,22,23]. This study fills that gap. We combine multi-temporal remote sensing imagery with field survey data to retrieve post-fire recovery trajectories for chaparral species and stands of mixed conifer forest. We also examine how fine-scale variability in species composition influences post-fire recovery trajectories. In doing so, we answer the following research questions:
  • How effectively do NBR and GV fractions map vegetation cover across a burn scar?
  • How variable are post-fire recovery trajectories for different plant species and functional types? What drives this variability?
  • How heterogeneous are the structure and composition of vegetation patches in chaparral and mixed conifer ecosystems? How does this heterogeneity affect post-fire recovery trajectories?

2. Methods

2.1. Study Area

This study examines vegetation regrowth following the 2007 Zaca Fire in Santa Barbara County, California (Figure 1). The Zaca Fire burned 97,270 ha starting on 4 July 2007. It was fully contained on 2 September 2007. The majority of the burn scar is located in undeveloped wilderness areas inside of Los Padres National Forest. The elevation of the burn scar ranges from 254 m to 2077 m. Mean annual precipitation ranges from 324 mm to 1260 mm depending on elevation and topographic position, with 95% of the precipitation occurring between November and March [24]. The majority of vegetation cover inside the burn scar is chaparral shrubland, which is characterized by the presence of species such as Ceanothus spp., Arctostaphylos spp., and Adenostoma fasciculatum. Coastal sage scrub species such as Eriogonum fasciculatum occur in xeric locations. Oak species including Quercus berberidifolia, Quercus chrysolepis, and Quercus wislizenii are also prevalent across the landscape. Stands of conifers occur intermittently throughout the burn scar, especially at higher elevations. These stands include species such as Pinus coulteri, Pinus jeffreyi, Pseudotsuga macrocarpa, Abies concolor, and Calocedrus decurrens. The dominant chaparral and conifer species are evergreen, but many herbaceous species senesce during the summer dry season. Botanical nomenclature follows Baldwin et al. [25].
Recovery from the Zaca Fire was affected by the 2011–2017 California drought. Annual precipitation in California is summarized using water years that last from 1 October until 30 September. Santa Barbara County received abnormally low rainfall during the water years of 2011–2015, when county-wide rainfall was 40 to 69 percent of average (Figure 2) [26]. The water year of 2013–2014 was the worst drought year in the last 1200 years [27], and the period of drought from 2012 to 2015 was unprecedented in the historical record [28]. An atmospheric river provided substantial drought relief in January and February 2017 [29]. County-wide rainfall in the 2016–2017 water year was 136 percent of average [26]. Dry conditions returned in the next water year, and Santa Barbara County remained in some degree of drought condition until February 2019 [30].

2.2. Remote Sensing

2.2.1. Imagery

Landsat images from 2000 to 2018 (path 42, row 36) were used to monitor vegetation changes across the burn scar. Images from 2012 were omitted from the analysis because Landsat 5 failed in 2012 and Landsat 8 was not launched until 2013. Landsat 7 data were not used to fill the gap because its scan line corrector failed in 2003 [31]. The Level 2 surface reflectance products were acquired from the U.S. Geological Survey [32]. All images were captured in September, except for the 2015 image, which was captured in August because there was no cloud-free image available for September. September imagery was selected to maximize vegetation senescence at all elevations across the burn scar, which minimized variability in phenology caused by topography. As a result, GV cover is at its annual minimum in the September imagery. September image dates also coincide with the end of the California water year. The images from 2000 to 2006 were used to calibrate baseline metrics of vegetation cover. Based on fire history data, 98.3% of the burn scar had not burned in at least 40 years at the time of the Zaca Fire, so the pre-fire images represented mature vegetation [33]. The images from 2007 to 2018 were used to monitor vegetation regrowth after the fire. The measurements from 2013 to 2016 were affected by severe drought.
Imagery from the Airborne Visible/Infrared Imaging Spectrometer (AVIRIS) was used to build spectral libraries for SMA. AVIRIS is a 224 channel imaging spectrometer that was flown on a Lockheed ER-2 [34]. AVIRIS flightlines have been flown over the Zaca burn scar regularly since 2013 as part of the HyspIRI airborne campaign [35]. This study utilized five AVIRIS flightlines flown on 24 August 2015 and 17 June 2016. The five flightlines covered the majority of the burn scar. The Level 2 surface reflectance products for these images were acquired from NASA [36]. Additional pre-processing was performed on the 2015 flightlines in order to improve the reflectance retrievals and ensure consistent georegistration. See Meerdink et al. [37] for more information.

2.2.2. Relative Delta Normalized Burn Ratio

The normalized burn ratio (NBR) is commonly used to monitor land cover change after wildfires. NBR is derived from Landsat imagery using the formula
NBR = NIR SWIR 2 NIR + SWIR 2
where NIR is the near-infrared band and SWIR2 is the second shortwave infrared band [13]. The difference between pre-fire and post-fire NBR, known as delta NBR (dNBR), is often used as a metric of burn severity and vegetation regrowth [13]. NBR is sensitive to the amount of green vegetation in a pixel, so the largest dNBR values occur in pixels that had large amounts of green vegetation before a fire. To compensate for this bias, Miller and Thode [14] proposed the relative dNBR (RdNBR), which is calculated using the formula
RdNBR = NBR prefire NBR postfire | NBR prefire / 1000 |
RdNBR normalizes dNBR by pre-fire vegetation cover, so it is a more reliable metric for comparing disturbance and recovery patterns across disparate sites. RdNBR values are correlated with burn severity. Values near zero indicate that a pixel is undistinguishable from pre-fire conditions [14]. Previous studies of forested ecosystems have reported that RdNBR values greater than 650 indicate high burn severity. The maximum observed RdNBR values in those studies were approximately 1300 [14,38]. In a study of a chaparral ecosystem, Hubbert et al. [39] reported that 99% of pixels had RdNBR values greater than 1000.
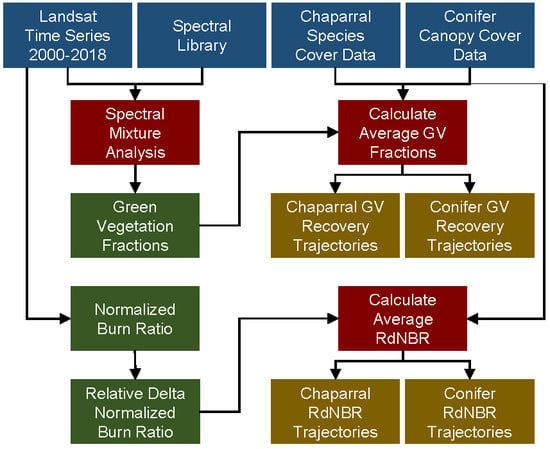
NBR was calculated for all of the Landsat images. RdNBR was then calculated for each year from 2007 to 2018. The median NBR value from 2000 to 2006 was used as NBR prefire for all RdNBR calculations. The NBR values from 2007 to 2018 were used as NBR postfire . This produced an RdNBR recovery trajectory for each pixel inside of the burn scar.

2.2.3. Multiple Endmember Spectral Mixture Analysis

SMA estimates the fractional cover of materials inside of a pixel [40]. SMA assumes that a pixels’ spectrum is a linear combination of the spectra of the materials inside of the pixel, weighted by the fractional cover of each material [41]. SMA estimates the fractional cover of different materials by decomposing the observed spectrum using reference spectra of pure materials, known as endmembers. Endmembers can be extracted from images or collected in situ using a field spectrometer. Field spectra can be captured at the leaf scale, branch scale, or stand scale. Image spectra are typically stand-scale measurements [42]. The SMA decomposition is based on the equations
S i λ = k = 1 N f k i E k λ + ε i λ
k = 1 N f k i = 1
where S is an observed spectral mixture for location i at wavelength λ . E is the set of N endmembers, k, which are weighted by the fractions f ki . ε is the residual between the modeled and measured spectra. The selected model for a pixel minimizes the root mean squared error (RMSE) between the modeled and measured spectra.
Multiple endmember spectral mixture analysis (MESMA), a variant of SMA, allows the number and types of endmembers to vary by pixel. It also places additional constraints on acceptable models [43]. Because the number and types of endmembers vary by pixel, MESMA spectral libraries can contain multiple endmembers for each class and endmembers for classes that are not present across the entire scene. As a result, both the size of the spectral library and the number of potential models for each pixel can be very large. To address this, several techniques have been developed to select potential endmembers and choose the ones that form the best possible spectral library [44,45,46]. Endmember selection is an important step that determines the accuracy of the final product [47,48].

Spectral Library Development

For this study, MESMA GV fractions were used to monitor vegetation regrowth inside of the burn scar. Endmembers for the MESMA spectral library were extracted from the AVIRIS images and used to unmix the Landsat images. AVIRIS endmembers were used because the spectra were acquired at an appropriate spatial scale for ecological studies [42] and can be convolved to the spectral resolutions of broadband sensors such as Landsat. While endmembers can be extracted directly from Landsat imagery, the higher spectral resolution of AVIRIS data makes it possible to identify narrow absorption features, which may reveal the contents of the pixel in more detail [49]. The higher spatial resolution of AVIRIS also increases the likelihood of extracting spectrally pure endmembers.
The goal of the MESMA analysis was to quantify the fractional cover of GV, non-photosynthetic vegetation (NPV), and soil within each pixel, so potential endmembers were stratified across those classes. Classification and Assessment with Landsat of Visible Ecological Groupings (CALVEG) data were used as ground reference data during endmember extraction. CALVEG is a GIS database of California land cover that is maintained by the U.S. Forest Service [50]. We extracted endmembers from areas dominated by six CALVEG alliances that represent different plant species and functional types:
  • Ceanothus chaparral alliance
  • Chamise alliance
  • Scrub Oak alliance
  • Coast Live Oak alliance
  • Bigcone Douglas-fir alliance
  • Black Cottonwood alliance
GV spectra were extracted from the June 2016 AVIRIS flight lines. Approximately 15 GV spectra were selected from each flight line for each alliance, totaling 480 potential GV endmembers. NPV spectra were extracted from the August 2015 flight lines in order to maximize vegetation senescence across the scene. We extracted 495 potential endmembers from areas dominated by annual grasses and forbs, which were senesced at the time the images were captured. Soil spectra were also extracted from the August 2015 flight lines in order to minimize spectral contamination from photosynthetic vegetation. We extracted 559 potential soil endmembers from areas covered by barren ground, agricultural soil, and streambed alluvium.
Iterative endmember selection (IES) was used to select the most representative endmembers from each subclass (i.e., the six GV alliances, the three soil types, and NPV) [44,51]. For each subclass, IES picks the pair of endmembers that has the highest kappa statistic for that subclass. It then iteratively adds and removes endmembers from the selection in order to increase the value of the kappa statistic. IES is completed when it is not possible to increase the value of the kappa statistic by adding or removing any more endmembers from the spectral library. IES is an automated process that selected 26 GV endmembers, 17 soil endmembers, and 3 NPV endmembers for inclusion in the spectral library.
Eight additional endmembers were manually added to the library. Three of the eight endmembers (two NPV endmembers and one soil endmember) were extracted from WestUSA, which is a reference spectral library that was created using a field spectrometer [42]. These endmembers were brighter than the image spectra and helped ensure that the spectral library captured the full range of illumination variability that occurred within the scene. Three ash endmembers were extracted from an AVIRIS image flown shortly after the 2004 Gaviota fire in Santa Barbara County, California. A fourth ash endmember was extracted directly from the September 2007 Landsat image. The burn scar was covered in ash when the 2007 Landsat image was collected, so the ash endmembers helped model parts of that image. Ash is short-lived on the landscape after fires [52], so the four ash endmembers were only included in the spectral library for the 2007 image. Finally, photometric shade with zero reflectance at all wavelengths was added to the spectral library [41]. This enabled MESMA to model observed spectra that are proportionally darker than mixtures of endmembers because of illumination variability. After unmixing, the fractional cover allocated to the shade endmember was proportionally reallocated to the other materials in each pixel in order to estimate subpixel land cover [41]. This process is known as shade normalization.
After preliminary endmember selection was completed, the endmembers were manually inspected to ensure that they were pure representations of their class. Several endmembers were removed from the library because they represented a combination of multiple land cover types, which caused the models to overestimate GV fractions. In order to guide this process, we compared the modeled GV fractions for 2018 with ground reference data of GV cover from the field survey transects [53,54]. The selected endmembers maximized the agreement between the two data sets. The creation of the ground reference data is described in Section 2.3. In total, 18 GV endmembers, 2 soil endmembers, and 1 NPV endmember were manually removed from the library to ensure that it only contained pure endmembers.
The final MESMA spectral library contained 29 endmembers, including 8 GV endmembers, 16 soil endmembers, 4 NPV endmembers, and photometric shade. The library for the 2007 image also contained the four ash endmembers. All plant species and all soil types were represented in the final library. The spectral libraries were convolved to the spectral resolutions of Thematic Mapper (TM), Enhanced Thematic Mapper Plus (ETM+), and Operational Land Imager (OLI) before unmixing.

Spectral Unmixing

MESMA was performed using VIPER Tools version 2.0 [55], an extension for ENVI (Harris Geospatial Solutions, Broomfield, CO, USA). All Landsat images were unmixed using the spectral library described in the previous section. The potential models for each pixel contained between two and four endmembers from different classes (i.e., GV, NPV, soil, and shade). The selected model minimized the RMSE between the modeled and measured spectra. Several constraints were placed on MESMA in order to ensure that the selected models were physically reasonable: endmember fractions were constrained between 0 and 1, shade fractions were constrained between 0 and 0.8, and the maximum allowable RMSE was 0.025 [56]. All fractions were shade normalized after unmixing. The shade-normalized GV fractions were extracted for each image date in order to create a GV trajectory for each pixel inside of the burn scar.

2.2.4. Assessment of Remote Sensing Products

The selected MESMA model maximized the agreement between the 2018 GV fractions and ground reference data of GV cover from the field survey transects. RMSE and Pearson’s correlation coefficient were used to quantify model fit. The units of the GV fractions are the same as the units of the field observations (i.e., percent cover of vegetation scaled from 0–1), so the two data sets could be directly compared. NBR and RdNBR produce unitless values, so they cannot be directly compared with field observations. We assessed their ability to model changes in vegetation cover by calculating the correlation between the 2018 NBR values and the ground reference data. While RdNBR was ultimately used to quantify post-fire vegetation regrowth, RdNBR values do not represent land cover at one point in time; RdNBR is a multi-temporal metric that measures changes in NBR values between two image dates. Thus, it is appropriate to use NBR, but not RdNBR, to assess model fit. We also calculated the correlation between the MESMA and NBR products to quantify the strength of their agreement.

2.3. Vegetation Field Surveys

In order to characterize the land cover in the remote sensing images, we conducted vegetation field surveys in the summer of 2018. These data enabled us to analyze how fine-scale variability in land cover influences remote sensing signals of post-fire vegetation regrowth. Species cover data were collected from eighty-two 45 m transects located throughout the burn scar. The transect locations were selected based on six criteria:
  • in an area of high burn severity (2007 dNBR > 600)
  • homogenous vegetation composition
  • homogenous slope and aspect
  • minimum 40 m from a road to minimize the impacts of the road on surrounding vegetation (e.g., invasive grass)
  • maximum 150 m from an accessible road or trail
  • estimated slope less than 35 degrees
Because species composition is an important control on post-fire recovery behavior, we also stratified the survey sites by dominant vegetation type using CALVEG data. Approximately half of the sites were dominated by mixed chaparral (e.g., Ceanothus spp., Arctostaphylos spp., and A. fasciculatum), a quarter of the sites were in oak woodlands, and a quarter of the sites were located at the interface of chaparral shrubland and mixed conifer forests. The sites located near the forests did not have conifer overstories and were primarily covered by conifer saplings, shrubs, or herbaceous species.
Species cover data were collected from the 45 m transects using a digital camera mounted on a 5 m tall boom (Wonder Pole, Salem, OR, USA). The camera was adjusted so that the lower border of each image aligned with the transect tape and the upper border of the image extended 5 m downslope of the transect tape. Photographs were taken every 5 m along the transect tape, totaling 10 photographs for each transect. A small number of survey sites had no slope. For those sites, photographs were taken on both sides of the transect tape at five evenly spaced points along the transect. Every plant species within each transect was identified and extensive notes were taken recording the locations of each species within the transect. Grass species were not identified individually and were assigned to a single taxonomic group.
To estimate the fractional cover of different species within each transect, points were sampled from each photograph using a regular sampling scheme [57,58]. In the laboratory, we overlaid a 7 × 6 point grid onto each photograph and labeled the species cover at each grid point. Non-biotic land cover types (e.g., rock and charcoal) were also labeled accordingly. In total, there were 42 grid points for each photograph and 420 grid points for each transect. The proportion of grid points assigned to each species was used as an estimate of its fractional cover within the transect.
GV, NPV, and soil fractional cover were estimated using the same method. These estimates were used to calibrate endmember selection for the spectral mixing models, as described in Section 2.2.3. Because these cover types vary at a finer spatial resolution than species cover, a 10 × 10 grid was overlaid onto each photograph, totaling 1000 grid points for each transect. The proportion of grid points assigned to each cover type was used as an estimate of its fractional cover within the transect.
The species cover data were analyzed using principal components analysis (PCA) to identify species assemblages across the transects. We only analyzed cover data for dominant species, defined as species that had a fractional cover greater than 25% in at least one transect [59]. PCA was performed on cover data for all of the transects, even if a species was not dominant in a particular transect.
We also performed two additional analyses to quantify fine-scale variability in land cover. We calculated the mean percentage of land cover that was identical between all pairs of transects dominated by each species. This enabled us to test whether stands dominated by the same species have consistent land cover across the landscape. We also calculated the percent cover of dominant species in each transect. Species exhibit different physiological responses to disturbance, so compositional heterogeneity within and across vegetation stands may inhibit our ability to attribute remote sensing signals to particular plant types.

2.4. Conifer Canopy Cover

The field survey protocol could not quantify the canopy cover of mature conifer trees, so conifer canopy cover was determined by manually interpreting high-resolution imagery. Conifer stand boundaries were extracted from CALVEG. We extracted all 756 stands within the burn scar dominated by the “Mixed Conifer–Pine” alliance. This alliance was selected because its stands are located in areas of known conifer mortality after the fire (Dr. Nicole Molinari, personal communication), and because it contains most of the conifer species found within the burn scar. The stands are primarily located in the vicinity of Big Pine Mountain in Los Padres National Forest.
The conifer stand boundaries were overlaid onto high-resolution imagery available through the National Agriculture Imagery Program and Google Earth (Google, Mountain View, CA, USA). We utilized images captured from 2002 to 2018. Percent canopy cover from before and after the fire was manually assessed and recorded for each stand. Canopy cover was classified into four classes: no trees (0% canopy cover), sparse (1–25% canopy cover), open (25–75% canopy cover), and dense (75–100% canopy cover). Thresholds in 25% increments were selected to minimize subjectivity and error during the manual interpretation process [60]. They are similar to thresholds used by Canada’s National Forest Inventory [61] and previous studies [62].

2.5. Recovery Trajectories

RdNBR values were computed for each year from 2007 to 2018. GV fractions were computed for each year from 2000 to 2018. Values for the remote sensing products were extracted from the centroid of each 45 m transect. In order to determine whether different species exhibited distinct recovery trajectories, the transects were grouped by dominant species. Mean RdNBR and GV trajectories were then computed for each dominant species. Median RdNBR values and GV fractions were also extracted from the 756 stands of mixed conifer forest. The stands were then grouped based on pre-fire and post-fire canopy cover and the mean trajectories were computed for each group.

3. Results

3.1. Land Cover

Species cover data for the chaparral shrubland were collected from 82 vegetation transects between June and August of 2018. Sixty-nine plant species and four non-biotic land cover types were observed within the transects. There were between 3 and 19 species in each transect, with a mean diversity of 8.4 species. In total, there were 14 dominant species, which had more than 25% cover in at least one transect.
PCA of the transect data for the dominant species revealed that the ground cover of one dominant species often had low or negative correlations with the ground cover of other dominant species (Figure 3). This was particularly true for the four most prevalent species: Q. berberidifolia, Ceanothus cuneatus, A. fasciculatum, and Arctostaphylos glandulosa. This suggests that these species are diagnostic of the different vegetation alliances that exist across the landscape. These chaparral alliances are well documented in literature, and their distributions respond to fine-scale variability in environmental conditions. A. fasciculatum dominates in many arid locations. Obligate-seeding Ceanothus spp. (e.g., C. cuneatus) and Arctostaphylos spp. dominate on ridge lines and arid south-facing slopes. Q. berberidifolia dominates on mesic north-facing slopes [63,64].
We also calculated the mean percentage of land cover that was identical between all pairs of transects dominated by each species (Table 1). This provided a metric of compositional similarity that revealed whether stands dominated by a given species had consistent land cover across the landscape. For the four most prevalent species, the compositional similarity ranged from 54.27 to 60.84%. Nearly half of the land cover within those transects was different, even though the dominant species were the same. We also calculated the dominant species cover in each transect (Table 1). For the four most prevalent species, the mean dominant species cover ranged from 32.53% to 47.94%. The remainder of the land cover belonged to non-dominant land cover types. P. coulteri and Quercus agrifolia were excluded from these analyses because they only dominated one transect each.
Based on these findings, Q. berberidifolia, C. cuneatus, A. fasciculatum, A. glandulosa, Ceanothus leucodermis, and Cercocarpus betuloides were selected for remote sensing analysis. The first five species were selected because they were the most prevalent species across the landscape. C. betuloides was selected because previous studies reported that it had extremely low mortality during the 2011–2017 California drought [65]. The six selected species also represent different functional responses to fire. After wildfires, chaparral species either resprout from surviving underground plant tissue (obligate resprouters), recruit from seeds (obligate seeders), or both (facultative seeders) [66]. Q. berberidifolia and C. betuloides are obligate resprouters. C. cuneatus is an obligate seeder. A. fasciculatum, A. glandulosa, and C. leucodermis are facultative seeders [67,68,69].
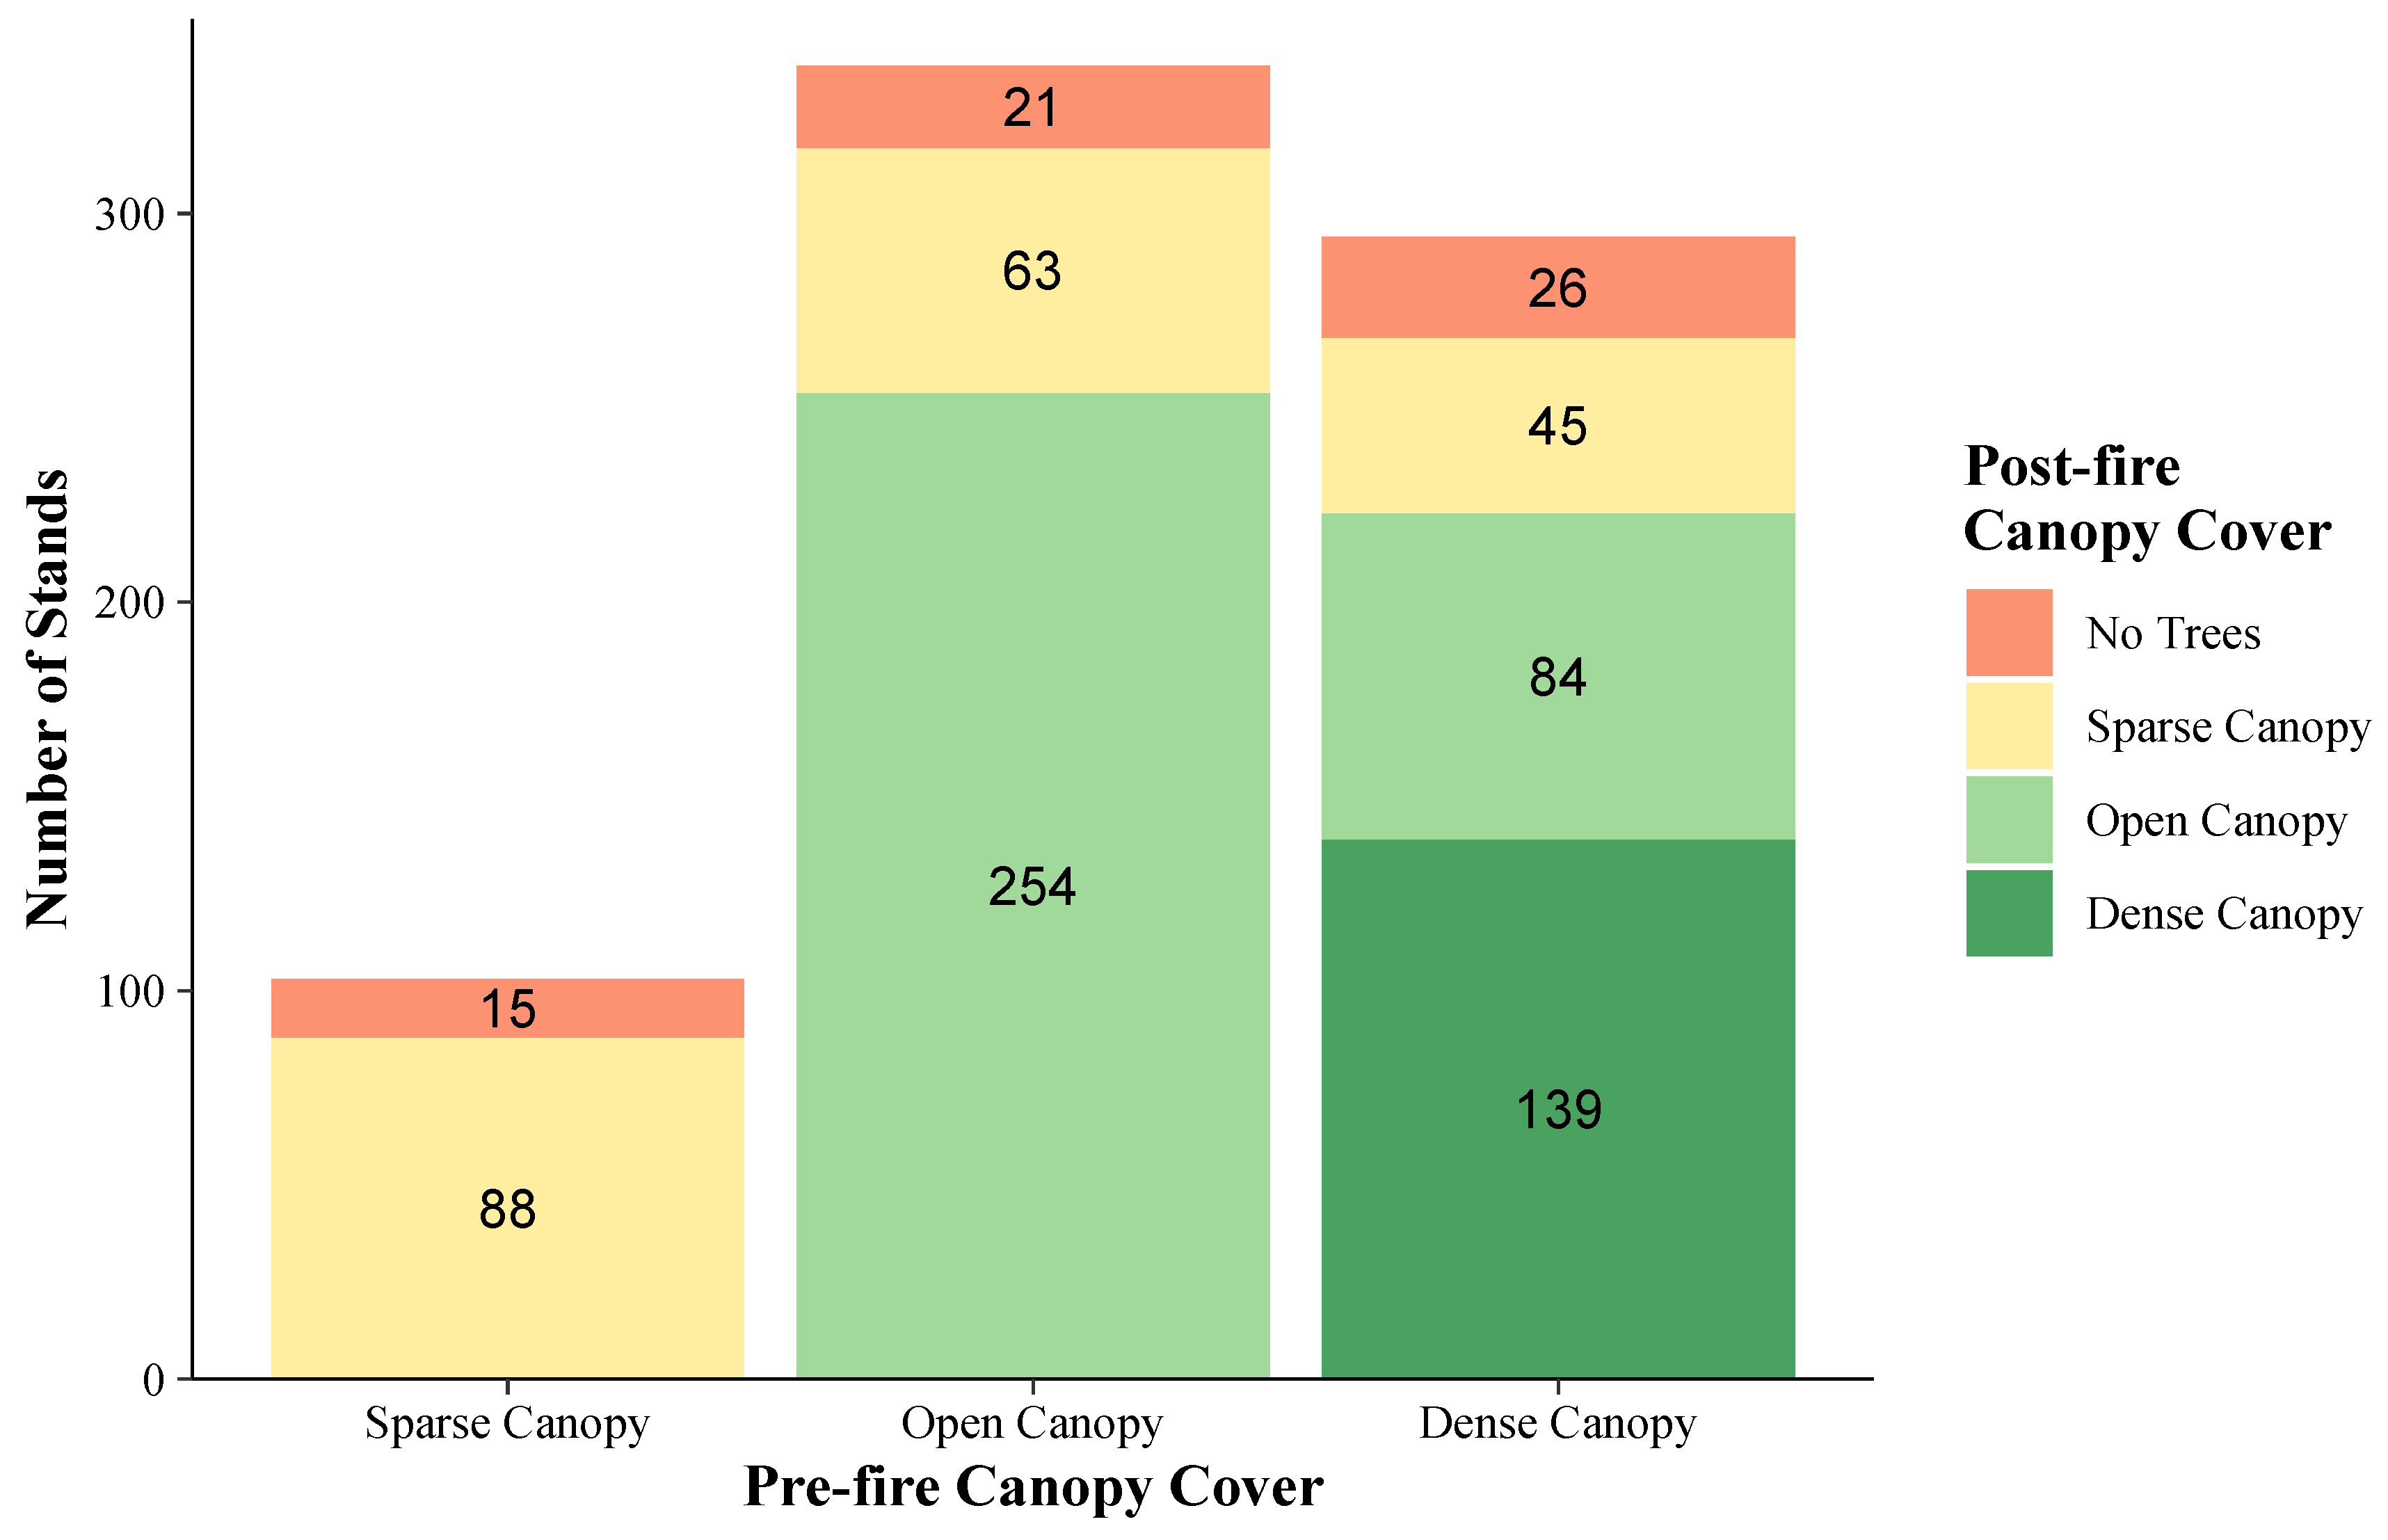
In order to assess fire impacts on the mixed conifer forest, pre-fire and post-fire canopy cover were manually labelled for all 756 CALVEG stands dominated by the “Mixed Conifer–Pine” alliance (Figure 4). Saplings could not be resolved in the imagery, so the classifications were based on the fractional cover of mature trees. In total, 254 stands (34.6%) changed canopy cover class as a result of the fire. 481 stands (65.4%) did not change canopy cover class. Sixty-two stands (8.4%) experienced complete conifer mortality. No stand had more canopy cover after the fire than it did before the fire. Twenty-one stands were classified as having no trees before the fire. These stands appear to have been misclassified by CALVEG and were excluded from further analysis.

3.2. Recovery Trajectories

3.2.1. Assessment of Remote Sensing Products

The GV fractions for 2018 achieved strong agreement with the ground reference data of vegetation cover from the transect photographs (RMSE = 0.096, n = 80; Figure 5). The 2018 GV fractions (r(78) = 0.552, p < 0.001) and 2018 NBR values (r(78) = 0.555, p < 0.001) had nearly identical correlations with the ground reference data. The two data sets also exhibited very strong linear relationships with each other. We calculated the correlation between the GV fractions and NBR values for each year from 2000 to 2018. The annual correlation coefficients ranged from 0.9 to 0.98. The mean annual correlation coefficient was 0.952. The four lowest correlation coefficients occurred in the four years after the fire.

3.2.2. Relative Differenced Normalized Burn Ratio

Mean 2007 RdNBR values for the six chaparral species ranged from 1275 to 1423. All six species recovered rapidly between 2007 and 2011, but recovery stalled between 2013 and 2016 (Figure 6). These dates coincided with a period of extreme drought [70]. C. leucodermis generally had the highest mean RdNBR values throughout the time series, followed by A. glandulosa. C. betuloides had the lowest mean RdNBR values after 2011, suggesting that it was more resilient during drought than the other species. The trajectories for A. fasciculatum, C. cuneatus, and Q. berberidifolia had intermediate RdNBR values and were similar throughout the time series.
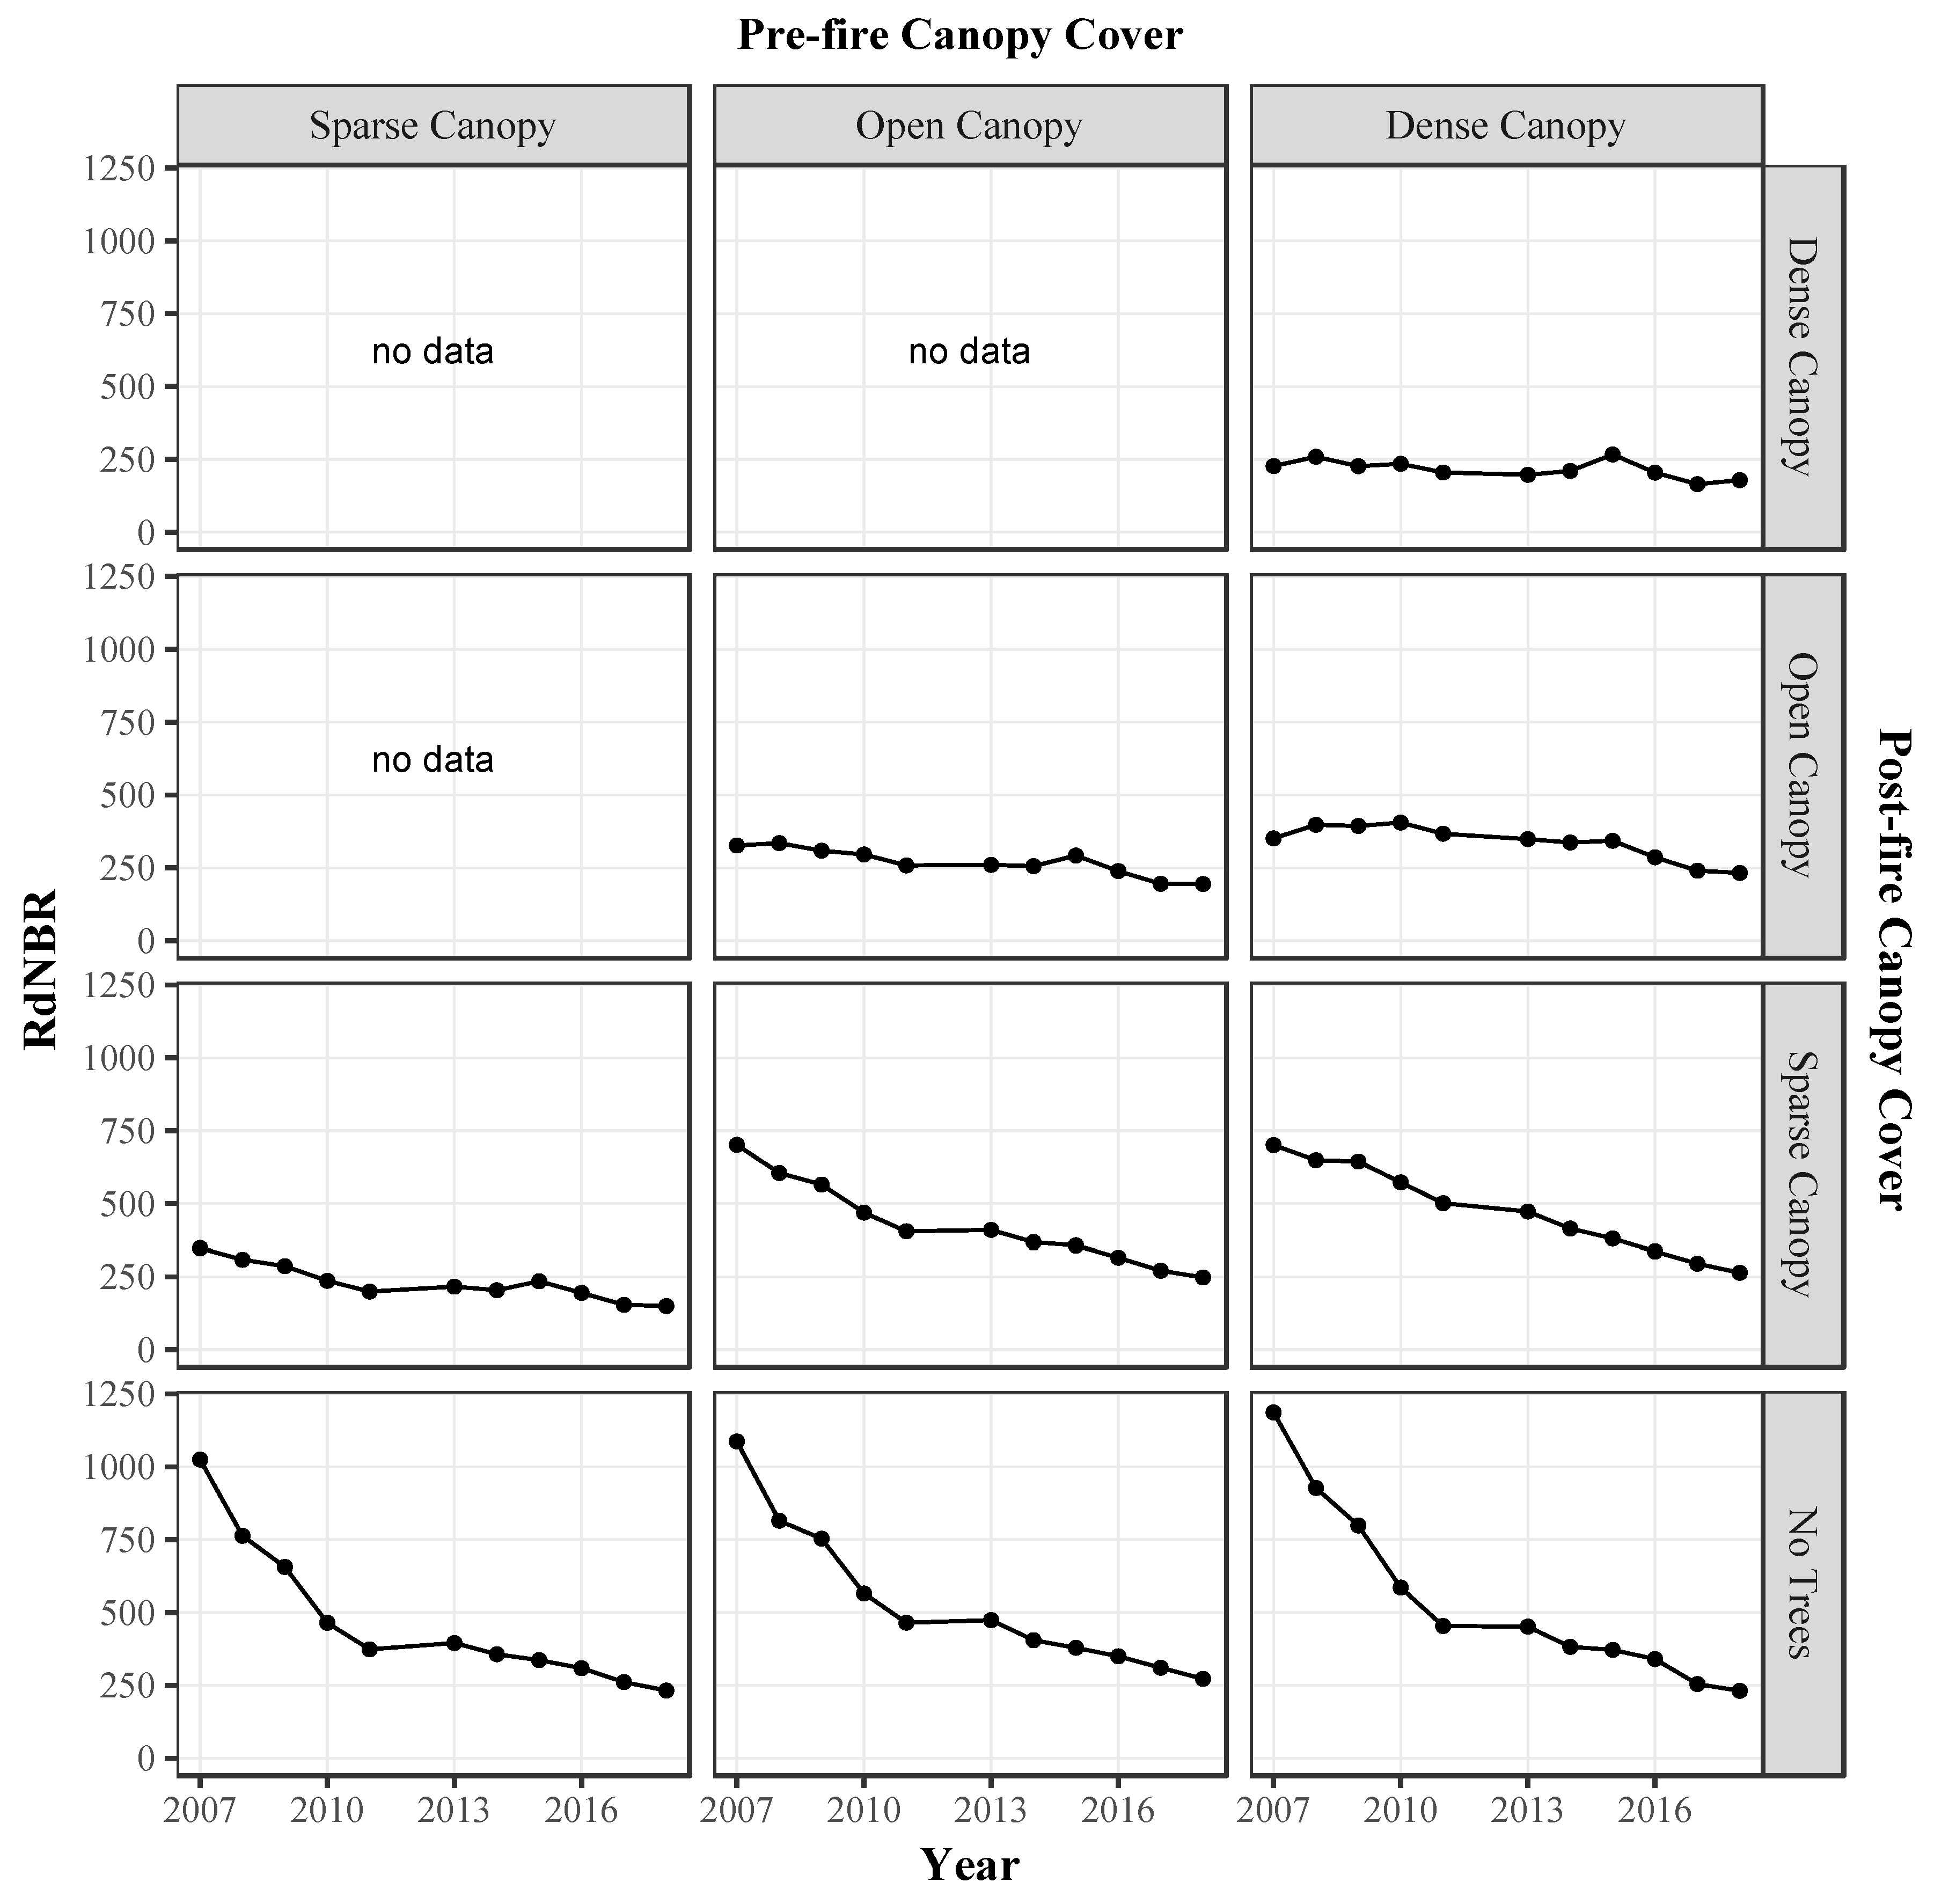
The RdNBR values for the conifer stands were inversely correlated with the degree of canopy loss following the fire (Figure 7). In stands that experienced complete canopy loss (n = 62), the mean 2007 RdNBR was 1114. Partial canopy loss leading to sparse (n = 108) or open (n = 84) canopies resulted in RdNBR values of 701 and 351, respectively. For stands that did not experience canopy loss (n = 481), the mean 2007 RdNBR value was 302. The degree of canopy loss also influenced the shapes of the recovery trajectories. In stands that experienced complete canopy loss (i.e., no mature trees survived), the RdNBR values decreased rapidly during the first four years of recovery and then more slowly after that. Other stands had more linear trajectories. Average 2018 RdNBR values were relatively similar across all combinations of pre-fire and post-fire canopy cover. The mean values for the different combinations only ranged from 150 to 272.

3.2.3. Green Vegetation Fractions

The six chaparral species had similar GV trajectories before the fire (Figure 8). The greenness of all six species fluctuated because of inter-annual variability in precipitation. There were substantial declines in vegetation greenness in 2002 and 2004, which were years that had below average rainfall in Santa Barbara County. C. leucodermis had the highest average GV fractions from 2001 to 2004.
The fire destroyed practically all green vegetation in the chaparral shrubland: mean 2007 GV fractions for the six species ranged from 0 to 0.01. GV fractions increased rapidly in the four years after the fire, but the recovery of C. leucodermis lagged behind that of the other species. GV fractions generally declined between 2011 and 2016, presumably as a result of the drought. C. betuloides had the highest GV fractions during the drought years, while GV fractions for the other species were substantially lower. C. leucodermis and A. glandulosa exhibited the least change during the drought, but the post-fire GV fractions for both species were much lower than their pre-fire values. By September 2017, GV fractions for four of the six species had recovered to the values observed in the dry pre-fire years of 2002 and 2004. In certain cases, GV fractions recovered to the values observed in wetter years such as 2003, but this pattern is not consistent across the data set. C. leucodermis and A. glandulosa did not recover to pre-fire values.
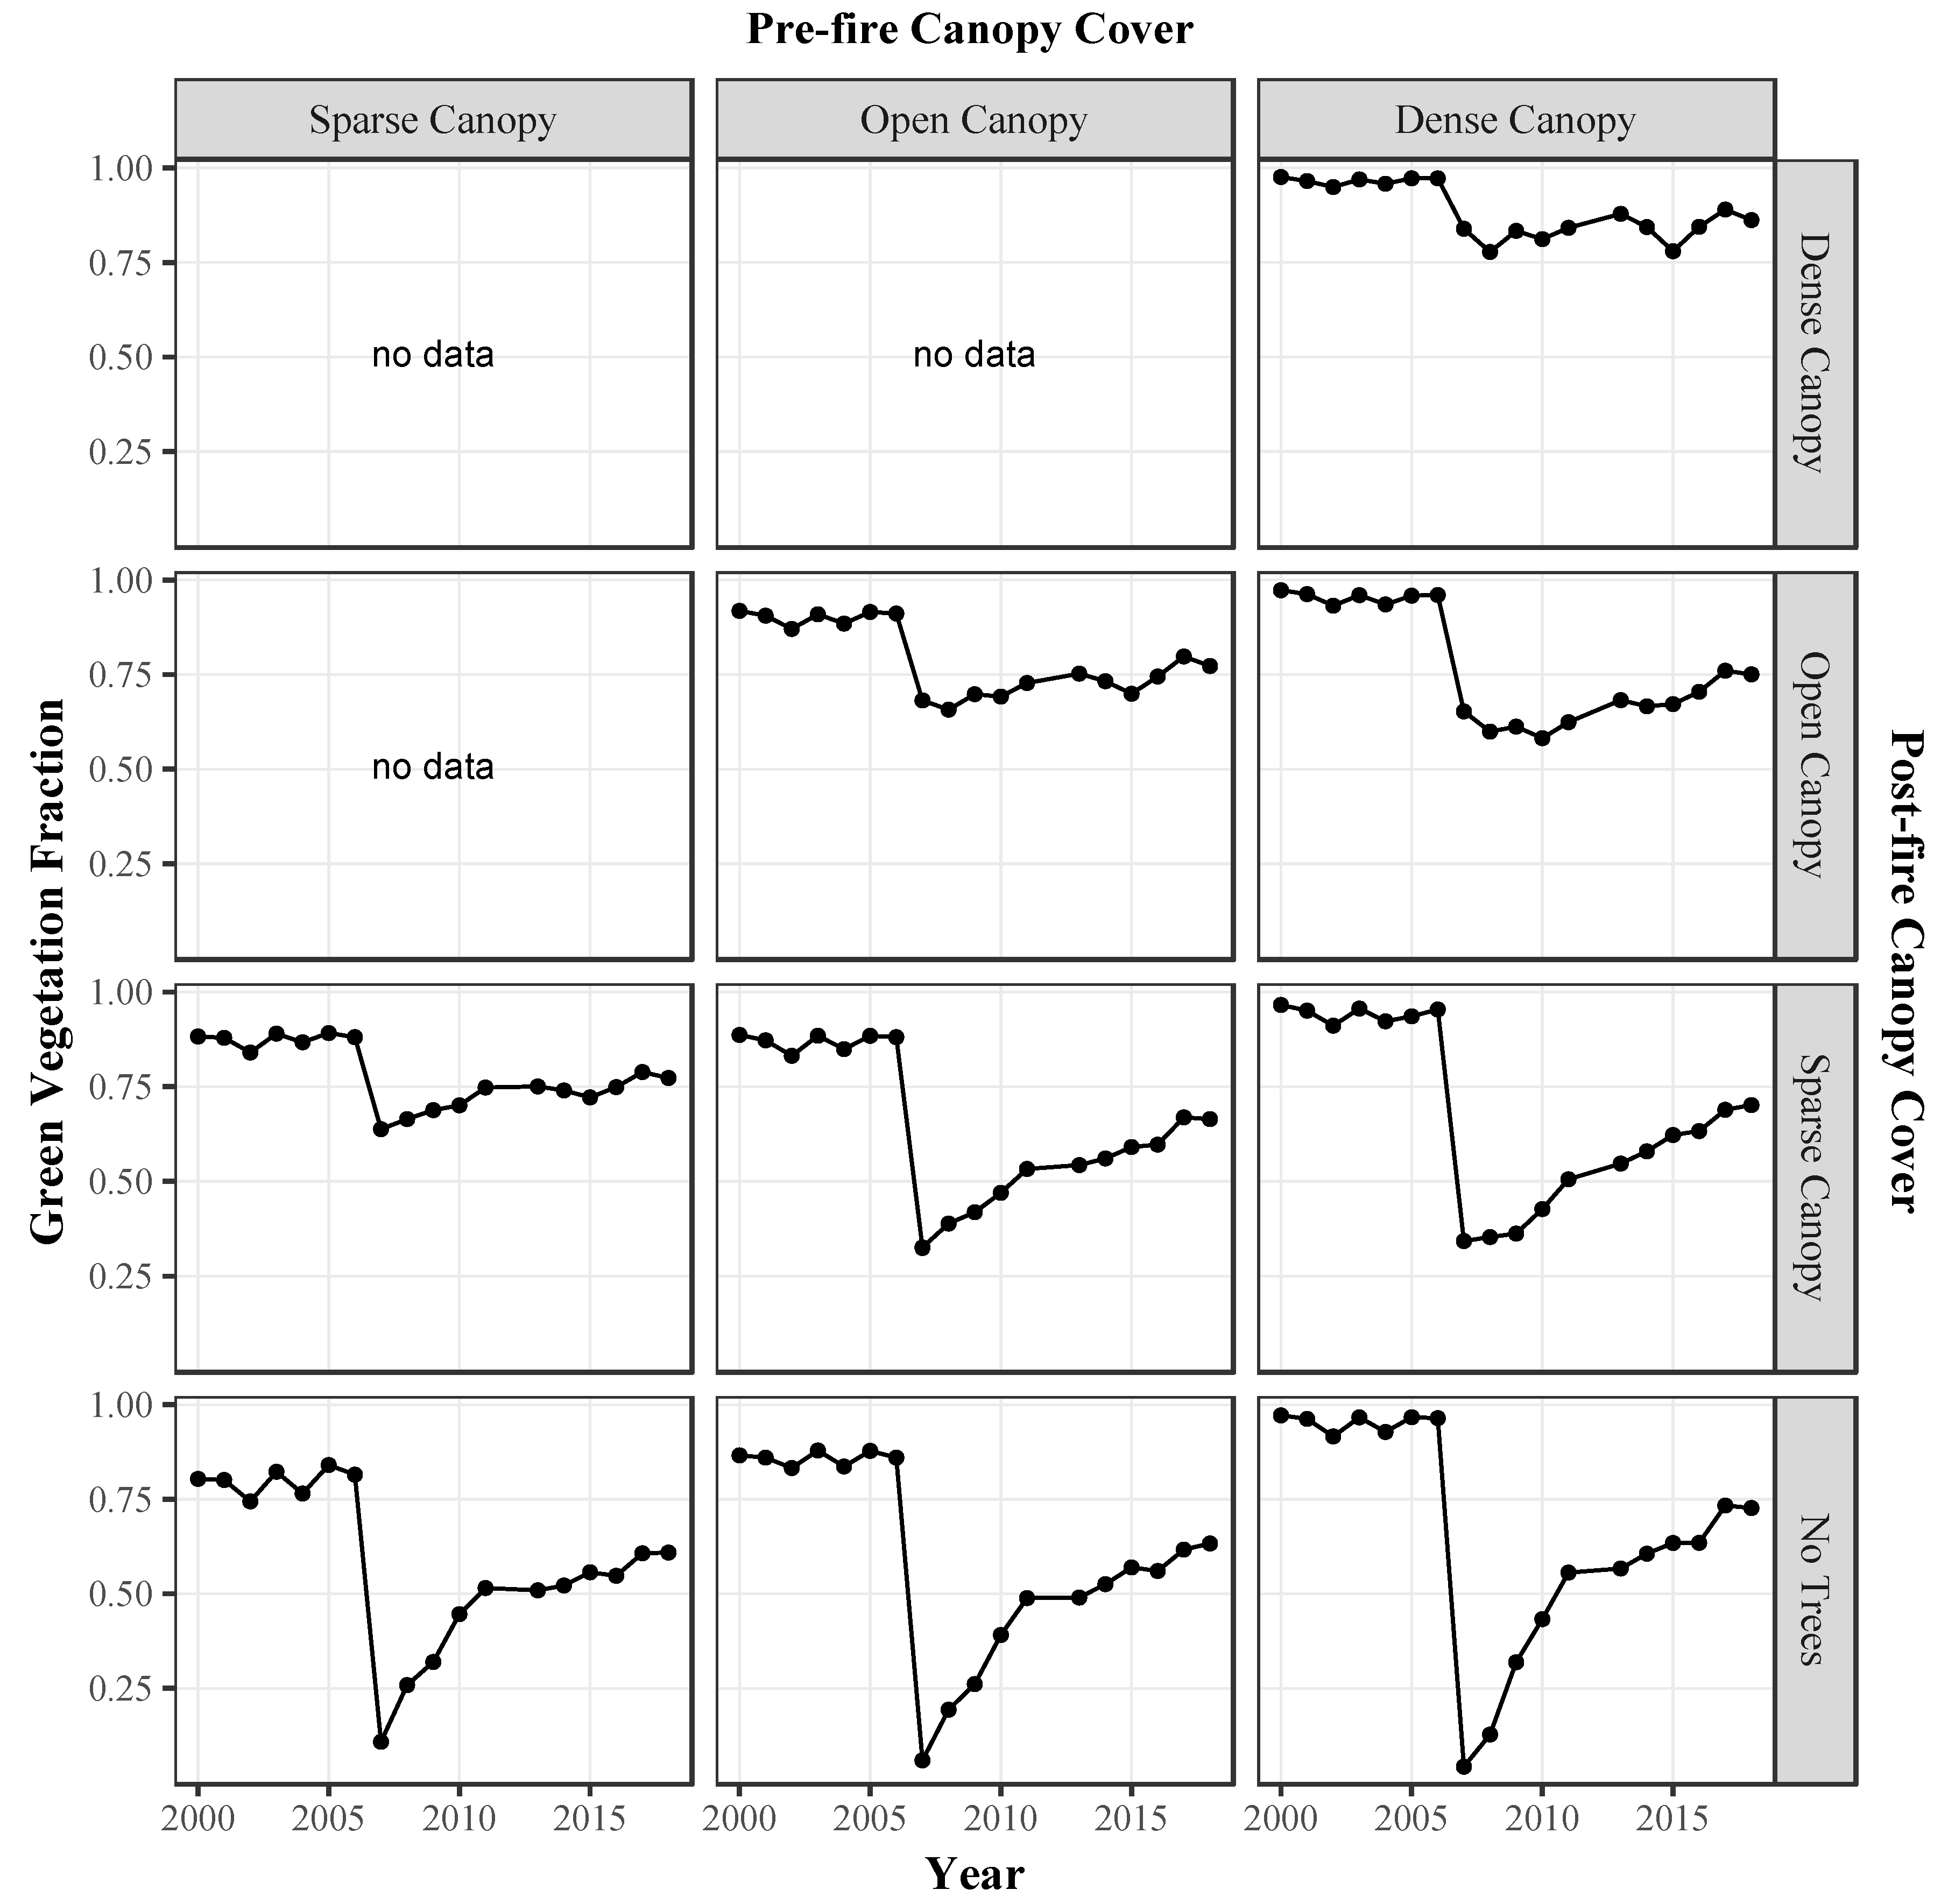
In the conifer stands, GV fractions declined between 2006 and 2007 as a result of the fire and increased between 2007 and 2018 as vegetation regrew (Figure 9). Conifer stands that experienced partial canopy loss exhibited linear recovery trajectories, while stands that experienced complete canopy loss exhibited logarithmic recovery trajectories. In stands that had small amounts of canopy cover after the fire, the post-fire GV signal must have been strongly influenced by shrubs and herbaceous species in the understory.
The maximum possible canopy loss occurred in conifer stands that had dense canopies before the fire and no trees after the fire. In those stands (n = 26), 2007 GV fractions were 92% less than their pre-fire median and 2018 GV fractions were 24% less than their pre-fire median. In stands that did not change canopy cover class (n = 481), 2007 GV fractions were 20% less than their pre-fire median and 2018 GV fractions were 12% less than their pre-fire median. 2018 GV fractions were less than pre-fire median GV fractions in 545 of the 756 stands that we analyzed.

4. Discussion

Field survey data are essential for understanding and evaluating remote sensing signals of disturbed ecosystems [71]. Likewise, remote sensing data can help interpolate field observations across an entire landscape. In this study, we combined field survey data with remote sensing imagery to retrieve post-fire recovery trajectories for different plant species and functional types. We also used the field survey data to identify sources of variability in the recovery trajectories that are not apparent from the imagery data alone.

4.1. Remote Sensing Products

The RdNBR and GV trajectories provide different insights into the post-fire recovery of burned vegetation. RdNBR measures the normalized difference between pre-fire and post-fire NBR values, so it represents the change in vegetation cover compared to pre-fire conditions. GV fractions are an absolute measure of vegetation cover on a single image date. We found that the NBR values and GV fractions had nearly identical correlations with the estimates of GV cover from the transect photographs. This finding suggests that they are equally effective at mapping post-fire vegetation cover. However, NBR and RdNBR produce unitless values, while GV fractions are physically meaningful values that can be compared with observations by field ecologists [15]. Unitless spectral indices can be combined with field survey data to model vegetation cover and other ecosystem traits [72], but it is not clear when such models can be transferred from site to site without additional ground reference data [73]. The NBR correlation with vegetation cover that we observed is similar to the correlation reported by Morresi et al. [74], but additional work is needed to validate the consistency of these relationships. Few studies have assessed the ability of NBR and other spectral indices to map fractional cover of vegetation.

4.2. Variability in Recovery Trajectories

4.2.1. Chaparral Species

The RdNBR and GV trajectories for the chaparral species revealed rapid vegetation regrowth from 2007 to 2011. The trajectories for the species were initially very similar, but diverged over time as vegetation regrew. The exception to this trend was C. leucodermis, whose recovery lagged one year behind that of the other species. Five of the six species exhibited substantial declines in GV fractions during the 2011–2017 California drought. By September 2017, GV fractions for four of the six species had recovered to the values observes in the dry years of 2002 and 2004, but the GV fractions did not consistently recover to the values observed in wetter years. We propose three factors that may account for the observed variability between species: post-fire ecological succession, the physiological responses of species to fire and drought, and inter-annual variability in precipitation.
The initial similarity between the trajectories may be attributable to a succession of ephemeral herbaceous species that germinate after fires. Immediately after a fire, the pre-fire dominant shrubs only comprise a small fraction of the land cover. It takes at least four to five years for shrubs to regain their pre-fire cover, and a succession of herbaceous species dominates vegetation patches while the shrubs regrow [21,75]. These ephemeral species likely influenced the remote sensing estimates of vegetation cover, and they may have obscured differences between the RdNBR and GV trajectories for the chaparral species. The herbaceous plants decline in cover as the shrubs regain dominance [21,75], so their influence on remote sensing signals diminishes over time. The trajectories began to diverge around 2010, and they exhibited distinct trends in subsequent years.
The physiological responses of species to fire and drought were also important drivers of variability in the recovery trajectories. The composition of patches dominated by obligate resprouters (e.g., Q. berberidifolia and C. betuloides) changes little after fires because resprouting plants emerge from established root systems and are extremely resilient. Resprouting plants also benefit from having established root systems because it decreases their vulnerability to water stress during post-fire recovery [76,77]. Obligate and facultative seeders (e.g., C. cuneatus, A. fasciculatum, A. glandulosa, and C. leucodermis) recruit from dormant seed banks and usually experience substantial population increases after fires. As a result, patches dominated by seeding species change in both structure and species composition for several years after the disturbance [21]. Unlike resprouting plants, seedlings must establish new root systems after a fire, which makes them more vulnerable to water stress until they reach maturity [76,77,78].
The physiological differences between the species were not expressed in the recovery trajectories until the onset of the drought in 2011, when the trajectories began to exhibit sensitivity to inter-annual variability in precipitation. C. cuneatus was the most sensitive to precipitation variability throughout the time series. Its GV fractions declined substantially during the drought years of 2011–2017 and increased rapidly during the wet growing seasons of 2004–2005 and 2016–2017. Its RdNBR values also increased during the drought and decreased rapidly between 2016 and 2017. It is likely that C. cuneatus was the most sensitive to drought because it is an obligate seeder, and seedlings have less extensive root systems than resprouting plants. C. betuloides, an obligate resprouter, was the most resilient species during the drought. It had the highest GV fractions and lowest RdNBR values after 2011. C. betuloides benefits from an established root system and is highly resistant to drought-induced cavitation, which enables it to thrive under dry conditions [79]. Our finding is also consistent with that of Venturas et al. [65], who reported that C. betuloides did not experience any mortality during the drought. A. glandulosa and C. leucodermis exhibited the least change during the drought, but their post-fire GV fractions were substantially lower than their pre-fire GV fractions. As a result, they generally had the highest RdNBR values throughout the time series. A. glandulosa is well adapted to arid microclimates, which may explain its relative stability during the drought [80]. The explanation for the drought response of C. leucodermis is less clear. C. leucodermis exhibited the slowest recovery, so its drought response might have been affected by the timing of its regrowth relative to the onset of the drought.
In 2018, the RdNBR values for all six species remained above zero, indicating that they did not recover to median pre-fire conditions 11 years after the fire. The GV fractions for four species recovered to the values observed in the dry years of 2002 and 2004, but C. leucodermis and A. glandulosa did not recover to pre-fire GV fractions. Several studies have used Landsat time series to analyze the post-fire recovery of chaparral ecosystems, but no studies have examined the impact of a prolonged drought on recovery trajectories [9,22,81,82]. The previous studies reported full recovery in 7–15 years, which may suggest that the 2011–2017 California drought delayed the recovery to pre-fire conditions within the Zaca burn scar. For example, Peterson and Stow [81] reported that GV fractions stabilized approximately seven years after a fire. Hope et al. [22] reported that the normalized difference vegetation index (NDVI) returned to pre-fire values in 10 years. Storey et al. [9] reported that the enhanced vegetation index, soil adjusted vegetation index (SAVI), and modified SAVI returned to pre-fire values in four years. They also reported that NBR and NDVI returned to pre-fire values in 9 and 12 years, respectively. McMichael et al. [82] reported that leaf area index stabilized approximately 15 years after a fire. That being said, there are important methodological differences between the previous studies and our study. The previous studies did not stratify their samples based on burn severity, while our study only examined high burn severity sites. Thus, burn severity may also account for some of the difference in the reported recovery times.

4.2.2. Mixed Conifer Forest

We also examined the 756 stands of mixed conifer forest within the Zaca burn scar. There was significant variability in stand density before and after the fire, so we grouped the stands based on their pre-fire and post-fire canopy cover. This enabled us to retrieve RdNBR and GV trajectories for varying degrees of canopy loss and vegetation type conversion. Two distinct patterns emerged among the recovery trajectories. First, as the extent of canopy loss increased, the 2007 RdNBR values increased and the magnitude of change between the 2006 and 2007 GV fractions also increased. Second, as post-fire canopy cover decreased, the shapes of the trajectories transitioned from being linear (high post-fire canopy cover) to logarithmic (low post-fire canopy cover).
The first pattern highlights a difference between the recovery trajectories for chaparral and conifer species. While chaparral stands are comprised of low-stature vegetation that is prone to intense crown fires, conifer forests have pronounced vertical structure that protects foliage from being scorched by flames. Low severity fires generally burn foliage that is close to the ground. As a fire’s severity increases, it burns foliage higher in the canopy [83]. Foliage above the maximum scorch height will still be green, so conifer stands with surviving trees can have non-zero GV fractions immediately after a fire. The 2007 GV fractions were approximately proportional to post-fire canopy cover, and the RdNBR values exhibited similar trends. Some stands that did not experience substantial canopy loss had higher than expected 2007 GV fractions, presumably due to surviving understory vegetation.
The second pattern can be attributed to the influence of understory vegetation on remote sensing signals after the fire. In stands with closed canopies, the recovery trajectories represent changes in the spectral properties of the tree crowns. In areas without closed canopies, the remote sensing signal is strongly influenced by understory cover [84]. Stands with dense canopy cover after the fire exhibited linear increases in GV fractions and little change in RdNBR values. Presumably, these trajectories represent the regeneration of scorched foliage within the tree crowns. Stands with no trees after the fire exhibited logarithmic trajectories that are qualitatively similar to the trajectories of the chaparral shrub species. These trajectories likely represent shrubs and other understory vegetation because the tree crowns were completely destroyed by fire. Stands with intermediate amounts of canopy cover after the fire had recovery trajectories that were neither perfectly linear nor logarithmic. These findings suggest that the conifer and shrub species have distinct recovery patterns, which are caused by their canopy architecture and physiological responses to fire.
Unlike the chaparral species, the conifer stands did not exhibit a drought signal that was directly correlated with annual precipitation. Both the RdNBR and GV trajectories indicated continuous recovery throughout the 2011–2017 drought. Nonetheless, 545 of the 756 conifer stands did not return to their pre-fire values within 11 years, indicating that there was long-term change as a result of the fire or drought or both. The most obvious source of long-term change is the fire-induced mortality of mature conifer trees. Prolonged drought can also reduce growth, cause crown dieback, and inhibit seedling establishment in conifer species [85,86,87]. Based on previous studies of fire effects, the drought likely delayed the return to pre-fire levels of greenness in the conifer stands. Fernandez-Manso et al. [10] retrieved GV trajectories for field survey plots in a Mediterranean forest. Plots with low burn severity recovered in seven years and plots with moderate burn severity recovered in 13 years. Moressi et al. [74] performed a similar analysis using spectral indices. They found that modeled recovery times varied between 8 and 12 years, depending on the forest type, burn severity, and spectral index. Almost none of the stands in our analysis recovered to pre-fire levels of greenness within 11 years, which suggests that fire effects alone do not account for the observed recovery times.

4.3. Species Composition

We also used the field survey data to quantify fine-scale variability in species composition within and across vegetation stands. Many studies rely on thematic land cover maps to analyze fire behavior and effects, but the biophysical attributes of vegetation patches vary continuously in both space and time [88,89]. Because the spatial variability occurs at a scale that is finer than the spatial resolution of most sensors, reflectance signals for individual pixels are influenced by numerous plant species and functional types. We observed between 3 and 19 species in each field survey transect, with a mean diversity of 8.4 species. The mean dominant species cover ranged from 30.16 to 52.94%, depending on the species. While classification schemes based on dominant species are simple and easy to understand, non-dominant species inevitably introduce spectral variability into remote sensing signals. If linear mixing is assumed, this variability is approximately proportional to the non-dominant species’ ground cover within a pixel. Dominant species accounted for less than half of the land cover in most transects, so non-dominant land cover types were as influential on the remote sensing signals as the dominant species. These findings suggest that the recovery trajectories may represent vegetation alliances dominated by particular species, rather than the dominant species themselves. We also analyzed whether stands dominated by a given species had consistent land cover across the landscape. On average, between 51.39% and 82.69% of the land cover was identical across transects dominated by the same species. This suggests that vegetation alliances are somewhat stable across the landscape, but there is still substantial within-class variability in patch composition.
Temporal variability in species composition also affects remote sensing trajectories. A succession of ephemeral species dominates vegetation patches after fires, as discussed in Section 4.2.1. Even after a vegetation patch has completed its initial recovery, it may not return to the state that was present before the fire. The post-fire distributions of seeding species are a function of fire intensity and the locations of dormant seed banks at the time of the fire [21]. Secondary disturbances such as drought can also affect the plant species and life forms that regenerate within burn scars [6]. Without pre-fire species cover data, it is difficult to determine where and to what extent the long-term species composition changed as a result of the fire. This introduces variability into remote sensing metrics that rely on pre-fire baseline values, such as dNBR and RdNBR. It also affects the interpretation of remote sensing trajectories that include pre-fire years. Few studies have considered temporal variability in species composition as a source of variability in remote sensing trajectories [17]. These factors merit further consideration in literature because remote sensing trajectories are often used to infer the drivers and effects of ecological change [90]. Misattributing remote sensing signals to different vegetation types could lead to erroneous conclusions about ecosystem dynamics.

4.4. Methodological Considerations

This study used field survey data to summarize and interpret remote sensing signals of post-fire vegetation regrowth. Certain limitations should be considered when interpreting the results. For example, the field survey data were collected at a different spatial scale than the Landsat spectra. The field survey data were collected from 45 m × 5 m transects, while Landsat spectra were extracted from 30 m × 30 m pixels. Documenting all of the plants along a 45 m transect is substantially more efficient than documenting all of the plants in a 30 m × 30 m area. This is especially true in chaparral ecosystems, where shrubs often form impenetrable canopies. The transects effectively subsampled the Landsat pixels, and we assumed that the subsamples were representative of the Landsat pixels as a whole. To the extent possible, we selected survey sites that had homogenous slope, aspect, and vegetation composition, which bolstered the validity of that assumption. For safety reasons, we also selected survey sites that were located near accessible roads and did not have steep slopes. Large areas of the burn scar are not located near roads, so certain vegetation alliances may be over- or underrepresented in the field survey data. The field survey data were also used to calibrate the MESMA model. It is possible that the MESMA model was overfit to a particular sample of ground reference data. However, the MESMA GV fractions exhibited a very strong linear relationship with the NBR values, which were derived from an entirely different modeling framework. This suggests that the field survey data were adequate to calibrate the MESMA model reliably. There may still be some error in the MESMA GV fractions, as they are modeled and not measured values.

5. Conclusions

Integrating field survey data into remote sensing analyses makes it possible to characterize the remote sensing signals for land cover types that would otherwise be difficult to differentiate. It also makes it possible to identify sources of variability in remote sensing data that are not apparent from imagery alone. In this study, we used time series imagery and field survey data to retrieve post-fire recovery trajectories for chaparral species and stands of mixed conifer forest. In doing so, we answered three research questions.
First, we examined whether NBR and GV fractions were effective for mapping vegetation cover across a burn scar. The selected MESMA model maximized the agreement between the modeled GV fractions and ground reference data of GV cover from the field survey transects. The two data sets achieved strong agreement, indicating that the GV fractions were a reliable estimate of GV cover across the burn scar. The NBR values and GV fractions had very similar correlations with the ground reference data, indicating that they were equally effective at mapping vegetation cover.
Second, we examined sources of variability in post-fire recovery trajectories for chaparral species and stands of mixed conifer forest. For the chaparral species, precipitation variability and species-level physiology were the most obvious sources of variability throughout the time series. The chaparral species exhibited rapid regrowth between 2007 and 2011, but GV fractions for five of the six species declined substantially during the drought. In 2018, RdNBR values for the six species remained above zero, indicating that they had not recovered to pre-fire conditions. For the conifer stands, the shapes of the recovery trajectories were determined by post-fire canopy cover. Stands with high post-fire canopy cover had linear recovery trajectories, while stands with low post-fire canopy cover had logarithmic recovery trajectories. The conifer stands did not exhibit a drought signal that was directly correlated with annual precipitation, but in a majority of stands the GV fractions did not recover to their pre-fire values.
Finally, we examined variability in the structure and composition of chaparral and conifer patches. In the surveyed chaparral patches, dominant species only covered 30 to 53% of the land area. Even within patches dominated by the same species, there was significant variability in species composition across the landscape. Non-dominant species inevitably affected the remote sensing signals, and these effects may not be consistent from patch to patch. In the conifer stands, canopy dieback exposed understory land cover, including shrubs, grasses, and soil. In stands with substantial amounts of canopy loss, the recovery trajectories were strongly influenced by understory vegetation. For both chaparral and conifer stands, these effects vary over time because a succession of ephemeral species populate vegetation patches as the long-term dominant species recover.
Our study expands on previous literature by exploring the opportunities and limitations of using Landsat time series to monitor ecosystem recovery after disturbance. This technique has gained popularity since the Landsat archive became freely available. Few studies have used species cover data to retrieve post-disturbance recovery trajectories for different plant species and functional types. The trajectories we retrieved were sensitive to changing environmental conditions and some physiological differences between the species. The pre-fire and post-fire values were also useful for assessing whether the ecosystem recovered to pre-fire conditions. However, our findings also suggest that there may be fundamental limitations in our ability to infer the traits of individual species using Landsat imagery. Species cover often varies at a scale that is finer than the spatial resolution of spaceborne sensors, so researchers must be cognizant of the impact of non-dominant land cover types on remote sensing signals. These considerations will become increasingly important as hyperspectral spaceborne sensors become operational and researchers attempt more precise retrievals of ecosystem properties.
Our study also reveals that prolonged droughts can slow or even reverse the post-fire recovery of Mediterranean ecosystems, which can lead to long-term changes in ecosystem structure and function [6]. Both fire activity and drought conditions have increased under anthropogenic climate change [7,91], so it is increasingly likely that land managers will be forced to address multiple overlapping disturbances in sensitive ecosystems. Without targeted management and restoration efforts, vulnerable species may disappear from the landscape if they cannot maintain reproducing populations under changing environmental conditions [86].

Author Contributions

Conceptualization, D.A.R., C.M.D. and S.H.P.; methodology, C.L.K., A.-M.L.P., S.H.P., D.A.R., C.M.D., S.K.M. and S.H.S.; formal analysis, C.L.K., A.-M.L.P. and S.K.M.; investigation, C.L.K., A.-M.L.P. and S.K.M.; resources, D.A.R. and C.M.D.; writing—original draft preparation, C.L.K.; writing—review and editing, C.L.K., A.-M.L.P., S.H.P., D.A.R., C.M.D., S.K.M., and S.H.S.; visualization, C.L.K.; supervision, D.A.R. and C.M.D.; project administration, D.A.R. and C.M.D.; funding acquisition, D.A.R., C.M.D. and S.H.P.

Funding

This study was funded by a U.S. Forest Service grant administered by the National Fish and Wildlife Foundation (NFWF). NFWF project title: Large-scale mapping of post-fire recovery success following the Zaca Fire NFWF project ID: 0806.17.055660.

Acknowledgments

The authors would like to thank field technicians Monica Goodwin and Payton Thomas for their tireless work on this study. We would also like to thank Nicole Molinari, Shane Dewees, Kristi Liu, and Erin Wetherley for their assistance throughout the project.

Conflicts of Interest

The authors declare no conflict of interest.

References

  1. Keeley, J.E.; Brennan, T.; Pfaff, A.H. Fire severity and ecosystem responses following crown fires in California shrublands. Ecol. Appl. 2008, 18, 1530–1546. [Google Scholar] [CrossRef] [PubMed]
  2. Shakesby, R.; Doerr, S. Wildfire as a hydrological and geomorphological agent. Earth-Sci. Rev. 2006, 74, 269–307. [Google Scholar] [CrossRef]
  3. Coombs, J.S.; Melack, J.M. Initial impacts of a wildfire on hydrology and suspended sediment and nutrient export in California chaparral watersheds. Hydrol. Process. 2013, 27, 3842–3851. [Google Scholar] [CrossRef]
  4. Kashian, D.M.; Romme, W.H.; Tinker, D.B.; Turner, M.G.; Ryan, M.G. Carbon Storage on Landscapes with Stand-replacing Fires. BioScience 2006, 56, 598. [Google Scholar] [CrossRef]
  5. Gonzalez, P.; Battles, J.J.; Collins, B.M.; Robards, T.; Saah, D.S. Aboveground live carbon stock changes of California wildland ecosystems, 2001–2010. For. Ecol. Manag. 2015, 348, 68–77. [Google Scholar] [CrossRef]
  6. Jacobsen, A.L.; Pratt, R.B. Extensive drought-associated plant mortality as an agent of type-conversion in chaparral shrublands. New Phytol. 2018, 219, 498–504. [Google Scholar] [CrossRef] [Green Version]
  7. Dennison, P.E.; Brewer, S.C.; Arnold, J.D.; Moritz, M.A. Large wildfire trends in the western United States, 1984–2011. Geophys. Res. Lett. 2014, 41, 2928–2933. [Google Scholar] [CrossRef]
  8. Wulder, M.A.; Masek, J.G.; Cohen, W.B.; Loveland, T.R.; Woodcock, C.E. Opening the archive: How free data has enabled the science and monitoring promise of Landsat. Remote Sens. Environ. 2012, 122, 2–10. [Google Scholar] [CrossRef]
  9. Storey, E.A.; Stow, D.A.; O’Leary, J.F. Assessing postfire recovery of chamise chaparral using multi-temporal spectral vegetation index trajectories derived from Landsat imagery. Remote Sens. Environ. 2016, 183, 53–64. [Google Scholar] [CrossRef] [Green Version]
  10. Fernandez-Manso, A.; Quintano, C.; Roberts, D.A. Burn severity influence on post-fire vegetation cover resilience from Landsat MESMA fraction images time series in Mediterranean forest ecosystems. Remote Sens. Environ. 2016, 184, 112–123. [Google Scholar] [CrossRef]
  11. Frazier, R.J.; Coops, N.C.; Wulder, M.A.; Hermosilla, T.; White, J.C. Analyzing spatial and temporal variability in short-term rates of post-fire vegetation return from Landsat time series. Remote Sens. Environ. 2018, 205, 32–45. [Google Scholar] [CrossRef]
  12. Kennedy, R.E.; Yang, Z.; Cohen, W.B. Detecting trends in forest disturbance and recovery using yearly Landsat time series: 1. LandTrendr—Temporal segmentation algorithms. Remote Sens. Environ. 2010, 114, 2897–2910. [Google Scholar] [CrossRef]
  13. Key, C.H.; Benson, N.C. Landscape Assessment (LA). In FIREMON: Fire Effects Monitoring and Inventory System; Lutes, D.C., Ed.; U.S. Forest Service: Washington, DC, USA, 2006. [Google Scholar]
  14. Miller, J.D.; Thode, A.E. Quantifying burn severity in a heterogeneous landscape with a relative version of the delta Normalized Burn Ratio (dNBR). Remote Sens. Environ. 2007, 109, 66–80. [Google Scholar] [CrossRef]
  15. Hudak, A.T.; Morgan, P.; Bobbitt, M.J.; Smith, A.M.; Lewis, S.A.; Lentile, L.B.; Robichaud, P.R.; Clark, J.T.; McKinley, R.A. The Relationship of Multispectral Satellite Imagery to Immediate Fire Effects. Fire Ecol. 2007, 3, 64–90. [Google Scholar] [CrossRef]
  16. Rogan, J.; Franklin, J. Mapping Wildfire Burn Severity in Southern California Forests and Shrublands Using Enhanced Thematic Mapper Imagery. Geocarto Int. 2001, 16, 91–106. [Google Scholar] [CrossRef]
  17. Riaño, D.; Chuvieco, E.; Ustin, S.; Zomer, R.; Dennison, P.; Roberts, D.; Salas, J. Assessment of vegetation regeneration after fire through multitemporal analysis of AVIRIS images in the Santa Monica Mountains. Remote Sens. Environ. 2002, 79, 60–71. [Google Scholar] [CrossRef]
  18. Quintano, C.; Fernández-Manso, A.; Roberts, D.A. Multiple Endmember Spectral Mixture Analysis (MESMA) to map burn severity levels from Landsat images in Mediterranean countries. Remote Sens. Environ. 2013, 136, 76–88. [Google Scholar] [CrossRef]
  19. Key, C.H. Ecological and Sampling Constraints on Defining Landscape Fire Severity. Fire Ecol. 2006, 2, 34–59. [Google Scholar] [CrossRef]
  20. Rundel, P.W.; Parsons, D.J. Structural Changes in Chamise (Adenostoma fasciculatum) along a Fire-Induced Age Gradient. J. Range Manag. 1979, 32, 462. [Google Scholar] [CrossRef]
  21. Keeley, J.E.; Fotheringham, C.J.; Baer-Keeley, M. Determinants of postfire recovery and succession in Mediterranean-climate shrublands of California. Ecol. Appl. 2005, 15, 1515–1534. [Google Scholar] [CrossRef] [Green Version]
  22. Hope, A.; Tague, C.; Clark, R. Characterizing post-fire vegetation recovery of California chaparral using TM/ETM+ time-series data. Int. J. Remote Sens. 2007, 28, 1339–1354. [Google Scholar] [CrossRef]
  23. Röder, A.; Hill, J.; Duguy, B.; Alloza, J.; Vallejo, R. Using long time series of Landsat data to monitor fire events and post-fire dynamics and identify driving factors. A case study in the Ayora region (eastern Spain). Remote Sens. Environ. 2008, 112, 259–273. [Google Scholar] [CrossRef]
  24. Davis, F.W.; Michaelsen, J. Sensitivity of fire regime in chaparral ecosystems to climate change. In Global Change and Mediterranean-Type Ecosystems; Moreno, J.M., Oechel, W.C., Eds.; Springer: New York, NY, USA, 1995. [Google Scholar]
  25. Baldwin, B.G.; Goldman, D.H.; Keil, D.J.; Patterson, R.; Rosatti, T.J.; Wilken, D.H. The Jepson Manual: Vascular Plants of California, 2nd ed.; University of California Press: Berkeley, CA, USA, 2012. [Google Scholar]
  26. Santa Barbara County Public Works Department. County-Wide Percent-of-Normal Water-Year Rainfall. Available online: https://www.countyofsb.org/uploadedFiles/pwd/Content/Water/Hydrology/Rainfall%20-%20Annual%20Percent%20of%20Normal%20-%20CountyWide.pdf (accessed on 13 November 2019).
  27. Griffin, D.; Anchukaitis, K.J. How unusual is the 2012-2014 California drought? Geophys. Res. Lett. 2014, 41, 9017–9023. [Google Scholar] [CrossRef] [Green Version]
  28. Robeson, S.M. Revisiting the recent California drought as an extreme value. Geophys. Res. Lett. 2015, 42, 6771–6779. [Google Scholar] [CrossRef]
  29. Wang, S.Y.S.; Yoon, J.H.; Becker, E.; Gillies, R. California from drought to deluge. Nat. Clim. Chang. 2017, 7, 465–468. [Google Scholar] [CrossRef]
  30. National Drought Mitigation Center, U.S. Department of Agriculture, and National Oceanic and Atmospheric Association. United States Drought Monitor. Available online: https://droughtmonitor.unl.edu (accessed on 13 November 2019).
  31. Markham, B.; Storey, J.; Williams, D.; Irons, J. Landsat sensor performance: history and current status. IEEE Trans. Geosci. Remote Sens. 2004, 42, 2691–2694. [Google Scholar] [CrossRef]
  32. Masek, J.; Vermote, E.; Saleous, N.; Wolfe, R.; Hall, F.; Huemmrich, K.; Gao, F.; Kutler, J.; Lim, T.K. A Landsat Surface Reflectance Dataset for North America, 1990–2000. IEEE Geosci. Remote Sens. Lett. 2006, 3, 68–72. [Google Scholar] [CrossRef]
  33. California Department of Department of Forestry and Fire Protection. Fire Perimeters. Available online: https://frap.fire.ca.gov/mapping/gis-data (accessed on 1 December 2017).
  34. Green, R.O.; Eastwood, M.L.; Sarture, C.M.; Chrien, T.G.; Aronsson, M.; Chippendale, B.J.; Faust, J.A.; Pavri, B.E.; Chovit, C.J.; Solis, M.; et al. Imaging Spectroscopy and the Airborne Visible/Infrared Imaging Spectrometer (AVIRIS). Remote Sens. Environ. 1998, 65, 227–248. [Google Scholar] [CrossRef]
  35. Lee, C.M.; Cable, M.L.; Hook, S.J.; Green, R.O.; Ustin, S.L.; Mandl, D.J.; Middleton, E.M. An introduction to the NASA Hyperspectral InfraRed Imager (HyspIRI) mission and preparatory activities. Remote Sens. Environ. 2015, 167, 6–19. [Google Scholar] [CrossRef]
  36. Thompson, D.R.; Gao, B.C.; Green, R.O.; Roberts, D.A.; Dennison, P.E.; Lundeen, S.R. Atmospheric correction for global mapping spectroscopy: ATREM advances for the HyspIRI preparatory campaign. Remote Sens. Environ. 2015, 167, 64–77. [Google Scholar] [CrossRef]
  37. Meerdink, S.K.; Roberts, D.A.; Roth, K.L.; King, J.Y.; Gader, P.D.; Koltunov, A. Classifying California plant species temporally using airborne hyperspectral imagery. Remote Sens. Environ. 2019, 232, 111308. [Google Scholar] [CrossRef]
  38. Miller, J.D.; Knapp, E.E.; Key, C.H.; Skinner, C.N.; Isbell, C.J.; Creasy, R.M.; Sherlock, J.W. Calibration and validation of the relative differenced Normalized Burn Ratio (RdNBR) to three measures of fire severity in the Sierra Nevada and Klamath Mountains, California, USA. Remote Sens. Environ. 2009, 113, 645–656. [Google Scholar] [CrossRef]
  39. Hubbert, K.R.; Wohlgemuth, P.M.; Beyers, J.L.; Narog, M.G.; Gerrard, R. Post-Fire Soil Water Repellency, Hydrologic Response, and Sediment Yield Compared between Grass-Converted and Chaparral Watersheds. Fire Ecol. 2012, 8, 143–162. [Google Scholar] [CrossRef]
  40. Roberts, D.; Smith, M.; Adams, J. Green vegetation, nonphotosynthetic vegetation, and soils in AVIRIS data. Remote Sens. Environ. 1993, 44, 255–269. [Google Scholar] [CrossRef]
  41. Smith, M.O.; Ustin, S.L.; Adams, J.B.; Gillespie, A.R. Vegetation in deserts: I. A regional measure of abundance from multispectral images. Remote Sens. Environ. 1990, 31, 1–26. [Google Scholar] [CrossRef]
  42. Roberts, D.A.; Ustin, S.L.; Ogunjemiyo, S.; Greenberg, J.; Dobrowski, S.Z.; Chen, J.; Hinckley, T.M. Spectral and Structural Measures of Northwest Forest Vegetation at Leaf to Landscape Scales. Ecosystems 2004, 7. [Google Scholar] [CrossRef]
  43. Roberts, D.; Gardner, M.; Church, R.; Ustin, S.; Scheer, G.; Green, R. Mapping Chaparral in the Santa Monica Mountains Using Multiple Endmember Spectral Mixture Models. Remote Sens. Environ. 1998, 65, 267–279. [Google Scholar] [CrossRef]
  44. Roth, K.L.; Dennison, P.E.; Roberts, D.A. Comparing endmember selection techniques for accurate mapping of plant species and land cover using imaging spectrometer data. Remote Sens. Environ. 2012, 127, 139–152. [Google Scholar] [CrossRef]
  45. Zare, A.; Ho, K. Endmember Variability in Hyperspectral Analysis. IEEE Signal Process. Mag. 2013, 31, 95–104. [Google Scholar] [CrossRef]
  46. Tane, Z.; Roberts, D.; Veraverbeke, S.; Casas, R.; Ramirez, C.; Ustin, S. Evaluating Endmember and Band Selection Techniques for Multiple Endmember Spectral Mixture Analysis using Post-Fire Imaging Spectroscopy. Remote Sens. 2018, 10, 389. [Google Scholar] [CrossRef] [Green Version]
  47. Tompkins, S.; Mustard, J.F.; Pieters, C.M.; Forsyth, D.W. Optimization of endmembers for spectral mixture analysis. Remote Sens. Environ. 1997, 59, 472–489. [Google Scholar] [CrossRef]
  48. Somers, B.; Asner, G.P.; Tits, L.; Coppin, P. Endmember variability in Spectral Mixture Analysis: A review. Remote Sens. Environ. 2011, 115, 1603–1616. [Google Scholar] [CrossRef]
  49. Asner, G.P.; Heidebrecht, K.B. Spectral unmixing of vegetation, soil and dry carbon cover in arid regions: Comparing multispectral and hyperspectral observations. Int. J. Remote Sens. 2002, 23, 3939–3958. [Google Scholar] [CrossRef]
  50. U.S. Forest Service, Pacific Southwest Region. Existing Vegetation—CALVEG. Available online: https://www.fs.usda.gov/detail/r5/landmanagement/resourcemanagement/?cid=stelprdb5347192 (accessed on 1 May 2018).
  51. Schaaf, A.N.; Dennison, P.E.; Fryer, G.K.; Roth, K.L.; Roberts, D.A. Mapping Plant Functional Types at Multiple Spatial Resolutions Using Imaging Spectrometer Data. Gisci. Remote Sens. 2011, 48, 324–344. [Google Scholar] [CrossRef]
  52. Bodí, M.B.; Martin, D.A.; Balfour, V.N.; Santín, C.; Doerr, S.H.; Pereira, P.; Cerdà, A.; Mataix-Solera, J. Wildland fire ash: Production, composition and eco-hydro-geomorphic effects. Earth Sci. Rev. 2014, 130, 103–127. [Google Scholar] [CrossRef]
  53. Roberts, D.A.; Batista, G.T.; Pereira, J.L.; Waller, E.K.; Nelson, B.W. Change Identification Using Multitemporal Spectral Mixture Analysis: Applications in Eastern Amazonia. In Remote Sensing Change Detection: Environmental Monitoring Methods and Applications; Ann Arbor Press: Chelsea, MI, USA, 1998; pp. 137–161. [Google Scholar]
  54. Powell, R.; Roberts, D.; Dennison, P.; Hess, L. Sub-pixel mapping of urban land cover using multiple endmember spectral mixture analysis: Manaus, Brazil. Remote Sens. Environ. 2007, 106, 253–267. [Google Scholar] [CrossRef]
  55. Roberts, D.A.; Halligan, K.; Dennison, P.; Dudley, K.; Somers, B.; Crabbé, A. VIPER Tools User Manual Version 2.1; University of California: Santa Barbara, CA, USA, 2019. [Google Scholar]
  56. Roberts, D.; Dennison, P.; Gardner, M.; Hetzel, Y.; Ustin, S.; Lee, C. Evaluation of the potential of hyperion for fire danger assessment by comparison to the airborne visible/infrared imaging spectrometer. IEEE Trans. Geosci. Remote Sens. 2003, 41, 1297–1310. [Google Scholar] [CrossRef]
  57. Liu, N.; Treitz, P. Modelling high arctic percent vegetation cover using field digital images and high resolution satellite data. Int. J. Appl. Earth Obs. Geoinf. 2016, 52, 445–456. [Google Scholar] [CrossRef]
  58. Liu, N. Photo Grid Classifier. Software. Python code available from author. University of Wisconsin-Madison.
  59. Jennings, M.D.; Faber-Langendoen, D.; Loucks, O.L.; Peet, R.K.; Roberts, D. Standards for associations and alliances of the U.S. National Vegetation Classification. Ecol. Monogr. 2009, 79, 173–199. [Google Scholar] [CrossRef]
  60. Powell, R.; Matzke, N.; de Souza, C.; Clark, M.; Numata, I.; Hess, L.; Roberts, D. Sources of error in accuracy assessment of thematic land-cover maps in the Brazilian Amazon. Remote Sens. Environ. 2004, 90, 221–234. [Google Scholar] [CrossRef]
  61. Canada’s National Forest Inventory. Photo Plot Data Dictionary for Second Remeasurement; Natural Resources Canada: Victoria, BC, Canada, 2017. [Google Scholar]
  62. Stenback, J.M.; Congalton, R.G. Using Thematic Mapper Imagery to Examine Forest Understory. Photogramm. Eng. Remote Sens. 1990, 56, 1285–1290. [Google Scholar]
  63. Borchert, M.; Lopez, A.; Bauer, C.; Knowd, T. Field Guide to Coastal Sage Scrub and Chaparral Alliances of Los Padres National Forest; Number R5-TP-019; U.S. Forest Service: Washington, DC, USA, 2004.
  64. Keeley, J.E.; Davis, F.W. Chaparral. In Terrestrial Vegetation of California, 3rd ed.; University of California Press: Berkeley, CA, USA, 2007; pp. 339–366. [Google Scholar]
  65. Venturas, M.D.; MacKinnon, E.D.; Dario, H.L.; Jacobsen, A.L.; Pratt, R.B.; Davis, S.D. Chaparral Shrub Hydraulic Traits, Size, and Life History Types Relate to Species Mortality during California’s Historic Drought of 2014. PLoS ONE 2016, 11, e0159145. [Google Scholar] [CrossRef] [PubMed] [Green Version]
  66. Keeley, J.E. Seed Production, Seed Populations in Soil, and Seedling Production After Fire for Two Congeneric Pairs of Sprouting and Nonsprouting Chaparal Shrubs. Ecology 1977, 58, 820–829. [Google Scholar] [CrossRef]
  67. Vogl, R.J.; Schorr, P. Fire and Manzanita Chaparral in the San Jacinto Mountains, California. Ecology 1972, 53, 1179–1188. [Google Scholar] [CrossRef]
  68. Keeley, J.E. Recruitment of Seedlings and Vegetative Sprouts in Unburned Chaparral. Ecology 1992, 73, 1194–1208. [Google Scholar] [CrossRef]
  69. Keeley, J.E. Fire Severity and Plant Age in Postfire Resprouting of Woody Plants in Sage Scrub and Chaparral. Madroño 2006, 53, 373–379. [Google Scholar] [CrossRef]
  70. Swain, D.L.; Langenbrunner, B.; Neelin, J.D.; Hall, A. Increasing precipitation volatility in twenty-first-century California. Nat. Clim. Chang. 2018, 8, 427–433. [Google Scholar] [CrossRef]
  71. Frolking, S.; Palace, M.W.; Clark, D.B.; Chambers, J.Q.; Shugart, H.H.; Hurtt, G.C. Forest disturbance and recovery: A general review in the context of spaceborne remote sensing of impacts on aboveground biomass and canopy structure. J. Geophys. Res. Biogeosci. 2009, 114. [Google Scholar] [CrossRef]
  72. Keeley, J.E. Fire intensity, fire severity and burn severity: A brief review and suggested usage. Int. J. Wildland Fire 2009, 18, 116. [Google Scholar] [CrossRef]
  73. Foody, G.M.; Boyd, D.S.; Cutler, M.E. Predictive relations of tropical forest biomass from Landsat TM data and their transferability between regions. Remote Sens. Environ. 2003, 85, 463–474. [Google Scholar] [CrossRef]
  74. Morresi, D.; Vitali, A.; Urbinati, C.; Garbarino, M. Forest Spectral Recovery and Regeneration Dynamics in Stand-Replacing Wildfires of Central Apennines Derived from Landsat Time Series. Remote Sens. 2019, 11, 308. [Google Scholar] [CrossRef] [Green Version]
  75. Horton, J.S.; Kraebel, C.J. Development of Vegetation after Fire in the Chamise Chaparral of Southern California. Ecology 1955, 36, 244–262. [Google Scholar] [CrossRef]
  76. Williams, J.E.; Davis, S.D.; Portwood, K. Xylem Embolism in Seedlings and Resprouts of Adenostoma fasciculatum after Fire. Aust. J. Bot. 1997, 45, 291. [Google Scholar] [CrossRef]
  77. Paddock, W.; Davis, S.; Pratt, B.; Jacobsen, A.; Tobin, M.; López-Portillo, J.; Ewers, F. Factors Determining Mortality of Adult Chaparral Shrubs in an Extreme Drought Year in California. Aliso 2013, 31, 49–57. [Google Scholar] [CrossRef] [Green Version]
  78. Schwilk, D.W.; Ackerly, D.D. Is there a cost to resprouting? Seedling growth rate and drought tolerance in sprouting and nonsprouting Ceanothus (Rhamnaceae). Am. J. Bot. 2005, 92, 404–410. [Google Scholar] [CrossRef] [Green Version]
  79. Jacobsen, A.L.; Pratt, R.B.; Ewers, F.W.; Davis, S.D. Cavitation Resistance among 26 Chaparral Species of Southern California. Ecol. Monogr. 2007, 77, 99–115. [Google Scholar] [CrossRef]
  80. Meentemeyer, R.K.; Moody, A. Distribution of plant life history types in California chaparral: the role of topographically-determined drought severity. J. Veg. Sci. 2002, 13, 67. [Google Scholar] [CrossRef]
  81. Peterson, S.H.; Stow, D.A. Using multiple image endmember spectral mixture analysis to study chaparral regrowth in southern California. Int. J. Remote Sens. 2003, 24, 4481–4504. [Google Scholar] [CrossRef]
  82. McMichael, C.E.; Hope, A.S.; Roberts, D.A.; Anaya, M.R. Post-fire recovery of leaf area index in California chaparral: A remote sensing-chronosequence approach. Int. J. Remote Sens. 2004, 25, 4743–4760. [Google Scholar] [CrossRef]
  83. Kane, V.R.; Lutz, J.A.; Roberts, S.L.; Smith, D.F.; McGaughey, R.J.; Povak, N.A.; Brooks, M.L. Landscape-scale effects of fire severity on mixed-conifer and red fir forest structure in Yosemite National Park. For. Ecol. Manag. 2013, 287, 17–31. [Google Scholar] [CrossRef]
  84. Franklin, J. Thematic mapper analysis of coniferous forest structure and composition. Int. J. Remote Sens. 1986, 7, 1287–1301. [Google Scholar] [CrossRef]
  85. Minnich, R.A.; Goforth, B.R.; Paine, T.D. Follow the Water: Extreme Drought and the Conifer Forest Pandemic of 2002–2003 Along the California Borderland. In Insects and Diseases of Mediterranean Forest Systems; Paine, T.D., Ed.; Springer: New York, NY, USA, 2015; pp. 859–890. [Google Scholar]
  86. Harvey, B.J.; Donato, D.C.; Turner, M.G. High and dry: post-fire tree seedling establishment in subalpine forests decreases with post-fire drought and large stand-replacing burn patches: Drought and post-fire tree seedlings. Glob. Ecol. Biogeogr. 2016, 25, 655–669. [Google Scholar] [CrossRef] [Green Version]
  87. Stevens-Rumann, C.S.; Kemp, K.B.; Higuera, P.E.; Harvey, B.J.; Rother, M.T.; Donato, D.C.; Morgan, P.; Veblen, T.T. Evidence for declining forest resilience to wildfires under climate change. Ecol. Lett. 2018, 21, 243–252. [Google Scholar] [CrossRef] [PubMed]
  88. DeFries, R.S.; Field, C.B.; Fung, I.; Justice, C.O.; Los, S.; Matson, P.A.; Matthews, E.; Mooney, H.A.; Potter, C.S.; Prentice, K.; et al. Mapping the land surface for global atmosphere-biosphere models: Toward continuous distributions of vegetation’s functional properties. J. Geophys. Res. 1995, 100, 20867. [Google Scholar] [CrossRef]
  89. Lambin, E.F. Monitoring forest degradation in tropical regions by remote sensing: Some methodological issues. Glob. Ecol. Biogeogr. 1999, 8, 191–198. [Google Scholar] [CrossRef]
  90. Kennedy, R.E.; Andréfouët, S.; Cohen, W.B.; Gómez, C.; Griffiths, P.; Hais, M.; Healey, S.P.; Helmer, E.H.; Hostert, P.; Lyons, M.B.; et al. Bringing an ecological view of change to Landsat-based remote sensing. Front. Ecol. Environ. 2014, 12, 339–346. [Google Scholar] [CrossRef]
  91. Abatzoglou, J.T.; Williams, A.P. Impact of anthropogenic climate change on wildfire across western US forests. Proc. Natl. Acad. Sci. USA 2016, 113, 11770–11775. [Google Scholar] [CrossRef] [Green Version]
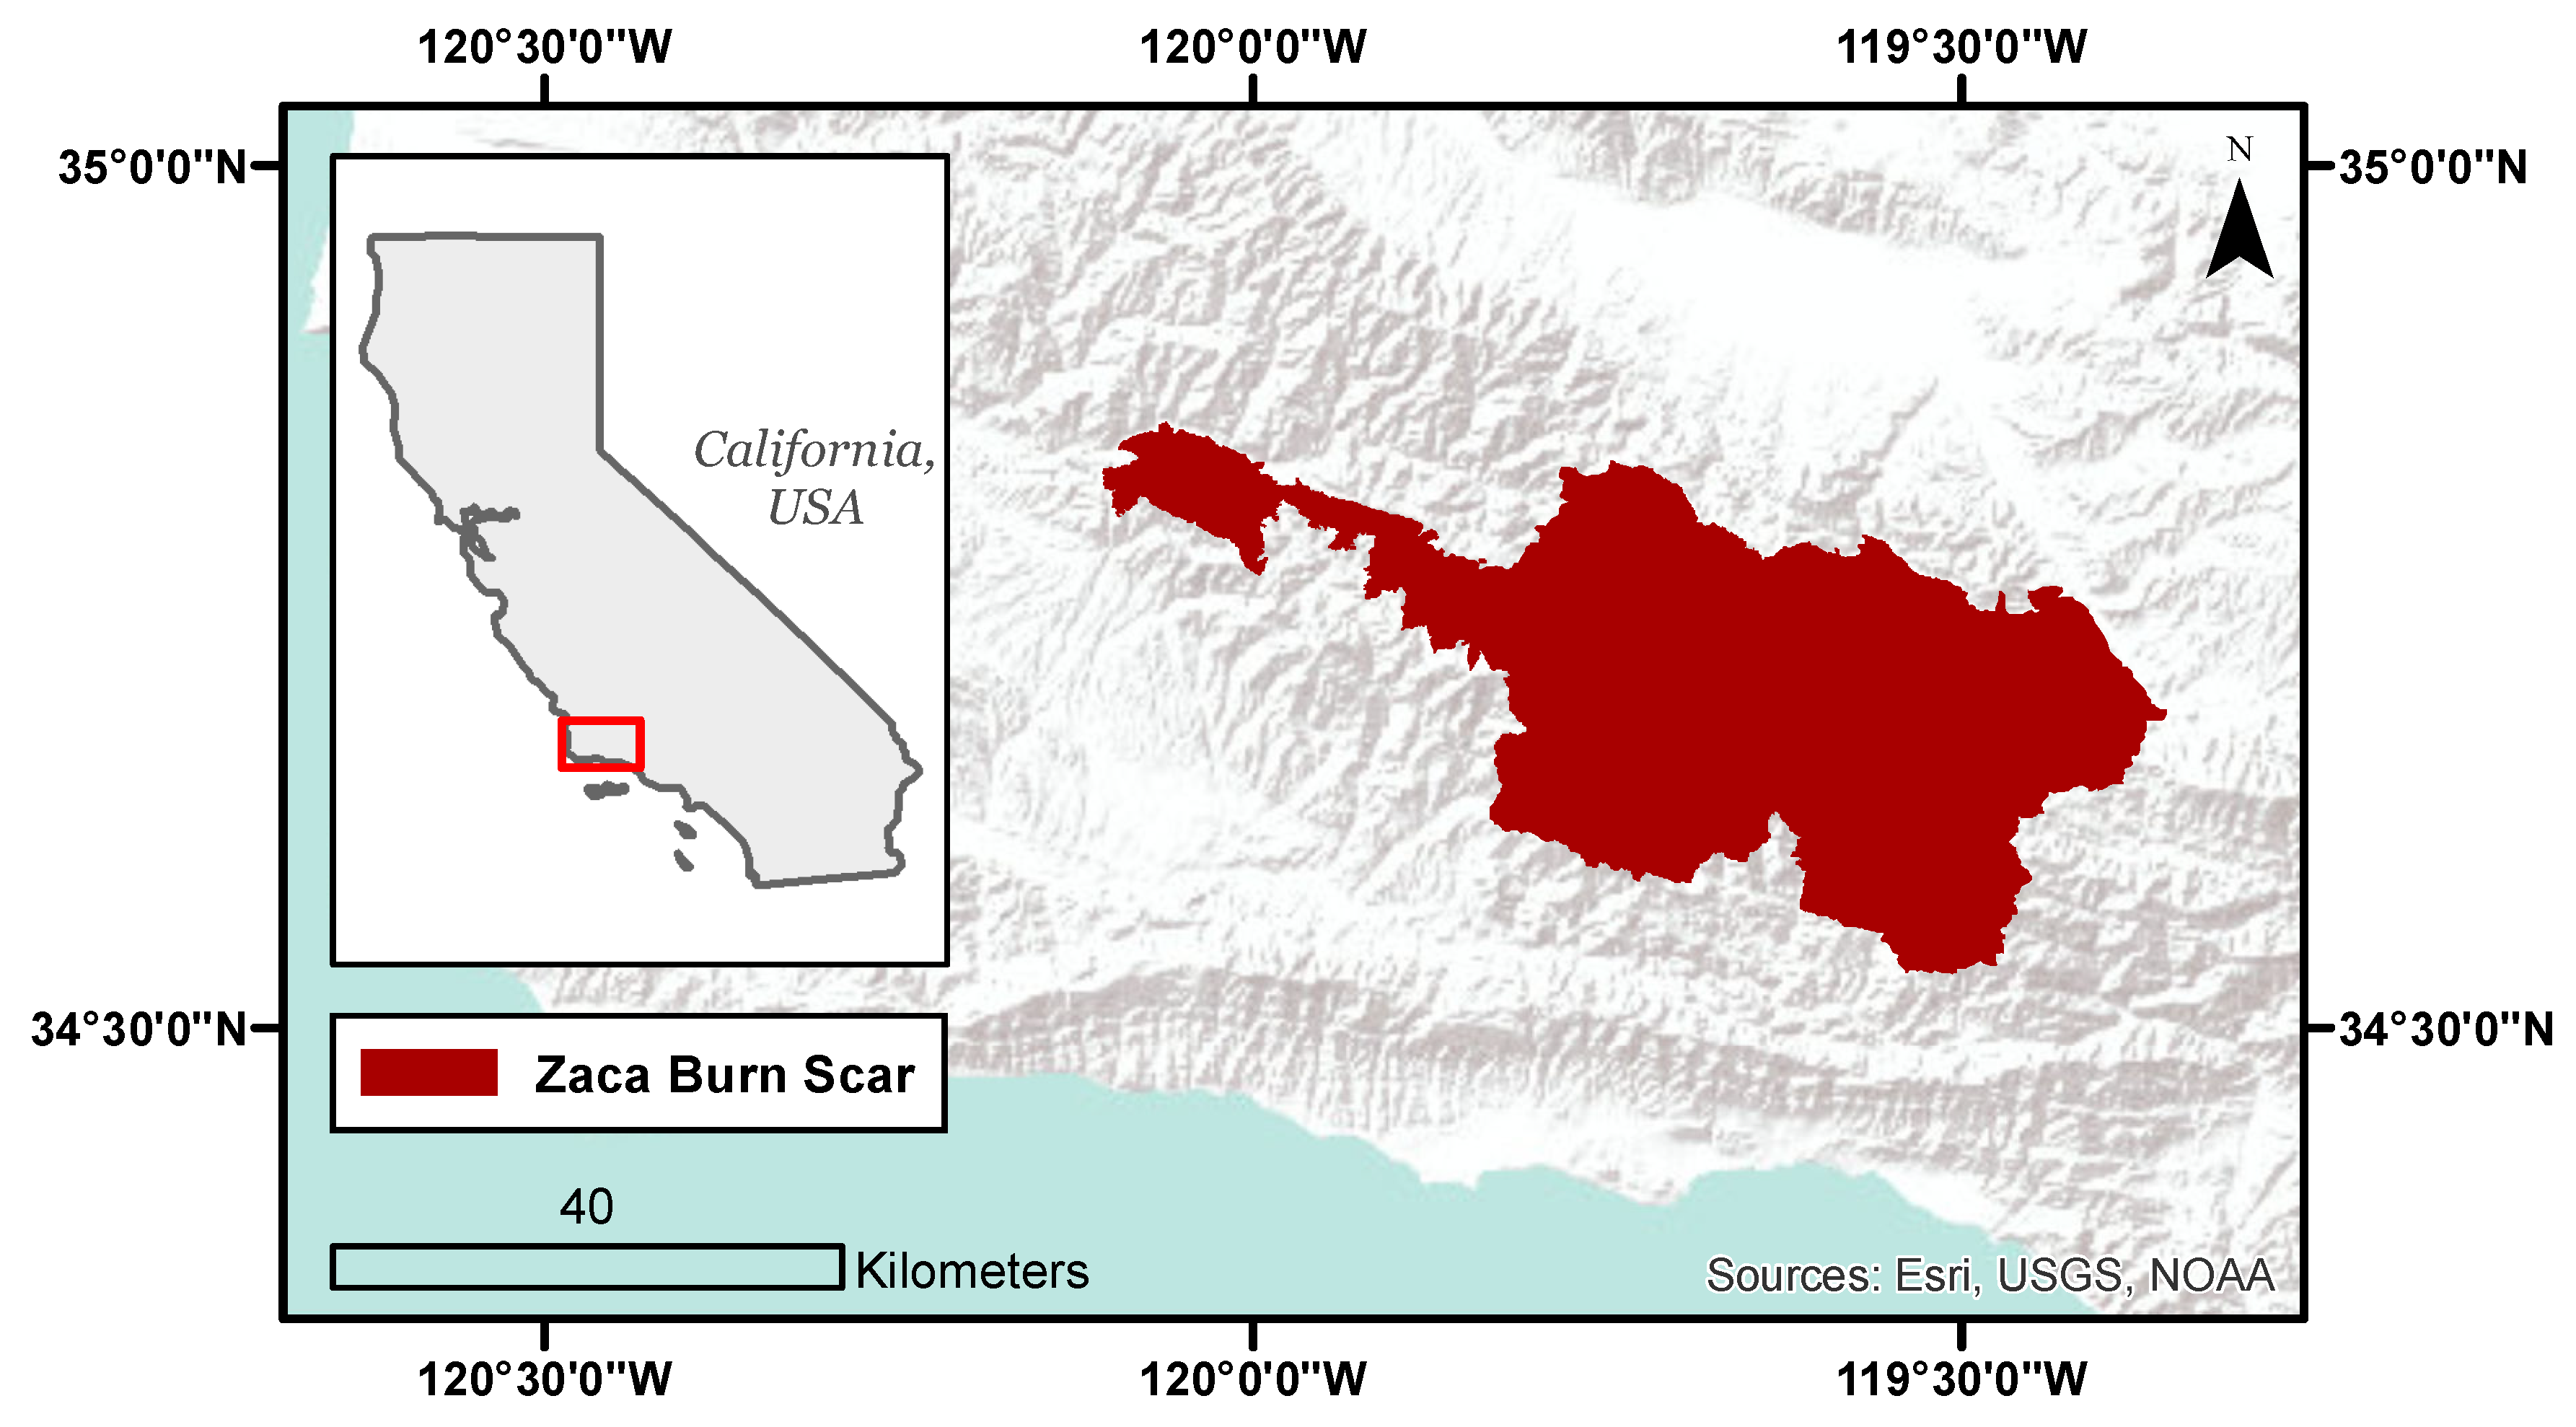
Figure 1. Location of the Zaca Fire burn scar in California, USA.
Remotesensing 11 02963 g001
Figure 2. County-wide rainfall in Santa Barbara County, California as a percent of water year average. California water years last from October 1 until September 30. Reproduced from Santa Barbara County Water Resources [26].
Remotesensing 11 02963 g002
Figure 3. Principal components analysis (PCA) loading plot of species cover data from the field survey transects. The analysis includes species that were dominant (>25% cover) in at least one transect. The vector for Quercus agrifolia is very short and not intelligible.
Remotesensing 11 02963 g003
Figure 4. Post-fire canopy cover for conifer stands based on their pre-fire canopy cover. Classifications are based on manual interpretation of high-resolution imagery.
Remotesensing 11 02963 g004
Figure 5. Comparison of (a) 2018 green vegetation (GV) fractions and (b) 2018 normalized burn ratio (NBR) values with estimates of GV cover from the transect photographs.
Remotesensing 11 02963 g005
Figure 6. Mean relative delta normalized burn ratio (RdNBR) trajectories for six chaparral species. RdNBR trajectories were extracted from the locations of the field survey transects. The transects were grouped by dominant species, and the mean trajectory was calculated for each species.
Remotesensing 11 02963 g006
Figure 7. Mean RdNBR trajectories for conifer stands with different combinations of pre-fire and post-fire canopy cover.
Remotesensing 11 02963 g007
Figure 8. Mean GV trajectories for six chaparral species. GV trajectories were extracted from the locations of the field survey transects. The transects were grouped by dominant species, and the mean trajectory was calculated for each species.
Remotesensing 11 02963 g008
Figure 9. Mean GV trajectories for conifer stands with different combinations of pre-fire and post-fire canopy cover.
Remotesensing 11 02963 g009
Table 1. Compositional similarity of transects dominated by different species. The second column indicates the mean percentage of land cover that is identical between all pairs of transects dominated by a given species. The third column indicates the mean dominant species cover in transects dominated by each species.
SpeciesCompositional Similarity (%)Dominant Species Cover (%)Number of Transects
Adenostoma fasciculatum60.8440.1819
Arctostaphylos glandulosa56.3432.5315
Ceanothus cuneatus54.6747.947
Ceanothus leucodermis58.7435.277
Ceanothus oliganthus62.4152.944
Ceanothus palmeri54.0440.795
Cercocarpus betuloides73.4930.162
Hosackia crassifolia82.9639.642
Quercus berberidifolia54.2740.1512
Quercus chrysolepis51.3936.945
Quercus wislizenii51.8030.564
Grass spp.57.1935.535