Article

Drought Evaluation with CMORPH Satellite Precipitation Data in the Yellow River Basin by Using Gridded Standardized Precipitation Evapotranspiration Index

1
School of Water Conservancy and Environment, Zhengzhou University, Zhengzhou 450001, China
2
School of Water Conservancy, North China University of Water Resources and Electric Power, Zhengzhou 450046, China
3
School of Engineering, Newcastle University, Newcastle upon Tyne NE1 7RU, UK
*
Author to whom correspondence should be addressed.
Remote Sens. 2019, 11(5), 485; https://doi.org/10.3390/rs11050485
Submission received: 17 January 2019 / Revised: 17 February 2019 / Accepted: 23 February 2019 / Published: 27 February 2019

Abstract

:
The traditional station-based drought index is vulnerable because of the inadequate spatial distribution of the station, and also, it does not fully reflect large-scale, dynamic drought information. Thus, large-scale drought monitoring has been widely implemented by using remote sensing precipitation products. Compared with station data, remote sensing precipitation products have the advantages of wide coverage and dynamic, continuous data, which can effectively compensate for the deficiency in the spatial distribution of the ground stations and provide a new data source for the calculation of a drought index. In this study, the Gridded Standardized Precipitation Evapotranspiration Index (GSPEI) was proposed based on a remote sensing dataset produced by the Climate Prediction Center morphing technique (CMORPH), in order to evaluate the gridded drought characteristics in the Yellow River basin (YRB) from 1998 to 2016. The optimal Ordinary Kriging interpolation method was selected to interpolate meteorological station data to the same spatial resolution as CMORPH data (8 km), in order to compare the ground-based meteorological parameters to remote sensing-based data. Additionally, the gridded drought trends were identified based on the Modified Mann–Kendall (MMK) trend test method. The results indicated that: (1) the GSPEI was suitable for drought evaluation in the YRB using CMORPH precipitation data, which were consistent with ground-based meteorological data; (2) the positive correlation between GSPEI and SPEI was high, and all the correlation coefficients (CCs) passed the significance test of α = 0.05, which indicated that the GSPEI could better reflect the gridded drought characteristics of the YRB; (3) the drought severity in each season of the YRB was highest in summer, followed by spring, autumn, and winter, with an average GSPEI of −1.51, −0.09, 0.30, and 1.33, respectively; and (4) the drought showed an increasing trend on the monthly scale in March, May, August, and October, and a decreasing trend on the seasonal and annual scale.

Graphical Abstract

1. Introduction

Drought disaster is the natural disaster with the highest frequency, the most serious socio–economic and ecological losses and the most extensive impact [1,2,3]. Therefore, it is very important to monitor and evaluate drought reliably and effectively. Traditionally, drought indices are calculated by using the observational data from surface meteorological stations. However, due to the influence of geographical and economic factors, meteorological stations often have problems such as sparse and uneven distribution and a lack of appropriate spatial representation. As a direct or indirect parameter for various drought indices, precipitation is more uncertain and discontinuous in spatial and temporal distribution compared to other meteorological data such as temperature and wind speed [4,5]. It is generally difficult to obtain accurate precipitation information in areas of missing data by spatial interpolation. When the available precipitation data are relatively sparse, the drought indices calculated from the station-observed data are usually unable to reflect the drought information of the entire area [6,7].
In recent years, with the rapid development of remote sensing and data inversion technology, a series of precipitation data products have emerged based on satellite remote sensing inversion [8,9]. Remote sensing precipitation data has wide coverage and high spatial and temporal resolution, which effectively compensates for the shortcomings of insufficient spatial distribution of ground stations, thus, providing a new data source for the calculation of drought indices. Among the remote sensing satellite precipitation products, the Climate Prediction Center morphing technique (CMORPH) satellite precipitation products released by the National Oceanic and Atmospheric Administration (NOAA) in the United States are currently the best comprehensive satellite precipitation products with the highest spatial and temporal resolution [10,11]. CMORPH can provide precipitation data with a temporal resolution of 0.5 h and a spatial resolution of 8 km, and it has been widely evaluated and validated in mainland China. The CMORPH data grid is uniformly distributed in space, which effectively compensates for the errors caused by meteorological station interpolation. Therefore, CMORPH precipitation products can be used to monitor and evaluate regional drought, even in areas with sparse and uneven spatial distribution of meteorological stations and where there is a lack of data or no data [12]. CMORPH also provides technical support for future regional hydrological forecasting and disaster monitoring. Numerous research results have showed that CMORPH satellite precipitation products have comparable accuracy with ground station observation data, and can replace station observation data to a certain extent [13]. Therefore, CMORPH satellite precipitation products have broad application prospects. Xu et al. studied the error characteristics of CMORPH precipitation data in China [14]. The results showed that there was a strong positive correlation between the precipitation area of CMORPH and station observation data, and the correlation coefficients in June and July reached 0.813 and 0.827. Wang et al. analyzed the applicability of CMORPH remote sensing precipitation products in Shaanxi Province of China, and found that CMORPH data can better reflect the spatial distribution characteristics of annual precipitation in Shaanxi Province [15]. Jiang et al. assessed the applicability of the latest Tropical Rainfall Measuring Mission (TRMM) Multi–satellite Precipitation Analysis (TMPA) and CMORPH satellite precipitation products in the Yellow River basin (YRB), and indicated that CMORPH performed much better than TRMM 3B42 Real Time Applications (TRMM–3B42RT) in the YRB [16]. Lu et al. adopted the Standardized Precipitation Index (SPI) to evaluate the drought monitoring effectiveness of CMORPH products, and discovered that the CMORPH-based SPI can effectively capture typical drought events in China [17].
Due to the complexity of the causes and influencing factors of drought, a variety of drought indices have been developed to quantify the impact of drought [18]. The commonly used Palmer Drought Severity Index (PDSI) can monitor regional drought severity, however, PDSI needs more calculation parameters and cannot reflect the multi–time scale characteristics of drought. The SPI is also a commonly used drought index, and it has multi–time scale characteristics but cannot reflect the impact of temperature on drought [19]. On the basis of assessing the advantages and disadvantages of PDSI and SPI, Vicente–Serrano et al. introduced potential evapotranspiration items to construct the Standardized Precipitation Evapotranspiration Index (SPEI) [20]. The SPEI is statistically robust and easily calculated, and has a clear and comprehensible calculation procedure. The SPEI combines the advantages of the PDSI and SPI, and it not only considers the influence of temperature on drought, but it also has multi–time scale characteristics [21,22]. Thus, the SPEI has become the most favorable tool for monitoring drought development. Tirivarombo et al. compared the drought monitoring effectiveness of SPEI and SPI in the Kafue basin of Zambia, and proposed that SPEI was superior to SPI because temperature variability played an important role in characterizing droughts [23]. Using SPEI, Gao et al. concluded that the Loess Plateau showed a more humid and warmer trend under climate change in the period of 2001–2050 [24]. Zhao et al. indicated that SPEI was suitable for short-term and long-term drought monitoring [25]. SPEI could be applied to better monitor the initiation, aggravation, alleviation, and relief of drought and should have greater application prospects in China.
Due to its geographical location and East Asian monsoon climate, water resources in the TRB are inherently inadequate and its precipitation distribution is asymmetrical. Additionally, the YRB is the most seriously drought-affected region in China’s major river basins [26]. Therefore, it is particularly important to assess the drought situation in the YRB. Previous drought assessment of the YRB was mostly based on the calculation of drought indices of meteorological stations, and then the drought distribution in the whole basin could be obtained by spatial interpolation. However, an inadequate number and uneven distribution of meteorological stations limits the accuracy of spatial interpolation. Although the accuracy of station-based drought indices is relatively high, it is vulnerable to the inadequate spatial distribution of meteorological stations, and it is difficult to produce large-scale, dynamic drought information. The drought index calculated by using CMORPH data can be applied to large-scale drought monitoring. The YRB spans 23 longitudes and 10 latitudes, and the geographical scope of the YRB is very large. Different climatic types and topographic features lead to obvious differences in the spatial distribution of drought in the YRB; thus, it is necessary to study each subzone on the spatial scale [27]. Currently, there are few studies on drought monitoring effectiveness evaluation of CMORPH products at the basin scale, and drought effectiveness evaluation of CMORPH data has not been carried out in the YRB. In view of this, this paper divided the YRB into eight subzones. The Gridded Standardized Precipitation Evapotranspiration Index (GSPEI) was innovatively proposed to identify the gridded drought characteristics for the first time in the YRB, combining CMORPH data and the SPEI. The correlation between CMORPH satellite precipitation data and station–based observation data was compared and analyzed, and the drought monitoring effectiveness of CMORPH products was comprehensively evaluated in the YRB. The spatial and temporal pattern of drought was specifically and systematically revealed in the YRB from 1998 to 2016. The research results provide a scientific basis for the application of CMORPH products in drought control and drought resistance, and have very important practical significance for the prevention and mitigation of drought disasters in the YRB.

2. Materials and Methods

2.1. Study Area

The Yellow River basin (YRB) lies between 95°53′–119°05′E and 32°10′–41°50′N, covering a total drainage area of 752,443 km2. It originates from the Tibetan Plateau, wandering eastward through nine provinces in China. Since Chinese ancestors originated from the YRB, the YRB is the symbol of China’s ancient civilization; thus, the YRB is also known as the mother river of China [28]. The average annual precipitation in most areas of the basin is approximately 200–600 mm. The precipitation decreases gradually from southeast to northwest. The Yellow River is the second longest river in China, and most of the YRB is arid and semi-arid. Under the influence of climate change and human activities, the ecological environment of the YRB is fragile and has the basic characteristics of drought [29]. Because of the large area and varied topography, the spatial distribution of drought is varied. The YRB can be divided into eight subzones based on the secondary basin boundary in China, including above Longyangxia (AL), Longyangxia to Lanzhou (LL), Lanzhou to Hekou (LH), Inner Flow region (IF), Hekou to Longmen (HL), Longmen to Sanmenxia (LS), Sanmenxia to Huayuankou (SH), and below Huayuankou (BH) (Figure 1). The land use types of the YRB mainly include farmland, forest, grassland, shrub, wetland, water, artificial cover, bare land, and glacier. Land use data are derived from Globeland 30–2010 products produced by the National Geomatics Center of China (NGCC). The distribution of 64 meteorological stations is shown in Figure 1. These meteorological stations are well-distributed and represent the entire basin well.

2.2. Dataset

2.2.1. CMORPH Precipitation Data

The high-resolution Climate Prediction Center morphing technique (CMORPH) satellite precipitation datasets were used in this study. The CMORPH product is available at a temporal frequency of 0.5 h and a spatial resolution of 8 × 8 km2. The principle algorithm of CMORPH data is to splice microwave precipitation data from multiple satellites into global precipitation data, then calculate the displacement of precipitation cloud cluster using infrared precipitation data between two time periods, and complete the final precipitation calculation utilizing time weight interpolation. The algorithm makes full use of the advantages of the high accuracy of microwave precipitation data and high spatial and temporal resolution of infrared data. The temporal and spatial resolution of CMORPH satellite precipitation data is higher than that of other satellite precipitation data, which have been widely used in precipitation observation and research in China [30,31]. The starting time of CMORPH precipitation data is January 1998. Therefore, this paper adopted the latest CMORPH products with time series of 19 years from 1998 to 2016 (ftp://ftp.cpc.ncep.noaa.gov/precip/CMORPH_V1.0/CRT/8km-30min/). Since the period of daily observation data of meteorological stations was from 20:00 to the next 20:00 Beijing Time, the CMORPH data were preprocessed first. CMORPH data are based on World Time, which can be converted into Beijing Time (UTC+8) by adding 8 hours. CMORPH precipitation data for 0.5 h can be accumulated into corresponding daily and monthly precipitation data. The spatial resolution of CMORPH precipitation data was 8 km, so the analysis and evaluation of drought were carried out at the spatial resolution of 8 km in the following sections.

2.2.2. Rain Gauge Data

Monthly precipitation and temperature data from 64 meteorological stations were obtained from the National Meteorological Information Center (NMIC) at the China Meteorological Administration (CMA) for 1998–2016 (http://data.cma.cn/). The homogeneity and reliability of the meteorological data were checked and revised by CMA before their release. The revised data showed good homogeneity and the data quality was obviously improved. The corrected precipitation and temperature data from each meteorological station were reliable and of good quality during the research period (1998–2016). Precipitation data from meteorological stations were used primarily to evaluate the accuracy of CMORPH products in estimating precipitation values in the YRB. Compared with CMORPH precipitation data, the observed precipitation data from these meteorological stations were used as the true value of the spatial distribution of precipitation, in order to calculate the drought index and evaluate the drought situation in the YRB.

2.3. Gridded Standardized Precipitation Evapotranspiration Index (GSPEI)

The Standardized Precipitation Evapotranspiration Index (SPEI) is considered as a robust index for regional drought monitoring and analysis under global climate change scenarios because of its simple form, multiple time scales, low data requirement, and ability to identify the effects of temperature on drought conditions [32]. The SPEI fulfills the requirements of a drought index since its multi-scalar character enables it to be used by different scientific disciplines to detect, monitor and analyze droughts. The SPEI is suitable for regions with annual precipitation greater than 200 mm; the average annual precipitation is approximately 466 mm in the YRB [33]. Therefore, the SPEI can effectively reflect drought characteristics in the YRB. The SPEI of the meteorological stations was calculated using the precipitation and temperature data from the 64 meteorological stations. In this paper, we proposed the Gridded Standardized Precipitation Evapotranspiration Index (GSPEI) to evaluate the gridded drought characteristics of the YRB during 1998–2016. The monthly temperature data from the meteorological stations were interpolated to the same resolution as CMORPH (8 km) for calculating the GSPEI. In this study, 8 different geo-spatial interpolation methods were compared to choose the optimal one (Table 1). Spatial interpolation of temperature data based on 51 randomly selected stations, accounting for 80% of the total 64 stations, was performed using all of the interpolation methods to choose the best one. Then, the interpolated temperature data of the remaining 13 stations using each method were compared with the actual observation data. Cross-validation was used to compare and select the most suitable interpolation method by calculating the root mean square error (RMSE), mean relative error (MRE), and correlation coefficient (CC). Through comparative analysis, the Ordinary Kriging was found to be the most suitable method, having the lowest RMSE (0.19), MRE (0.03), and highest CC value (0.98). Hence, the Ordinary Kriging interpolation method was adopted to interpolate the temperature data from the meteorological stations to the gridded temperature data with spatial resolution of 8 km, and then the GSPEI was calculated with CMORPH gridded precipitation data. The calculation procedure of the GSPEI was the same as that of the SPEI in [34]. In the process of calculating GSPEI, each grid point was regarded as a station. According to the relevant references [35,36] and the actual drought conditions in the YRB, the classification scales of the GSPEI are shown in Table 2.

2.4. Statistical Methods

2.4.1. Evaluation Indicators

In this study, the consistency between CMORPH satellite precipitation data and reference meteorological station data was quantitatively evaluated by six evaluation indicators, including the correlation coefficient (CC), mean absolute error (MAE), root mean square error (RMSE), Nash–Sutcliffe efficiency (NSE), probability of detection (POD), and false alarm ratio (FAR). The CC represents the linear correlation between CMORPH precipitation and meteorological station observation data. The MAE represents the average magnitude of the absolute error. The RMSE is very sensitive to extremely large or small error values, which can well reflect the accuracy of CMORPH precipitation data. The NSE measures the consistency of the CMORPH precipitation and gauge observation values both in amount and temporal distribution. The POD describes the fraction of the observed precipitation events detected correctly by the evaluated product. The FAR describes the fraction of events detected by the product but not observed. The unit, formula, range, perfect value, and reference of these evaluation indicators are presented in Table 3.

2.4.2. Extreme-Point Symmetric Mode Decomposition (ESMD)

Traditional time series analysis methods are mostly based on Fourier transform. The disadvantage is that they are only suitable for stationary signals with linear change. The latest Extreme-Point Symmetric Mode Decomposition (ESMD) method is appropriate for time series analysis of non-linear and non-stationary features [39]. The ESMD method is an improvement on the Empirical Mode Decomposition (EMD) method, and it can separate oscillation or trend components of different scales from the original sequence step by step. The ESMD separates the fluctuation of different periods from the original signal, and the fluctuation is stable. Finally, the trend component is obtained. Because of its self-adaptability and sequence-based local variation characteristics, the ESMD is widely applied to the processing and analysis of non-linear and non-stationary data in ocean and atmospheric sciences, information sciences, ecology and other fields. The ESMD method consists of two parts. The first part is mode decomposition, which generates several modes and an optimal adaptive global mean line. The second part is time-frequency analysis, which analyzes the frequency changes on different time scales. The detailed decomposition process is described in [40].

2.4.3. The Modified Mann–Kendall (MMK) Trend Test Method

The traditional Mann–Kendall (MK) trend test method is a nonparametric statistical test method to detect the trend change of time series. The assumption in the M–K method is that the data are independent and randomly ordered. However, the time series often has autocorrelation, which influences the significance of the test results. The Modified Mann–Kendall (MMK) trend test method is the improved MK method, and it eliminates the autocorrelation components in the sequence and improves the testing ability of the MK method [41,42,43]. Therefore, the MMK trend test method was applied in this study, in order to identify the gridded drought trend characteristics in the YRB from 1998 to 2016. The detailed steps of the MMK method are as follows.
Dividing the time series XT by the mean of the sample data, a new set of sample data Xt with an average value of 1 is obtained, and the trend estimator β of the rank of the new sample sequence is calculated:
β = m e d i a n ( x i x j i j ) 1 i < j n
where β > 0 indicates an upward trend in the time series, and β < 0 indicates a downward trend in the time series.
Assuming that the trend term of the new sample sequence Xt is linear Tt, the trend term in the sample data is removed and the corresponding stationary sequence Yt is obtained:
Y t = X t T t = X t β × t
The rank sequence corresponding to sequence Yt is calculated and its autocorrelation coefficient ri is calculated:
r i = k = 1 n i ( R k R ¯ ) ( R k + i R ¯ ) k = 1 n ( R k R ¯ ) 2
where Ri is the rank of yi, and R ¯ is the average rank.
The variance var*(S) of trend statistic S of autocorrelation sequence is calculated according to autocorrelation coefficient ri:
η = 1 + 2 n ( n 1 ) ( n 2 ) × i = 1 n 1 ( n i ) ( n i 1 ) ( n i 2 ) r i
v a r ( S ) = η × n ( n 1 ) ( 2 n + 5 ) 18
The test statistic Z* is given as:
Z = { S 1 v a r ( S ) S > 0 0 S = 0 S + 1 v a r ( S ) S < 0
The Z–test value is determined using the normal distribution table. For a given significance level α, if |Zs| is less than Z0.05/2, the original hypothesis is accepted. Otherwise, the original hypothesis is rejected; that is, the time series has a significant upward or downward trend. Zs > 0 indicates an upward trend in the time series, and Zs < 0 indicates a downward trend in the time series. Zs values pass the significance test of α = 0.05 and α = 0.01 when |Zs| is greater than or equal to 1.96, and 2.58, respectively.

3. Results

3.1. Accuracy Assessment

3.1.1. Temporal and Spatial Validation of CMORPH

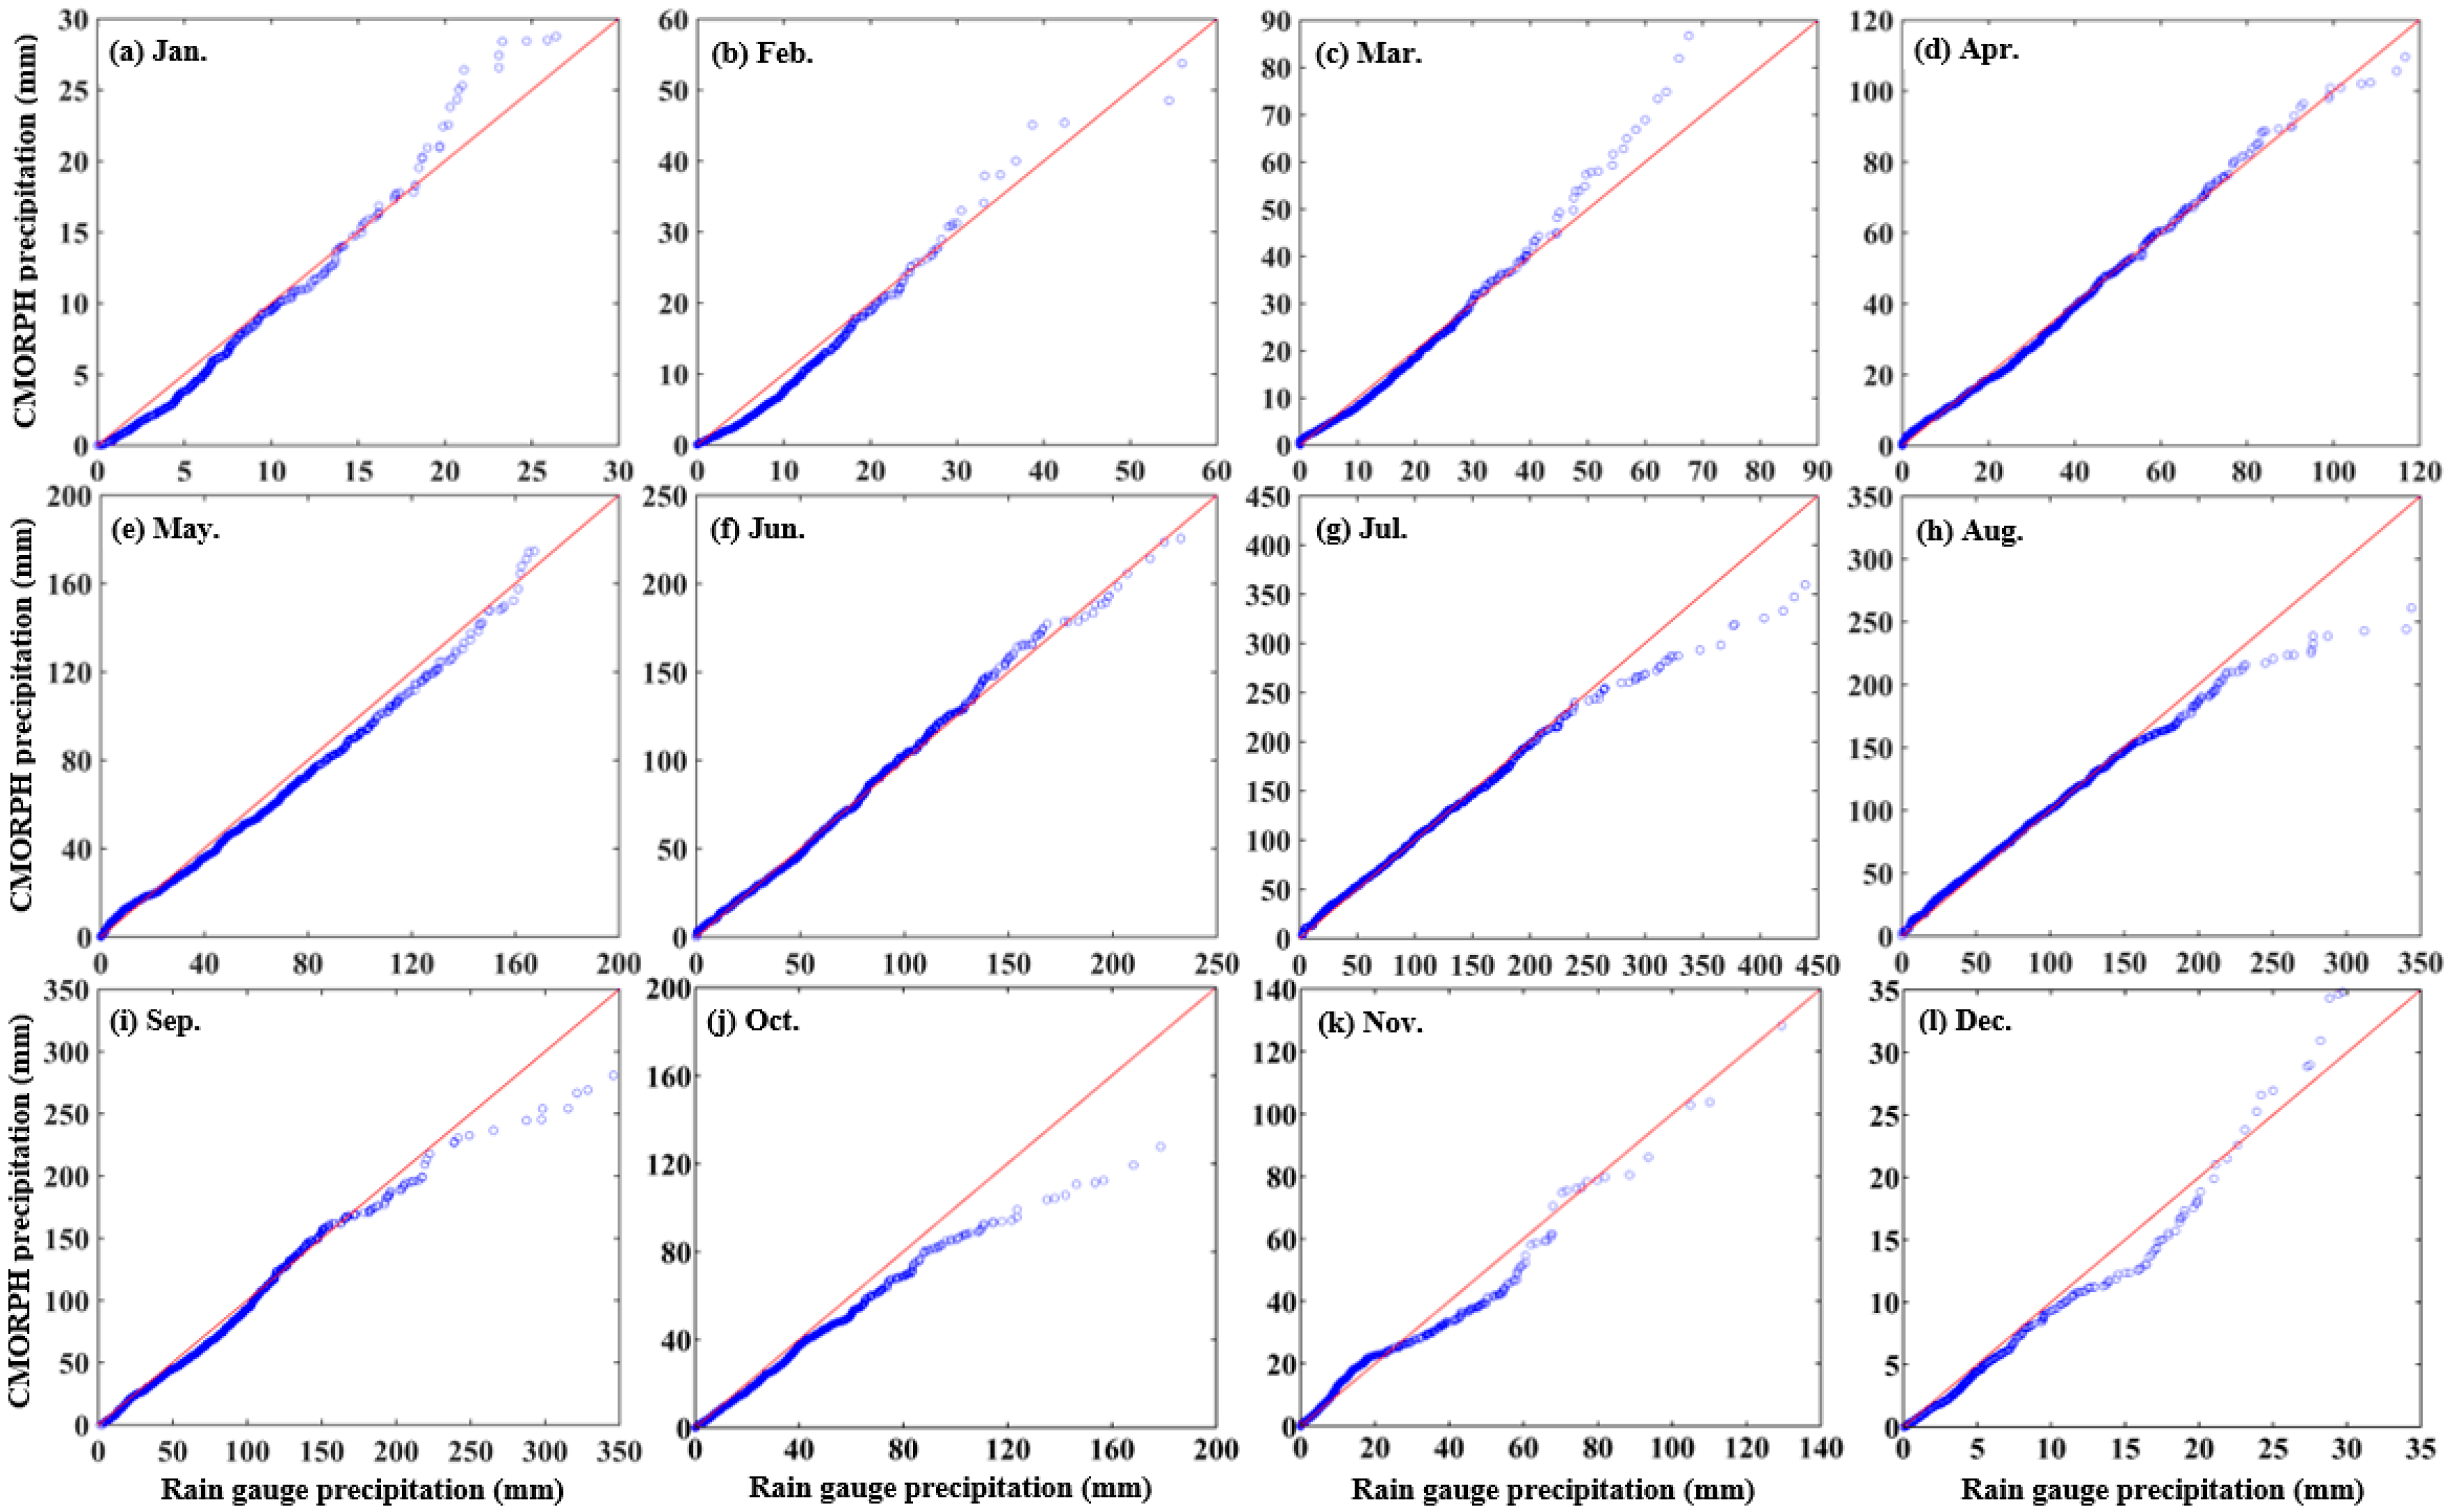
It is necessary to verify the temporal and spatial applicability of CMORPH data by comparing CMORPH with corresponding meteorological station precipitation data before using CMORPH precipitation data to analyze the drought characteristics of the YRB. The Quantile–Quantile (Q–Q) plot is an effective tool to visually assess the fitness and bias between the CMORPH data and rain gauge observations for different quantiles. By comparing and evaluating the accuracy of CMORPH precipitation data based on station precipitation observation data, the Q–Q plots for the monthly CMORPH versus rain gauge precipitation can be obtained in the YRB (Figure 2). The correlation between CMORPH and station precipitation data was very high and meets the accuracy requirement in the low value range of precipitation in each month. In the high value range of precipitation, compared with the station data, the CMORPH overestimated the actual precipitation in January, March, May, and December, but underestimated the actual precipitation in the remaining months. The higher correlation and the smaller deviation between CMORPH and station precipitation data appeared in April, May and June, which reflect the actual precipitation most accurately. Overall, CMORPH data accurately reflected the actual precipitation in the low-value range of precipitation in each month. In the high-value range of precipitation, CMORPH had some deviations compared with the station data, and may slightly overestimate or underestimate the actual precipitation, which reflected the uncertainty of the current satellite remote sensing precipitation products. There was a significant positive correlation between the CMORPH and the meteorological station precipitation data in each month, and the CC was close to 1. In conclusion, CMORPH precipitation data met the accuracy requirement on the temporal scale, and could monitor the drought situation in the YRB.
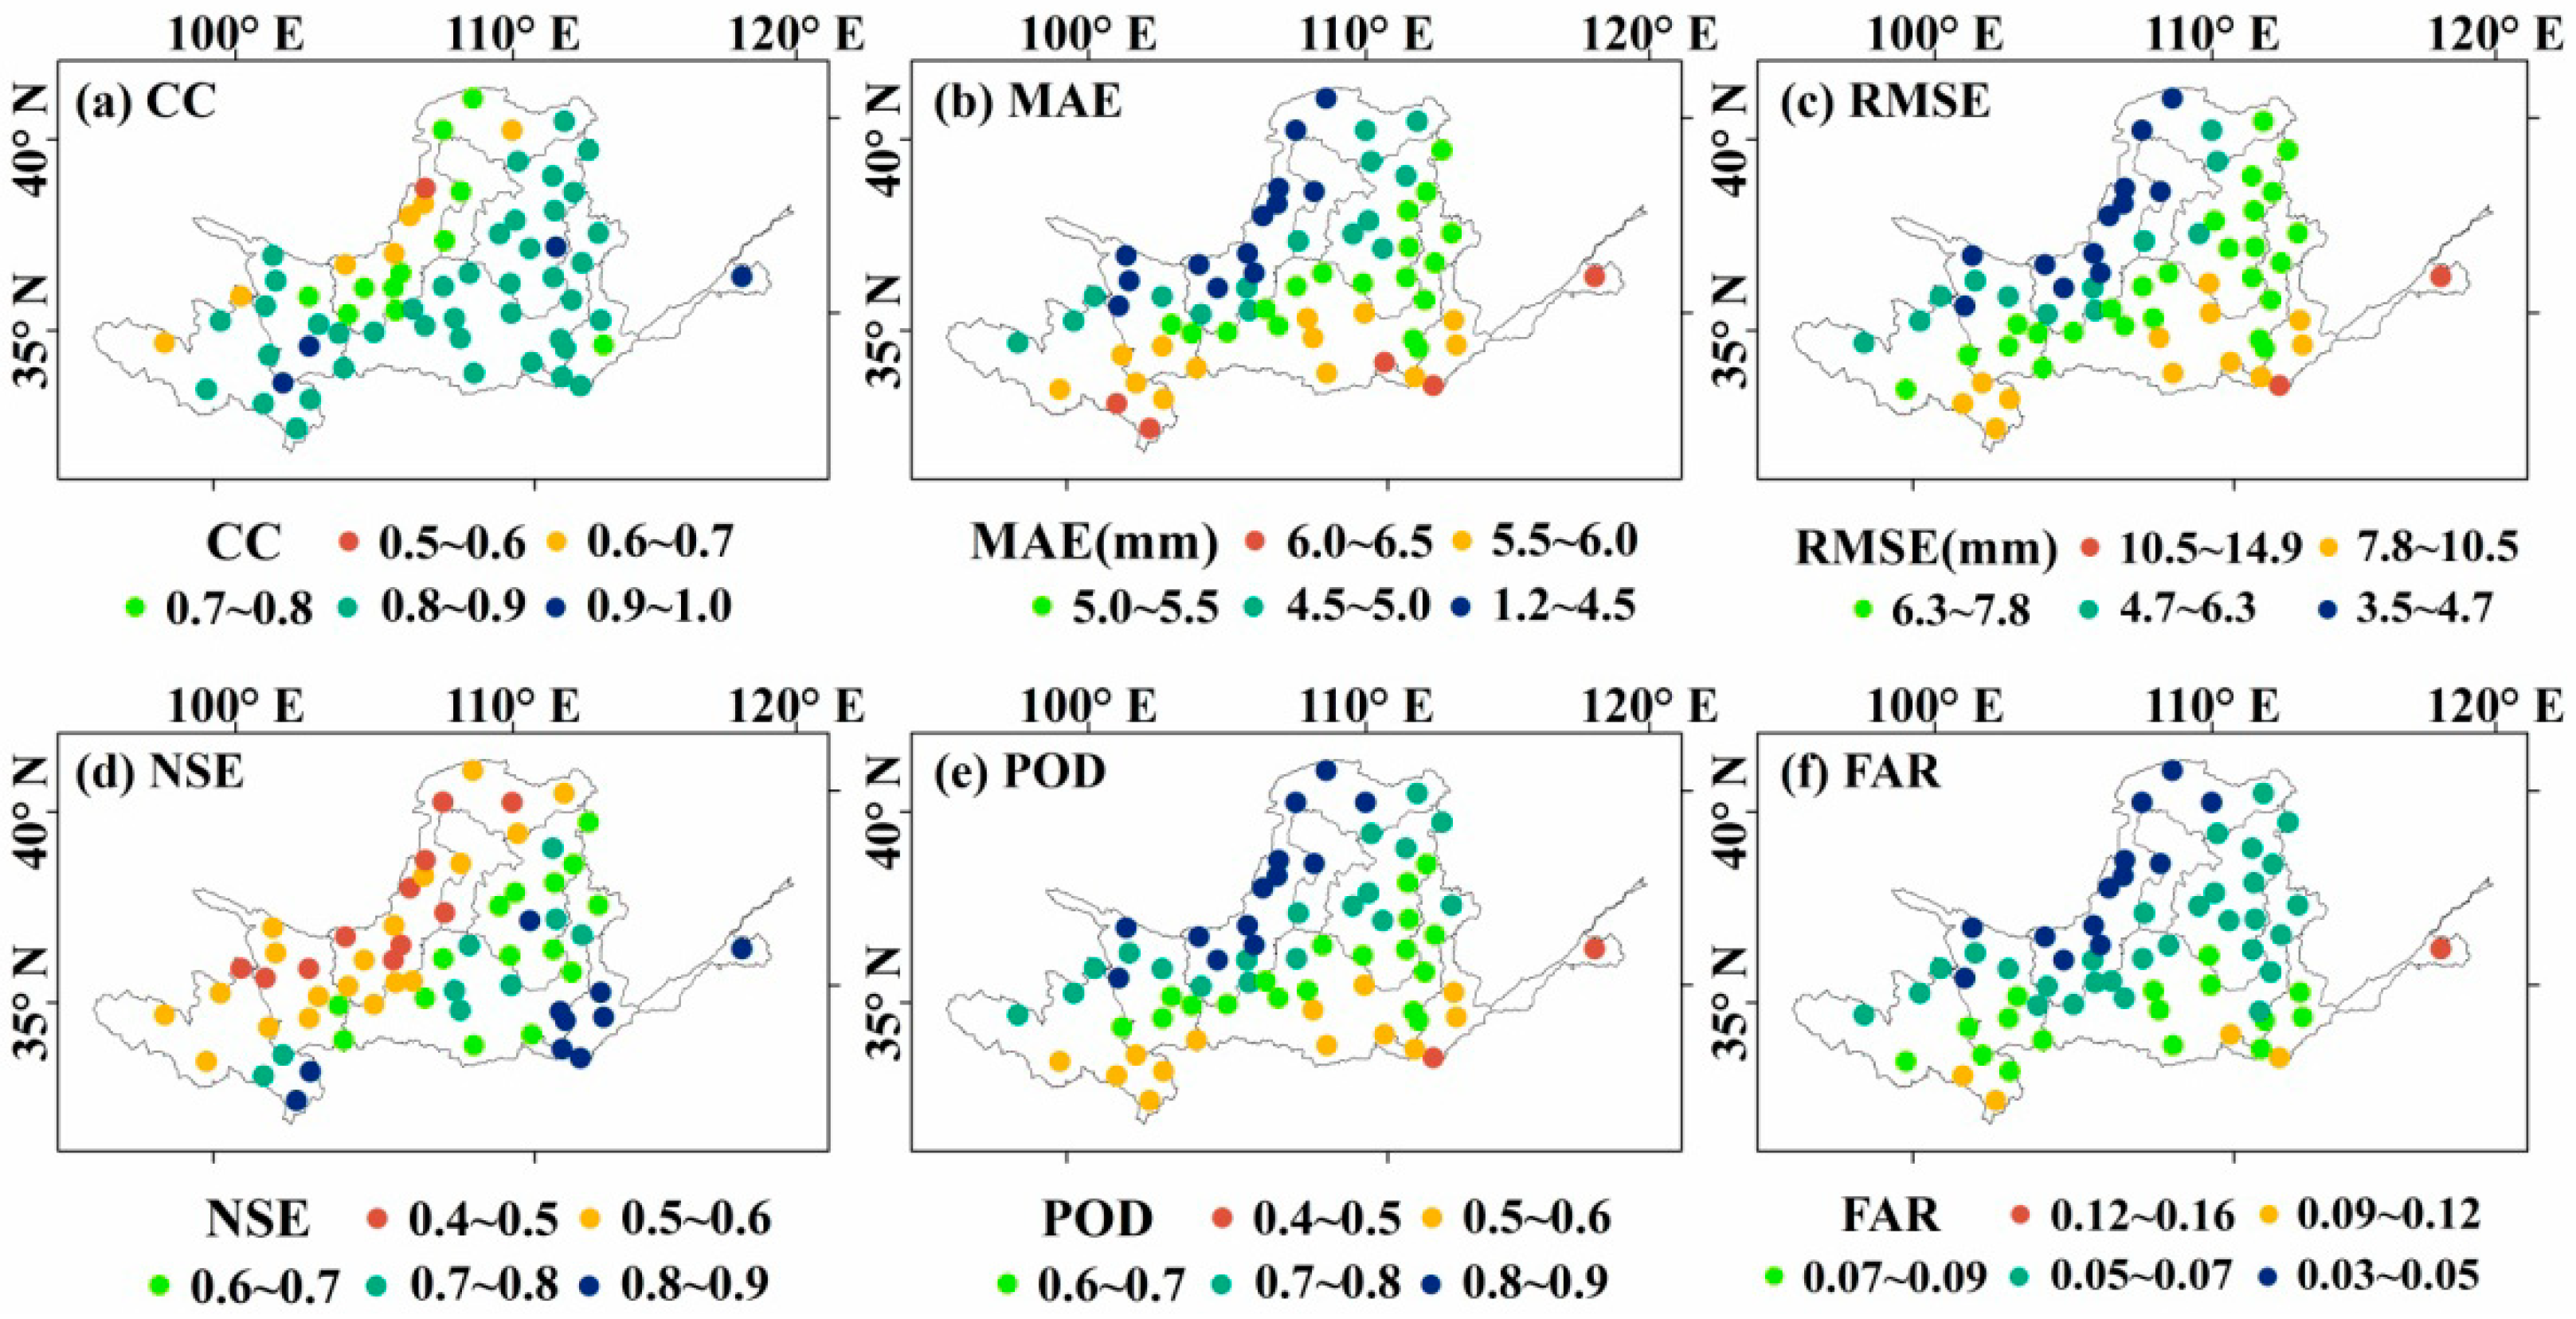
This paper not only evaluated the accuracy of CMORPH precipitation data on the temporal scale, but also verified the applicability of CMORPH data on the spatial scale in the YRB, based on six quantitative evaluation indicators. Figure 3 shows the spatial distribution of the evaluation indicators of CMORPH and precipitation data at each meteorological station in the YRB. The evaluation indicators included CC, MAE, RMSE, NSE, POD, and FAR. Through comparative analysis, it was found that CMORPH and corresponding station precipitation data were highly correlated in most stations (CC > 0.5), with an average CC of 0.84, and all correlation coefficients passed the significance test of α = 0.01 (Figure 3a). Among them, the CCs of 45 stations were above 0.8, accounting for 70.3% of the total number of stations, and the CCs of 4 stations were above 0.9. It can be seen that the correlation between CMORPH and station precipitation data was relatively high on the whole. CMORPH and station precipitation data showed the same spatial trend in the MAE and RMSE. The error decreased gradually from southeast to northwest, which was closely related to the precipitation intensity distribution (Figure 3b,c). The MAE and RMSE of most stations in the northwest of the YRB were below 4.5 mm and 4.7 mm, respectively. The spatial distribution characteristic of errors was the same as that of the precipitation amount in the YRB. The precipitation intensity was high and the precipitation amount varied greatly in the southeast of the YRB, which made the error value relatively high, while the error value was also relatively low due to less precipitation in the northwest of the basin. The evaluation indicator NSE also showed that CMORPH had a strong ability to detect precipitation events. The NSE value of each station was higher, with an average value of 0.68, and the NSE value of 10 stations was above 0.8 (Figure 3d). The POD ranged from 0.4 to 0.9, with an average value of 0.74 (Figure 3e). It can be seen that overall, CMORPH precipitation data had few missed reports of precipitation events. Similar to the spatial distribution characteristics of MAE and RMSE, FAR also showed a decreasing trend from southeast to northwest (Figure 3f). A total of 43 stations had FAR values below 0.07, accounting for 67.2% of the total number of stations. CMORPH data had quite small FAR value ranging from 0.03 to 0.16, indicating that CMORPH detected a very limited number of unrealistic precipitation events.
Overall, the accuracy of the CMORPH data was high in the YRB. It can be seen that the differences between CMORPH and rain gauge observations were generally small and the CCs were relatively high. Additionally, CMORPH precipitation data met the accuracy requirements on the temporal and spatial scale. Thus, CMORPH data were considered acceptable for drought monitoring in the YRB.

3.1.2. Accuracy Assessment of GSPEI

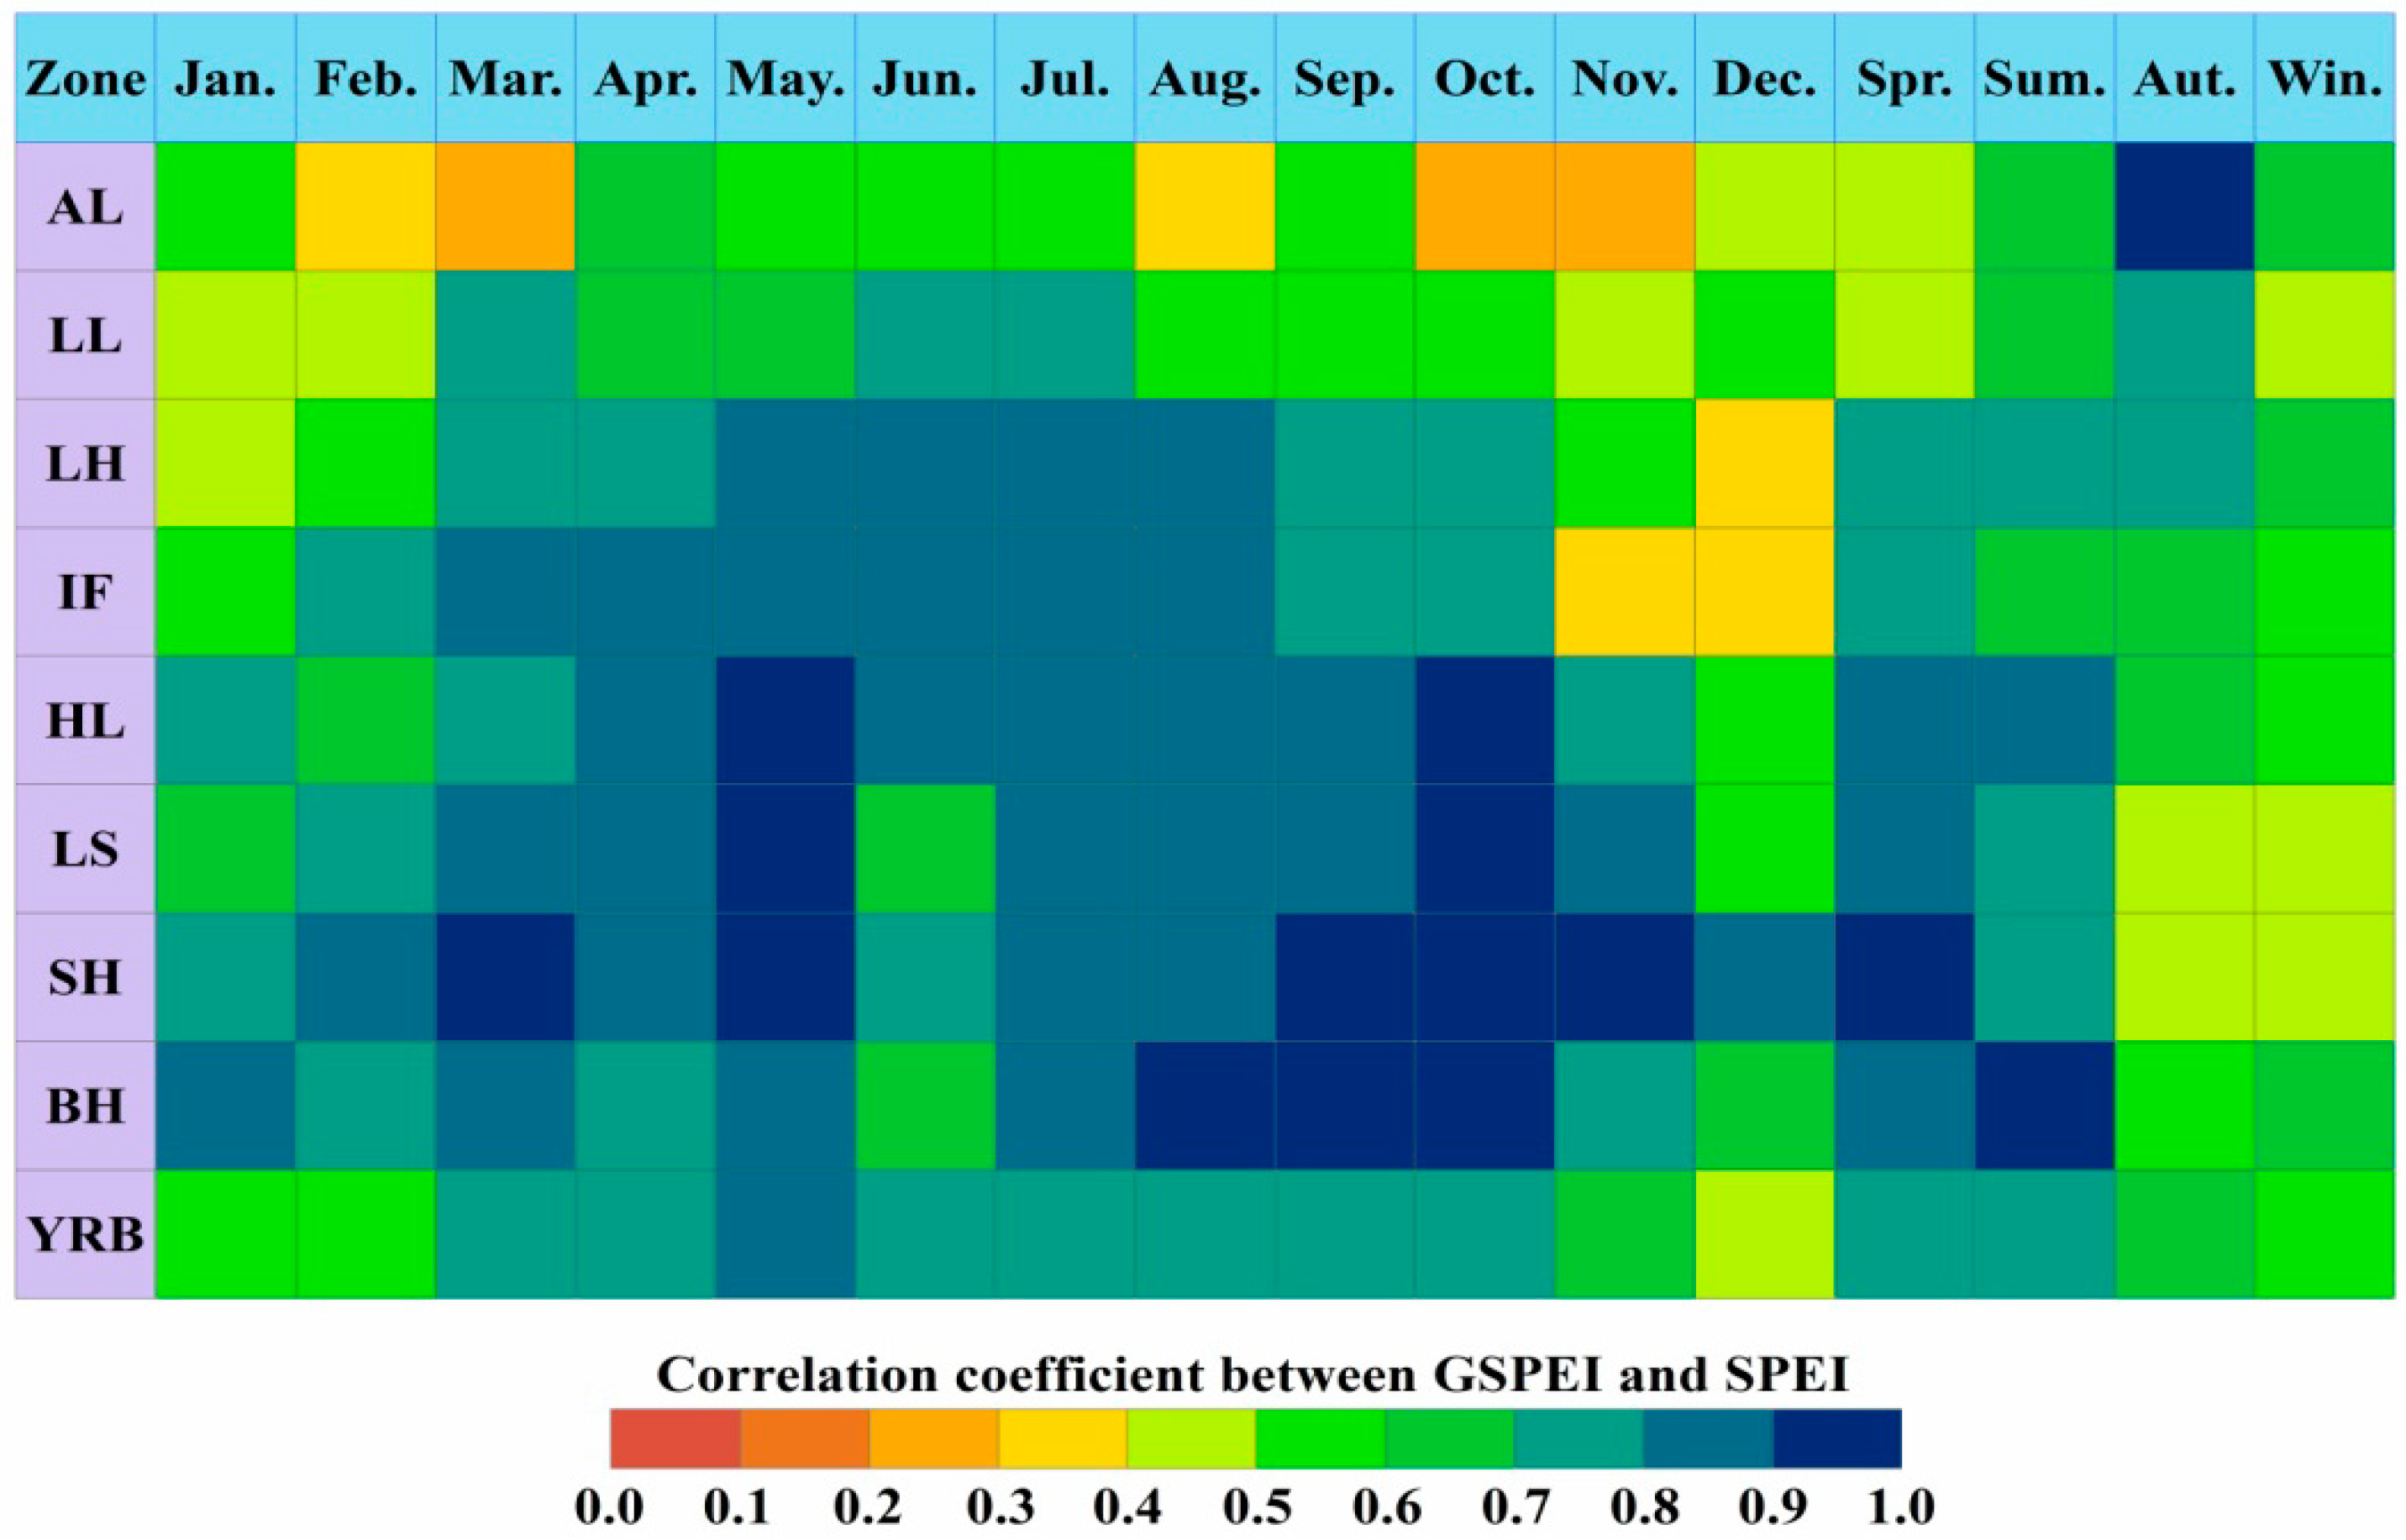
Previous studies have usually calculated the SPEI of a meteorological station based on the precipitation and temperature, and have then obtained the regional drought distribution by spatial interpolation [44,45]. In order to quantitatively explore the correlation between grid-based GSPEI and station-based SPEI, we interpolated the calculated the SPEI to the same spatial resolution (8 km) as the GSPEI, and then compared the correlation between the GSPEI and SPEI (Figure 4). The monthly and seasonal CCs between GSPEI and SPEI are shown in Figure 5. The CC was 0.456 at the significance level of 0.05, and was 0.575 at the significance level of 0.01. On the monthly scale, the average CCs between GSPEI and SPEI in the whole basin from January to December were 0.57, 0.58, 0.72, 0.78, 0.83, 0.73, 0.77, 0.73, 0.76, 0.73, 0.62, and 0.49, respectively. Except for a slightly lower CC in December (CC < 0.5), the CCs between GSPEI and SPEI were higher in the other months, and reached a maximum value of 0.83 in May. The CC between GSPEI and SPEI passed the significance test of α = 0.05 in January and December, and passed the significance test of α = 0.01 from February to November. The average CCs of each subzone were calculated, and the maximum CCs between GSPEI and SPEI from January to December were found in BH (0.81), SH (0.86), SH (0.92), SH (0.89), SH (0.98), IF (0.85), HL (0.88), BH (0.91), SH (0.95), SH (0.96), SH (0.91), and SH (0.81), respectively. On the seasonal scale, the average CCs between GSPEI and SPEI in spring, summer, autumn, and winter were 0.72, 0.73, 0.67, and 0.55, respectively. The CCs passed the significance test of α = 0.01 in spring, summer, and autumn. Although the CC was slightly lower in winter, it also passed the significance test of α = 0.05. The maximum CCs in spring, summer, autumn, and winter were found in SH (0.95), BH (0.92), AL (0.95), and BH (0.68), respectively. In summary, most of the maximum CCs between GSPEI and SPEI appeared in SH and BH in each month and season. The positive correlation was high in spring, summer, and autumn, and they all passed the significance test of α = 0.01. CMORPH satellite precipitation data accurately captures the precipitation information of the YRB, and the GSPEI calculated by using CMORPH data can better reflect the gridded drought characteristics of the YRB. Because CMORPH precipitation data had high spatial and temporal resolution, and the drought characteristics reflected by CMORPH and meteorological station data had strong positive correlation, CMORPH data could be used as a substitute for meteorological station observation data for drought monitoring in the YRB.

3.2. GSPEI-Based Drought Characteristics

3.2.1. Temporal Evolution of Drought

The GSPEI calculated by using CMORPH precipitation data can be used to evaluate the gridded drought characteristics of the YRB. In order to explore the seasonal and annual drought characteristics of the YRB during 1998–2016 in detail, ESMD decomposition of seasonal and annual GSPEI was carried out in the whole basin. When the trend item R corresponded to the minimum variance ratio and the optimal screening times were reached, the ESMD decomposition stopped automatically; thus, the long-term overall variation trend of drought could be obtained (Figure 6). The trend item R based on ESMD decomposition can well reflect the temporal evolution characteristics of drought, which was the adaptive global average line of the sequence. From Figure 6, it can be seen that drought trends in eight subzones were obviously different on the seasonal and annual scale. On the seasonal scale, the subzones with an increasing drought trend were AL, LL, LH, and BH in spring; AL, LL, LS, SH, and BH in summer; SH and BH in autumn; and SH and BH in winter. The subzone with the most obvious trend of drought was AL in spring, and the linear tendency rate of GSPEI was −0.07/10a. The seasonal drought in other subzones showed a decreasing trend. The most obvious drought mitigation trend occurred in HL in autumn, and the linear tendency rate of GSPEI was 0.11/10a. On the annual scale, the subzones with an increasing drought trend were AL, LL, SH, and BH, with an SPEI linear tendency rate of −0.09/10a, −0.435/10a, −0.162/10a, and −0.17/10a, respectively. The drought in LH, IF, HL, and LS showed a decreasing trend, especially in HL (P < 0.01), with an SPEI linear tendency rate of 0.864/10a. It was notable that both seasonal and annual drought showed an increasing trend in BH.
In the whole basin scale, the seasonal and annual drought showed a decreasing trend in the YRB from 1998 to 2016. The linear tendency rates of spring, summer, autumn, winter, and annual GSPEI were 0.034/10a, 0.01/10a, 0.045/10a, 0.012/10a, and 0.215/10a, respectively. The average GSPEI values in spring, summer, autumn, and winter were −0.09, −1.46, 0.30, and 1.33, respectively. It could be seen that the drought severity in each season of the YRB was highest in summer, followed by spring, autumn, and winter. Figure 6 indicated that the drought trend based on ESMD decomposition was exactly the same as that reflected by the GSPEI, showing an identical upward or downward trend. This showed that the ESMD method can delineate the fluctuation of the original sequence in the research period, and can separate the variation trend from a time series of several years. The ESMD method has significant advantages in data analysis and mining.

3.2.2. Spatial Distribution of Drought

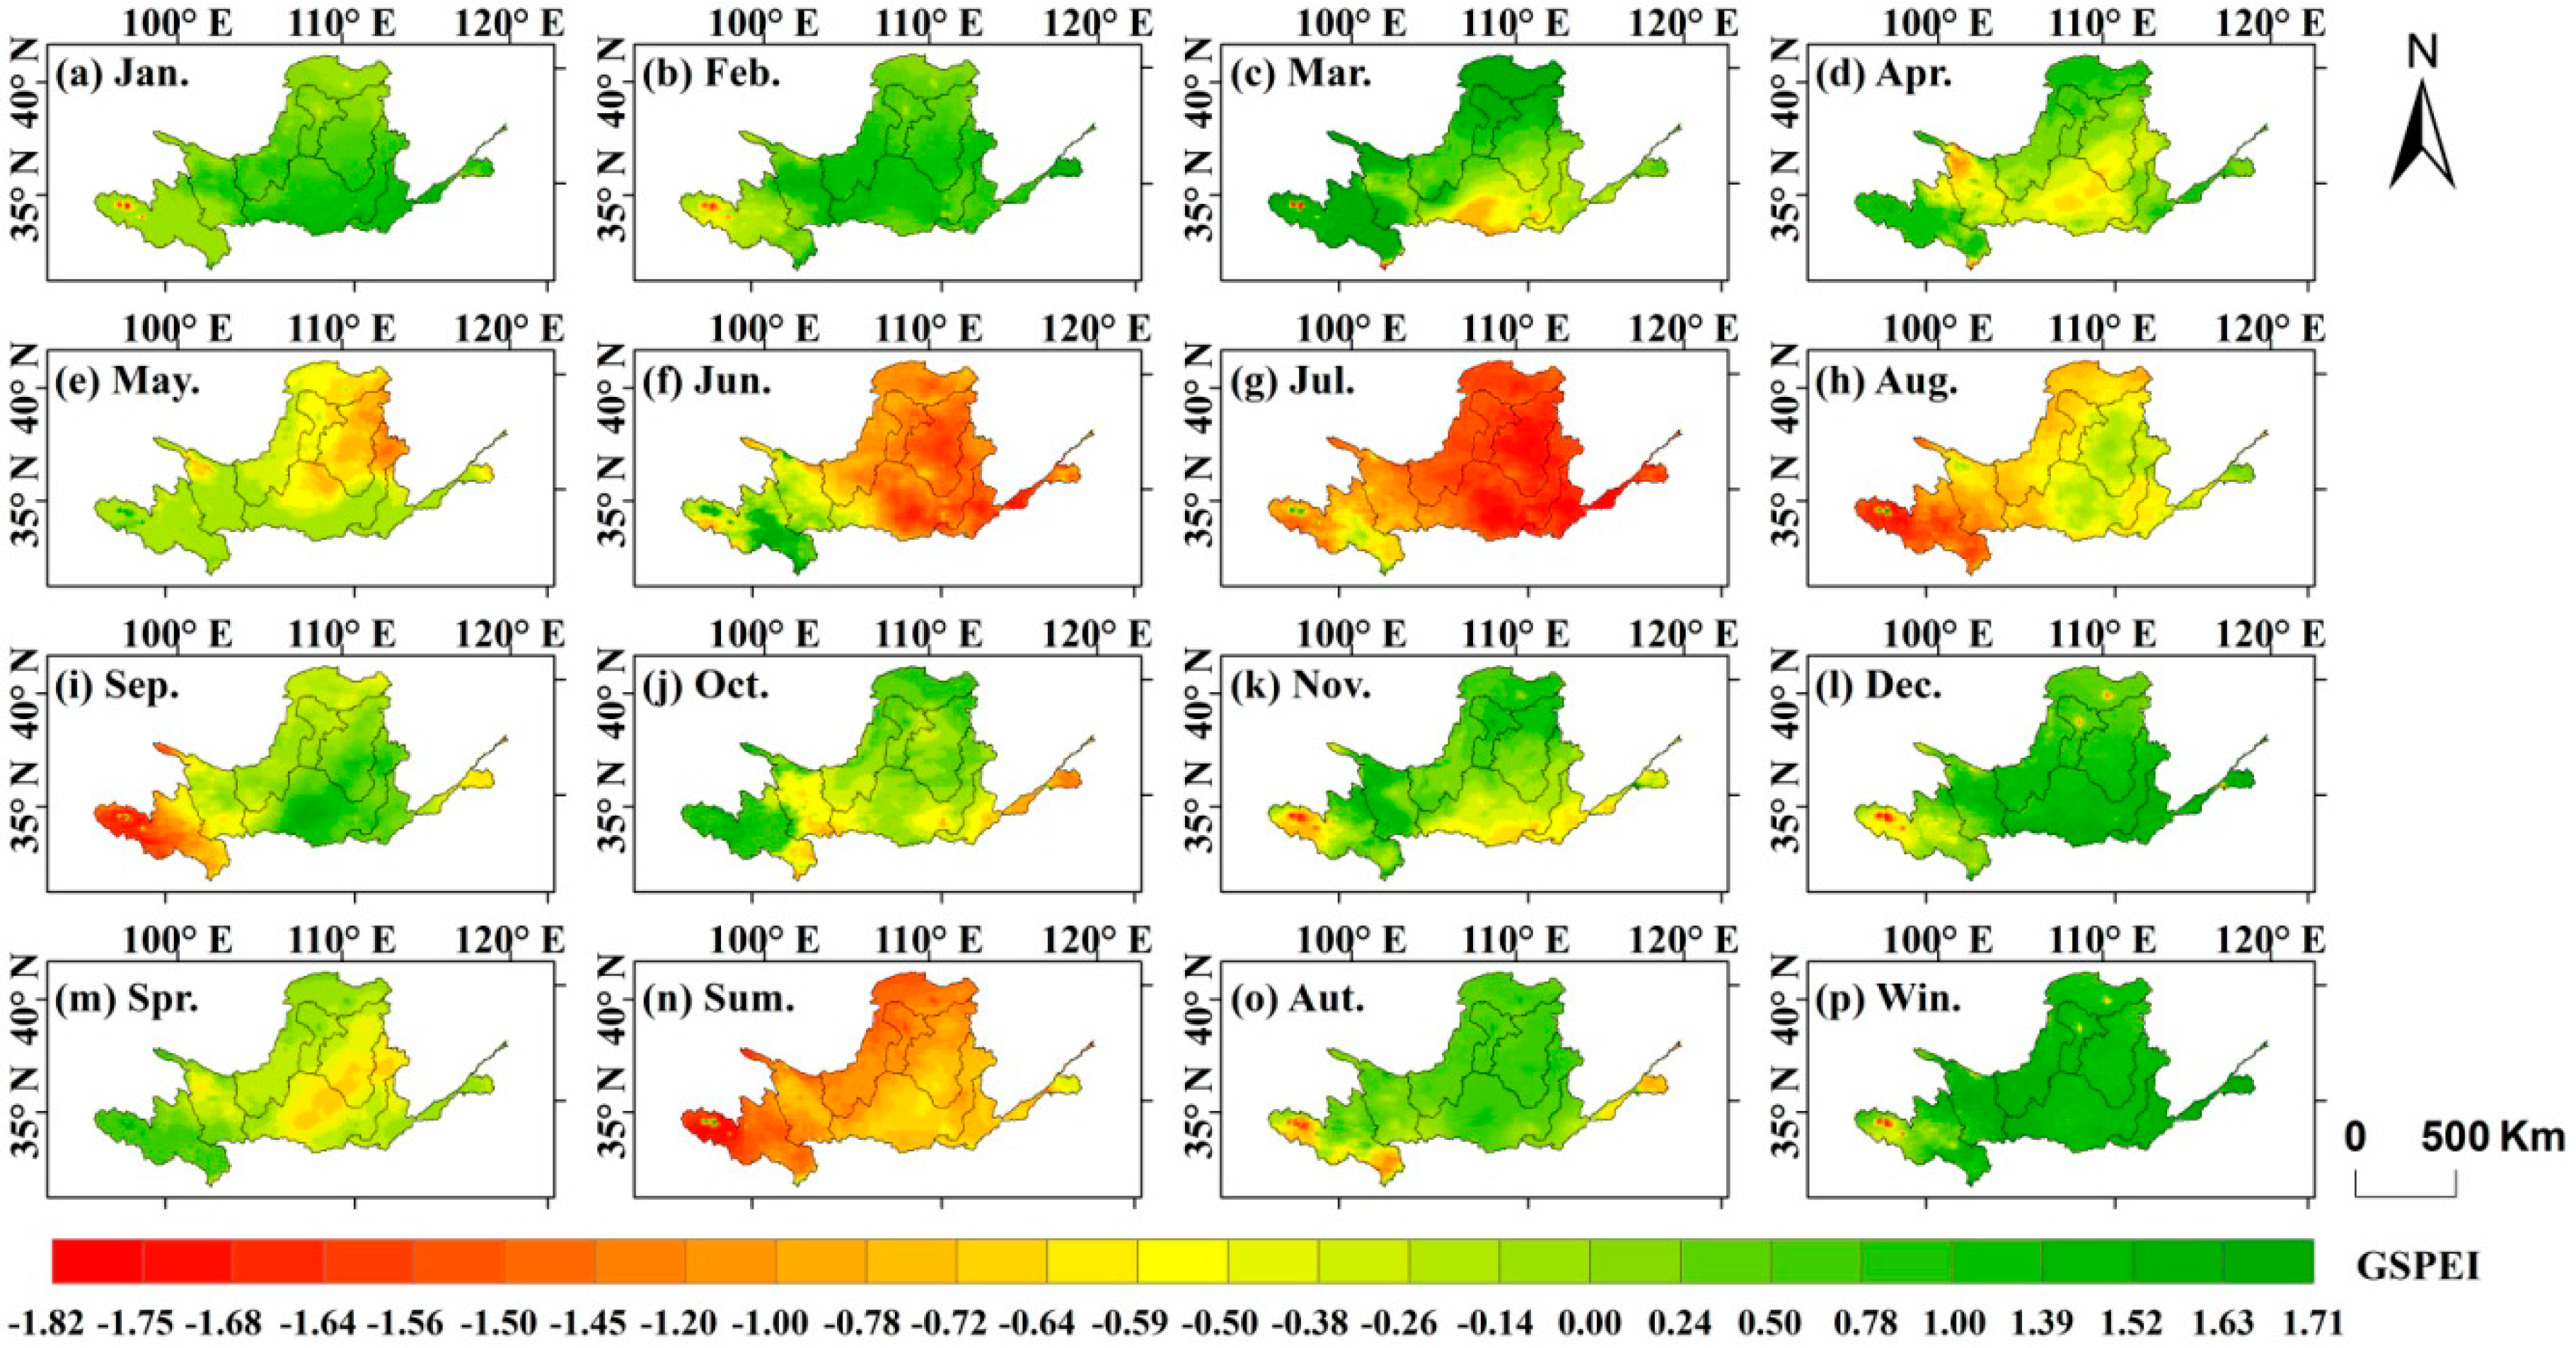
Figure 7 illustrates the spatial distribution characteristics of monthly and seasonal drought based on the GSPEI in the YRB. The monthly and seasonal GSPEI was the average value during 1998–2016. On the monthly scale, the average GSPEI values for all grids in the YRB from January to December were 1.34, 1.33, 0.51, −0.02, −0.77, −1.40, −1.67, −1.32, −0.20, 0.49, 0.61, and 1.33, respectively. It can be concluded that the most serious drought occurred in July, followed by June and August. As shown in Figure 7g, drought occurred in almost the whole basin in July, and the minimum GSPEI value reached −1.82. The GSPEI value decreased gradually from January to July, which indicated that drought was aggravating. And the GSPEI value increased gradually from July to December, indicating that drought was slowing down. The average monthly GSPEI values in each subzone were calculated, and the subzones with the most serious drought from January to December were AL (0.97), AL (0.94), LS (−0.32), LS (−0.43), HL (−1.11), SH (−1.57), IF (−1.80), AL (−1.52), AL (−1.39), BH (−0.74), SH (−0.52), and AL (0.95), respectively. These subzones should pay attention to drought monitoring and formulate timely drought prevention and mitigation measures in the months when drought was relatively serious. Drought was relatively mild in other subzones. On the seasonal scale, drought disasters were more seriousl in summer in the YRB, with an average GSPEI value of −1.46, and the drought grade was moderate, as seen in Table 2. Drought was relatively mild in the other seasons, and the average GSPEI values in spring, autumn, and winter were −0.09, 0.30, and 1.33, respectively, which was consistent with the conclusions of the seasonal GSPEI in Section 3.2.1. The average seasonal GSPEI values in each subzone were calculated, and the subzones with the most serious drought in spring, summer, autumn, and winter were HL (−0.68), AL (−1.49), AL (−0.42), and AL (0.95), respectively. These subzones should formulate specific drought resisting measures for the season when drought is relatively serious, which could alleviate the losses caused by drought and help to improve the overall drought resistance level of the YRB.

3.3. Drought Trend Characteristics at the Grid Scale

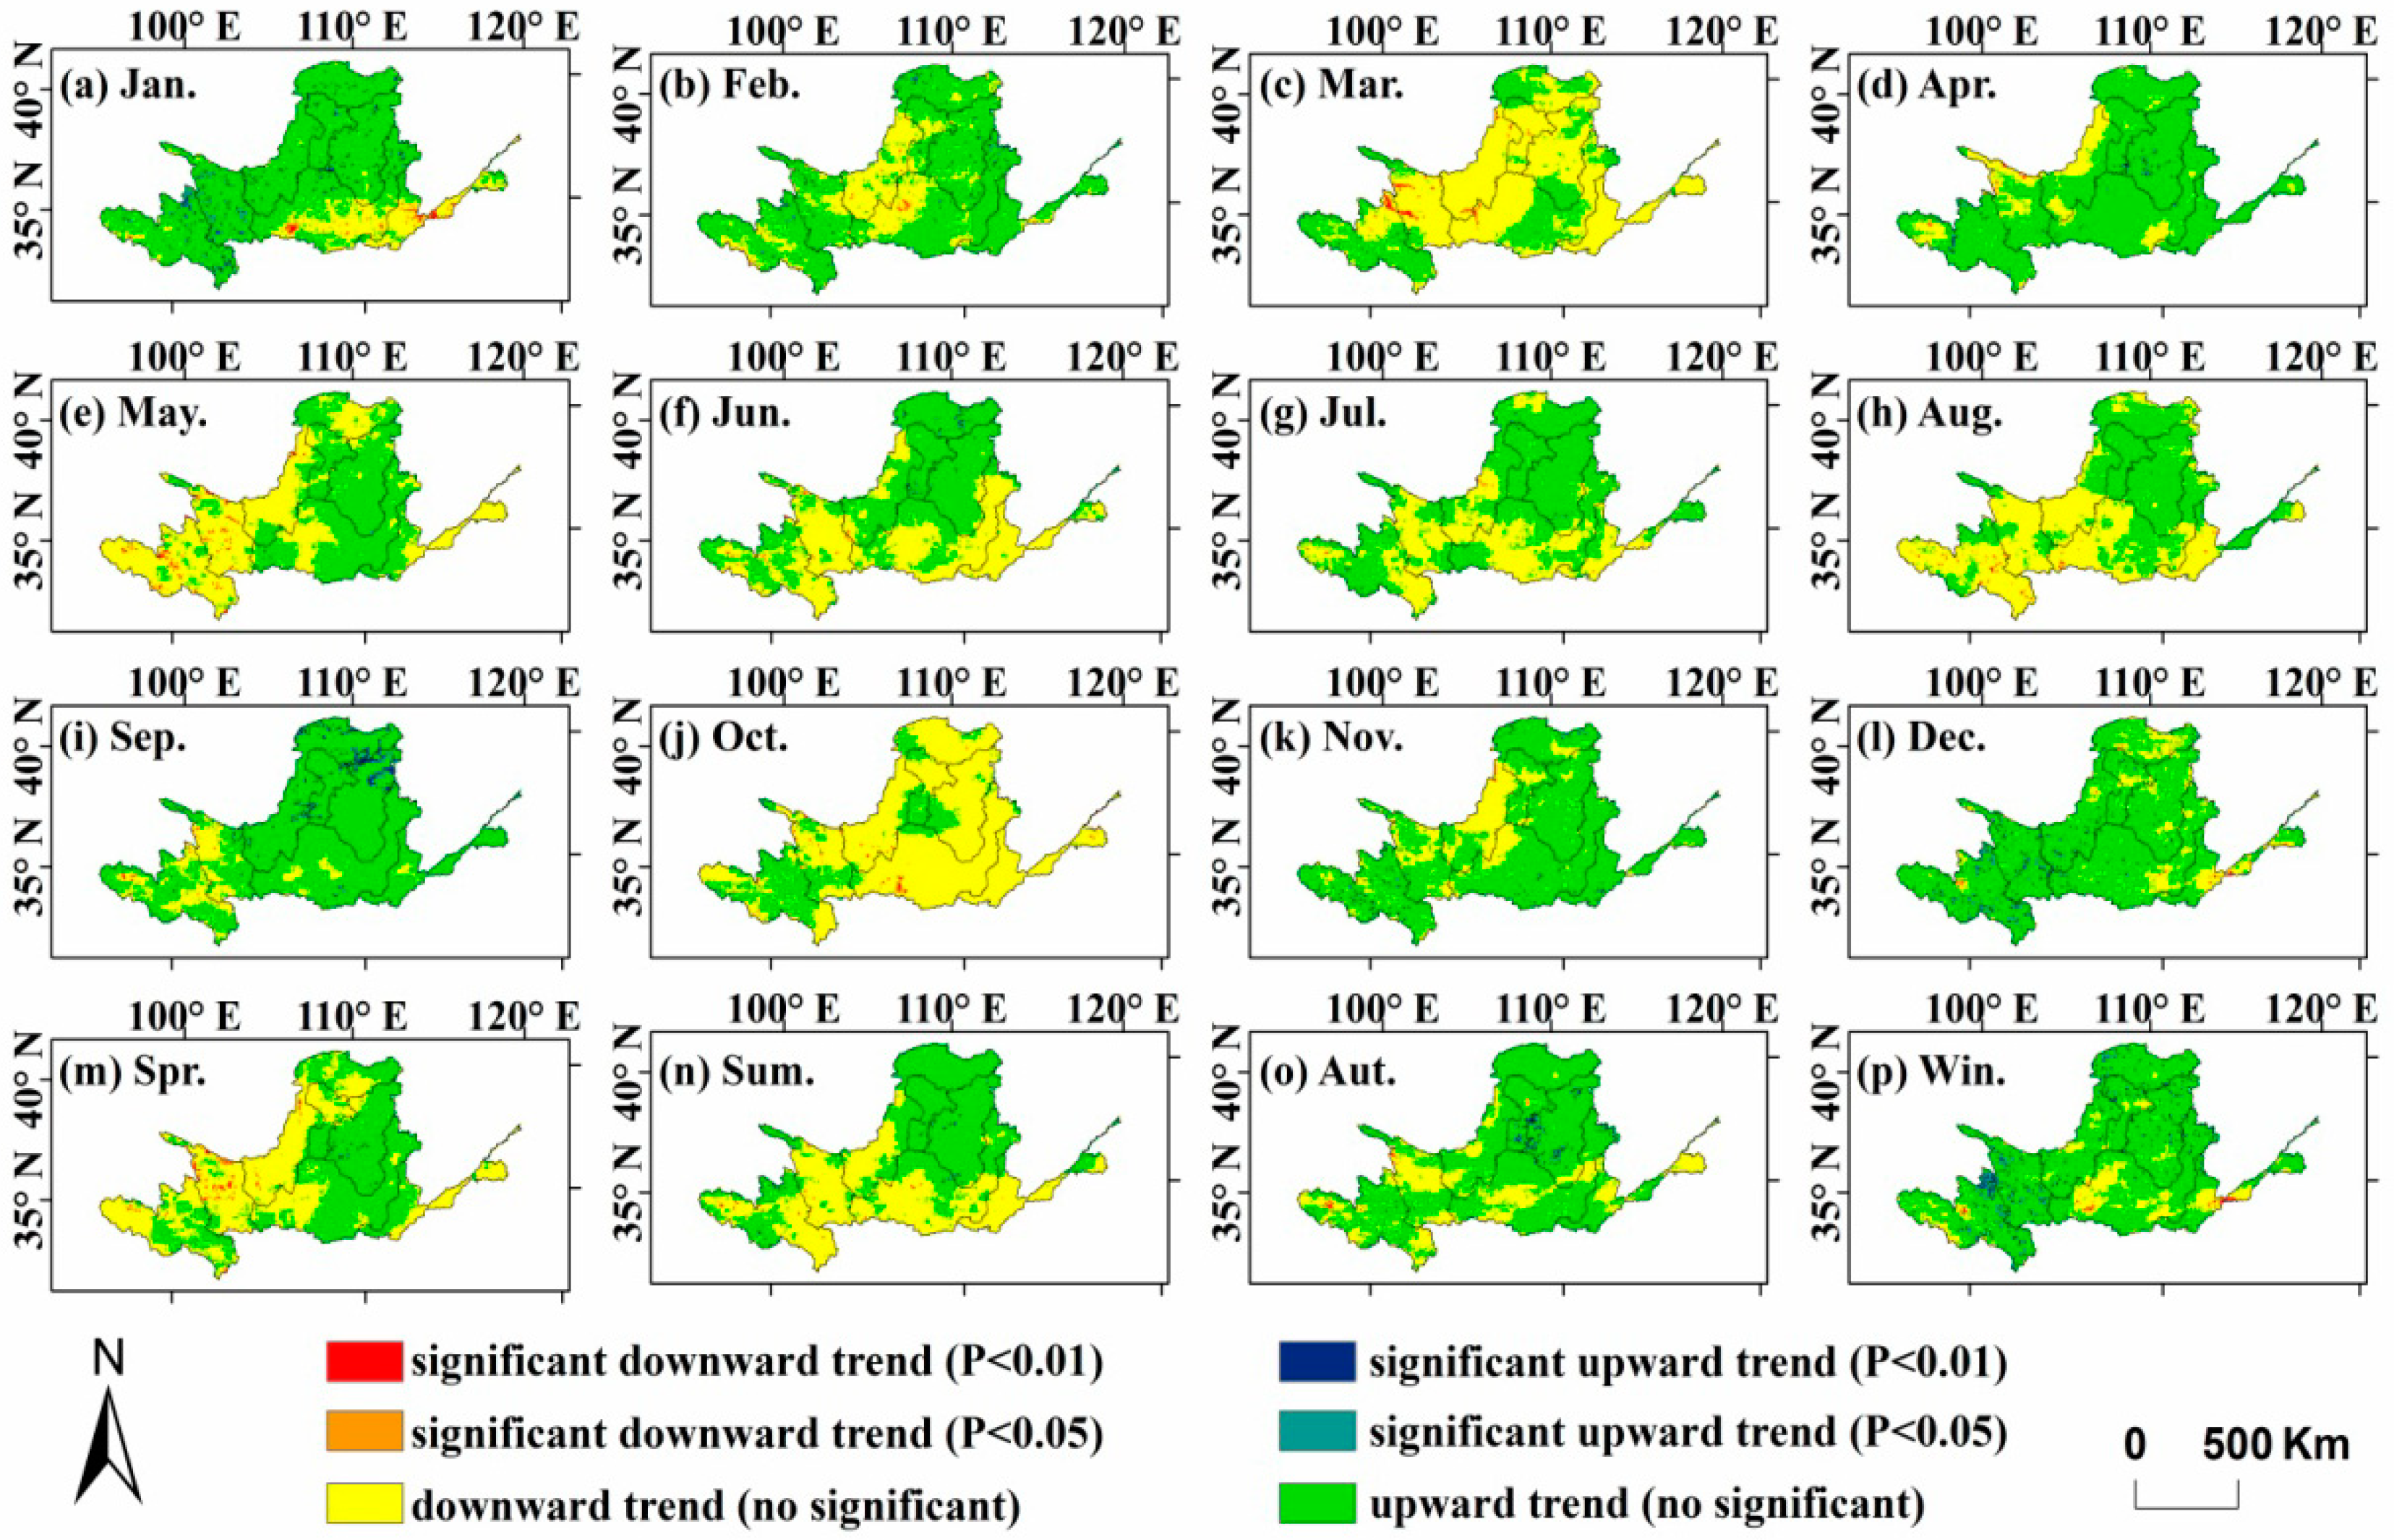
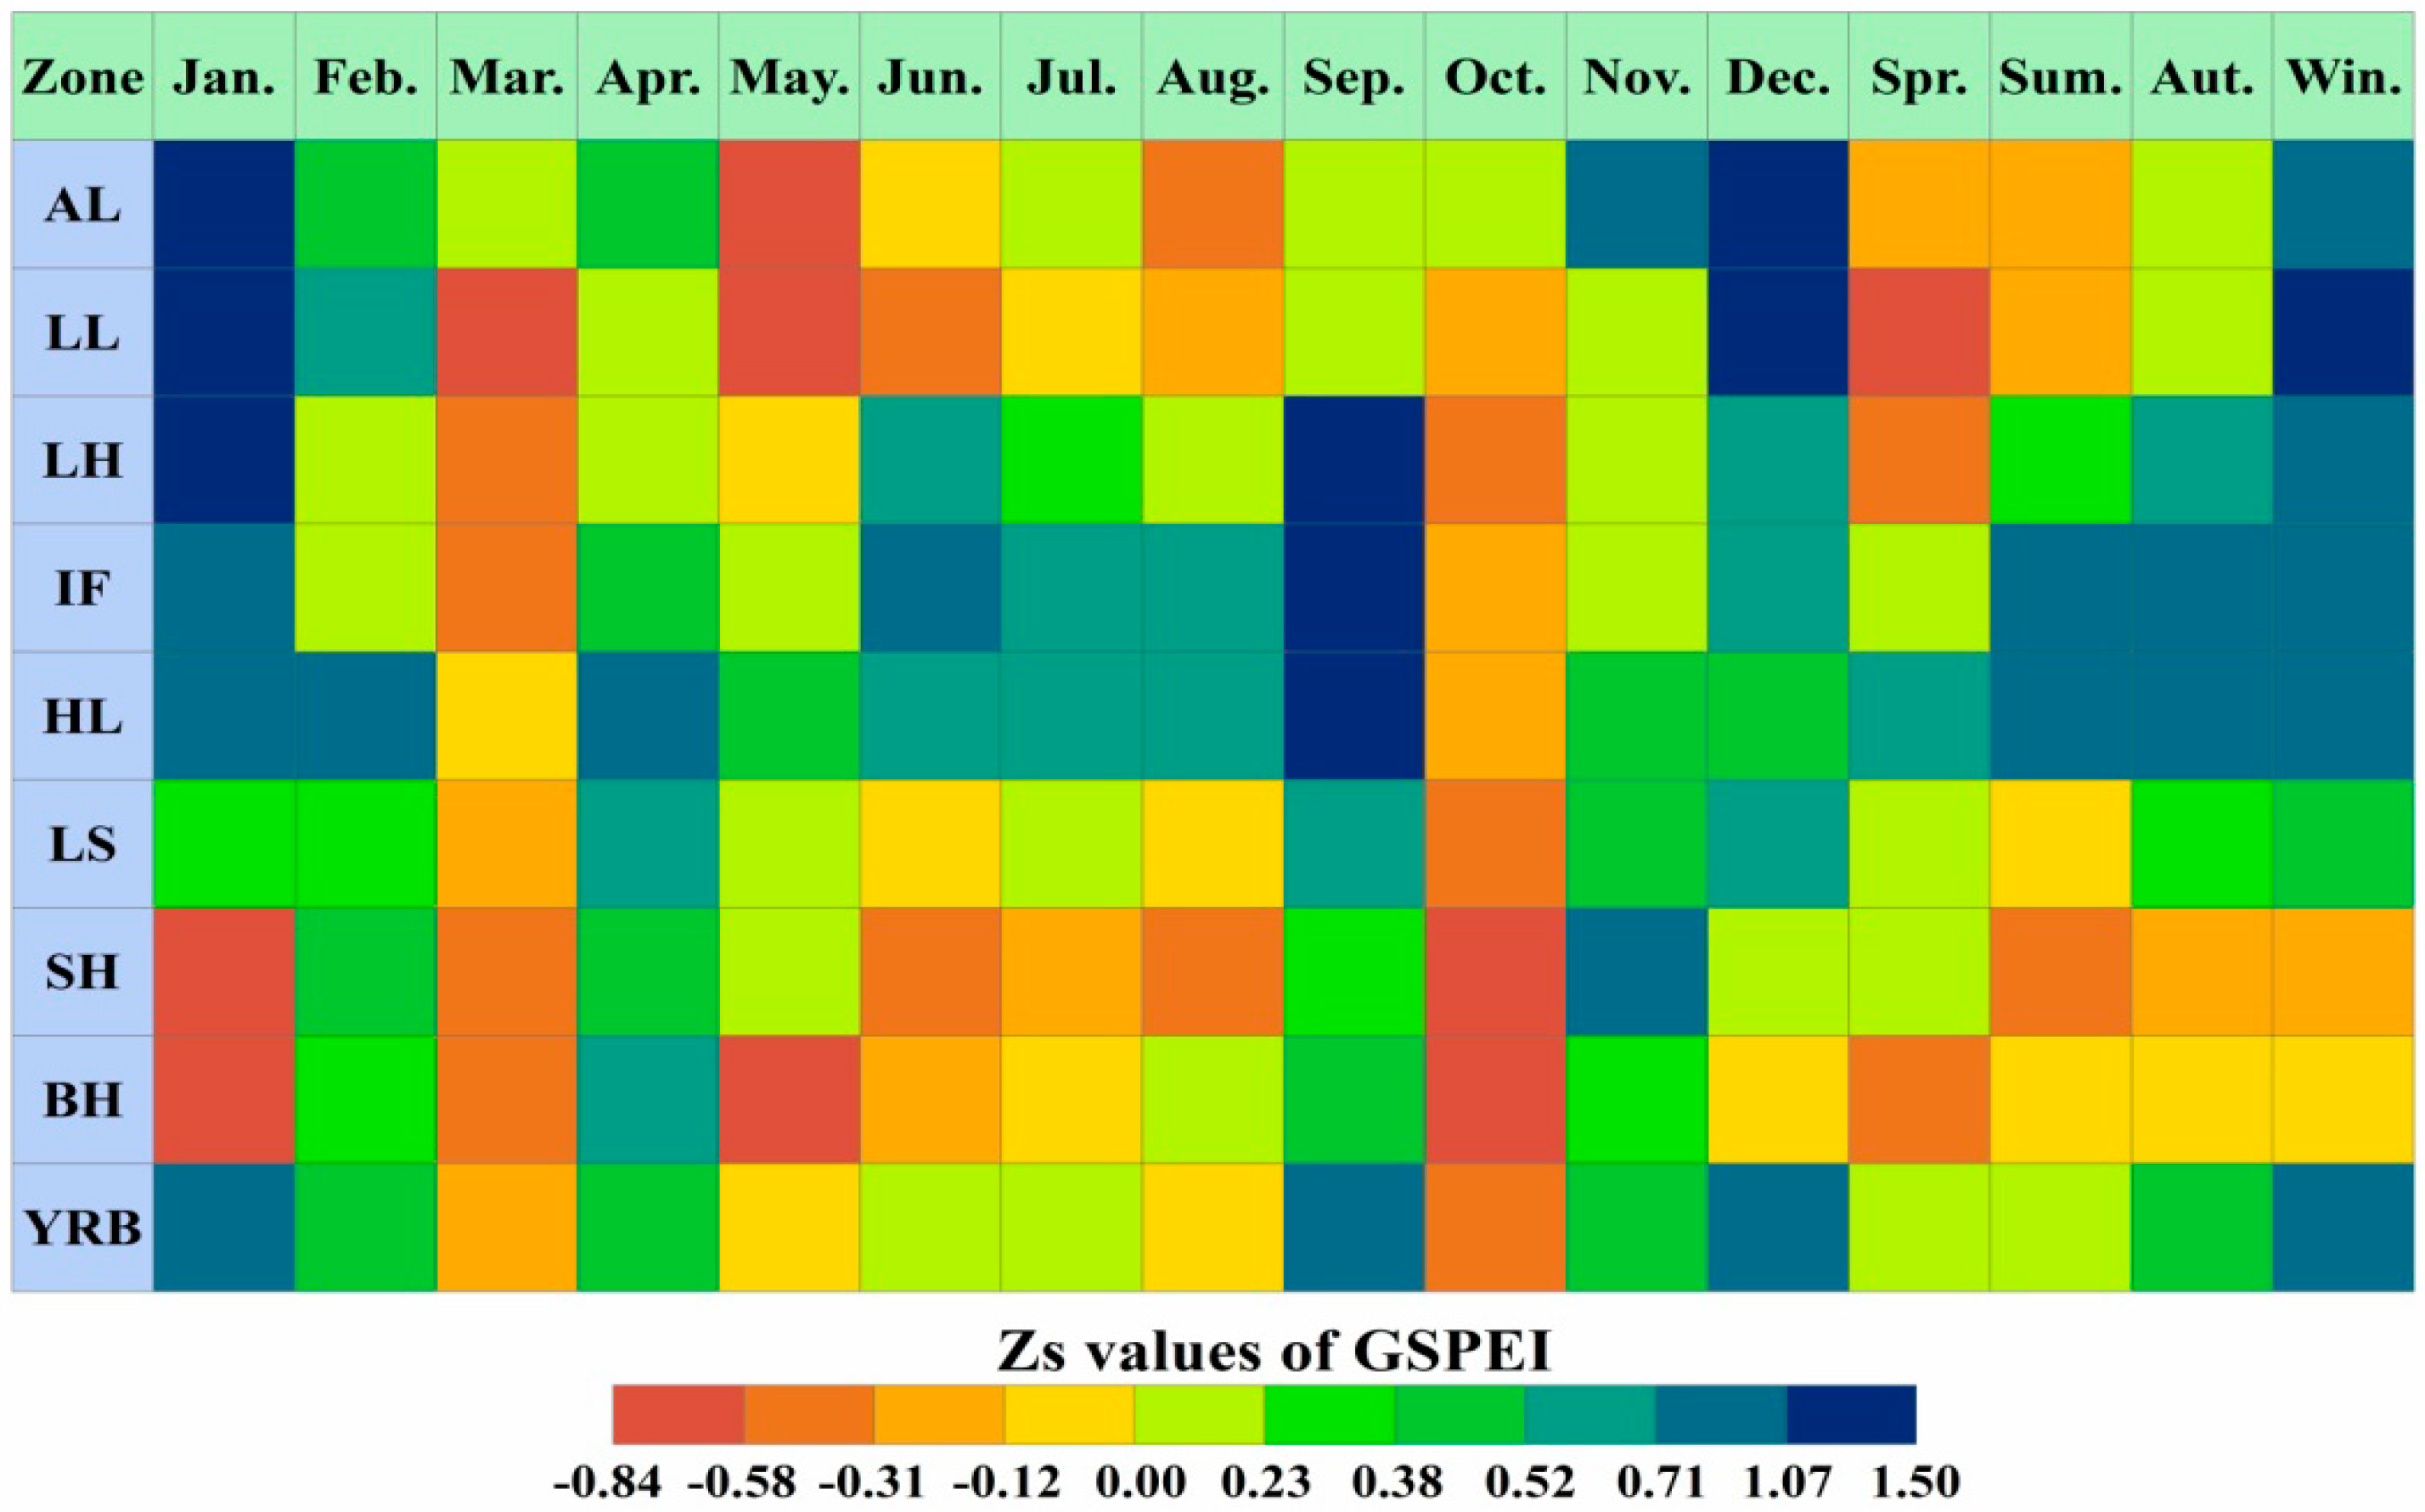
The monthly and seasonal GSPEI trend characteristics of the YRB are depicted based on the MMK trend test method in Figure 8. Figure 9 shows the trend characteristic Zs values of the monthly and seasonal GSPEI for the whole basin and each subzone. On the monthly scale, the average trend characteristic values of all grids from January to December were 0.81, 0.39, −0.24, 0.45, −0.11, 0.13, 0.18, −0.01, 0.79, −0.32, 0.44, and 0.77, respectively. The GSPEI for four months (March, May, August, and October) showed a downward trend and drought showed an upward trend, while the drought in the remaining months showed a downward trend. The area percentage of drought increasing trend in the YRB from January to December was 18.5%, 29.7%, 69.4%, 15.5%, 53.0%, 46.9%, 39.9%, 52.6%, 14.2%, 78.5%, 23.3%, and 16.1%, respectively. On the seasonal scale, the average Zs values of the GSPEI in spring, summer, autumn, and winter were 0.03, 0.16, 0.43, and 0.81, respectively. It can be seen that the seasonal drought trend slowed down in the YRB, while the drought trend characteristic was different in each subzone, which is consistent with the conclusions of seasonal variation characteristics of drought in Section 3.2.1. The area percentage with a drought increasing trend in spring, summer, autumn, and winter was 49.3%, 47.3%, 27.7%, and 16.8%, respectively. The average trend characteristic Zs values did not pass the significance test of α = 0.05, which indicated that the monthly and seasonal drought showed a non-significant increase or decrease trend in the YRB (Figure 9).

4. Discussion

Jiang et al. indicated that CMORPH precipitation data can be successfully applied in the YRB, and that this data performed much better than TMPA precipitation data [16]. The GSPEI calculated by using CMORPH satellite precipitation data showed that the drought slowed down in the YRB from 1998 to 2016, which was consistent with the previous research in [46,47]. In recent years, China has invested significant funds in ecological restoration in the YRB, and has successively implemented ecological environmental protection projects such as grain for green, natural forest protection, which have led to a slowdown in drought in the YRB [48]. Additionally, the increase in precipitation (19.88 mm/10a) was one of the main reasons for drought mitigation [49]. Liu et al. indicated that the most serious drought in the YRB occurred in summer, followed by spring, which was consistent with the conclusions of this study [50]. The gridded drought characteristics of the YRB based on CMORPH precipitation data were the same as the actual drought situation of the basin. It can be concluded that CMORPH data can be used effectively as a substitute for ground station observation data for drought monitoring and assessment in the YRB. CMORPH data has wide coverage, it is dynamic, economic, and continuous, and it has great application prospects in drought monitoring [51].
There were still some deviations between CMORPH and actual observation data in winter, which was consistent with the results in [52,53]. Liao et al. explored the applicability of six satellite precipitation products in China, and the results showed that the comprehensive evaluation effect of CMORPH data was the best, and the accuracy of satellite inversion data in spring, summer, and autumn was higher than in winter [54]. In winter, the climate is colder and snow is the main form of precipitation. The CMORPH satellite has limited ability to retrieve solid precipitation data, which leads to low accuracy of satellite precipitation data in winter [55].
By comparing CMORPH satellite precipitation data with meteorological station data, it could be seen that there were some differences in the correlation and deviation between them. The differences reflected the limitations of the CMORPH satellite in retrieving precipitation. This was because CMORPH satellite infrared data observed the brightness temperature of the cloud top, while microwave observed the distribution of precipitation particles in the air, and neither of them was a direct observation of surface precipitation [56]. Also, the precision of satellite precipitation products is reduced due to the complex topography in the YRB, which covers a large area and spans three steps in China [57]. Additionally, the gridded precipitation data of satellite precipitation products represent the average value of a region, while the station observation data reflect the single point observation value. There are differences between the gridded precipitation data and single point observation data on the spatial scale, which is also one of the reasons for the low correlation. Because the precipitation of CMORPH data is retrieved from microwave data, the empty-reported data of microwave precipitation will be transmitted to CMORPH data, which may lead to the empty-reported phenomenon when using microwave data to determine precipitation [58]. Compared with the empty-reported data in CMORPH, the missing-reported data is very limited and has little change in time series, which indicates that CMORPH data effectively reflects actual precipitation [59]. In view of the CMORPH satellite’s low detection capability for solid precipitation in winter, it is necessary to improve the ability of the CMORPH satellite to detect weak and solid precipitation in future research [60].

5. Conclusions

This paper proposed a gridded drought index (GSPEI) to study the temporal evolution, spatial distribution and trend information of drought, in order to evaluate the drought monitoring effectiveness of CMORPH remote sensing precipitation products and reveal the gridded drought characteristics in the YRB during 1998–2016.
The 0.5-h CMORPH data was merged into monthly data. Through comparative analysis, the Ordinary Kriging was found to be the most suitable geo-spatial interpolation method, having the lowest RMSE (0.19), MRE (0.03), and highest CC value (0.98). Hence, the Ordinary Kriging interpolation method was selected to interpolate meteorological station data to the same spatial resolution as CMORPH data (8 km). Thus, the temporal and spatial resolutions of CMORPH and meteorological stations data were identical. In this way, we related the ground-based meteorological parameters to remote sensing-based data. By comparing CMORPH with corresponding meteorological station precipitation data, it was found that CMORPH precipitation data could accurately capture actual precipitation information in the YRB. CMORPH data met the accuracy requirements on the spatial and temporal scales, and could be used to monitor the gridded drought situation in the YRB. The positive correlations were high between the GSPEI and SPEI, and all the CCs passed the significance test of α = 0.05, which indicated that the GSPEI could better reflect the gridded drought characteristics of the YRB. Most of the maximum CCs between GSPEI and SPEI appeared in SH and BH in each month and season. In the whole basin scale, the seasonal and annual drought showed a decreasing trend in the YRB during 1998–2016. The linear tendency rates of spring, summer, autumn, winter, and annual GSPEI were 0.034/10a, 0.01/10a, 0.045/10a, 0.012/10a, and 0.215/10a, respectively. The average GSPEI values in spring, summer, autumn, and winter were −0.09, −1.46, 0.30, and 1.33, respectively. The most serious drought occurred in summer, followed by spring. The subzones with the most serious drought in spring, summer, autumn, and winter were HL (−0.68), AL (−1.49), AL (−0.42), and AL (0.95), respectively. The MMK trend test results indicated that the drought showed an upward trend in March, May, August, and October, while the drought showed a downward trend in the remaining months.
In summary, the drought index GSPEI was suitable for drought evaluation in the YRB. CMORPH satellite precipitation data had high spatial and temporal resolution and was suitable for drought monitoring and assessment in the YRB. Although the CMORPH satellite precipitation data worked well for drought monitoring in the YRB, there were still some deviations compared with actual meteorological station data. Future research work includes how to use the mathematical relationship between deviations and precipitation to establish the corresponding model, and incorporates underlying surface information in the microwave precipitation inversion model in order to improve the accuracy of CMORPH data. Therefore, based on the evaluation and analysis of CMORPH satellite precipitation data, effective measures should be taken to further improve the estimation accuracy and performance of satellite precipitation data and its scientific and applied values in the future, and so that it can be better applied to drought research.

Author Contributions

H.Y. and Z.W. formulated the problem and designed the experiments; F.W. analyzed the data and performed the experiments. Z.L. provided crucial guidance and support through the research. F.W., H.Y., and Z.W. contributed to the discussion and edited the manuscript. F.W. and Z.Z. contributed to the validation work and data interpretation.

Funding

This research was supported by National Key R&D Program of China (2018YFC0407405), Key Scientific Research Projects of Henan Colleges and Universities (Grant No. 19A170014), Henan Province Scientific and Technological Project (Grant No. 172102410075), the Open Research Fund of the State Key Laboratory of Simulation and Regulation of Water Cycle in River Basin at the China Institute of Water Resources and Hydropower Research (IWHR-SKL-201701), the National Natural Science Foundation of China (51779093), and Science and technology project of Guizhou Province Water Resources Department (KT201705). The work was also supported by the UK National Environment Research Council (NERC) through the Drier-China project (ref.: NE/P015484/1).

Acknowledgments

Thanks for the help provided by Enchong Li in data collection and language editing.

Conflicts of Interest

The authors declare no conflict of interest.

References

  1. Yao, J.Q.; Zhao, Y.; Chen, Y.N.; Yu, X.J.; Zhang, R.B. Multi–scale assessments of droughts: A case study in Xinjiang, China. Sci. Total Environ. 2018, 630, 444–452. [Google Scholar] [CrossRef] [PubMed]
  2. Ahmadalipour, A.; Moradkhani, H. Multi–dimensional assessment of drought vulnerability in Africa: 1960–2100. Sci. Total Environ. 2018, 644, 520–535. [Google Scholar] [CrossRef] [PubMed]
  3. Zhang, Q.; Yu, H.Q.; Sun, P.; Singh, V.P.; Shi, P.J. Multisource data based agricultural drought monitoring and agricultural loss in China. Glob. Planet. Chang. 2019, 172, 298–306. [Google Scholar] [CrossRef]
  4. Tang, G.Q.; Zeng, Z.Y.; Long, D.; Guo, X.L.; Yong, B.; Zhang, W.H.; Hong, Y. Statistical and hydrological comparisons between TRMM and GPM Level–3 products over a midlatitude basin: Is Day–1 IMERG a good successor for TMPA 3B42V7? J. Hydrometeorol. 2016, 17, 121–137. [Google Scholar] [CrossRef]
  5. Sun, Q.H.; Miao, C.Y.; Duan, Q.Y.; Ashouri, H.; Sorooshian, S.; Hsu, K.L. A review of global precipitation datasets: Data sources, estimation, and intercomparisons. Rev. Geophys. 2018, 56, 79–107. [Google Scholar] [CrossRef]
  6. Tao, H.; Fischer, T.; Zeng, Y.; Fraedrich, K. Evaluation of TRMM 3B43 precipitation data for drought monitoring in Jiangsu Province, China. Water 2016, 8, 221. [Google Scholar] [CrossRef]
  7. Wu, J.W.; Miao, C.Y.; Zheng, H.Y.; Duan, Q.Y.; Lei, X.H.; Li, H. Meteorological and hydrological drought on the Loess Plateau, China: Evolutionary characteristics, impact, and propagation. J. Geophys. Res–Atmos. 2018, 123, 11569–11584. [Google Scholar] [CrossRef]
  8. Duan, Z.; Liu, J.Z.; Tuo, Y.; Chiogna, G.; Disse, M. Evaluation of eight high spatial resolution gridded precipitation products in Adige Basin (Italy) at multiple temporal and spatial scales. Sci. Total Environ. 2016, 573, 1536–1553. [Google Scholar] [CrossRef] [PubMed] [Green Version]
  9. Zhong, R.D.; Chen, X.H.; Lai, C.G.; Wang, Z.L.; Lian, Y.Q.; Yu, H.J.; Wu, X.Q. Drought monitoring utility of satellite–based precipitation products across mainland China. J. Hydrol. 2019, 568, 343–359. [Google Scholar] [CrossRef]
  10. Joyce, R.J.; Janowiak, J.E.; Arkin, P.A.; Xie, P.P. CMORPH: A method that produces global precipitation estimates from passive microwave and infrared data at high spatial and temporal resolution. J. Hydrometeorol. 2004, 5, 487–503. [Google Scholar] [CrossRef]
  11. Chen, S.; Li, W.B.; Du, Y.D.; Mao, C.Y.; Zhang, L. Urbanization effect on precipitation over the Pearl River Delta based on CMORPH data. Adv. Clim. Chang. Res. 2015, 6, 16–22. [Google Scholar] [CrossRef]
  12. Lai, C.G.; Zhong, R.D.; Wang, Z.L.; Wu, X.Q.; Chen, X.H.; Wang, P.; Lian, Y.Q. Monitoring hydrological drought using long–term satellite–based precipitation data. Sci. Total Environ. 2019, 649, 1198–1208. [Google Scholar] [CrossRef] [PubMed]
  13. Zeweldi, D.A.; Gebremichael, M. Evaluation of CMORPH precipitation products at fine space–time scales. J. Hydrometeorol. 2009, 10, 300–307. [Google Scholar] [CrossRef]
  14. Xu, S.G.; Niu, Z.; Shen, Y.; Kuang, D. A research into the characters of CMORPH remote sensing precipitation error in China. Remote Sens. Technol. Appl. 2014, 29, 189–194. (In Chinese) [Google Scholar]
  15. Wang, Y.D.; Chen, H.; Liu, C.R.; Ding, Y.J. Applicability of ITPCAS and CMORPH precipitation datasets over Shaanxi Province. Arid Zone Res. 2018, 35, 579–588. [Google Scholar]
  16. Jiang, S.H.; Zhou, M.; Ren, L.L.; Cheng, X.R.; Zhang, P.J. Evaluation of latest TMPA and CMORPH satellite precipitation products over Yellow River Basin. Water Sci. Eng. 2016, 9, 87–96. [Google Scholar] [CrossRef] [Green Version]
  17. Lu, J.; Jia, L.; Menenti, M.; Yan, Y.P.; Zheng, C.L.; Zhou, J. Performance of the Standardized Precipitation Index based on the TMPA and CMORPH precipitation products for drought monitoring in China. IEEE J.–STARS. 2018, 11, 1387–1396. [Google Scholar] [CrossRef]
  18. Rajsekhar, D.; Singh, V.P.; Mishra, A.K. Multivariate drought index: An information theory based approach for integrated drought assessment. J. Hydrol. 2015, 526, 164–182. [Google Scholar] [CrossRef]
  19. Tan, C.P.; Yang, J.P.; Li, M. Temporal–spatial variation of drought indicated by SPI and SPEI in Ningxia Hui Autonomous Region, China. Atmosphere 2015, 6, 1399–1421. [Google Scholar] [CrossRef]
  20. Vicente-Serrano, S.M.; Beguería, S.; López-Moreno, J.I. A multiscalar drought index sensitive to global warming: The Standardized Precipitation Evapotranspiration Index. J. Clim. 2010, 23, 1696–1718. [Google Scholar] [CrossRef]
  21. Alam, N.M.; Sharma, G.C.; Moreira, E.; Jana, C.; Mishra, P.K.; Sharma, N.K.; Mandal, D. Evaluation of drought using SPEI drought class transitions and log–linear models for different agro–ecological regions of India. Phys. Chem. Earth 2017, 100, 31–43. [Google Scholar] [CrossRef]
  22. Zhang, Y.J.; Yu, Z.S.; Niu, H.S. Standardized Precipitation Evapotranspiration Index is highly correlated with total water storage over China under future climate scenarios. Atmos. Environ. 2018, 194, 123–133. [Google Scholar] [CrossRef]
  23. Tirivarombo, S.; Osupile, D.; Eliasson, P. Drought monitoring and analysis: Standardised Precipitation Evapotranspiration Index (SPEI) and Standardised Precipitation Index (SPI). Phys. Chem. Earth 2018, 106, 1–10. [Google Scholar] [CrossRef]
  24. Gao, X.R.; Zhao, Q.; Zhao, X.N.; Wu, P.T.; Pan, W.X.; Gao, X.D.; Sun, M. Temporal and spatial evolution of the standardized precipitation evapotranspiration index (SPEI) in the Loess Plateau under climate change from 2001 to 2050. Sci. Total Environ. 2017, 595, 191–200. [Google Scholar] [CrossRef] [PubMed]
  25. Zhao, H.Y.; Gao, G.; An, W.; Zou, X.K.; Li, H.T.; Hou, M.T. Timescale differences between SC–PDSI and SPEI for drought monitoring in China. Phys. Chem. Earth. 2015, 10, 1–11. [Google Scholar] [CrossRef]
  26. Wu, D.; Yan, D.H.; Yang, G.Y.; Wang, X.G.; Xiao, W.H.; Zhang, H.T. Assessment on agricultural drought vulnerability in the Yellow River basin based on a fuzzy clustering iterative model. Nat. Hazards 2013, 67, 919–936. [Google Scholar] [CrossRef]
  27. Liang, K.; Liu, S.; Bai, P.; Nie, R. The Yellow River basin becomes wetter or drier? The case as indicated by mean precipitation and extremes during 1961–2012. Theor. Appl. Climatol. 2015, 119, 701–722. [Google Scholar] [CrossRef]
  28. Huang, S.Z.; Chang, J.X.; Leng, G.Y.; Huang, Q. Integrated index for drought assessment based on variable fuzzy set theory: A case study in the Yellow River basin, China. J. Hydrol. 2015, 527, 608–618. [Google Scholar] [CrossRef] [Green Version]
  29. She, D.X.; Xia, J. The spatial and temporal analysis of dry spells in the Yellow River basin, China. Stoch. Environ. Res. Risk Assess. 2013, 27, 29–42. [Google Scholar] [CrossRef]
  30. Shen, Y.; Xiong, A.Y.; Wang, Y.; Xie, P.P. Performance of high–resolution satellite precipitation products over China. J. Geophys. Res. 2010, 115, D02114. [Google Scholar] [CrossRef]
  31. Buarque, D.C.; Paiva, R.C.D.; Clarke, R.T.; Mendes, C.A.B. A comparison of Amazon rainfall characteristics derived from TRMM, CMORPH, and the Brazilian national rain gauge network. J. Geophys. Res. Atmos. 2011, 116, D19105. [Google Scholar] [CrossRef]
  32. Zhang, B.Q.; He, C.S.; Morey, B.; Zhang, L.H. Evaluating the coupling effects of climate aridity and vegetation restoration on soil erosion over the Loess Plateau in China. Sci. Total Environ. 2016, 539, 436–449. [Google Scholar] [CrossRef] [PubMed]
  33. Wu, L.; Liu, X.; Ma, X.Y. Spatio–temporal evolutions of precipitation in the Yellow River basin of China from 1981 to 2013. Water Sci. Tech.–Water Supply 2016, 16, 1441–1450. [Google Scholar] [CrossRef]
  34. Li, X.; He, B.B.; Quan, X.W.; Liao, Z.M.; Bai, X.J. Use of the Standardized Precipitation Evapotranspiration Index (SPEI) to characterize the drying trend in Southwest China from 1982–2012. Remote Sens. 2015, 7, 10917–10937. [Google Scholar] [CrossRef]
  35. Wang, F.; Wang, Z.M.; Yang, H.B.; Zhao, Y. Study of the temporal and spatial patterns of drought in the Yellow River basin based on SPEI. Sci. China Earth Sci. 2018, 61, 1098–1111. [Google Scholar] [CrossRef]
  36. Wang, Q.F.; Shi, P.J.; Lei, T.J.; Geng, G.P.; Liu, J.H.; Mo, X.Y.; Li, X.H.; Zhou, H.K.; Wu, J.J. The alleviating trend of drought in the Huang–Huai–Hai Plain of China based on the daily SPEI. Int. J. Climatol. 2015, 35, 3760–3769. [Google Scholar] [CrossRef]
  37. Jiang, S.H.; Ren, L.L.; Yong, B.; Yang, X.L.; Shi, L. Evaluation of high–resolution satellite precipitation products with surface rain gauge observations from Laohahe Basin in northern China. Water Sci. Eng. 2010, 3, 405–417. [Google Scholar]
  38. Zhang, Y.Y.; Li, Y.G.; Ji, X.; Luo, X.; Li, X. Evaluation and hydrologic validation of three satellite–based precipitation products in the upper catchment of the Red River Basin, China. Remote Sens. 2018, 10, 1881. [Google Scholar] [CrossRef]
  39. Wang, J.L.; Li, Z.J. The ESMD method for climate data analysis. Clim. Chang. Res. Lett. 2014, 3, 1–5. [Google Scholar] [CrossRef]
  40. Li, H.F.; Wang, J.L.; Li, Z.J. Application of ESMD method to air–sea flux investigation. Int. J. Geosci. 2013, 4, 8–11. [Google Scholar] [CrossRef]
  41. Huang, S.Z.; Chang, J.X.; Huang, Q.; Chen, Y.T. Spatio–temporal changes and frequency analysis of drought in the Wei River basin, China. Water Resour. Manag. 2014, 28, 3095–3110. [Google Scholar] [CrossRef]
  42. Huang, S.Z.; Huang, Q.; Zhang, H.B.; Chen, Y.T.; Leng, G.Y. Spatio–temporal changes in precipitation, temperature and their possibly changing relationship: A case study in the Wei River Basin, China. Int. J. Climatol. 2016, 36, 1160–1169. [Google Scholar] [CrossRef]
  43. Tabari, H.; Talaee, P.H.; Nadoushani, S.S.M.; Willems, P.; Marchetto, A. A survey of temperature and precipitation based aridity indices in Iran. Quat. Int. 2014, 345, 158–166. [Google Scholar] [CrossRef]
  44. Oertel, M.; Meza, F.J.; Gironás, J.; Scott, C.A.; Rojas, F.; Pineda–Pablos, N. Drought propagation in semi–arid river basins in Latin America: Lessons from Mexico to the Southern Cone. Water 2018, 10, 1564. [Google Scholar] [CrossRef]
  45. Li, B.Q.; Zhou, W.; Zhao, Y.Y.; Ju, Q.; Yu, Z.B.; Liang, Z.M.; Acharya, K. Using the SPEI to assess recent climate change in the Yarlung Zangbo River Basin, South Tibet. Water 2015, 7, 5474–5486. [Google Scholar] [CrossRef]
  46. Zhao, Q.; Chen, Q.Y.; Jiao, M.Y.; Wu, P.T.; Gao, X.R.; Ma, M.H.; Hong, Y. The temporal–spatial characteristics of drought in the Loess Plateau using the remote–sensed TRMM precipitation data from 1998 to 2014. Remote Sens. 2018, 10, 838. [Google Scholar] [CrossRef]
  47. Wang, F.; Wang, Z.M.; Yang, H.B.; Zhao, Y.; Li, Z.H.; Wu, J.P. Capability of remotely sensed drought indices for representing the spatio–temporal variations of the meteorological droughts in the Yellow River Basin. Remote Sens. 2018, 10, 1834. [Google Scholar] [CrossRef]
  48. Jiang, W.G.; Yuan, L.H.; Wang, W.J.; Cao, R.; Zhang, Y.F.; Shen, W.M. Spatio–temporal analysis of vegetation variation in the Yellow River Basin. Ecol. Indic. 2015, 51, 117–126. [Google Scholar] [CrossRef]
  49. Huang, S.Z.; Huang, Q.; Chang, J.X.; Zhu, Y.L.; Leng, G.Y.; Xing, L. Drought structure based on a nonparametric multivariate standardized drought index across the Yellow River basin, China. J. Hydrol. 2015, 530, 127–136. [Google Scholar] [CrossRef]
  50. Liu, Q.; Yan, C.R.; He, W.Q. Drought variation and its sensitivity coefficients to climatic factors in the Yellow River Basin. Chin. J. Agrometeorol. 2016, 37, 623–632. (In Chinese) [Google Scholar]
  51. Sun, R.C.; Yuan, H.L.; Liu, X.L.; Jiang, X.M. Evaluation of the latest satellite–gauge precipitation products and their hydrologic applications over the Huaihe River basin. J. Hydrol. 2016, 536, 302–319. [Google Scholar] [CrossRef]
  52. Haile, A.T.; Yan, F.; Habib, E. Accuracy of the CMORPH satellite–rainfall product over Lake Tana Basin in Eastern Africa. Atmos. Res. 2015, 163, 177–187. [Google Scholar] [CrossRef]
  53. Zhang, C.; Chen, X.; Shao, H.; Chen, S.Y.; Liu, T.; Chen, C.B.; Ding, Q.; Du, H.Y. Evaluation and intercomparison of high–resolution satellite precipitation estimates–GPM, TRMM, and CMORPH in the Tianshan Mountain Area. Remote Sens. 2018, 10, 1543. [Google Scholar] [CrossRef]
  54. Liao, R.W.; Zhang, D.B.; Shen, Y. Validation of six satellite–derived rainfall estimates over China. Meteorol. Mon. 2015, 41, 970–979. (In Chinese) [Google Scholar]
  55. Jiang, S.H.; Liu, S.Y.; Ren, L.L.; Yong, B.; Zhang, L.Q.; Wang, M.H.; Lu, Y.J.; He, Y.Q. Hydrologic evaluation of six high resolution satellite precipitation products in capturing extreme precipitation and streamflow over a medium–sized basin in China. Water 2018, 10, 25. [Google Scholar] [CrossRef]
  56. Cheng, L.; Shen, R.P.; Shi, C.X.; Bai, L.; Yang, Y.H. Evaluation and verification of CMORPH and TRMM 3B42 precipitation estimation products. Meteorol. Mon. 2014, 40, 1372–1379. (In Chinese) [Google Scholar]
  57. Li, Q.L.; Zhang, W.C.; Yi, L.; Liu, J.P.; Chen, H. Accuracy evaluation and comparison of GPM and TRMM precipitation product over Mainland China. Adv. Water Sci. 2018, 29, 303–313. [Google Scholar]
  58. Michaelides, S.; Levizzani, V.; Anagnostou, E.; Bauer, P.; Kasparis, T.; Lane, J.E. Precipitation: Measurement, remote sensing, climatology and modeling. Atmos. Res. 2009, 94, 512–533. [Google Scholar] [CrossRef]
  59. Yang, Y.F.; Luo, Y. Evaluating the performance of remote sensing precipitation products CMORPH, PERSIANN, and TMPA, in the arid region of northwest China. Theor. Appl. Climatol. 2014, 118, 429–445. [Google Scholar] [CrossRef]
  60. Zeng, Q.L.; Wang, Y.Q.; Chen, L.F.; Wang, Z.F.; Zhu, H.; Li, B. Inter–comparison and evaluation of remote sensing precipitation products over China from 2005 to 2013. Remote Sens. 2018, 10, 168. [Google Scholar] [CrossRef]
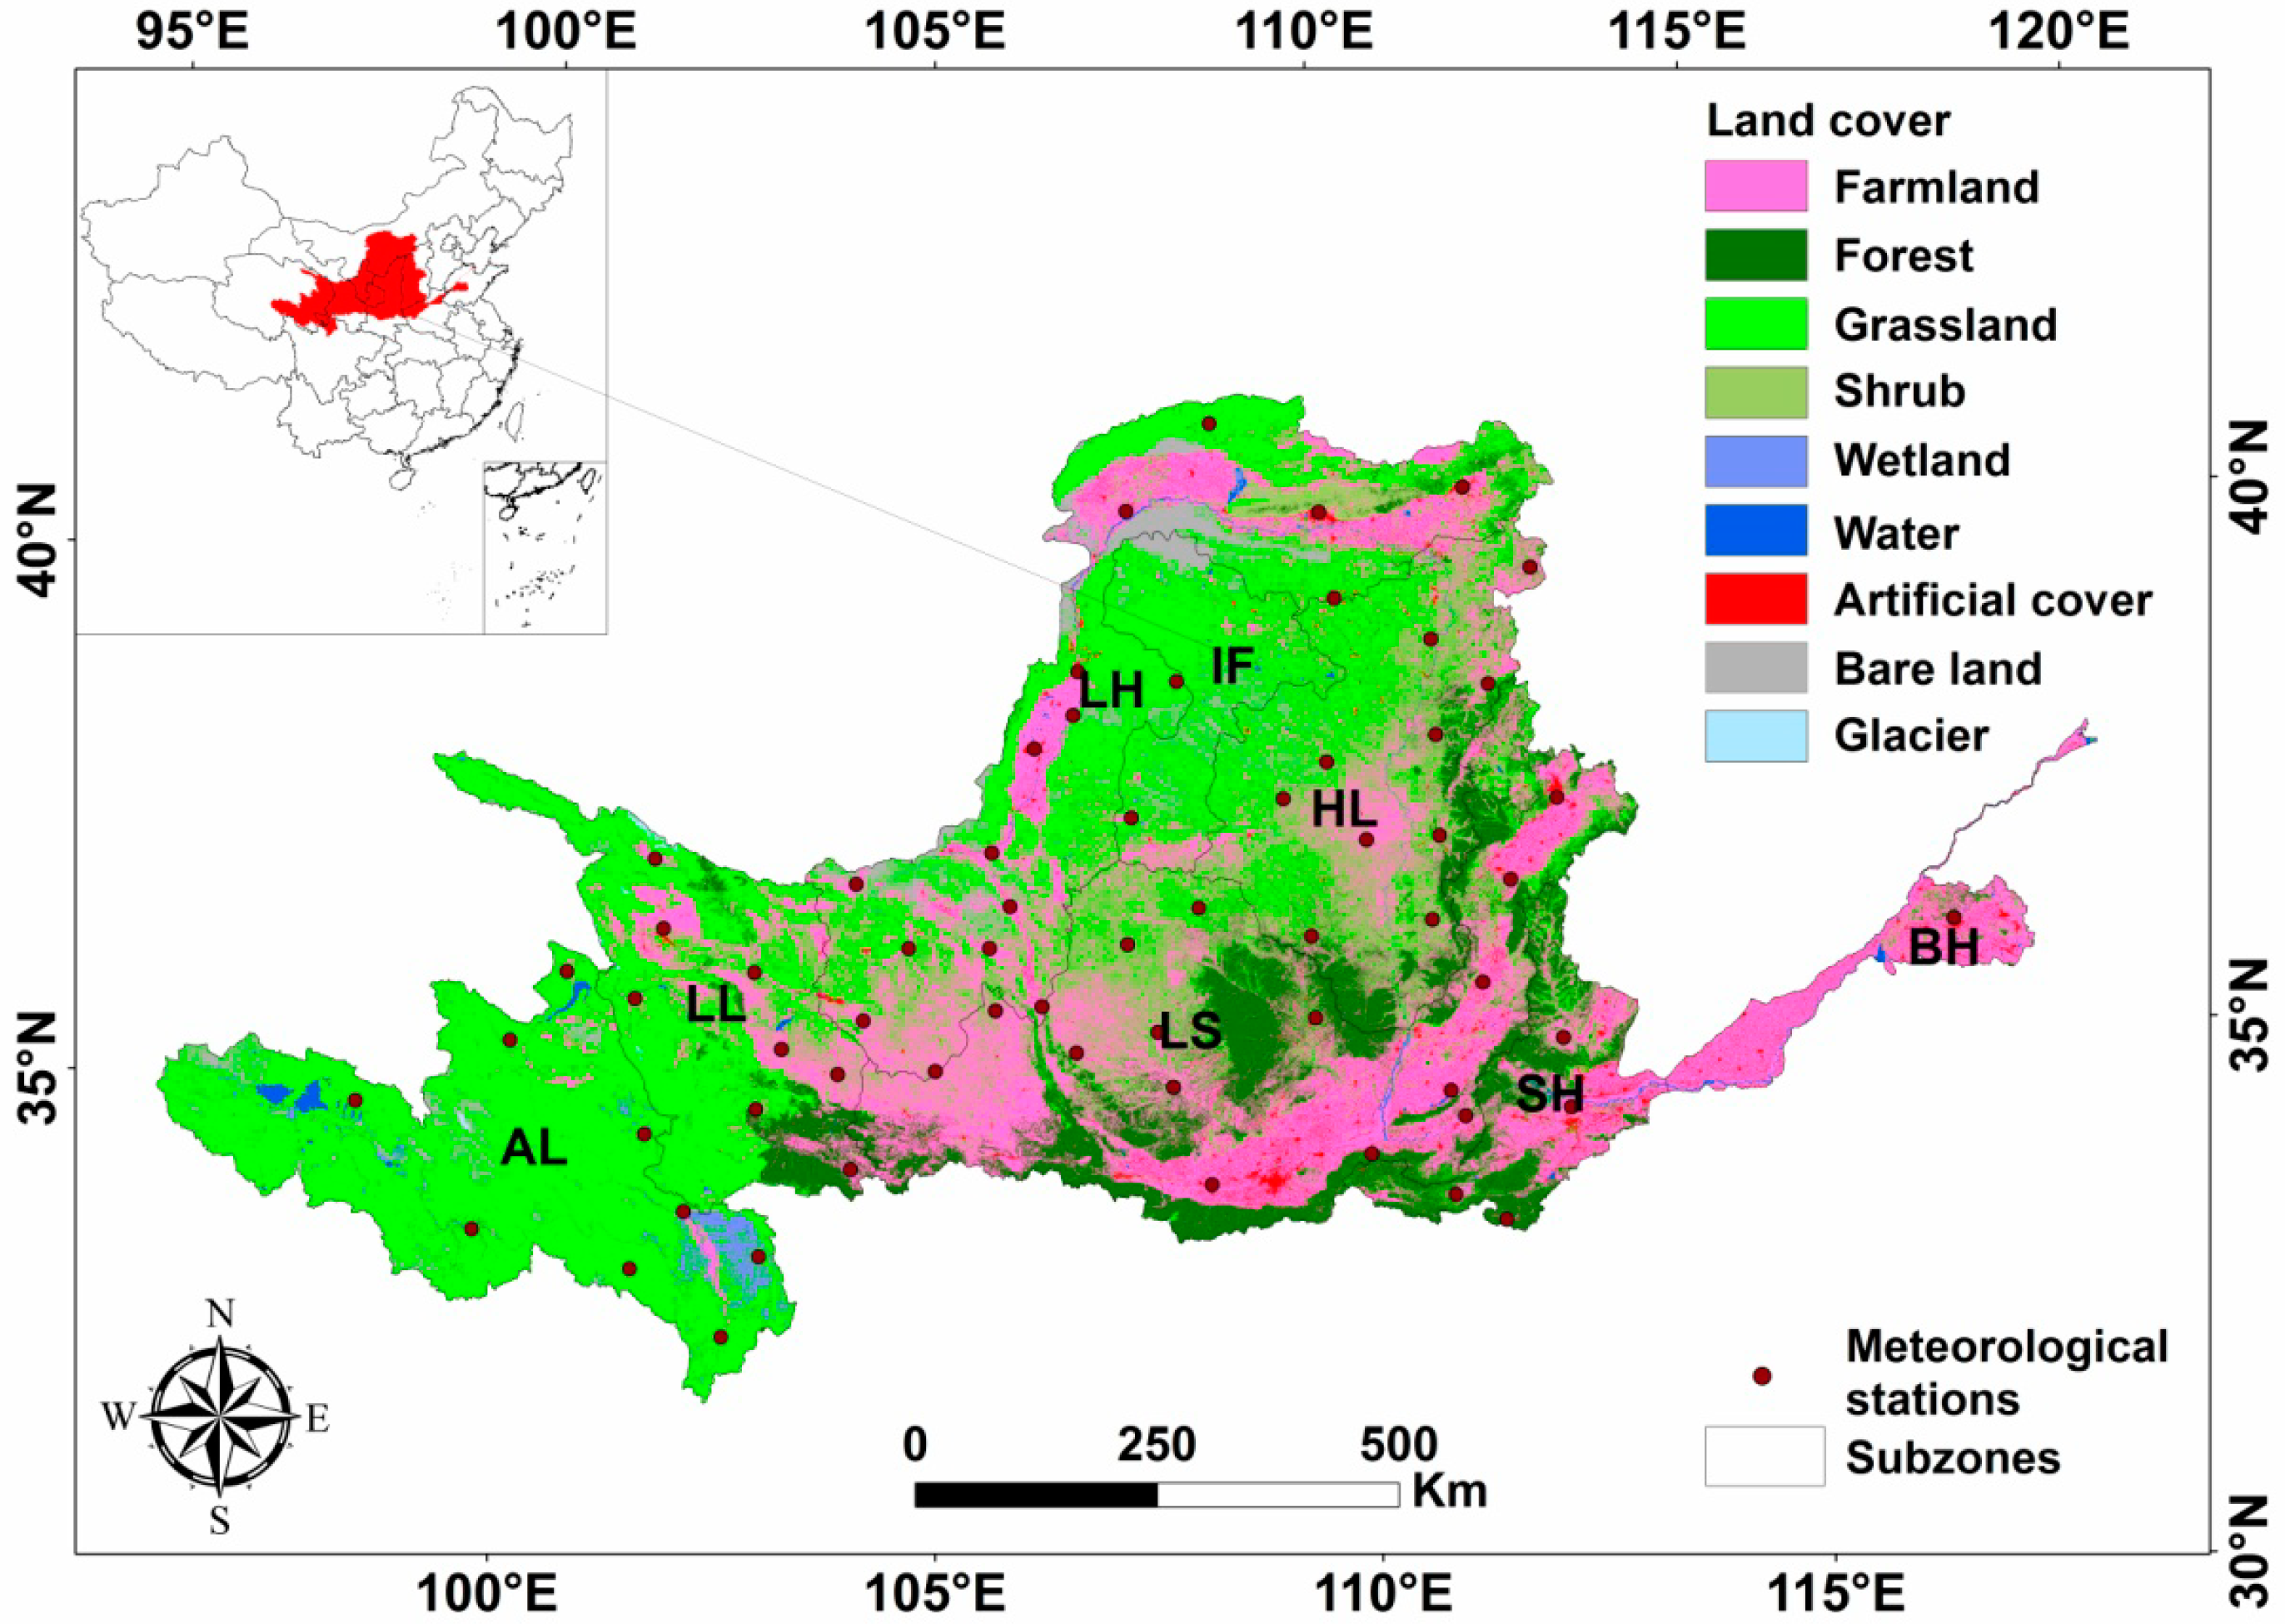
Figure 1. Location map of the Yellow River basin (YRB) with meteorological stations and land cover.
Remotesensing 11 00485 g001
Figure 2. Quantile–Quantile (Q–Q) plots for the monthly Climate Prediction Center morphing technique (CMORPH) versus rain gauge precipitation in the Yellow River basin (YRB). (al) denote January, February, March, April, May, June, July, August, September, October, November, and December, respectively.
Remotesensing 11 00485 g002
Figure 3. Spatial distribution of six evaluation indicators. (af) denote correlation coefficient (CC), mean absolute error (MAE), root mean square error (RMSE), Nash–Sutcliffe efficiency (NSE), probability of detection (POD), and false alarm ratio (FAR), respectively.
Remotesensing 11 00485 g003
Figure 4. Distribution of correlation coefficient (CC) between Gridded Standardized Precipitation Evapotranspiration Index (GSPEI) and Standardized Precipitation Evapotranspiration Index (SPEI).
Remotesensing 11 00485 g004
Figure 5. Correlation coefficient (CC) between Gridded Standardized Precipitation Evapotranspiration Index (GSPEI) and Standardized Precipitation Evapotranspiration Index (SPEI).
Remotesensing 11 00485 g005
Figure 6. Temporal characteristics of drought in the Yellow River basin (YRB) during 1998–2016. The eight subzones are: AL (a1a5), LL (b1b5), LH (c1c5), IF (d1d5), HL (e1e5), LS (f1f5), SH (g1g5), and BH (h1h5), respectively.
Remotesensing 11 00485 g006
Figure 7. Spatial distribution of drought in the Yellow River basin (YRB). (ap) denote January, February, March, April, May, June, July, August, September, October, November, December, Spring, Summer, Autumn, and Winter, respectively (similar below).
Remotesensing 11 00485 g007
Figure 8. Monthly and seasonal trends of Gridded Standardized Precipitation Evapotranspiration Index (GSPEI) in the Yellow River basin (YRB) during 1998–2016 by using the Modified Mann–Kendall (MMK) trend test method.
Remotesensing 11 00485 g008
Figure 9. Zs values of monthly and seasonal Gridded Standardized Precipitation Evapotranspiration Index (GSPEI) in the Yellow River basin (YRB) during 1998–2016.
Remotesensing 11 00485 g009
Table 1. Comparison of different geo-spatial interpolation methods.
Interpolation MethodsRMSEMRECC
Kriging InterpolationOrdinary Kriging0.190.030.98
Universal Kriging1.351.870.82
Inverse Distance WeightingIDW0.770.910.91
Polynomial InterpolationGlobal PI1.752.600.75
Local PI1.051.110.89
Radial Basis FunctionCompletely Regularized Spline0.220.050.94
Spline with Tension0.250.070.92
Thin Plate Spline0.220.050.94
Table 2. Classification of the Gridded Standardized Precipitation Evapotranspiration Index (GSPEI).
GradeClassificationGSPEI
INo drought−0.5 < GSPEI
IIMild drought−1.0 < GSPEI ≤ −0.5
IIIModerate drought−1.5 < GSPEI ≤ −1.0
IVSevere drought−2.0 < GSPEI ≤ −1.5
VExtreme droughtGSPEI ≤ −2.0
Table 3. Descriptions of evaluation indicators. Notation: n, number of samples; Si, satellite precipitation data; Gi, rain gauge observations; S ¯ , mean values of satellite precipitation data; G ¯ , mean values of rain gauge observations; N11, satellite data is >0 and rain gauge data is >0; N10, satellite data is >0 and rain gauge data equals 0; N01, satellite data equals 0 and rain gauge data is >0.
Evaluation IndicatorsUnitFormulaRangePerfect ValueReference
CCNA C C = i = 1 n ( G i G ¯ ) ( S i S ¯ ) i = 1 n ( G i G ¯ ) 2 i = 1 n ( S i S ¯ ) 2 [−1,1]1[37]
MAEmm M A E = 1 n i = 1 n | ( S i G i ) | [0,+∞)0[37]
RMSEmm R M S E = 1 n i = 1 n ( S i G i ) 2 [0,+∞)0[38]
NSENA N S E = 1 i = 1 n ( S i G i ) 2 i = 1 n ( G i G ¯ ) 2 (−∞,1]1[38]
PODNA P O D = N 11 N 11 + N 01 [0,1]1[38]
FARNA F A R = N 10 N 11 + N 10 [0,1]0[38]