Wildfire Probability Mapping: Bivariate vs. Multivariate Statistics
Abstract
:1. Introduction
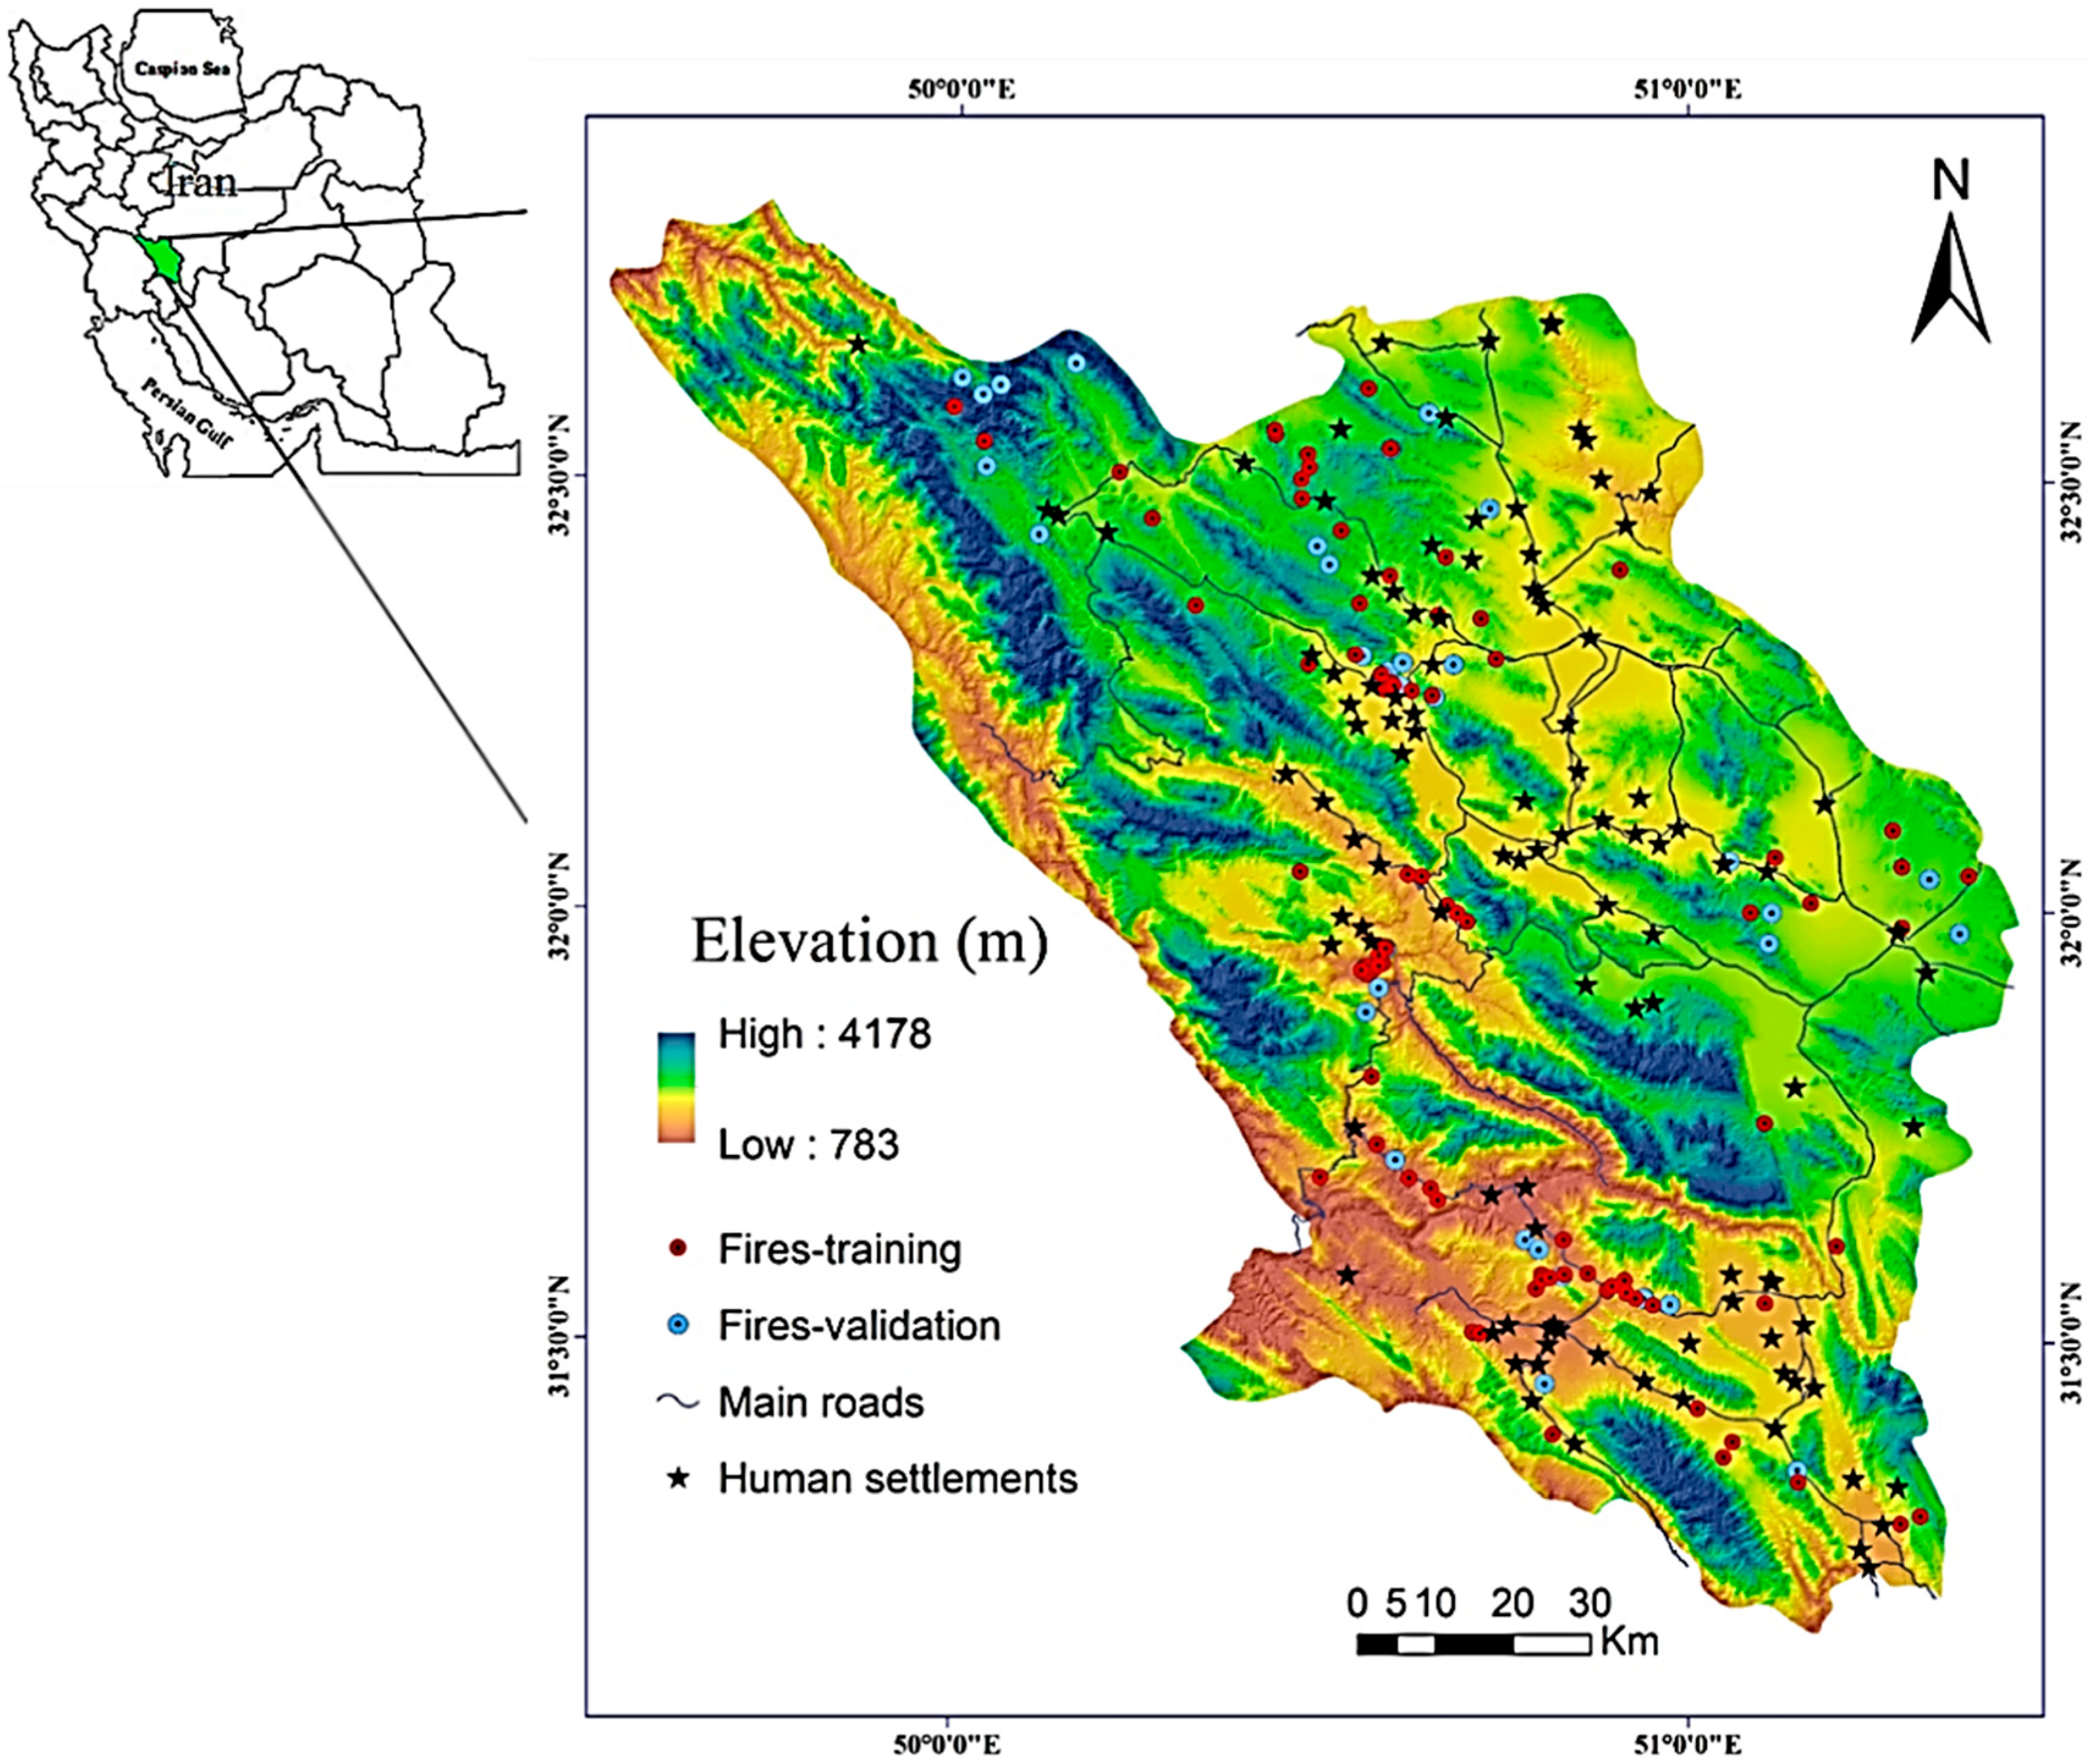
2. Study Area
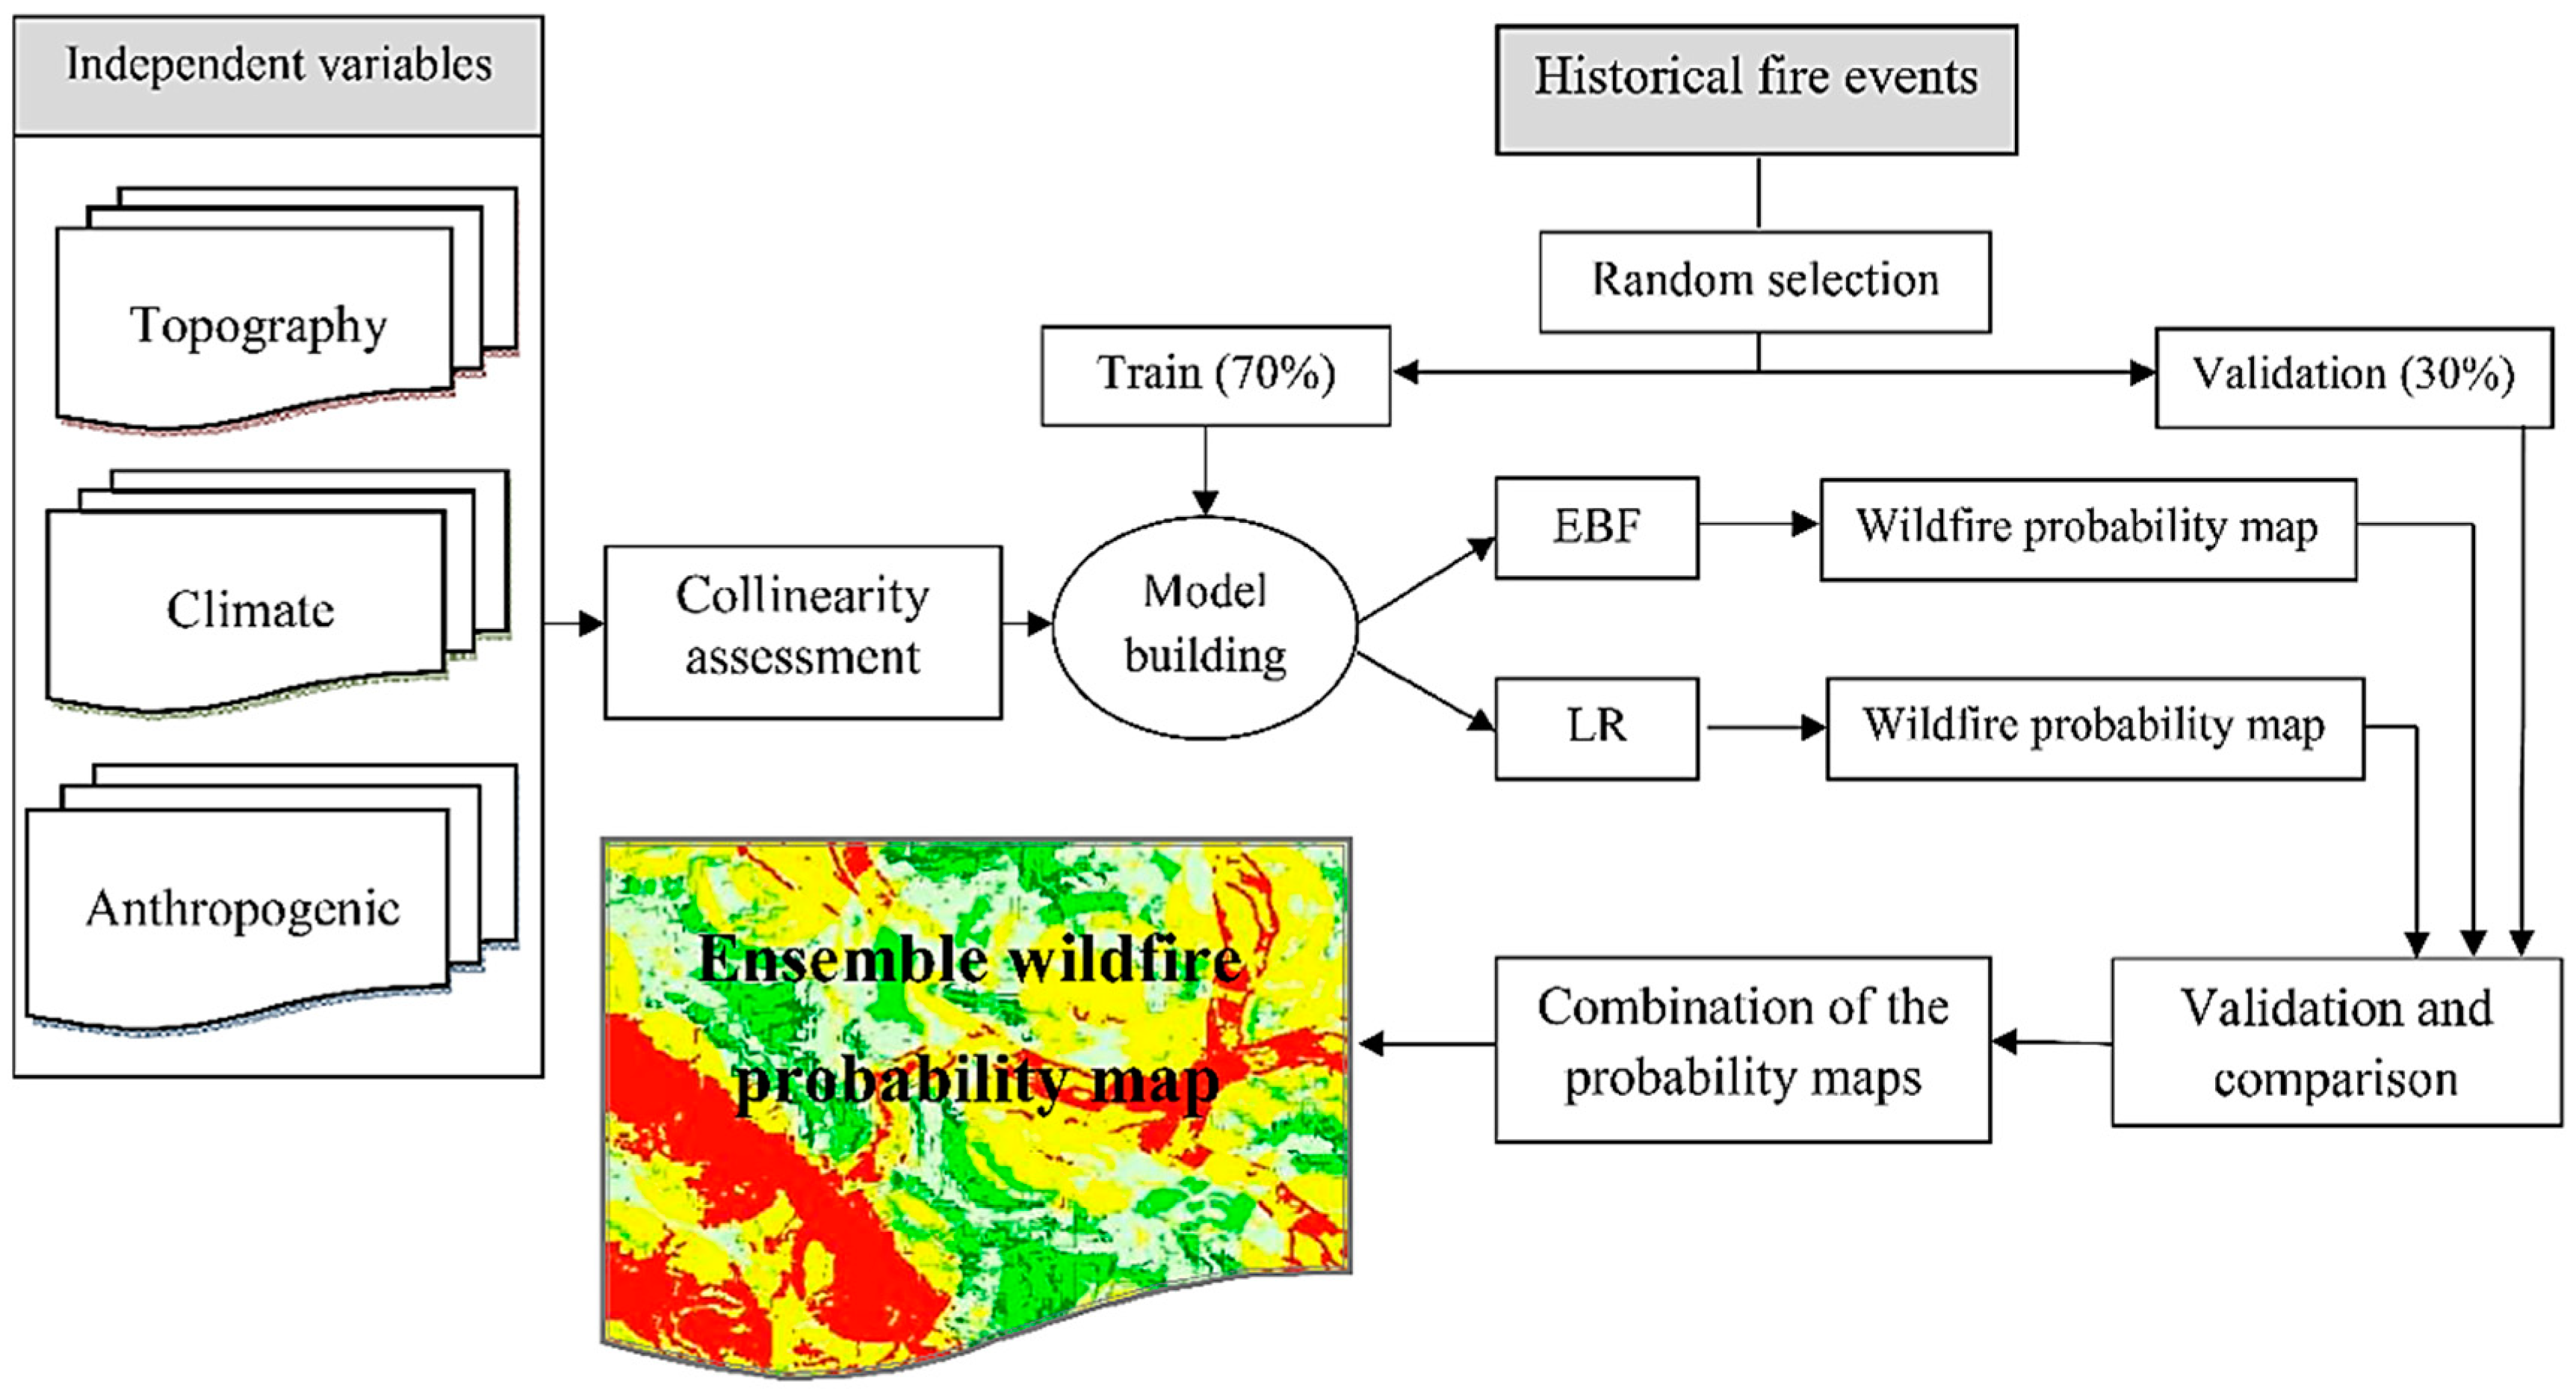
3. Methodology
3.1. Wildfire Inventory
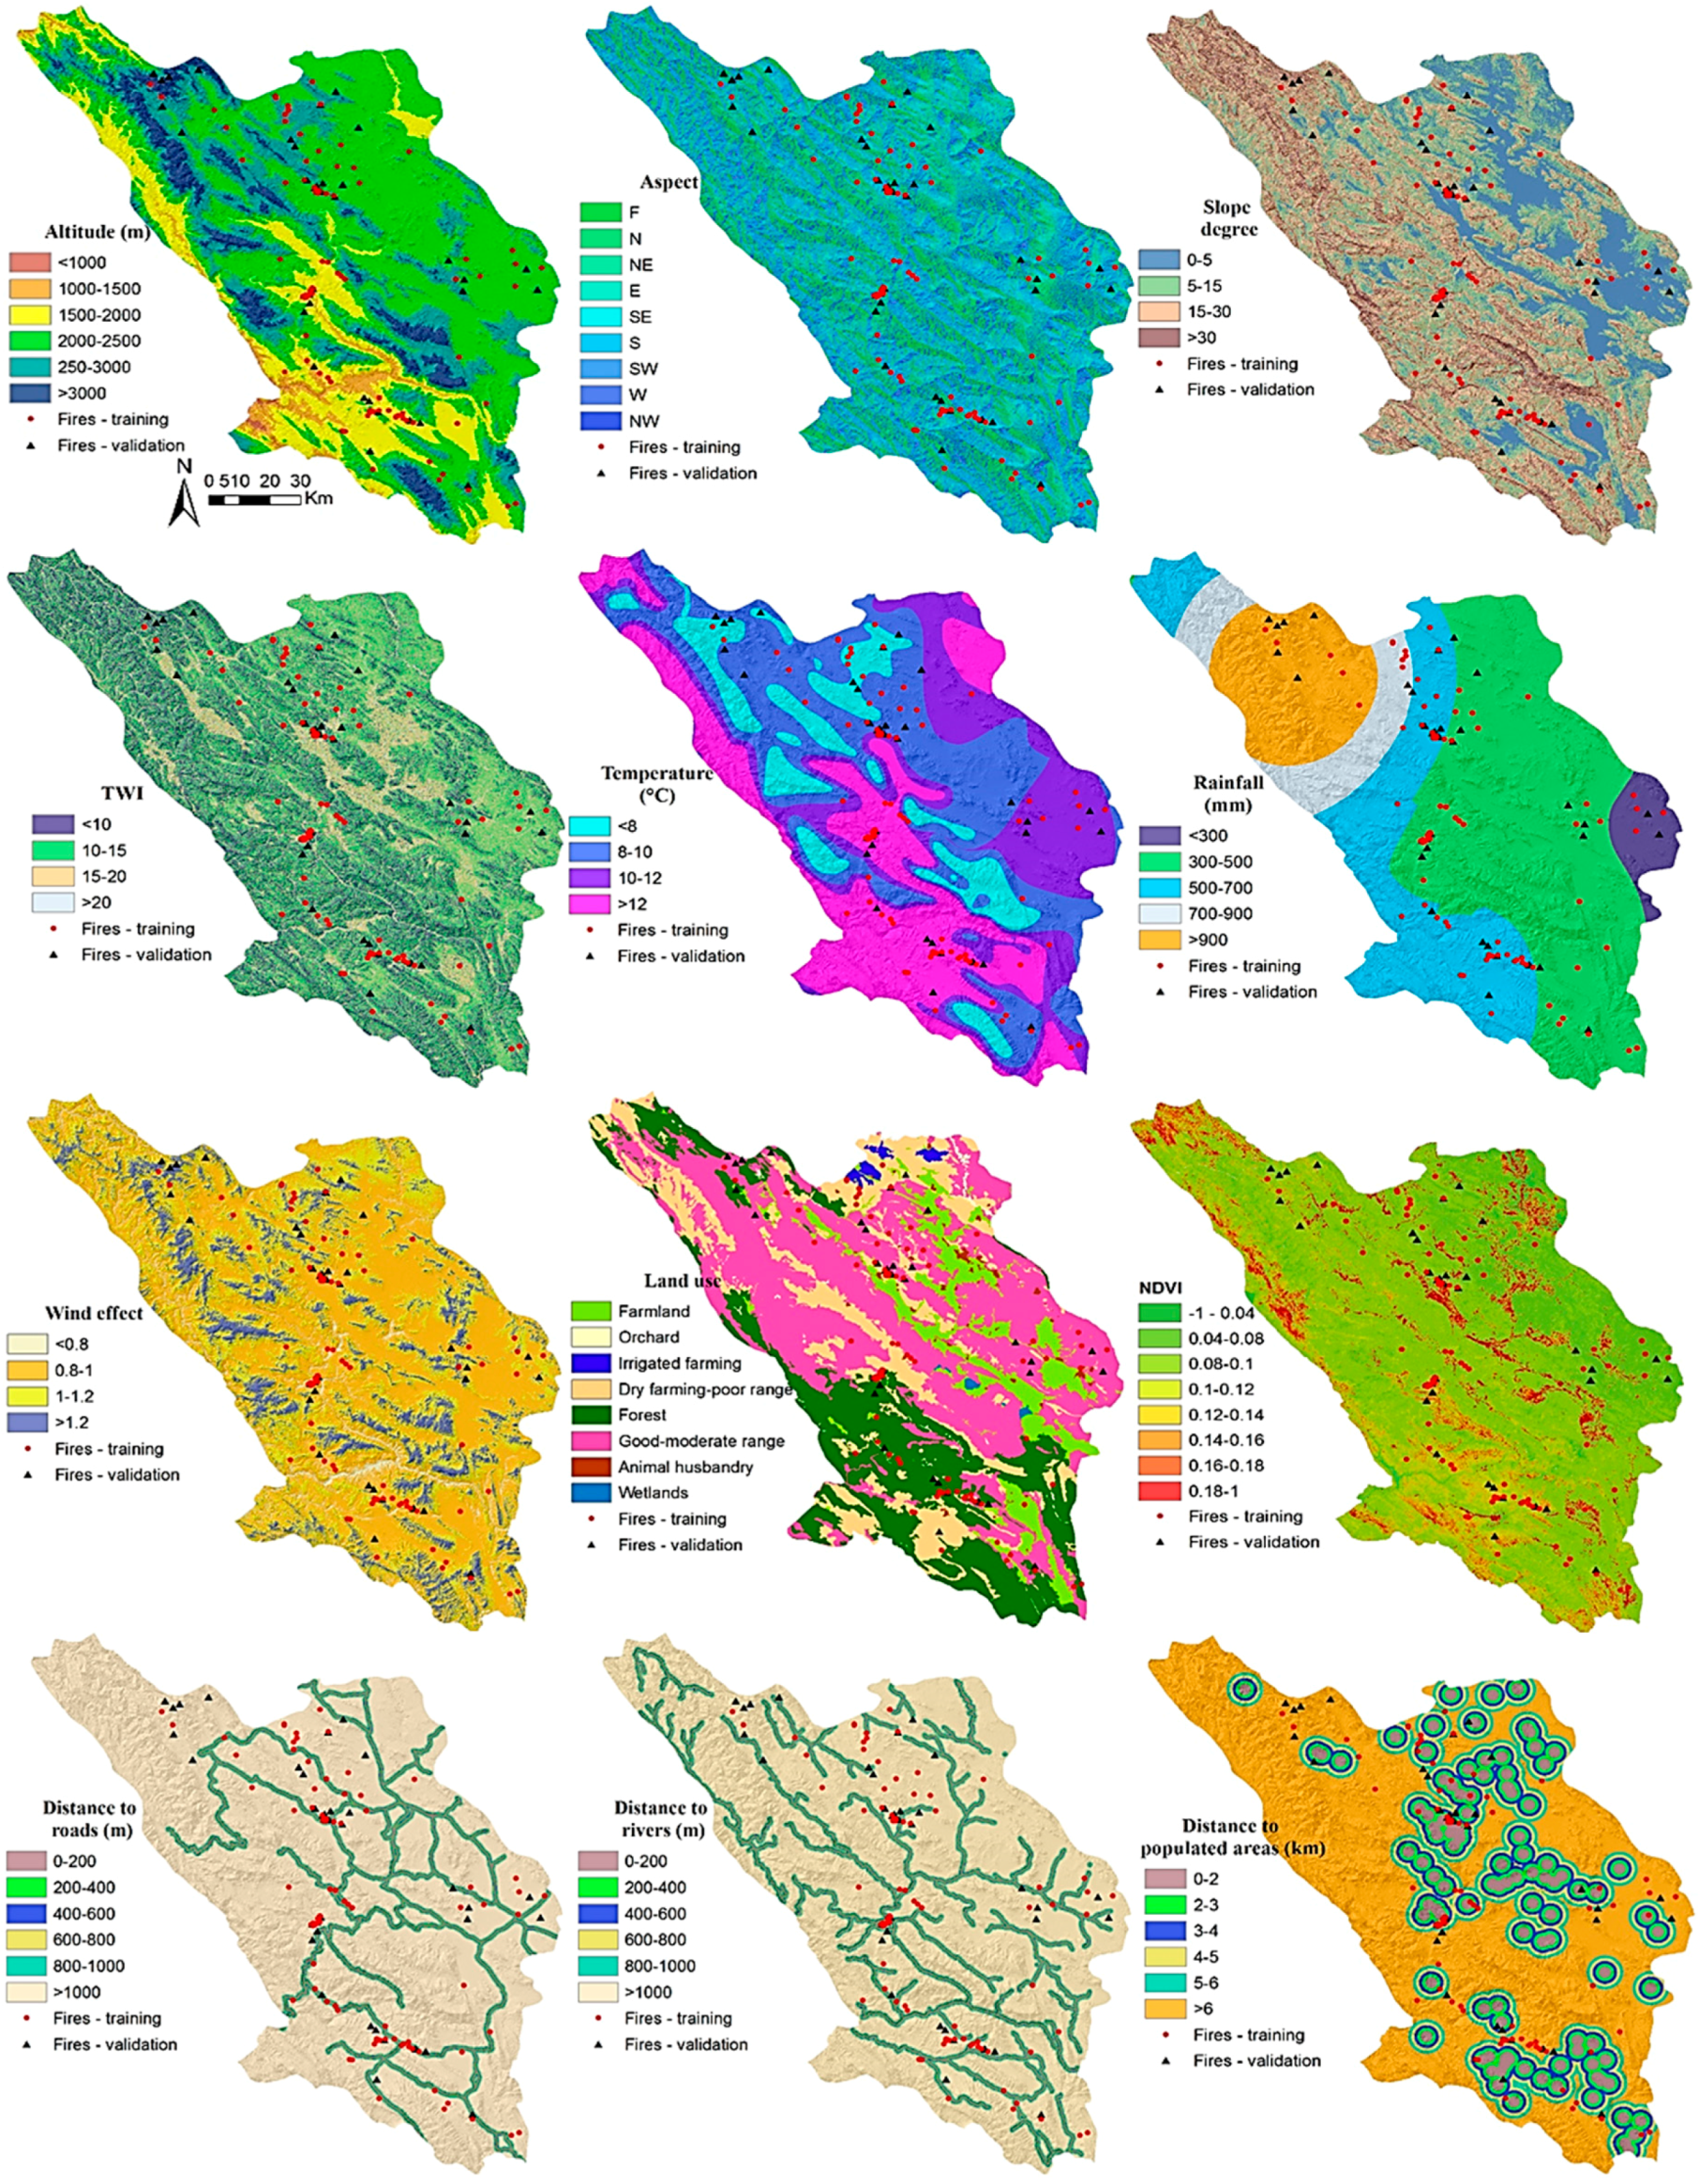
3.2. Independent Variables
3.3. Multicollinearity Assessment
3.4. Evidential Belief Function (EBF)
3.5. Logistic Regression
3.6. Ensemble Modeling
3.7. Validation and Comparison
4. Results and Discussion
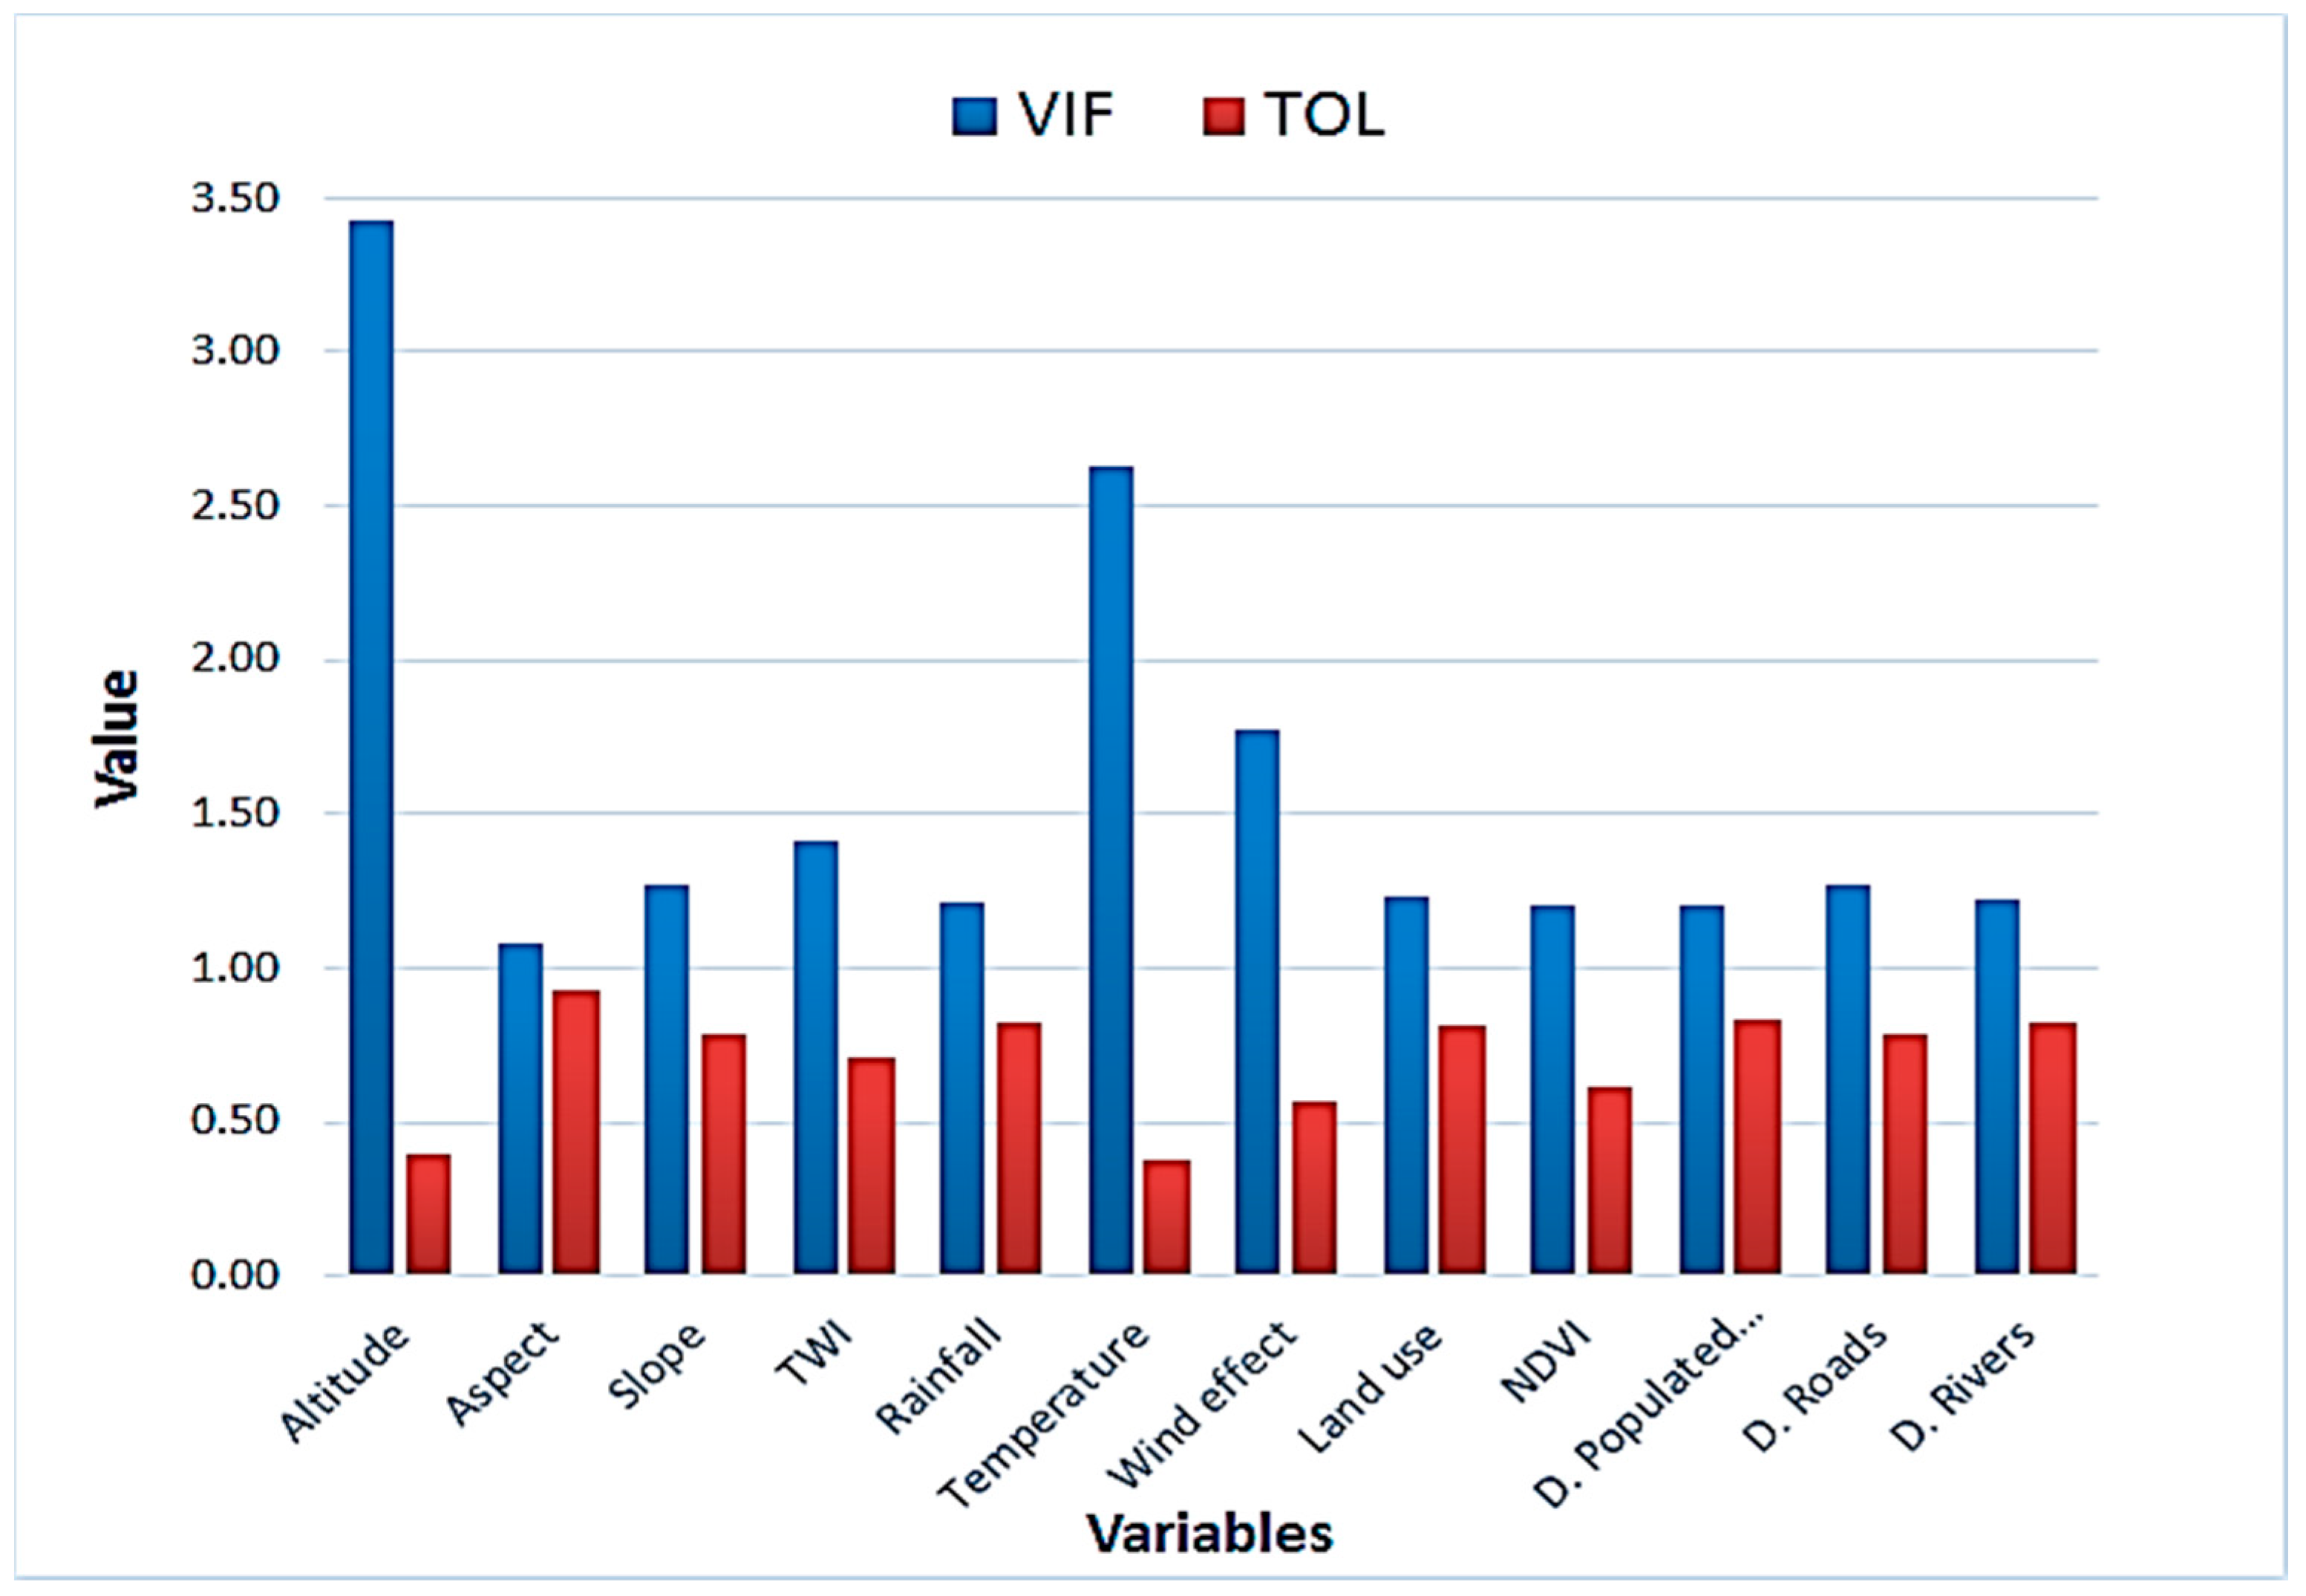
4.1. Multicollinearity Assessment
4.2. Model Results
4.3. Validation and Comparision
5. Conclusions
Author Contributions
Funding
Conflicts of Interest
References
- Pacheco, A.P.; Claro, J.; Fernandes, P.M.; de Neufville, R.; Oliveira, T.M.; Borges, J.G.; Rodrigues, J.C. Cohesive fire management within an uncertain environment: A review of risk handling and decision support systems. Ecol. Manag. 2015, 347, 1–17. [Google Scholar] [CrossRef]
- Pourtaghi, Z.S.; Pourghasemi, H.R.; Aretano, R.; Semeraro, T. Investigation of general indicators influencing on forest fire and its susceptibility modeling using different data mining techniques. Ecol. Indic. 2016, 64, 72–84. [Google Scholar] [CrossRef]
- Bowman, D.M.; Balch, J.K.; Artaxo, P.; Bond, W.J.; Carlson, J.M.; Cochrane, M.A.; D’Antonio, C.M.; De Fries, R.S.; Doyle, J.C.; et al. Fire in the Earth system. Science 2009, 324, 481–484. [Google Scholar] [CrossRef] [PubMed]
- Meng, Y.; Deng, Y.; Shi, P. Mapping Forest Wildfire Risk of the World. In World Atlas of Natural Disaster Risk; Springer: Berlin/Heidelberg, Germany, 2015; pp. 261–275. [Google Scholar]
- Calder, W.J.; Shuman, B. Extensive wildfires, climate change, and an abrupt state change in subalpine ribbon forests, Colorado. Ecology 2017, 98, 2585–2600. [Google Scholar] [CrossRef]
- Stevens-Rumann, C.S.; Kemp, K.B.; Higuera, P.E.; Harvey, B.J.; Rother, M.T.; Donato, D.C.; Morgan, P.; Veblen, T.T. Evidence for declining forest resilience to wildfires under climate change. Ecol. Lett. 2018, 21, 243–252. [Google Scholar] [CrossRef] [PubMed]
- Jaafari, A.; Mafi-Gholami, D.; Zenner, E.K. A Bayesian modeling of wildfire probability in the Zagros Mountains, Iran. Ecol. Inf. 2017, 39, 32–44. [Google Scholar] [CrossRef]
- Petty, A.M.; Isendahl, C.; Brenkert-Smith, H.; Goldstein, D.J.; Rhemtulla, J.M.; Rahman, S.A.; Kumasi, T.C. Applying historical ecology to natural resource management institutions: Lessons from two case studies of landscape fire management. Glob. Environ. Chang. 2015, 31, 1–10. [Google Scholar] [CrossRef]
- Pettit, N.E.; Naiman, R.J.; Warfe, D.M.; Jardine, T.D.; Douglas, M.M.; Bunn, S.E.; Davies, P.M. Productivity and connectivity in tropical riverscapes of northern Australia: Ecological insights for management. Ecosystems 2017, 20, 492–514. [Google Scholar] [CrossRef]
- Monedero, S.; Ramirez, J.; Cardil, A. Predicting fire spread and behaviour on the fireline. Wildfire analyst pocket: A mobile app for wildland fire prediction. Ecol. Model. 2019, 392, 103–107. [Google Scholar] [CrossRef]
- Ngoc-Thach, N.; Ngo, D.B.T.; Xuan-Canh, P.; Hong-Thi, N.; Thi, B.H.; NhatDuc, H.; Dieu, T.B. Spatial pattern assessment of tropical forest fire danger at Thuan Chau area (Vietnam) using GIS-based advanced machine learning algorithms: A comparative study. Ecol. Inf. 2018, 48, 74–85. [Google Scholar] [CrossRef]
- Chuvieco, E.; Congalton, R.G. Application of remote sensing and geographic information systems to forest fire hazard mapping. Rem. Sens. Env. 1989, 29, 147–159. [Google Scholar] [CrossRef]
- De Vliegher, B.M. Risk assessment for environmental degradation caused by fires using remote sensing and GIS in a Mediterranean Region (South-Euboia, Central Greece). In Proceedings of the International IGARSS’92 Geoscience and Remote Sensing Symposium, Houston, TX, USA, 26–29 May 1992; Volume 1, pp. 44–47. [Google Scholar]
- Jaafari, A.; Zenner, E.K.; Pham, B.T. Wildfire spatial pattern analysis in the Zagros Mountains, Iran: A comparative study of decision tree based classifiers. Ecol. Inf. 2018, 43, 200–211. [Google Scholar] [CrossRef]
- Tien Bui, D.; Le, K.T.T.; Nguyen, V.C.; Le, H.D.; Revhaug, I. Tropical forest fire susceptibility mapping at the cat Ba national park area, Hai Phong city, Vietnam, using GIS-Based kernel logistic regression. Remote Sens. 2016, 8, 347. [Google Scholar] [CrossRef]
- Jaafari, A.; Zenner, E.K.; Panahi, M.; Shahabi, H. Hybrid artificial intelligence models based on a neuro-fuzzy system and metaheuristic optimization algorithms for spatial prediction of wildfire probability. Agric. For. Meteorol. 2019, 266, 198–207. [Google Scholar] [CrossRef]
- Pourghasemi, H.R. GIS-based forest fire susceptibility mapping in Iran: A comparison between evidential belief function and binary logistic regression models. Scand. J. For. Res. 2016, 31, 80–98. [Google Scholar] [CrossRef]
- Pourtaghi, Z.S.; Pourghasemi, H.R.; Rossi, M. Forest fire susceptibility mapping in the Minudasht forests, Golestan province, Iran. Environ. Earth Sci. 2015, 73, 1515–1533. [Google Scholar] [CrossRef]
- Hong, H.; Naghibi, S.A.; Dashtpagerdi, M.M.; Pourghasemi, H.R.; Chen, W. A comparative assessment between linear and quadratic discriminant analyses (LDA-QDA) with frequency ratio and weights-of-evidence models for forest fire susceptibility mapping in China. Arab. J. Geosci. 2017, 10, 167. [Google Scholar] [CrossRef]
- Nami, M.H.; Jaafari, A.; Fallah, M.; Nabiuni, S. Spatial prediction of wildfire probability in the Hyrcanian ecoregion using evidential belief function model and GIS. Int. J. Environ. Sci. Technol. 2018, 15, 373–384. [Google Scholar] [CrossRef]
- Hong, H.; Jaafari, A.; Zenner, E.K. Predicting spatial patterns of wildfire susceptibility in the Huichang County, China: An integrated model to analysis of landscape indicators. Ecol. Indic. 2019, 101, 878–891. [Google Scholar] [CrossRef]
- Umar, Z.; Pradhan, B.; Ahmad, A.; Jebur, M.N.; Tehrany, M.S. Earthquake induced landslide susceptibility mapping using an integrated ensemble frequency ratio and logistic regression models in West Sumatera Province, Indonesia. Catena 2015, 118, 124–135. [Google Scholar] [CrossRef]
- Chen, W.; Sun, Z.; Han, J. Landslide susceptibility modeling using integrated ensemble weights of evidence with logistic regression and random forest models. Appl. Sci. 2019, 9, 171. [Google Scholar] [CrossRef]
- Tien Bui, D.; Bui, Q.T.; Nguyen, Q.P.; Pradhan, B.; Nampak, H.; Trinh, P.T. A hybrid artificial intelligence approach using GIS-based neural-fuzzy inference system and particle swarm optimization for forest fire susceptibility modeling at a tropical area. Agric. For. Meteorol. 2017, 233, 32–44. [Google Scholar] [CrossRef]
- Jaafari, A.; Pourghasemi, H.R. Factors Influencing Regional Scale Wildfire Probability in Iran: An Application of Random Forest and Support Vector Machine. In Modeling in GIS and R for Earth and Environmental Science; Pourghasemi, H.R., Candan, G., Eds.; Elsevier: Amsterdam, The Netherlands, 2019. [Google Scholar]
- Tehrany, M.S.; Kumar, L. The application of a Dempster–Shafer-based evidential belief function in flood susceptibility mapping and comparison with frequency ratio and logistic regression methods. Environ. Earth Sci. 2018, 77, 490. [Google Scholar] [CrossRef]
- Dempster, A.P. Upper and lower probabilities induced by a multivalued mapping. Ann. Math. Stat. 1967, 38, 325–339. [Google Scholar] [CrossRef]
- Dempster, A.P. Upper and lower probability inferences based on a sample from a finite univariate population. Biometrika 1967, 54, 515–528. [Google Scholar] [CrossRef] [PubMed]
- Shafer, G.A. Mathematical Theory of Evidence; Princeton University Press: Princeton, NJ, USA, 1976; 297p. [Google Scholar]
- Carranza, E.J.M.; Van Ruitenbeek, F.; Hecker, C.; van der Mejide, M.; van der Meer, F.D. Knowledge-guided data-driven evidential belief modeling of mineral prospectivity in Cabo de Gata, SE Spain. Int. J. Appl. Earth Obs. 2008, 10, 374–387. [Google Scholar] [CrossRef]
- Naghibi, S.A.; Pourghasemi, H.R.; Dixon, B. GIS-based groundwater potential mapping using boosted regression tree, classification and regression tree, and random forest machine learning models in Iran. Environ. Monit. Assess. 2016, 188, 1–27. [Google Scholar] [CrossRef] [PubMed]
- Carranza, E.J.M.; Woldai, T.; Chikambwe, E.M. Application of data-driven evidential belief functions to prospectivity mapping for aquamarine-bearing pegmatites, Lundazi district, Zambia. Nat. Resour. Res. 2005, 14, 47–63. [Google Scholar] [CrossRef]
- Gorum, T.; Carranza, E.J.M. Control of style-of-faulting on spatial pattern of earthquake-triggered landslides. Int. J. Environ. Sci. Technol. 2015, 12, 3189–3212. [Google Scholar] [CrossRef] [Green Version]
- Pham, B.T.; Prakash, I.; Jaafari, A.; Bui, D.T. Spatial prediction of rainfall-induced landslides using aggregating one-dependence estimators classifier. J. Ind. Soc. Remote Sens. 2018, 46, 1457–1470. [Google Scholar] [CrossRef]
- Choubin, B.; Moradi, E.; Golshan, M.; Adamowski, J.; Sajedi-Hosseini, F.; Mosavi, A. An Ensemble prediction of flood susceptibility using multivariate discriminant analysis, classification and regression trees, and support vector machines. Sci. Total. Environ. 2019, 651, 2087–2096. [Google Scholar] [CrossRef] [PubMed]
- Jaafari, A. LiDAR-supported prediction of slope failures using an integrated ensemble weights-of-evidence and analytical hierarchy process. Environ. Earth Sci. 2018, 77, 42. [Google Scholar] [CrossRef]
- Hanley, J.A.; McNeil, B.J. The meaning and use of the area under a receiver operating characteristic (ROC) curve. Radiology 1982, 143, 29–36. [Google Scholar] [CrossRef] [PubMed]
- Wilcoxon, F. Individual comparisons by ranking methods. Biom. Bull. 1945, 1, 80–83. [Google Scholar] [CrossRef]
- Jaafari, A.; Panahi, M.; Pham, B.T.; Shahabi, H.; Bui, D.T.; Rezaie, F.; Lee, S. Meta optimization of an adaptive neuro-fuzzy inference system with grey wolf optimizer and biogeography-based optimization algorithms for spatial prediction of landslide susceptibility. Catena 2019, 175, 430–445. [Google Scholar] [CrossRef]
- Zhu, A.X.; Miao, Y.; Wang, R.; Zhu, T.; Deng, Y.; Liu, J.; Yang, L.; Cheng-Zhi, Q.; Hong, H. A comparative study of an expert knowledge-based model and two data-driven models for landslide susceptibility mapping. Catena 2018, 166, 317–327. [Google Scholar] [CrossRef]
- Tutmez, B.; Ozdogan, M.G.; Boran, A. Mapping forest fires by nonparametric clustering analysis. J. For. Res. 2018, 29, 177–185. [Google Scholar] [CrossRef]
- Termeh, S.V.R.; Kornejady, A.; Pourghasemi, H.R.; Keesstra, S. Flood susceptibility mapping using novel ensembles of adaptive neuro fuzzy inference system and metaheuristic algorithms. Sci. Total Environ. 2018, 615, 438–451. [Google Scholar] [CrossRef]
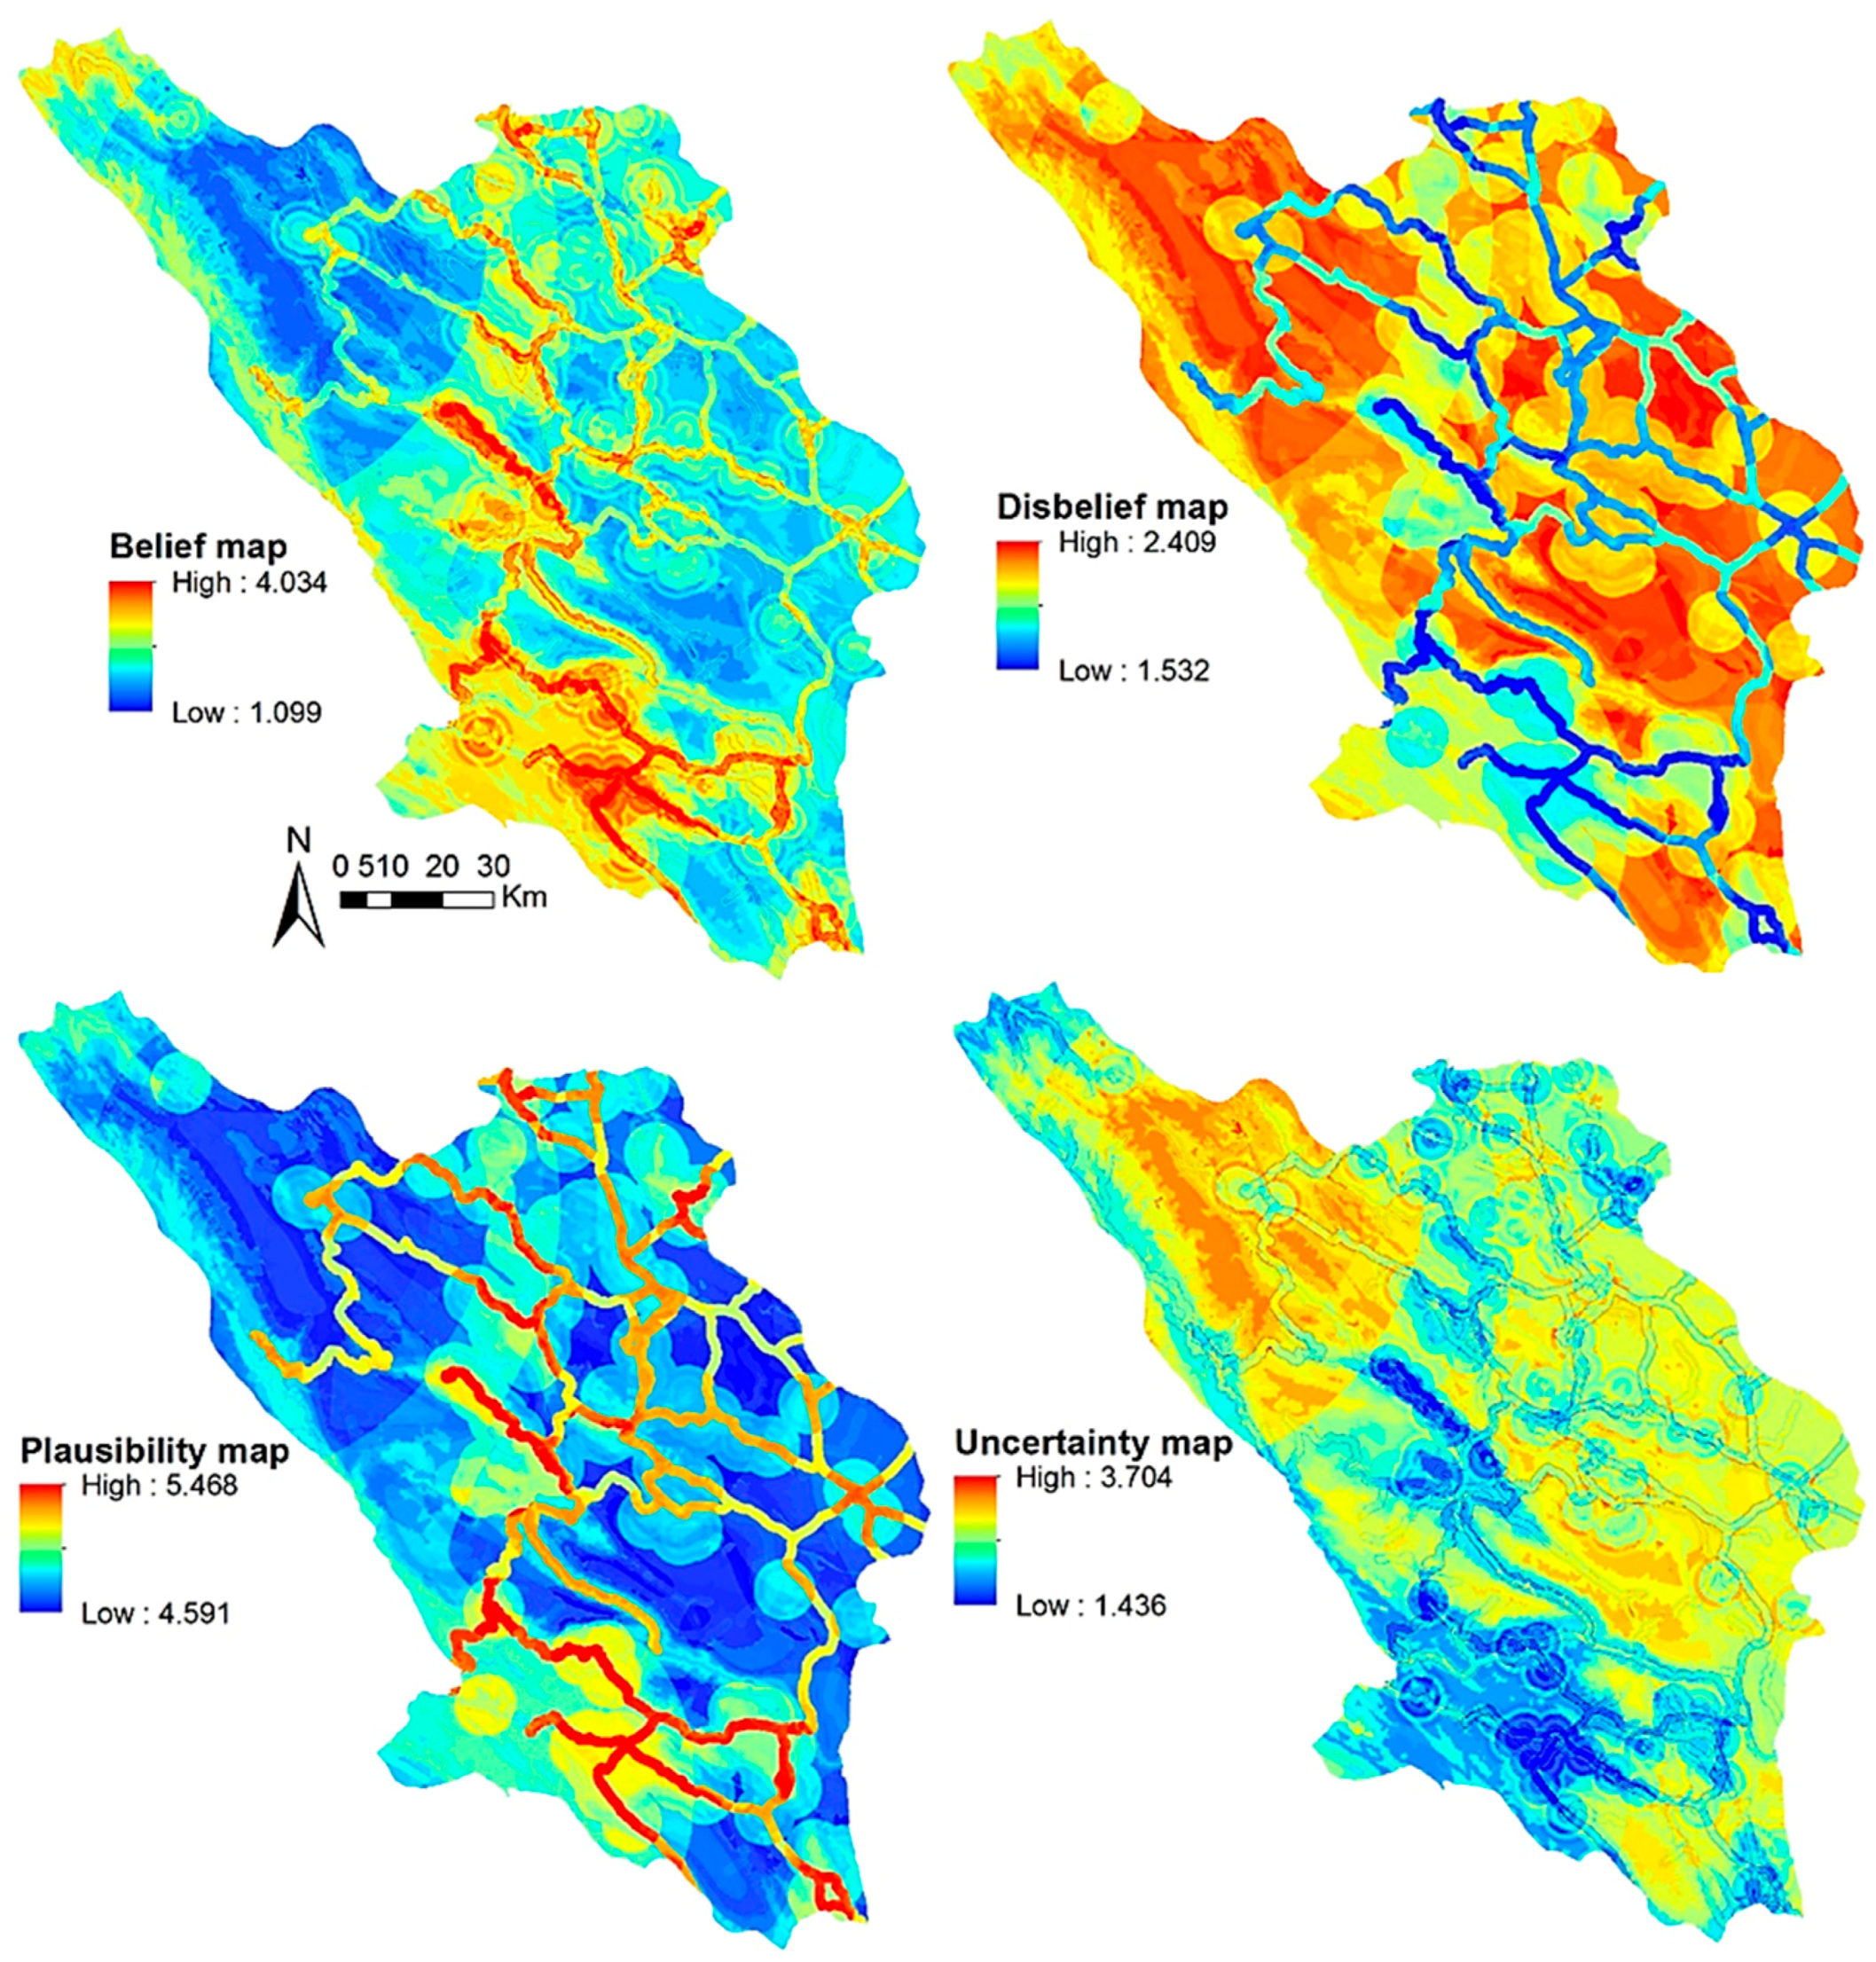
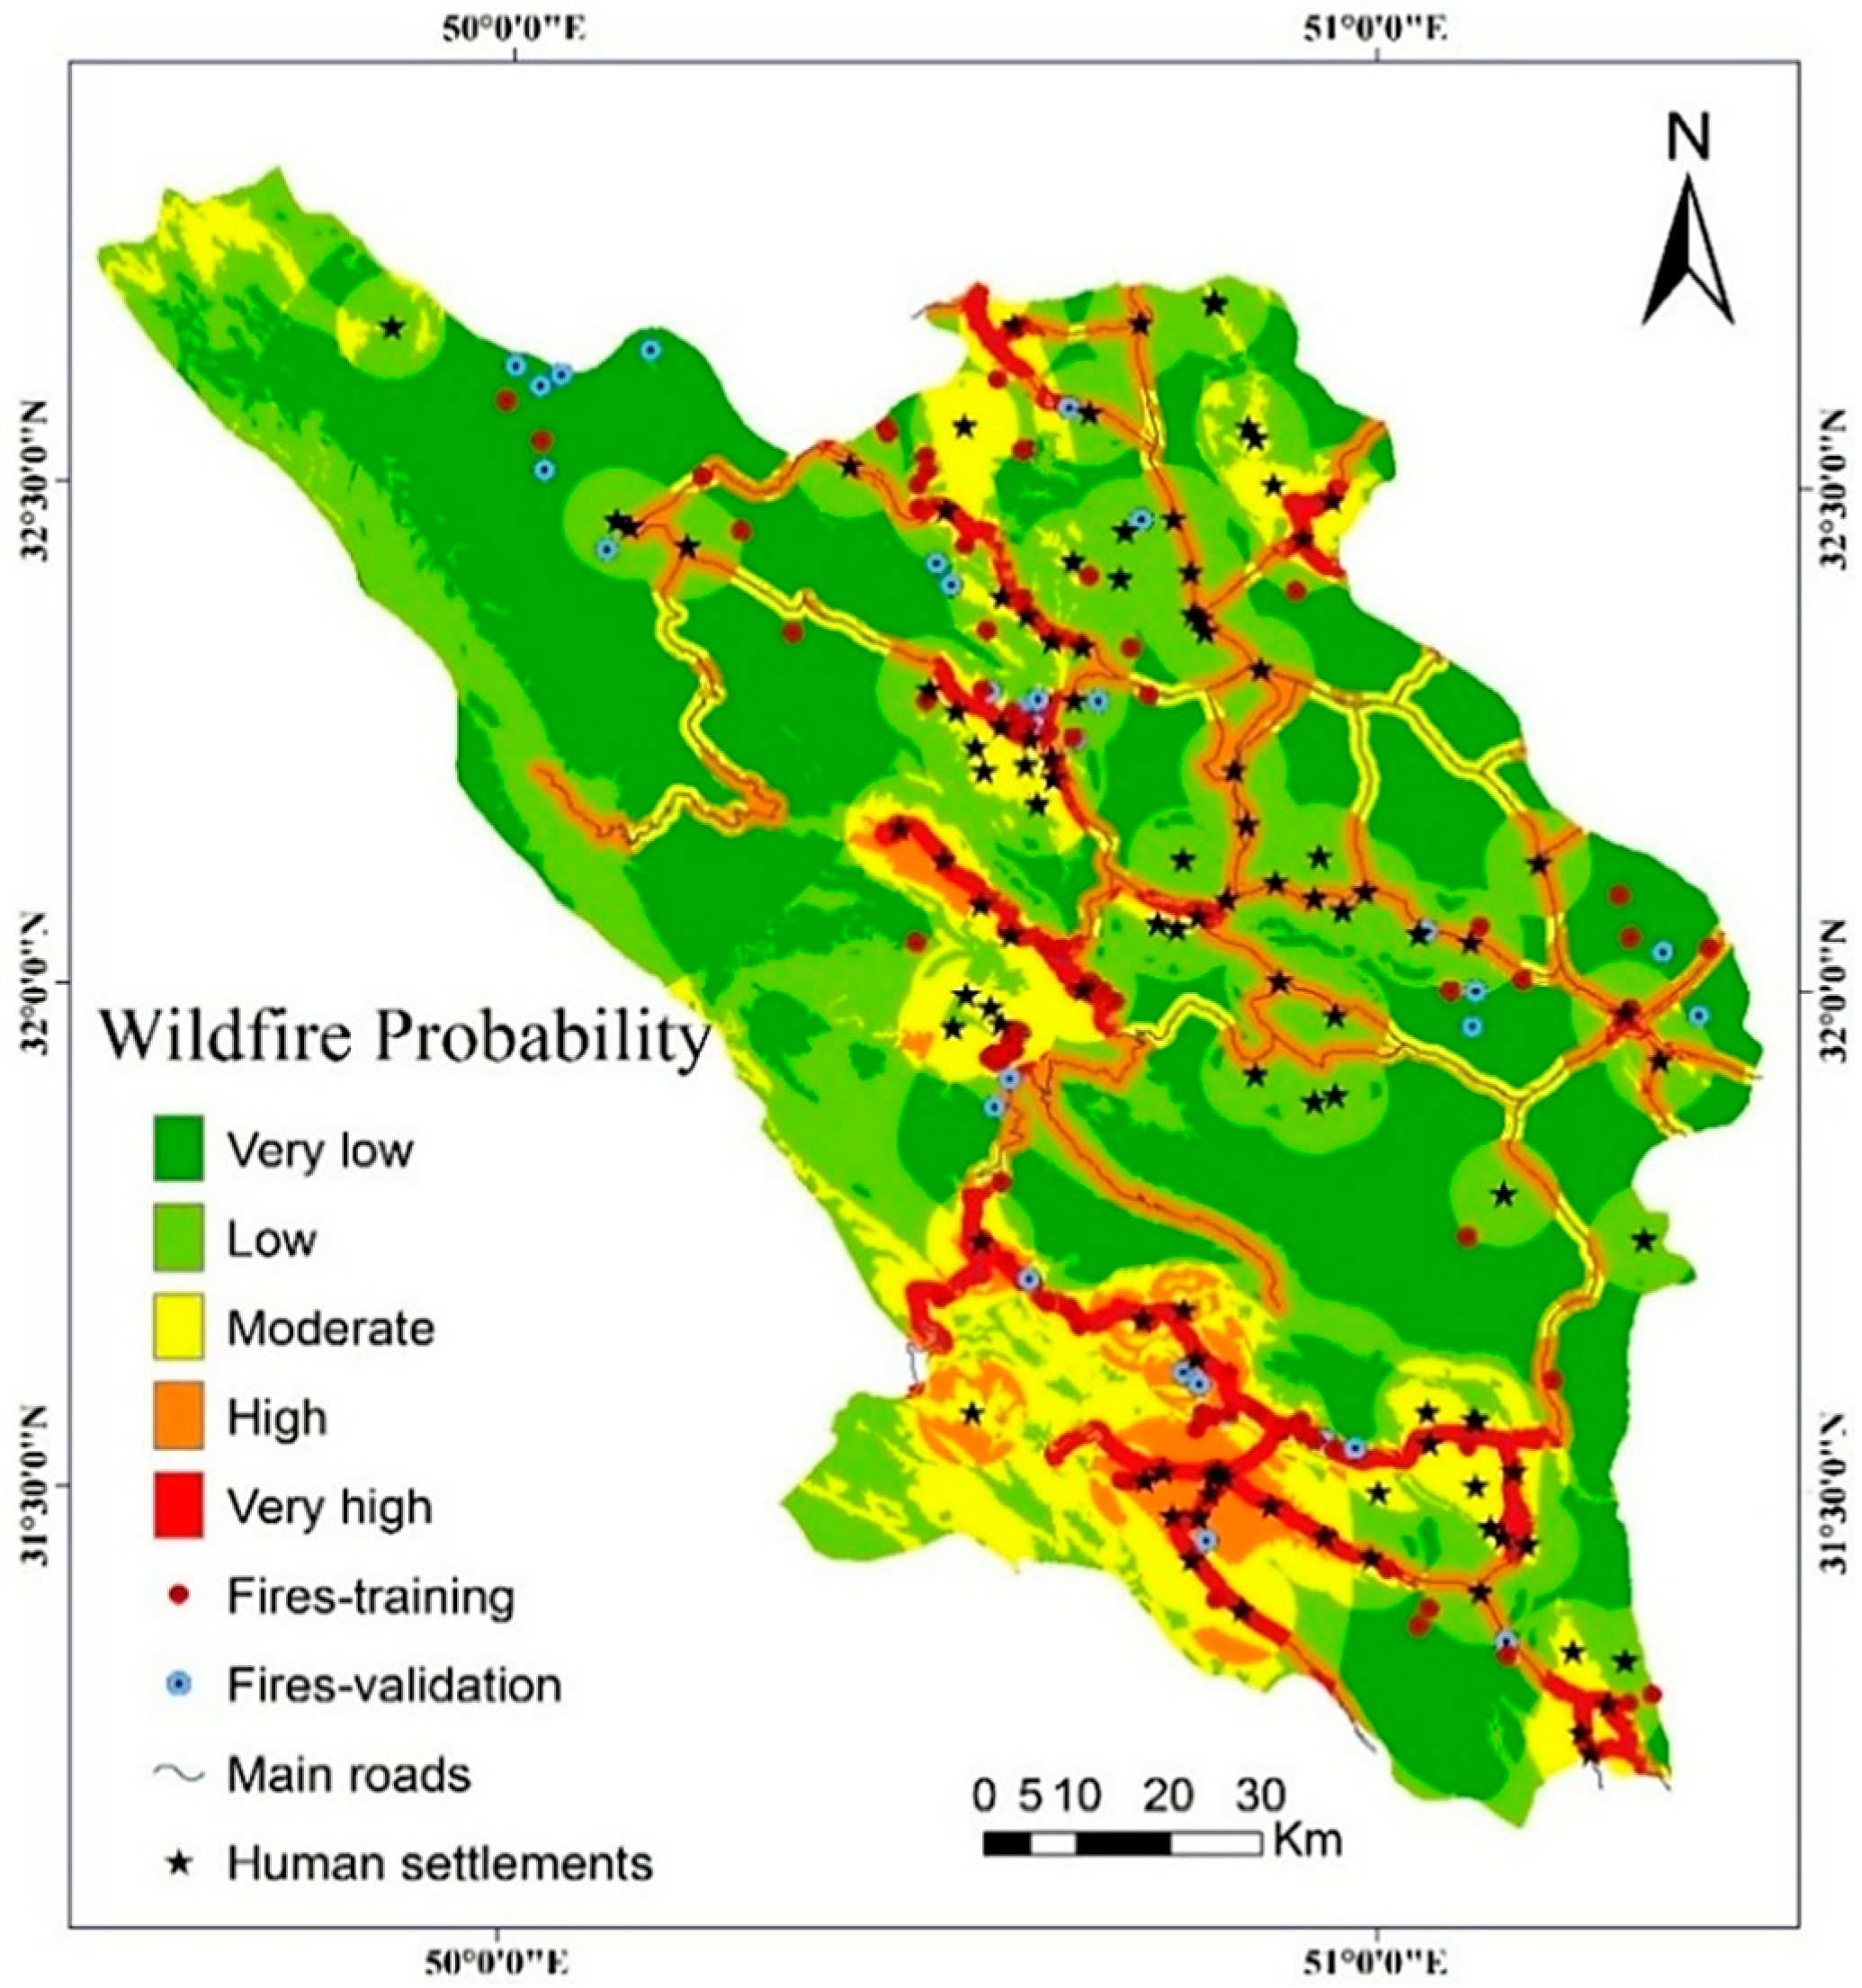


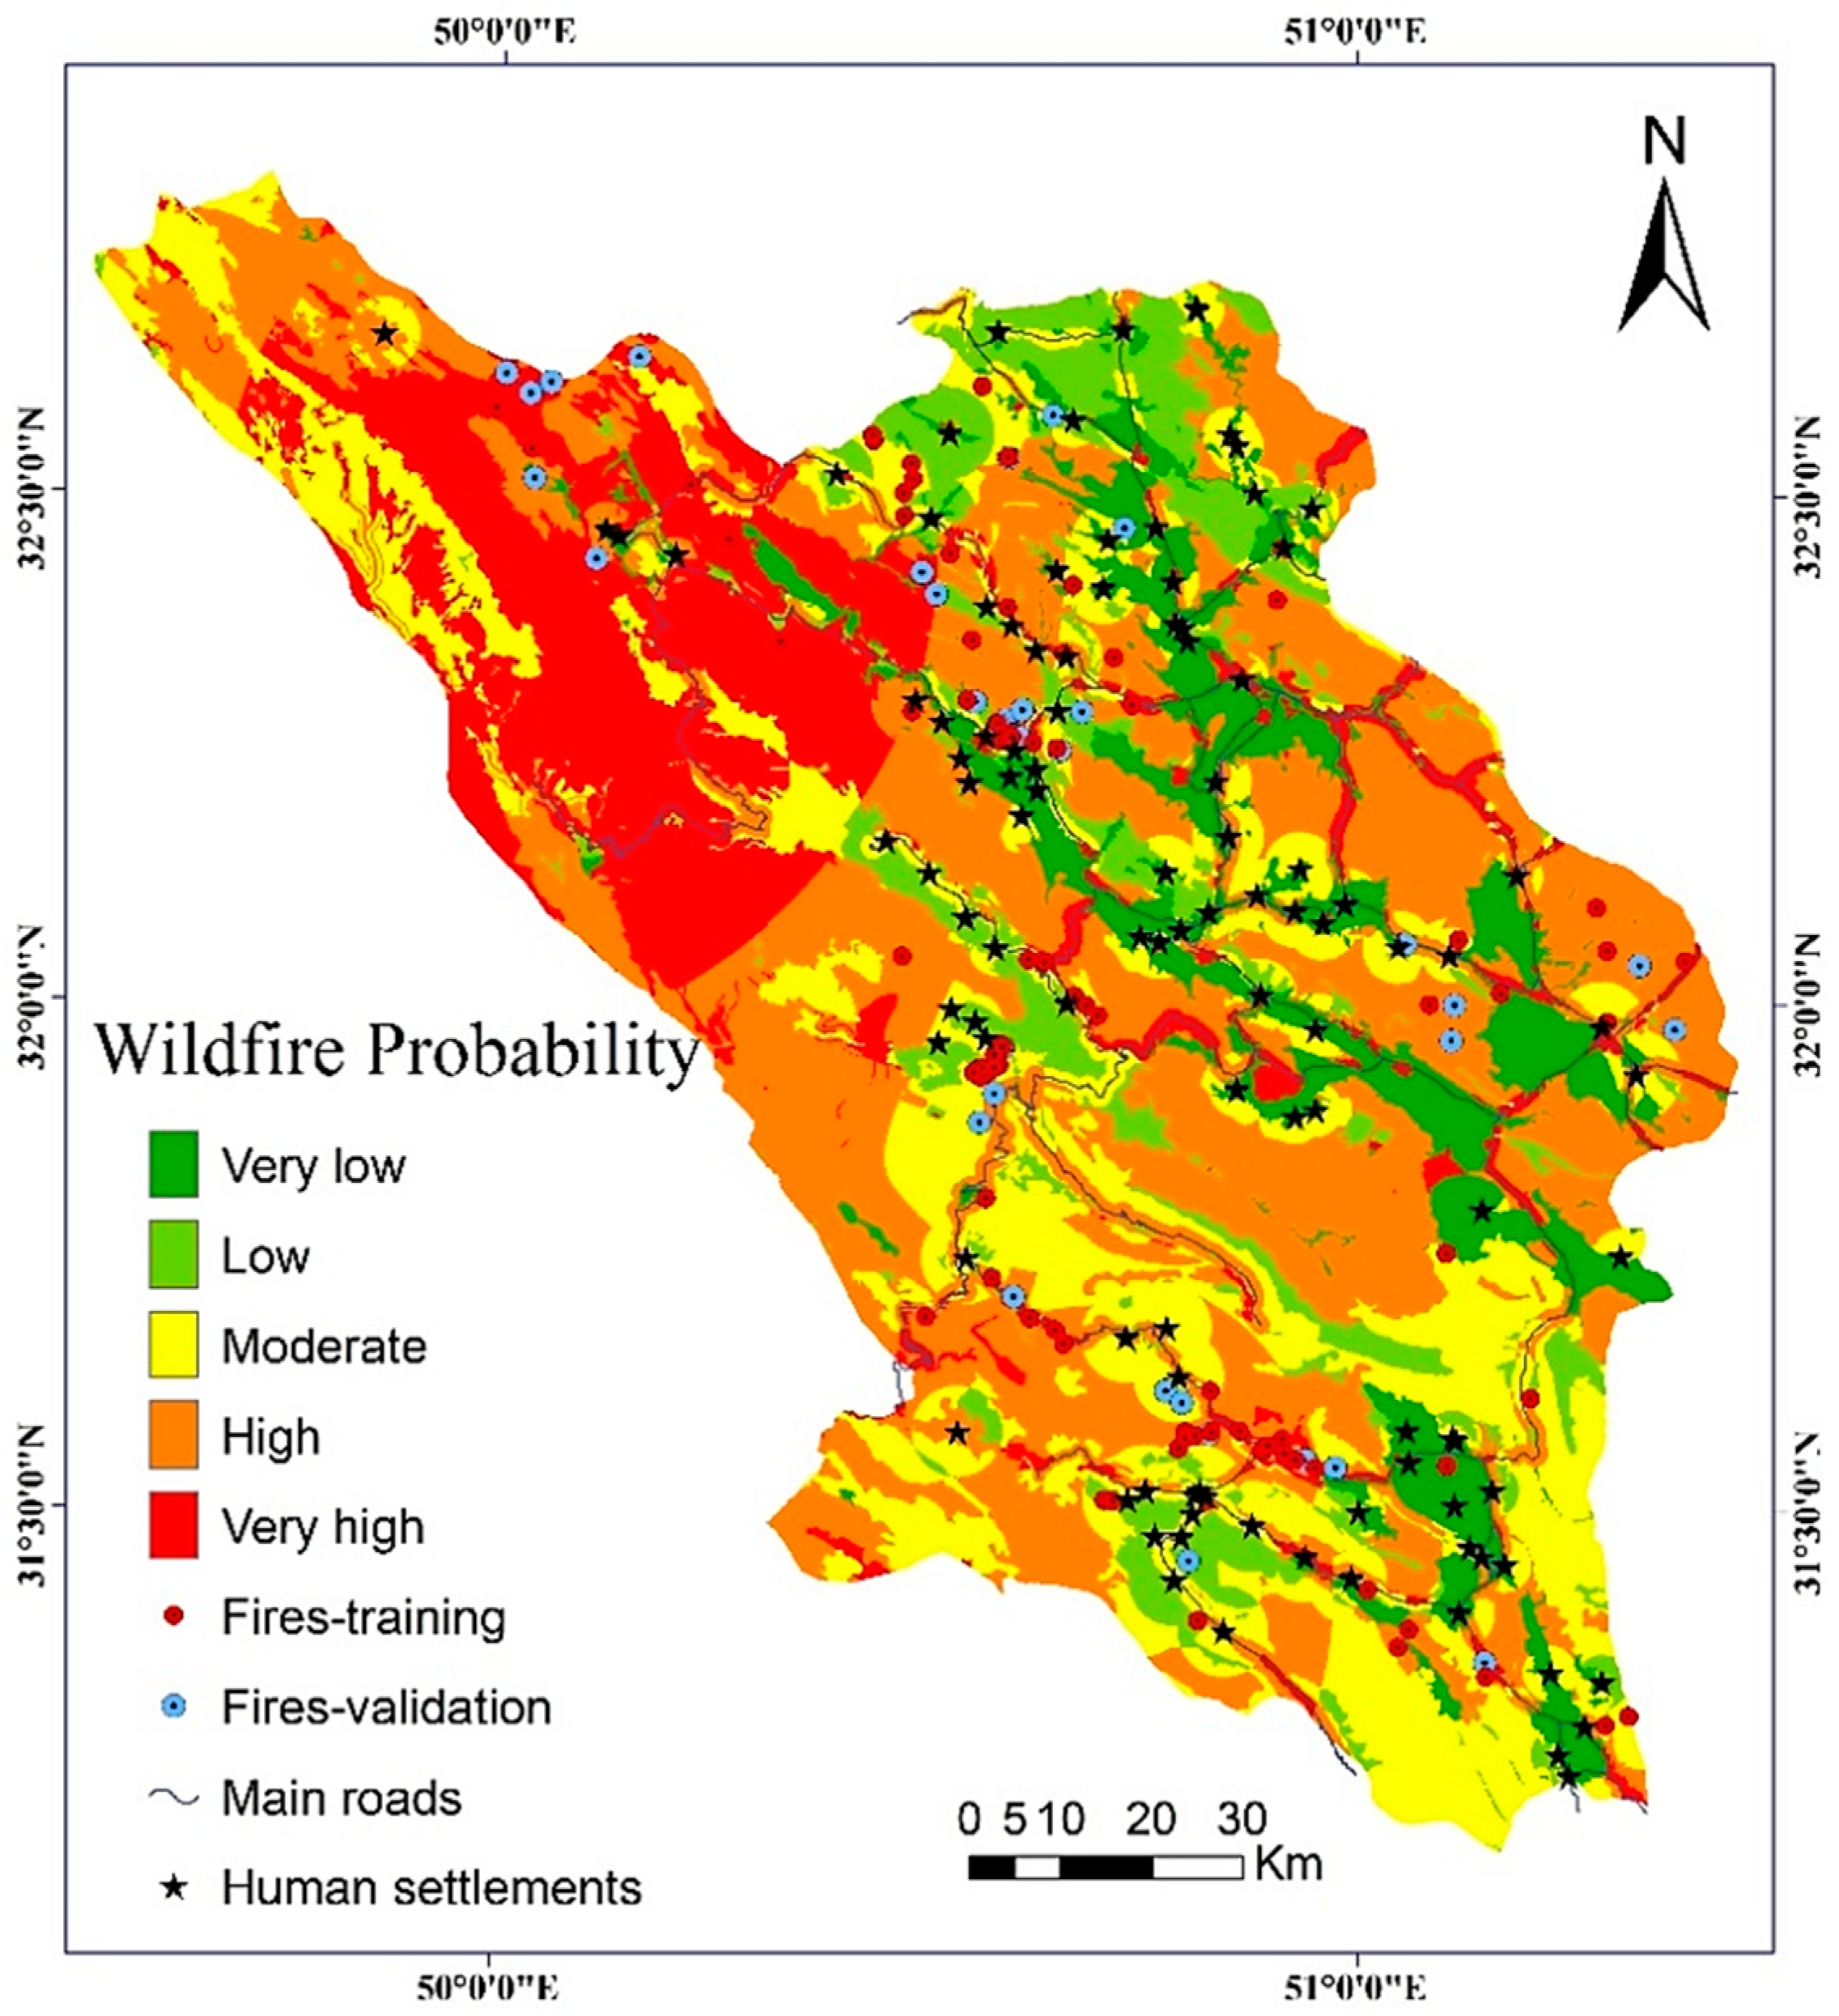
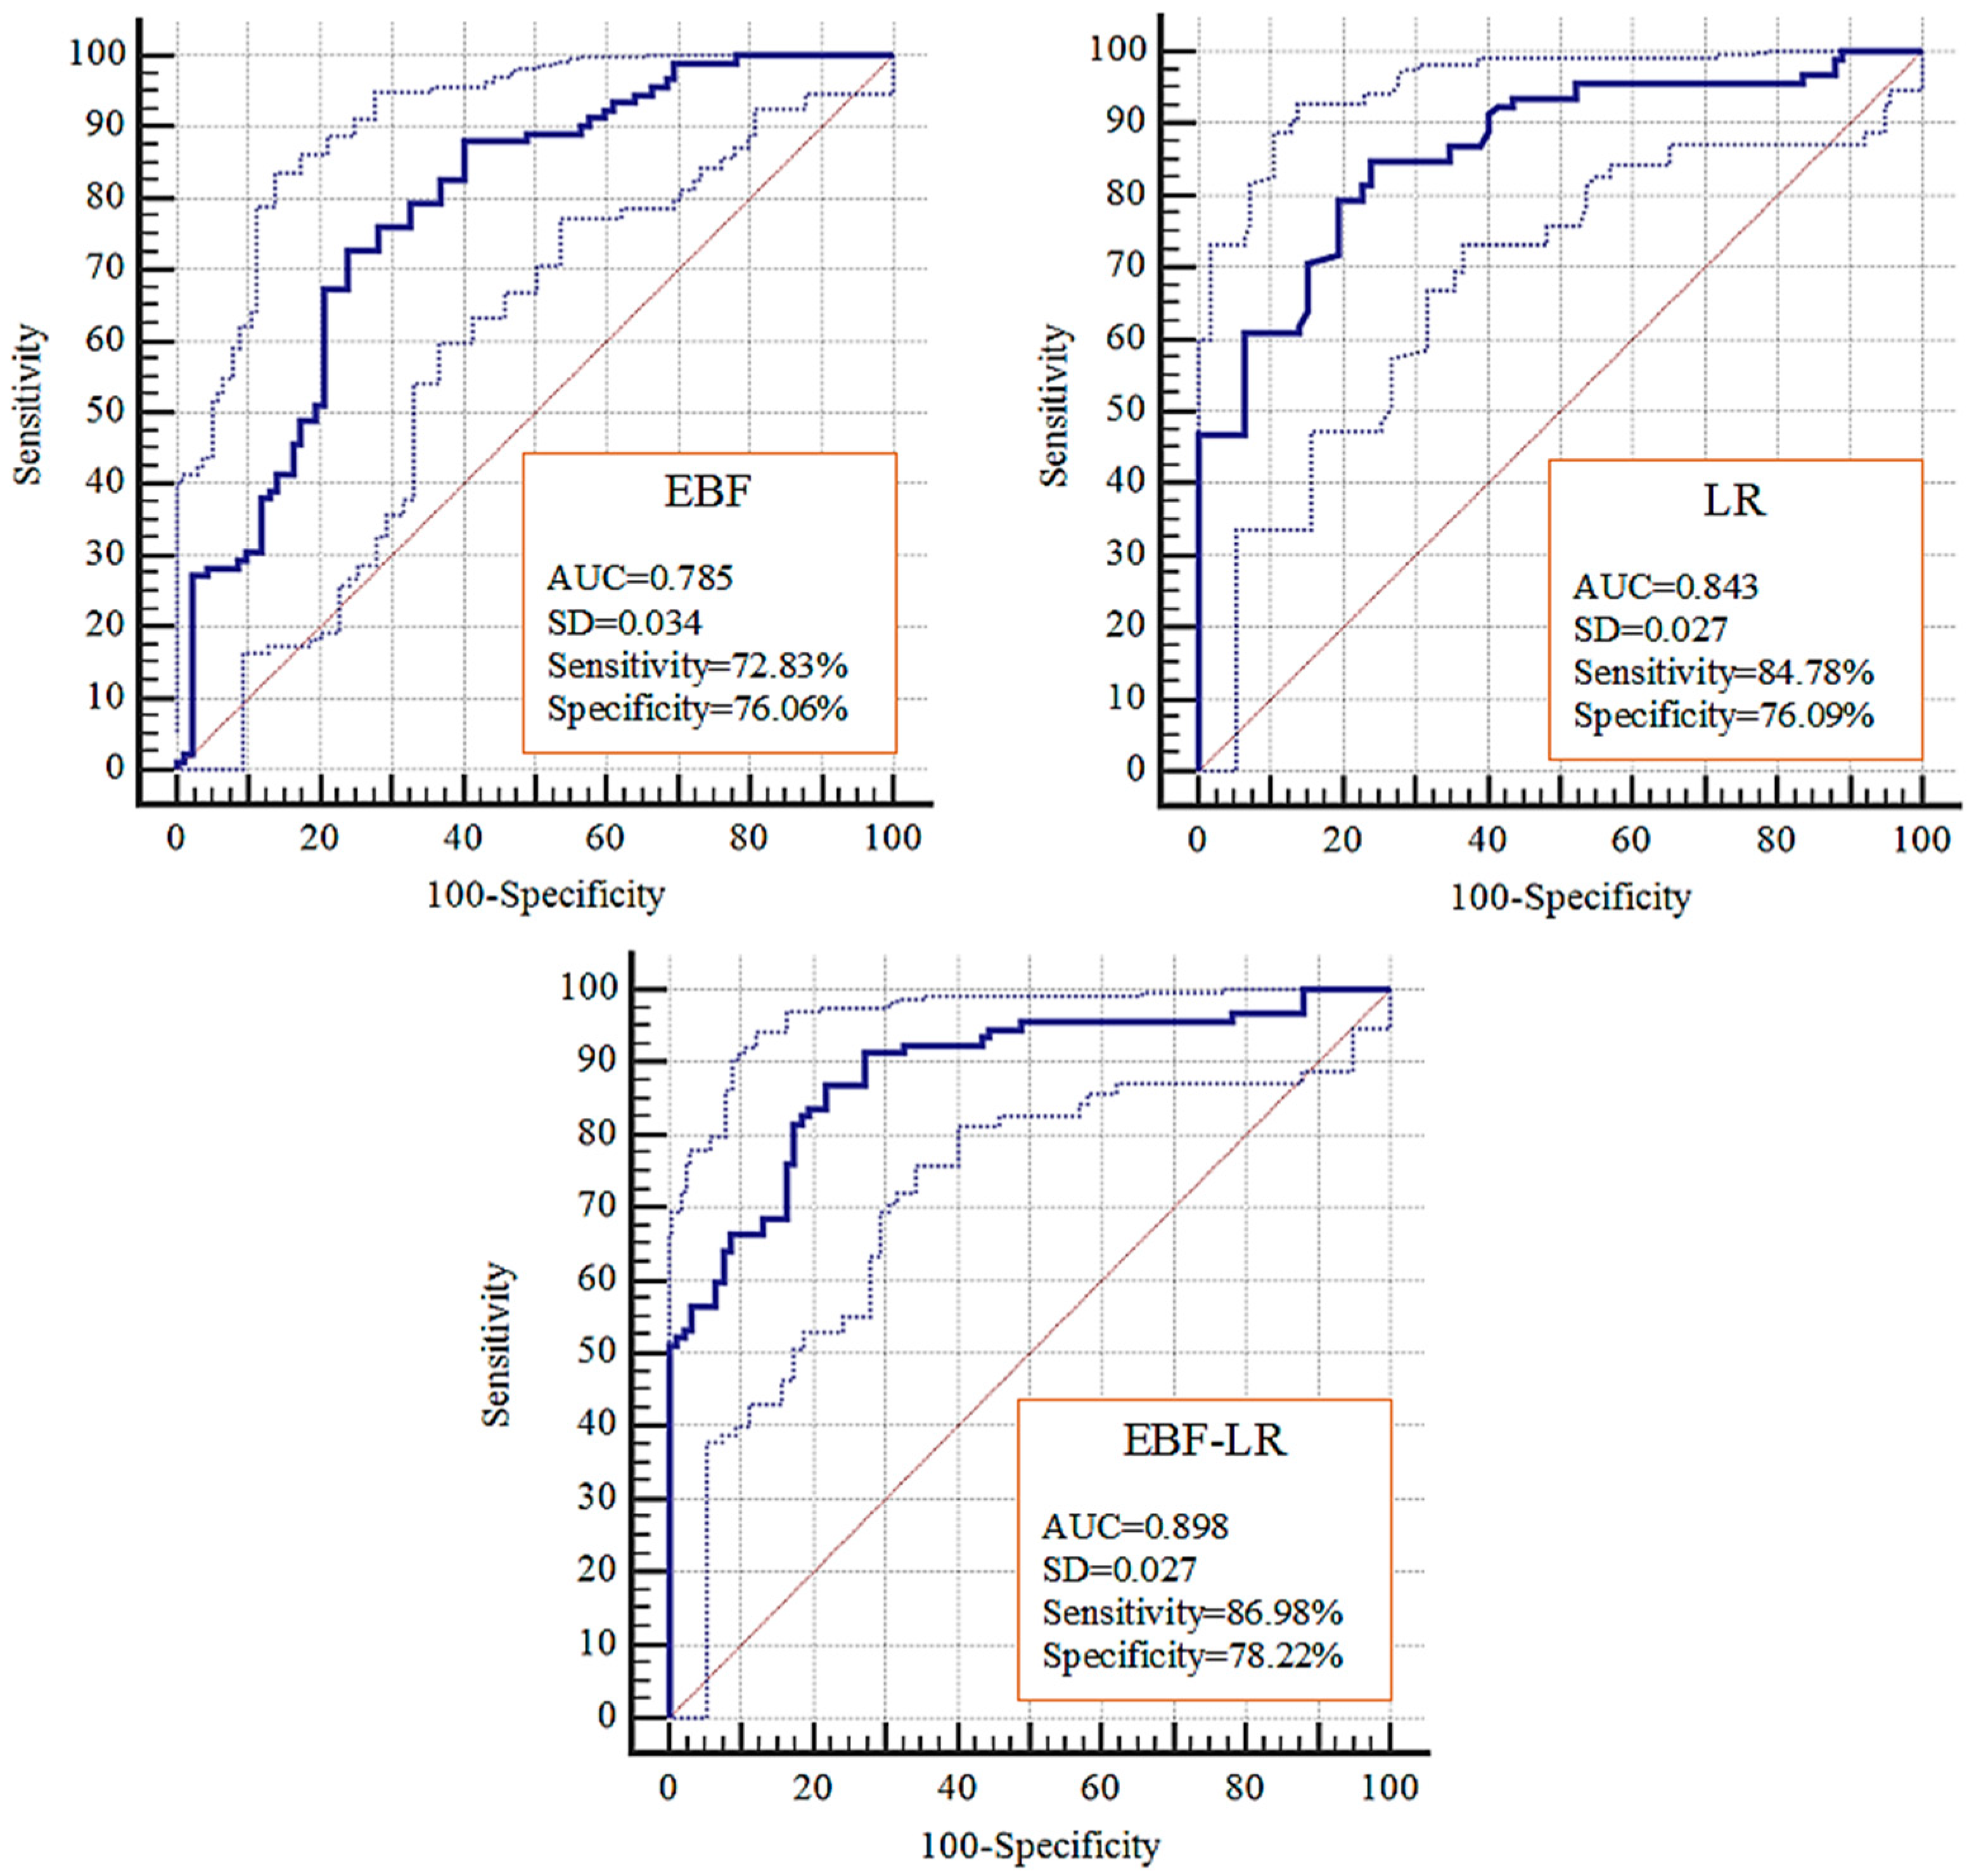

| Variable | Class | EBF Probability Mass Functions | Variable | Class | EBF Probability Mass Functions | ||||||
|---|---|---|---|---|---|---|---|---|---|---|---|
| Bel | Dis | Unc | Pls | Bel | Dis | Unc | Pls | ||||
| Altitude (m) | 0–1000 | 0.00 | 0.25 | 0.75 | 0.75 | Wind effect | <0.8 | 0.47 | 0.25 | 0.28 | 0.75 |
| 1000–1500 | 0.29 | 0.25 | 0.46 | 0.75 | 0.8–1 | 0.31 | 0.23 | 0.46 | 0.77 | ||
| 1500–2000 | 0.54 | 0.20 | 0.26 | 0.80 | 1–1.2 | 0.26 | 0.26 | 0.47 | 0.74 | ||
| 2000–2500 | 0.28 | 0.26 | 0.46 | 0.74 | >1.2 | 0.22 | 0.26 | 0.52 | 0.74 | ||
| 2500–3000 | 0.18 | 0.28 | 0.54 | 0.72 | |||||||
| >3000 | 0.04 | 0.27 | 0.69 | 0.73 | Land use | L1 | 0.11 | 0.27 | 0.61 | 0.73 | |
| L2 | 0.00 | 0.25 | 0.75 | 0.75 | |||||||
| Aspect | F | 0.21 | 0.26 | 0.53 | 0.74 | L3 | 0.45 | 0.25 | 0.30 | 0.75 | |
| N | 0.27 | 0.25 | 0.48 | 0.75 | L4 | 0.41 | 0.23 | 0.36 | 0.77 | ||
| NE | 0.29 | 0.25 | 0.46 | 0.75 | L5 | 0.37 | 0.23 | 0.40 | 0.77 | ||
| E | 0.26 | 0.25 | 0.49 | 0.75 | L6 | 0.24 | 0.29 | 0.48 | 0.71 | ||
| SE | 0.36 | 0.24 | 0.40 | 0.76 | L7 | 0.00 | 0.25 | 0.75 | 0.75 | ||
| S | 0.25 | 0.26 | 0.49 | 0.74 | L8 | 0.00 | 0.25 | 0.75 | 0.75 | ||
| SW | 0.36 | 0.24 | 0.40 | 0.76 | |||||||
| W | 0.30 | 0.25 | 0.44 | 0.75 | NDVI | −1–0.04 | 0.21 | 0.26 | 0.53 | 0.74 | |
| NW | 0.24 | 0.26 | 0.51 | 0.74 | 0.04–0.08 | 0.27 | 0.25 | 0.48 | 0.75 | ||
| 0.08–0.1 | 0.29 | 0.25 | 0.46 | 0.75 | |||||||
| Slope degree | 0–5 | 0.23 | 0.27 | 0.50 | 0.73 | 0.1–0.12 | 0.26 | 0.25 | 0.49 | 0.75 | |
| 5–15 | 0.39 | 0.21 | 0.40 | 0.79 | 0.12–0.14 | 0.36 | 0.24 | 0.40 | 0.76 | ||
| 15–30 | 0.34 | 0.23 | 0.43 | 0.77 | 0.14–0.16 | 0.25 | 0.26 | 0.49 | 0.74 | ||
| >30 | 0.04 | 0.29 | 0.67 | 0.71 | 0.16–0.18 | 0.36 | 0.24 | 0.40 | 0.76 | ||
| 0.18–1 | 0.30 | 0.25 | 0.44 | 0.75 | |||||||
| TWI | <10 | 0.29 | 0.25 | 0.46 | 0.75 | ||||||
| 10–15 | 0.31 | 0.22 | 0.46 | 0.78 | Distance to roads | 0–200 | 0.71 | 0.24 | 0.05 | 0.76 | |
| 15–20 | 0.23 | 0.26 | 0.50 | 0.74 | 200–400 | 0.71 | 0.24 | 0.05 | 0.76 | ||
| >20 | 0.11 | 0.26 | 0.64 | 0.74 | 400–600 | 0.65 | 0.24 | 0.10 | 0.76 | ||
| 600–800 | 0.97 | 0.23 | -0.21 | 0.77 | |||||||
| Temperature (°C) | <8 | 0.25 | 0.26 | 0.49 | 0.74 | 800–1000 | 0.33 | 0.25 | 0.41 | 0.75 | |
| 8–10 | 0.20 | 0.29 | 0.51 | 0.71 | >1000 | 0.22 | 0.60 | 0.18 | 0.40 | ||
| 10–12 | 0.26 | 0.26 | 0.48 | 0.74 | |||||||
| >12 | 0.43 | 0.20 | 0.37 | 0.80 | Distance to rivers | 0–200 | 0.31 | 0.25 | 0.44 | 0.75 | |
| 200–400 | 0.21 | 0.26 | 0.54 | 0.74 | |||||||
| Rainfall (mm) | <300 | 0.30 | 0.25 | 0.45 | 0.75 | 400–600 | 0.22 | 0.26 | 0.53 | 0.74 | |
| 300–500 | 0.24 | 0.29 | 0.47 | 0.71 | 600–800 | 0.57 | 0.24 | 0.19 | 0.76 | ||
| 500–700 | 0.50 | 0.19 | 0.31 | 0.81 | 800–1000 | 0.22 | 0.25 | 0.52 | 0.75 | ||
| 700–900 | 0.21 | 0.26 | 0.53 | 0.74 | >1000 | ||||||
| Distance to populate areas | 0–2 | 0.62 | 0.23 | 0.15 | 0.77 | ||||||
| 2–3 | 0.44 | 0.24 | 0.32 | 0.76 | |||||||
| 3–4 | 0.55 | 0.23 | 0.22 | 0.77 | |||||||
| 4–5 | 0.22 | 0.26 | 0.52 | 0.74 | |||||||
| 5–6 | 0.38 | 0.24 | 0.37 | 0.76 | |||||||
| >6 | 0.18 | 0.39 | 0.43 | 0.61 | |||||||
| Step | Chi-Square | −2 Log Likelihood | Cox & Snell R Square | Nagelkerke R Square |
|---|---|---|---|---|
| 1 | 2.532 | 240.749a | 0.075 | 0.100 |
| 2 | 7.617 | 235.434a | 0.101 | 0.135 |
| 3 | 15.880 | 224.975a | 0.151 | 0.201 |
| 4 | 13.302 | 220.813a | 0.170 | 0.227 |
| 5 | 16.484 | 215.842b | 0.192 | 0.256 |
| 95% C.I. for EXP(B) | Exp (ß) | Sig. | df | Wald | S.E | ß | Variables in the Equation | ||
|---|---|---|---|---|---|---|---|---|---|
| Upper | Lower | ||||||||
| 0.897 | 0.373 | 0.579 | 0.14 | 1 | 5.979 | 0.224 | −0.547 | Slope | Step 5 |
| 0.932 | 0.454 | 0.650 | 0.019 | 1 | 5.497 | 0.183 | 0.430 | Rainfall | |
| 0.589 | 0.032 | 0.137 | 0.008 | 1 | 7.113 | 0.745 | −1.990 | Land use (Farmland) | |
| 25.499 | 0.009 | 0.475 | 0.714 | 1 | 0.134 | 2.032 | −0.744 | Land use (Orchard) | |
| 5.442 | 0.926 | 2.245 | 0.703 | 1 | 3.206 | 0.452 | 0.809 | Land use (Dry farming) | |
| 5.050 | 0.942 | 2.182 | 0.069 | 1 | 3.317 | 0.428 | 0.780 | Land use (Forest) | |
| 0.977 | 0.667 | 0.807 | 0.028 | 1 | 4.828 | 0.097 | −0.214 | Dis. to populated areas | |
| 0.896 | 0.534 | 0.691 | 0.005 | 1 | 7.814 | 0.132 | −0.369 | Dis. to roads | |
| 165.936 | 0.000 | 1 | 20.194 | 1.137 | −5.112 | Constant | |||
| z-Value | p-Value | Sig. | |
|---|---|---|---|
| EBF vs. LR | 11.463 | p < 0.0001 | Yes |
| EBF vs. EBF-LR | −11.763 | p < 0.0001 | Yes |
| LR vs. EBF-LR | −11.764 | p < 0.0001 | Yes |
| z-Value | p-Value | Sig. | |
|---|---|---|---|
| EBF vs. LR | 7.770 | p < 0.0001 | Yes |
| EBF vs. EBF-LR | −7.769 | p < 0.0001 | Yes |
| LR vs. EBF-LR | 7.347 | p < 0.0001 | Yes |
© 2019 by the authors. Licensee MDPI, Basel, Switzerland. This article is an open access article distributed under the terms and conditions of the Creative Commons Attribution (CC BY) license (http://creativecommons.org/licenses/by/4.0/).
Share and Cite
Jaafari, A.; Mafi-Gholami, D.; Thai Pham, B.; Tien Bui, D. Wildfire Probability Mapping: Bivariate vs. Multivariate Statistics. Remote Sens. 2019, 11, 618. https://doi.org/10.3390/rs11060618
Jaafari A, Mafi-Gholami D, Thai Pham B, Tien Bui D. Wildfire Probability Mapping: Bivariate vs. Multivariate Statistics. Remote Sensing. 2019; 11(6):618. https://doi.org/10.3390/rs11060618
Chicago/Turabian StyleJaafari, Abolfazl, Davood Mafi-Gholami, Binh Thai Pham, and Dieu Tien Bui. 2019. "Wildfire Probability Mapping: Bivariate vs. Multivariate Statistics" Remote Sensing 11, no. 6: 618. https://doi.org/10.3390/rs11060618
APA StyleJaafari, A., Mafi-Gholami, D., Thai Pham, B., & Tien Bui, D. (2019). Wildfire Probability Mapping: Bivariate vs. Multivariate Statistics. Remote Sensing, 11(6), 618. https://doi.org/10.3390/rs11060618


