Article

Global Satellite-Based ET Products for the Local Level Irrigation Management: An Application of Irrigation Performance Assessment in the Sugarbelt of Swaziland

1
Water Science and Engineering Department, IHE Delft Institute for Water Education, 2611 AX Delft, The Netherlands
2
Water Systems Design Department, Microprojects, Mbabane H100, Swaziland
3
Department of Water Resources, Faculty of Geo-Information Science and Earth Observation (ITC), University of Twente, 7500 AE Enschede, The Netherlands
4
Department of Environmental Sciences, Wageningen University and Research Center, 6700 HB Wageningen, The Netherlands
*
Author to whom correspondence should be addressed.
Remote Sens. 2019, 11(6), 705; https://doi.org/10.3390/rs11060705
Submission received: 31 January 2019 / Revised: 18 March 2019 / Accepted: 20 March 2019 / Published: 23 March 2019
(This article belongs to the Special Issue Remote Sensing for Crop Water Management)

Abstract

:
Remote sensing techniques have been shown, in several studies, to be an extremely effective tool for assessing the performance of irrigated areas at various scales and diverse climatic regions across the world. Open access, ready-made, global ET products were utilized in this first-ever-countrywide irrigation performance assessment study. The study aimed at identifying ‘bright spots’, the highest performing sugarcane growers, and ‘hot spots’, or low performing sugarcane growers. Four remote sensing-derived irrigation performance indicators were applied to over 302 sugarcane growers; equity, adequacy, reliability and crop water productivity. The growers were segmented according to: (i) land holding size or grower scale (ii) management regime, (iii) location of the irrigation schemes and (iv) irrigation method. Five growing seasons, from June 2005 to October 2009, were investigated. The results show while the equity of water distribution is high across all management regimes and locations, adequacy and reliability of water needs improvement in several locations. Given the fact that, in general, water supply was not constrained during the study period, the observed issues with adequacy and reliability of irrigation in some of the schemes were mostly due to poor scheme and farm level water management practices. Sugarcane crop water productivity showed the highest variation among all the indicators, with Estate managed schemes having the highest CWP at 1.57 kg/m3 and the individual growers recording the lowest CWP at 1.14 kg/m3, nearly 30% less. Similarly center pivot systems showed to have the highest CWP at 1.63 kg/m3, which was 30% higher than the CWP in furrow systems. This study showcases the applicability of publicly available global remote sensing products for assessing performance of the irrigated crops at the local level in several aspects.

Graphical Abstract

1. Introduction

The increasing pressure on global water resources threatens the supply of water for food production, biodiversity and other essential human needs [1,2,3,4,5]. An estimated seventy percent (70%) of the world’s fresh water resources are withdrawn annually for use in agriculture production [6,7] leaving little or no room for further expansion of the use of water in many countries. As such the growth of agriculture industry, in many countries, is constrained by the availability of water resources.
The Swaziland sugarcane industry is the second largest in the Southern Africa Development Community (SADC) region and Africa’s fourth largest producer after South Africa, Egypt and Sudan [8]. The Swaziland sugar industry is of critical importance to the development of the country, playing a multifaceted role in the economy. Sugar dominates both Swaziland’s industrial and agricultural sectors. It employs over 35% of Swaziland’s workers and accounts for 60% of Swaziland’s agricultural output and 18% of gross domestic product (GDP). The industry also indirectly contributes to the national economy through its multiple linkages with several other sectors. Based on industry statistics and national reports, cultivated agricultural land (both rainfed and irrigated) is estimated at about 200,000 ha, which is about 12% of the total surface area of Swaziland. Of this area, an estimated 57,262 ha was under sugar cane cultivation in 2012 [9].
The most severe threats the sugar industry is currently facing relate to the increasing strain on the water resources imposed by sugarcane irrigation, and the implications of climate change on future sugarcane production. Irrigation utilizes about 95% of the surface water resources in Swaziland and more than 90% of the allocated water is used for growing sugarcane. Sugarcane irrigation withdrawals have been increasing over the past decades and will continue to increase as the area under irrigated agriculture continues to increase (SSA, 2013). Currently an estimated 25,000 ha of irrigated sugarcane area in Swaziland falls under “high water risk” [8], which means they are exposed to risk from a shortage of water and also perhaps contribute to increasing water risks. It is predicted that future Swaziland sugarcane irrigation requirements will increase by 20%–22%, assuming the current sucrose production level was maintained [10] due to the temporal and spatial impacts of climate change. Existing irrigation systems will not be able to meet the predicted increase in peak irrigation water demand if water consumption is not properly constrained. This is problematic as the National Integrated Water Resource Master Plan (IWRMP) shows that in most of Swaziland’s river systems are closed basins [11], which means that all the available water is already fully allocated, leaving no room for further development [12].
Appropriate irrigation water management strategies aimed at improving crop productivity, whilst conserving the already strained water resources are therefore required in Swaziland. Diagnosing and establishing irrigation performance is essential in understanding where and how the performance can be sustainably improved. Traditionally, information on irrigation performance relies on field observations and measurements. However, point measurements do not effectively reflect spatial and temporal variability [13]. Understanding the spatiotemporal variations of climate variables such as rainfall and evapotranspiration (ET) is vital for proper planning and management of water for agriculture, especially where crop water requirements commonly exceed rainfall [14,15,16,17,18]. The collection of field data is not only prohibitively expensive but also complex, in particular for large and medium size irrigation schemes such as those in Swaziland. Few of the world’s irrigation schemes are equipped with field sensors like ET flux measuring stations and none are in Swaziland.
Given this situation, remote sensing can play an important role in filling the data and information gaps. Several data components such as crop consumptive water use, precipitation and the extent of the irrigated area can be derived or measured by means of satellites [19,20,21]. The use of remote sensing to quantify ET and precipitation at the irrigation scheme level has been tested in reported successful in several studies around the globe for example in Spain [22], Central Asia [23], Turkey [24], China [25], Argentina [26], Morocco [27] and the USA [28,29]. These studies have proven remote sensing to be a valuable tool in conducting irrigation performance assessment, especially in large irrigated areas [19,30]. These irrigation performance assessment studies looked at equity, reliability, adequacy and productivity as the most important criteria to define the health of an irrigation scheme.
In Swaziland there has not been any attempt towards the use of remote sensing in irrigation management and irrigation performance assessment. A major contributing factor towards this lack of application could be the highly specialized skills and time requirements for solving remote sensing algorithms, which are prohibitive for the use by irrigation sector [31]. In this regard, the growing number of global and regional remote sensing based estimates of ET and precipitation that are made available by experts in different knowledge centers and agencies for the use by the public could be viewed as an opportunity to increase the use of RS in irrigation management. Typically the level of expertise needed to use these data products is much lower than those required for conducting remote sensing analysis.
This study aim at showcasing this opportunity and will focus on applying the ready-made open source global products for irrigation performance to understand and reflect on the performance of irrigated sugarcane in Swaziland. This effort is aimed at providing insights for better water management in the sugarcane industry.

2. Materials and Methods

2.1. Study Area

The industry is formally segmented according to land holding size i.e., large, medium and small scale producers [9]. Similarly, it is generally agreed to segment farmers according to different management regimes [32,33]. In this study, growers were clustered according to; (i) land holding size: large, medium and small scale (ii) management regime: Estate Managed, Miller-cum-planter, Farmers Association and Individual Growers, (iii) according to the location of a group of growers (Figure 1) and (iv) irrigation methods). The ‘location’ cluster enabled investigation of micro-climate effects on irrigation performance.
The sugarcane growing areas of Swaziland are comprised of Estate managed, miller-cum-planters, an increasing number of Farmers Association (FA) and Individual growers. Farmers Associations are farmer-managed government initiatives. Miller-cum-planters and Estates are run along modern business lines and found in Title Deed Land (private land tenure system). Individual growers (IG) are found on Swazi Nation Land, the semi-private land tenure system and some are under Title Deed Land and are managed by the owner of the farm.The Swaziland Royal Sugar Corporation (RSSC) owns the northern mills at Simunye and Mhlume, while Illovo Sugar Limited operations are limited to the south with ownership of the third mill in Big Bend. Most of the Farmers Associations are found within the Komati Downstream Development Project area (KDDP) and the Lower Usuthu Smallholder Irrigation Project (LUSIP). Individual growers are distributed all over the country and are clustered in specific locations i.e., Vuvulane Irrigation Farms (VIF), Malkerns Valley, Sidvokodvo, Siphofaneni, and Nsoko (Figure 1).
KDDP covers a total surface area of over 27,000 ha, with farm sizes ranging between 50 ha to 400 ha. VIF is a small holder irrigation scheme with a total of 302 farms ranging from 3–7 ha in size, plus a 100 ha commercial nuclease estate, giving a total area of about 1470 ha. LUSIP was still under construction in October 2009 which is the last sugarcane season being investigated in this research.
RSSC has fostered small and medium holder groupings in the neighboring SNL and at Malkerns. Simunye cane supply area is composed of 8 and 3 medium and small holder FA and 19 IG, giving a total of 30 growers. There are about 97 growers under Illovo Sugar Limited at Big Bend—27 medium scale growers, of which 11 are FA, 19 of the 66 small scale growers are FA and 4 are large scale growers. Thus, at least 414 growers in the three cane supply areas has arisen, most of which are individual growers in VIF. A summary of all the different clusters used in this research and their brief description is summarized in Table 1 below.

2.2. Datasets

Spatial actual evapotranspiration (ET) was derived from an Ensemble ET products that is based on ET estimates from i) the Operational Simplified Surface Energy Balance (SSEBop) produced by the United States Geological Survey (USGS) [34] and ii) the CSIRO MODIS Reflectance-based Evapotranspiration (CMRSET) [35]. These products were chosen due the fact that they both have been successfully validated in different regions and also were available for Swaziland during the study period. This Ensemble product is based on the linear averaging of downscaled monthly ET maps of both SSEBop and CMRSET. The ET estimates from the SSEBop product have been validated by the developers in the southwestern United States using the water balance method. The results of the validation study showed a 6% bias in the SSEBop at an annual scale and 20% at a monthly scale [36]. The CMRSET product has been also validated by the developers of the product against catchment water balance in Australia [37]. The results showed an average absolute bias of 9.5% at an annual scale, ranging from 4% to 15%.
In this study the ET products of SSEBop and CMRSET were first downscaled to 250 m resolution using the 250 m MODIS normalized difference vegetation index (NDVI) and then the two 250 m maps were combined to create the Ensemble map. A similar approach to create Ensemble ET maps has been used and validated for estimating ET of the Nile basin [38], the Amazon [39] and the Niger basin [40]. To offset the inter-annual changes, the annual ET estimates per grower were averages of 5 sugarcane growing season from June 2005 to October 2009. This average annual ET map, shown in Figure 2, was made using monthly ET values over the 5 years covered in this study, 60 ET snapshots in total. There, currently, are no ground-based ET fluxes measuring stations in Swaziland, for this reason direct measurements of sugarcane ET could not be conducted. In an on-going study, local validation of the Ensemble is, therefore, conducted using gross inflows and the results show an overall over-estimation bias of 11%. The gross inflows are defined as the amount of water received by the crop from both irrigation and effective precipitation.
Similar to ET products, a wide range of global satellite-based precipitation products are available with global or regional coverages [41]. These products offer varying degrees of Spatio-temporal resolution and offer a promising alternative data source for precipitation. The reliability of precipitation products to reflect spatiotemporal factors has been evaluated in a number of climatic regions throughout the world. For instance, estimates from 13 global products were validated in the Nile basin using 62 ground-based rain gauge stations [42]. The Climate Hazards Group InfraRed Precipitation with Station data (CHIRPS) version 1.8 and the Tropical Rainfall Measuring Mission (TRMM) 3B43 version 7 were found to be the best products in a variety of terrains. In another effort, the Famine Early Warning Systems Network (FEWS NET) precipitation, TAMSAT African Rainfall Climatology and Time-series (TARCAT) and CHIRPS were validated in Mozambique using a rain gauge station from 2001 to 2012 [43]. CHIRPS performed best over the entire season cycle for all statistical measures with the best bias (87%), the smallest RMAE (71%) and the highest r2 (0.64). Given the proximity of Mozambique to Swaziland and their high climatic similarity, CHIRPS precipitation was used in this study. CHIRPS has daily temporal resolution and a spatial resolution of 5 km (0.05°).
Sugarcane farm boundary maps were obtained from field visits and from previous work of the Swaziland Water and Agricultural Development Enterprise (SWADE), Tabankulu Estate and Illovo Sugar Limited. Existing data contained growers found in the Inkomati basin and all growers in the southern sugarbelt. Farm boundaries for growers located along the Mbuluzi basin and Malkerns valley were obtained during field work and these new shape files were linked to the existing dataset.
These maps were generated as shape-files describing polygons of the different sugarcane growers and were used to (i) accurately delineate sugarcane growing areas, different grower clusters and the various irrigation methods and (ii) spatial averaging of grid cell values. This study focuses only on sugarcane. While sugarcane is the most dominant crop in the Lowveld of Swaziland in terms of cropped area, crops like maize and vegetable are also present in the same area, hence the need to ascertain the boundaries of these geographical units.
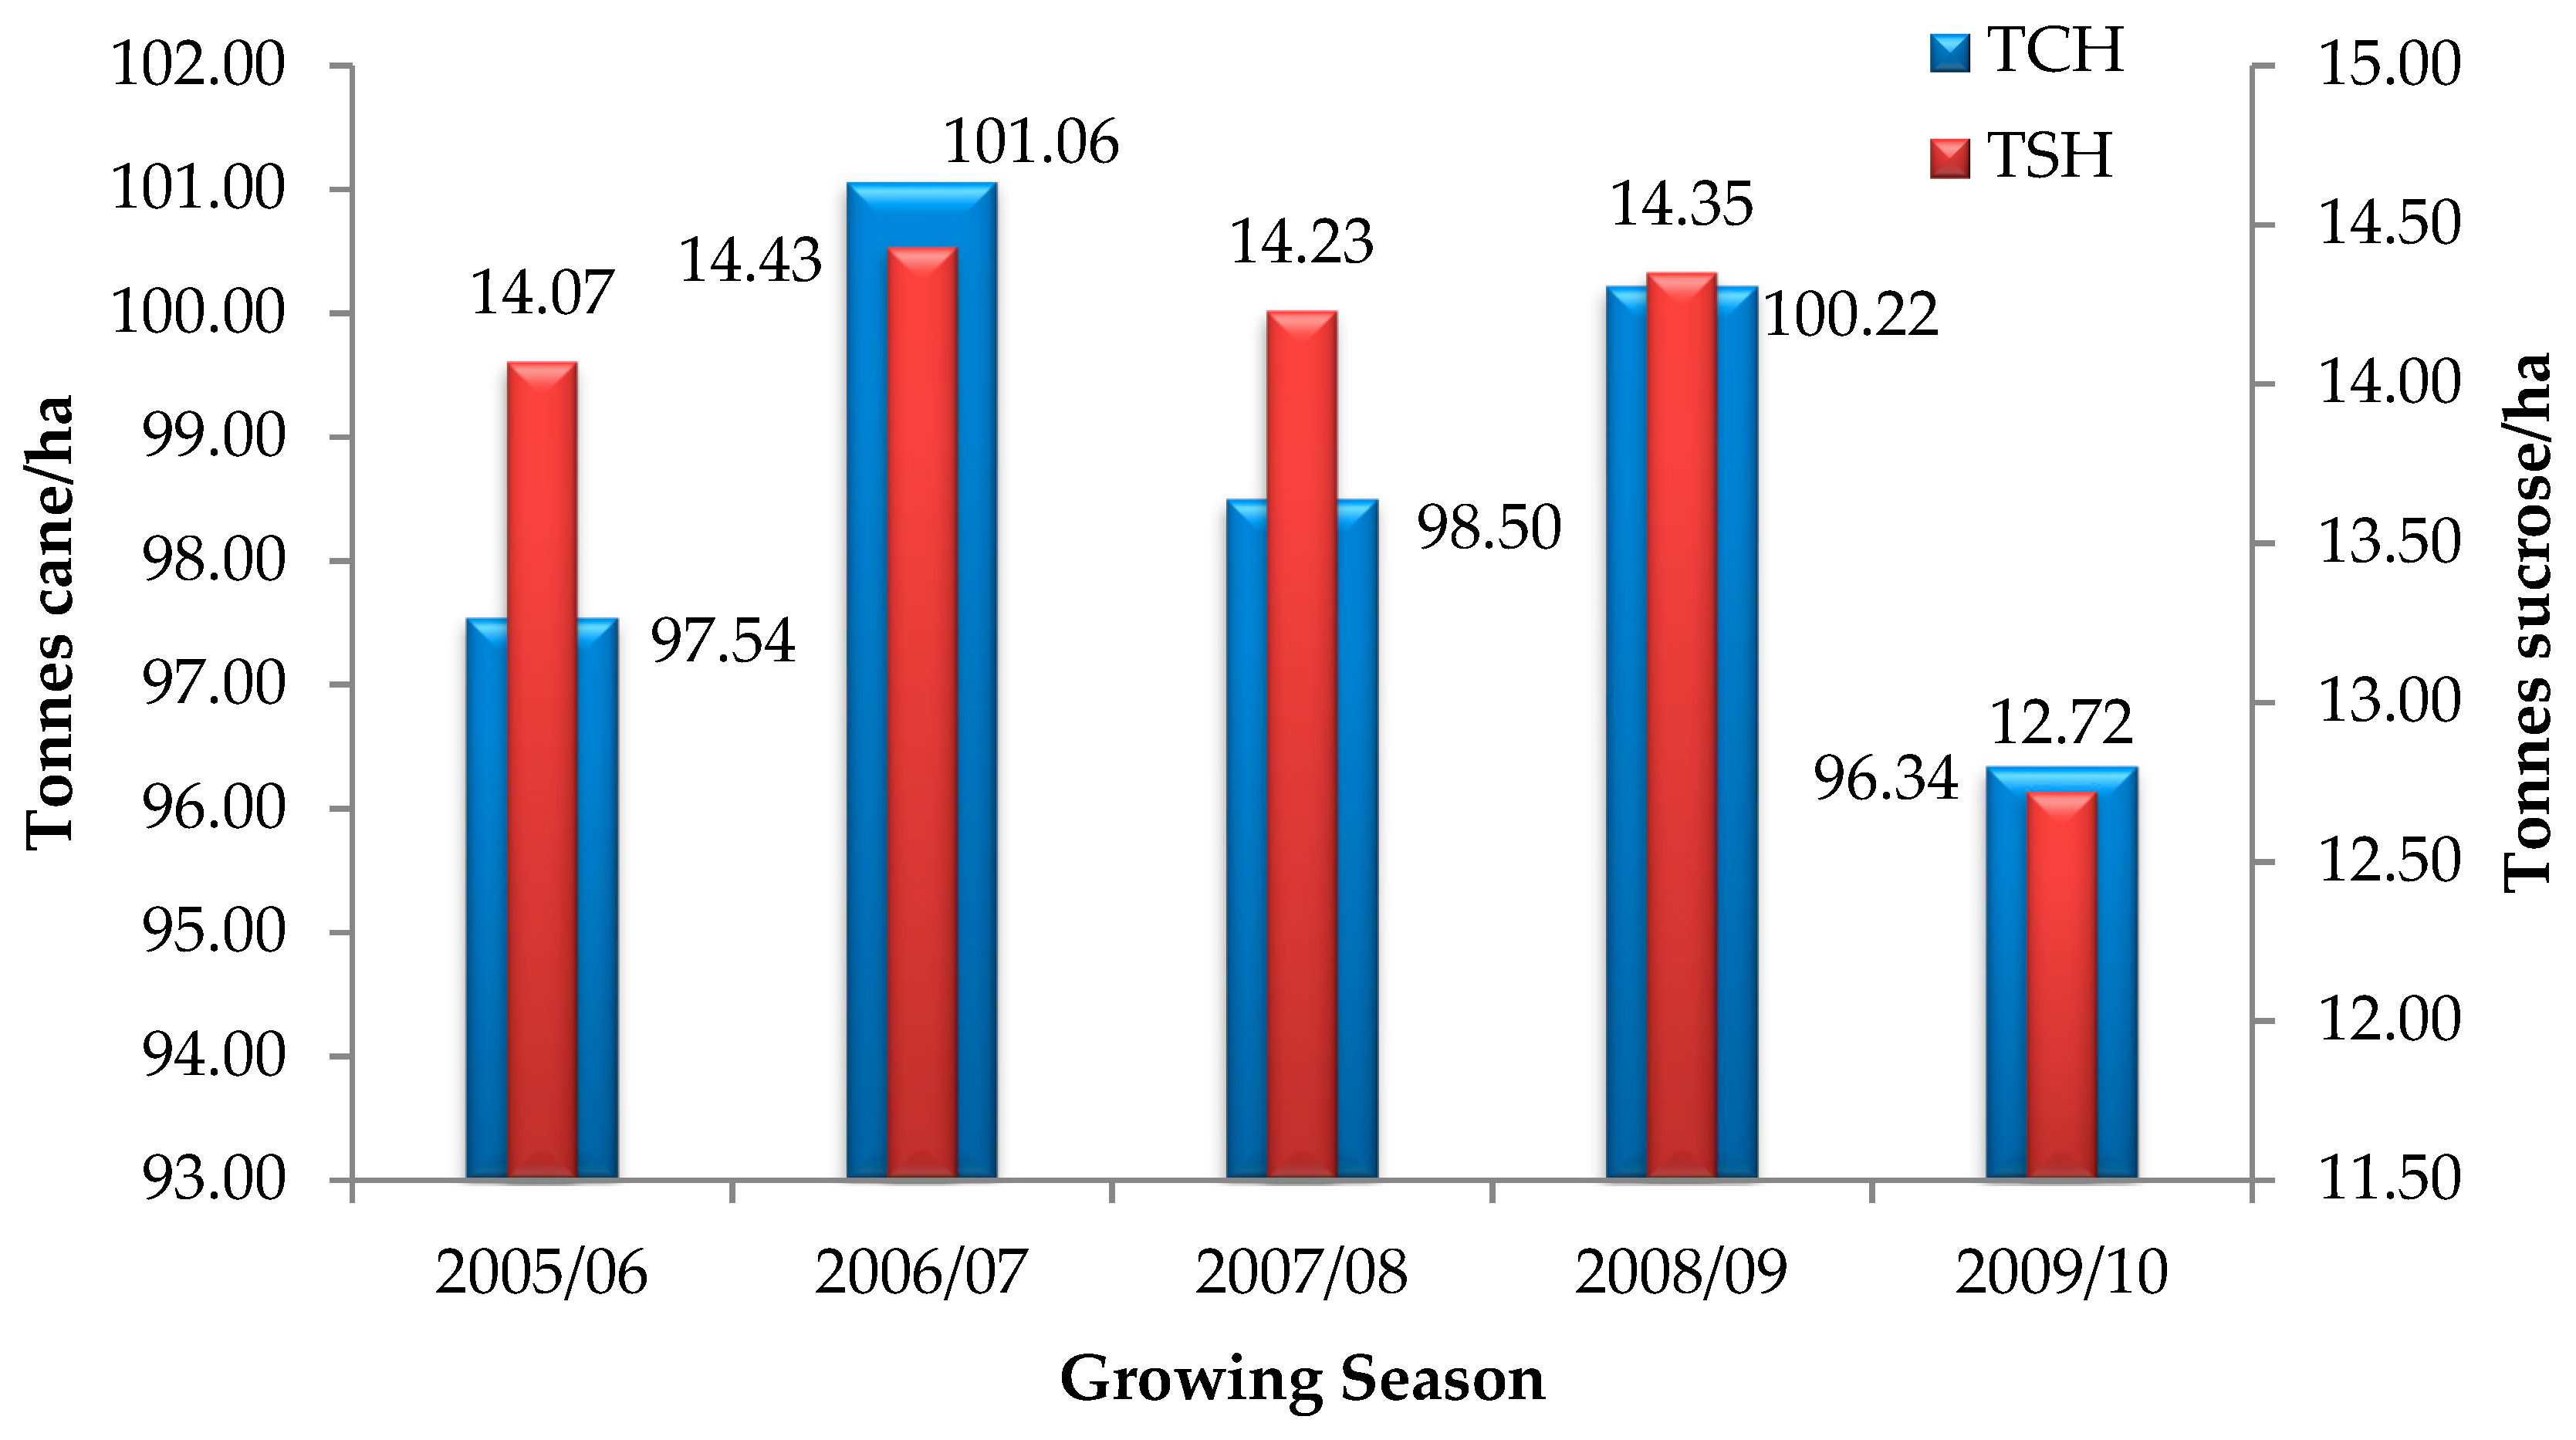
Sugarcane yield in tones-cane per hectare (TCH) and tones-sucrose per hectare (TSH) were obtained courtesy of Swaziland Cane Growers Association, Royal Swaziland Sugar Corporation, Tabankulu Estate and Illovo Sugar Limited. The overall industry yield for the investigation period is shown in Figure 3 below.

2.3. Methodology

2.3.1. Potential evapotranspiration

Potential evapotranspiration (PET) was used to quantify the adequacy and reliability of water use by the different growers. The industry norm PET values that have been developed and accepted by Swaziland Sugar Association [9], was adopted in this study. These PET values are based on the Penman-Monteith equation and expert knowledge. The industry PET values were not utilized blindly in this research, but their reliability was tested against the 95 percentile of actual ET observed in all the irrigation schemes. The logic behind this comparison was that the magnitude of potential evapotranspiration should be close to the actual ET of best performing growers, who are likely to have no soil water limitations and were able to maintain ideal growing conditions [44].

2.3.2. Irrigation Performance Assessment

Four irrigation performance monitoring criteria were selected to investigate irrigation performance of sugarcane growers in Swaziland and these are discussed below; equity, adequacy, reliability and crop water productivity (CWP).
The equitable distribution of water resources is related to the spatial distribution of water consumption [45]. Equity represents the uniformity in the spatial distribution of water use among fields by the different growers. The spatial coefficient of variation (CV) of ET between sugarcane growers was used as an indicator to investigate the equity of water use [27,46]. The lowest attained CV value, which indicates the highest level of equitable distribution of water from the evaluated systems, was considered as the target level for this equity indicators [26].
Adequacy is the measure of sufficiency of water in the irrigation system [27,45,47]. This criterion is an indirect measure of adequate soil moisture conditions in the root zone because it reflects the magnitude of reduction of water uptake by roots for crop transpiration (T). A deficit in T (or possibly expressed as ET deficit) will directly indicate crop water stress, which in several cases might be the intention (e.g., deficit irrigation, improving crop water productivity; higher sugar content harvestable product), but will result in lower crop production per unit of land than the maximum attainable. Relative ET (RET) was used as an indicator to diagnose water scarcity and relates to actual and potential evapotranspiration [23,48]. Under ideal crop growing conditions, the difference between ET and PET should be minimal and the fraction should tend to 1 [49]. Hence, any crop water deficit or more precisely ET deficit directly reflects whether the total system of water supply, water distribution and soil moisture increment works according to the crop demand.
The specific relationship between ET and sugarcane yield has not been established in Swaziland and was quantified in this research using the following equation [50]:
( 1 Y Y max ) = K y ( 1 ET PET )
where Ky is the crop specific yield response factor, Y is sugarcane sucrose (kg/ha) and Ymax is the maximum attainable sucrose yield (kg/ha). The Ky fluctuates over the season therefore a seasonal mean Ky is taken as 1.2, based on the Food and Agricultural Organization [51].
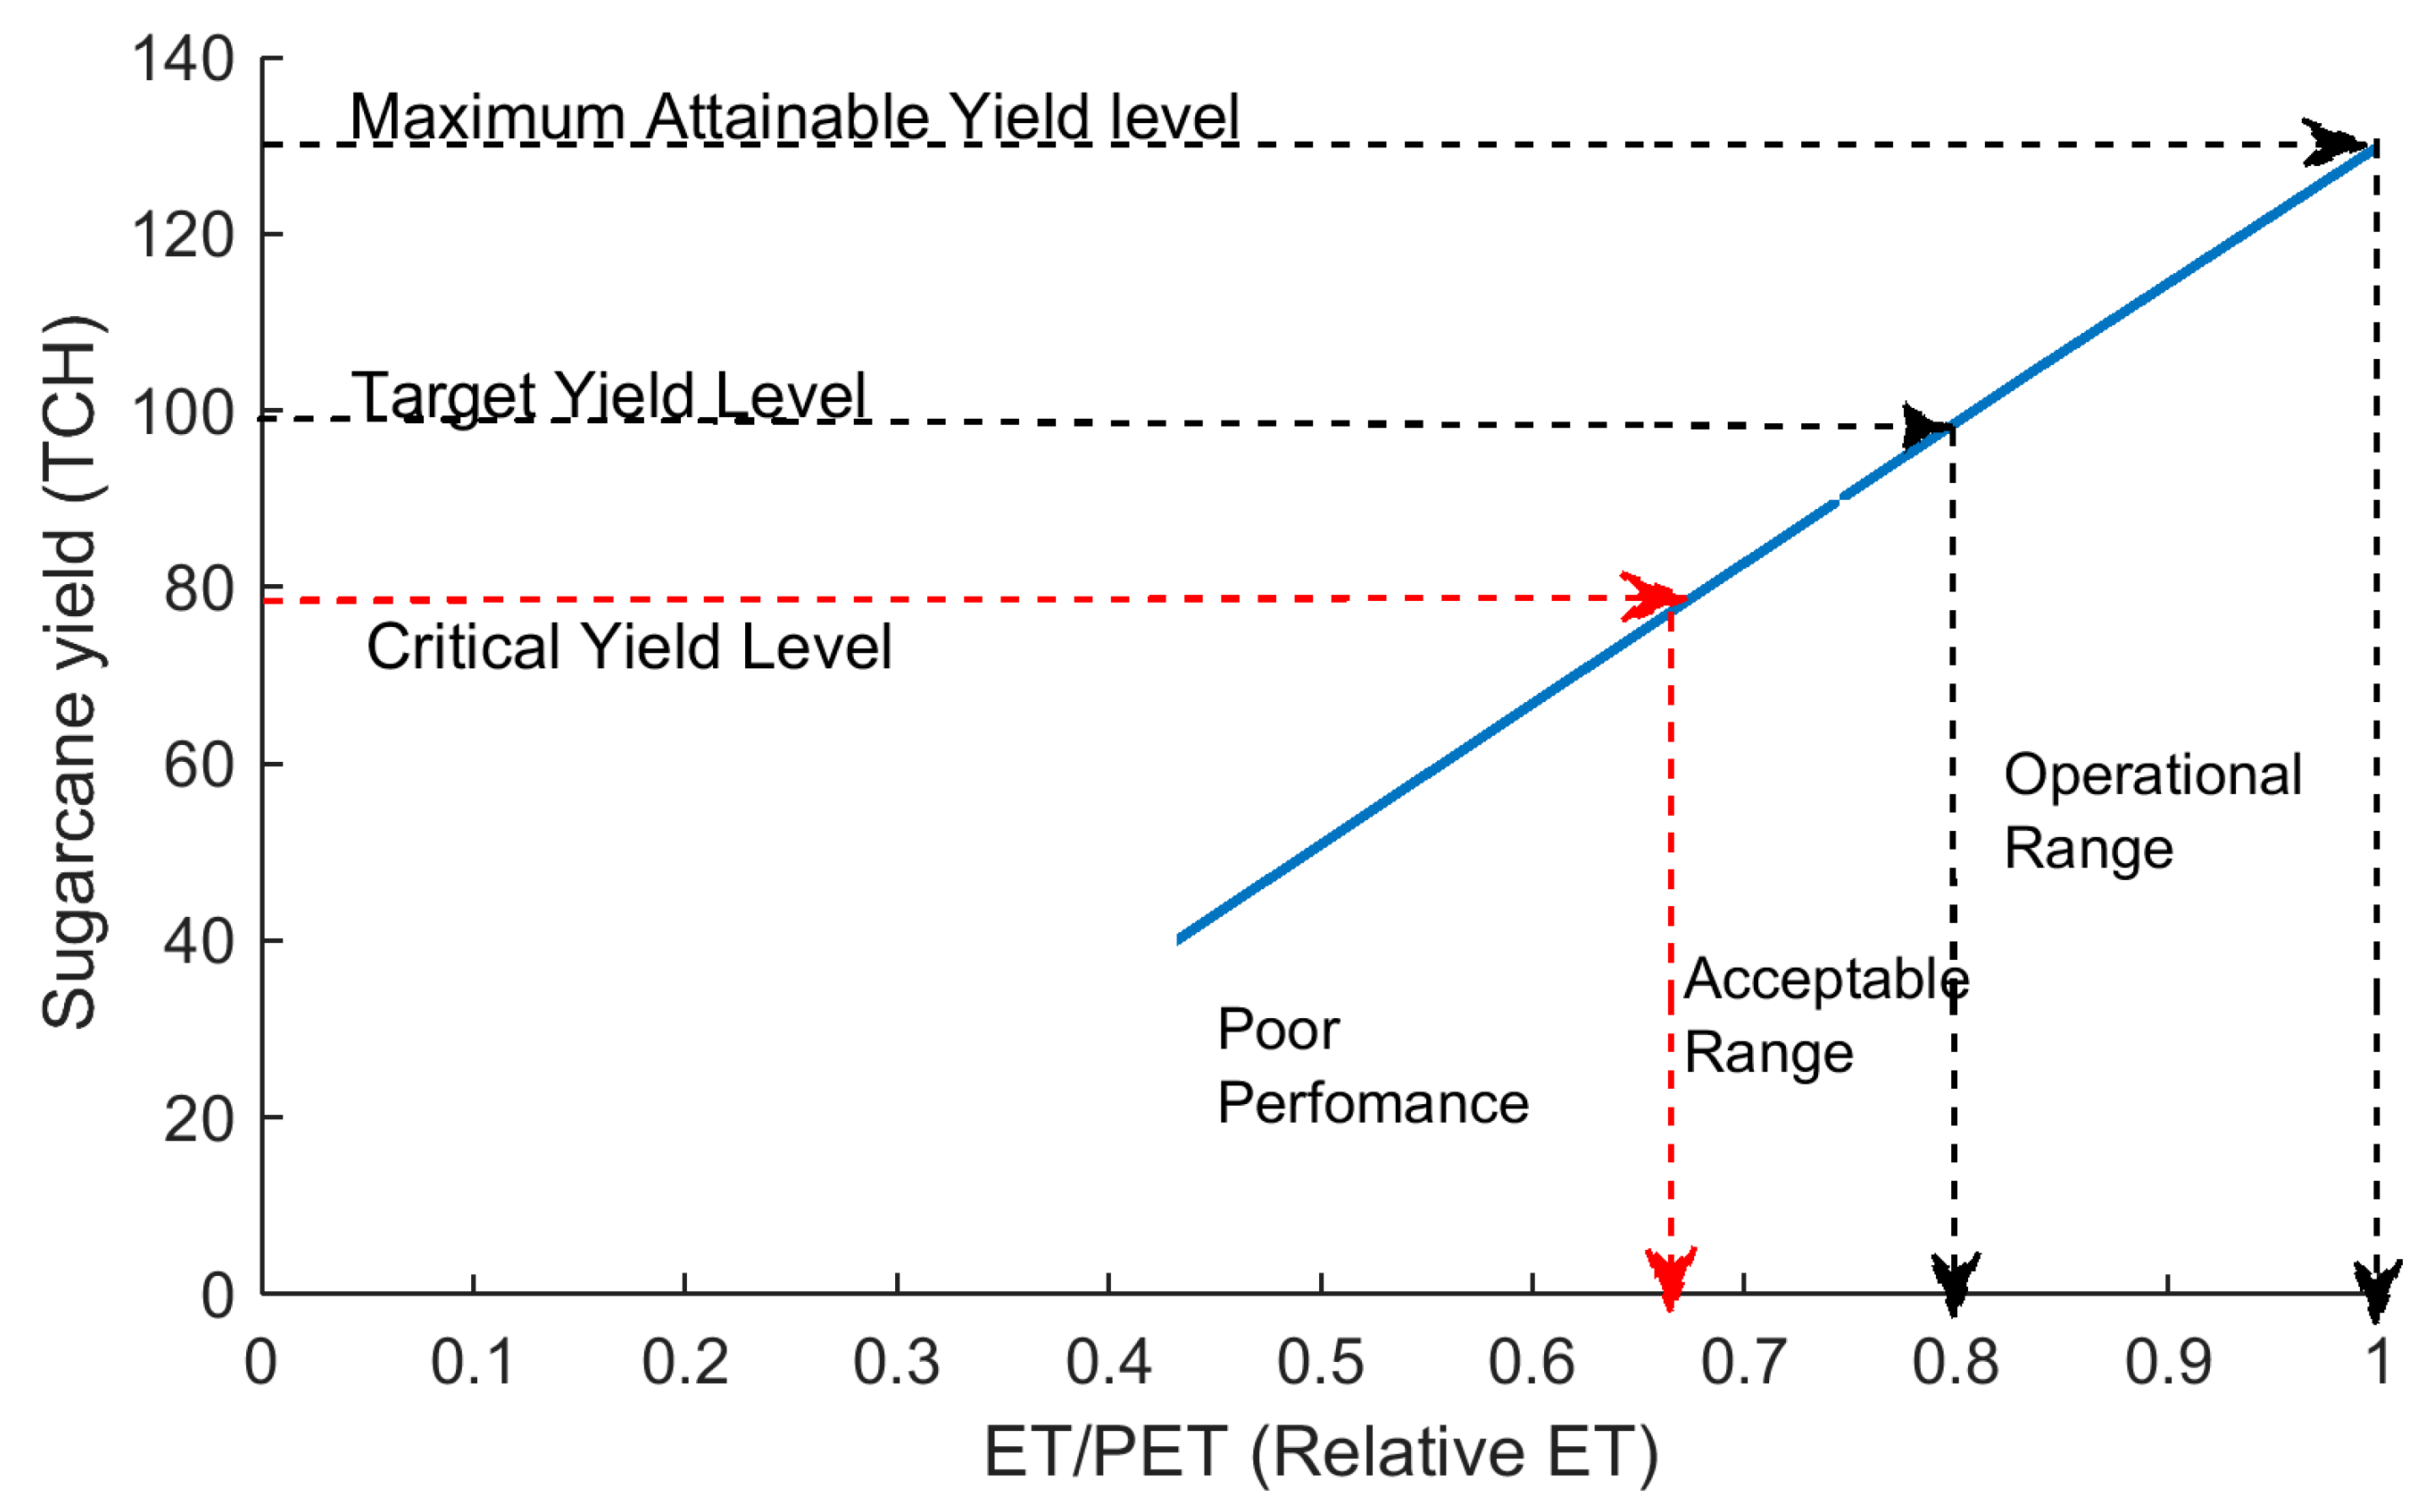
The Y-ET relationship computed using Equation 1 above was used to predict the reduction in sugarcane yield when soil water inadequacy would cause crop stress. Y was represented by the actual sugarcane yield. The actual evapotranspiration, ET, over the growing season was estimated from the Ensemble ET. The industry PET norm was used to represent potential evapotranspiration over the growing season. Target and critical sugarcane yield was used to determine the ‘operational range’ and ‘acceptable range’ of relative evapotranspiration. The target and critical sugarcane yields are selected based on sugarcane production statistics (Issued by Swaziland Sugar Association from 1969 to 2012). The average yield for the sugarbelt is 105 TCH with 14.26 TSH and the maximum yield is about 130 TCH (maximum attainable yield by growers—not the average industry yield). In view of the difficulty associated with attaining the maximum average yield by every grower in all seasons, the target value was set at 100 TCH. This is in line with the yield used by new smallholder entrants on their business plans. The critical sugarcane yield was established by considering the break-even point for the sugarcane growers. In order to recover the investment cost, industry practice dictates that sugarcane growers need produce above 80 TCH. Below this threshold replant must be initiated and this usually occurs on the 10nth ratoon (A ratoon is the practice of harvesting the sugarcane by cutting most of the above ground biomass but leaving the roots and growing shoots intact so the plant recovers and produces a new crop). Therefore, the corresponding levels of ET/PET, according to Equation (1), to achieve the critical, target and maximum yield was estimated at 0.68, 0.8 and 1.0 respectively [48,52]. Considering this, the defined range for poor, acceptable and operational yields used to assess adequacy in this research is shown in Figure 4.
The irrigation schedules were defined using the ET/PET ratio and were 1.0 and 0.8. Research has indicated that there was no significant reduction in sugarcane yield in Swaziland with the drier irrigation schedule of 0.8 [53]. Therefore 0.8 established to be the target value for adequacy in this research.
Reliability is defined as a measure of confidence in the irrigation system to deliver water in accordance with the service agreement [33]. This criterion was quantified as the temporal variation of water consumption across an irrigation season, which is an indication of irrigation water abstractions and/or deliveries, and hence reflects on the level of irrigation service. Time series analysis of relative ET for 5 growing seasons starting from June 2005 until October 2009 was used to reveal growers with unstable water use. The same method was applied in Haouz Plain [27], Morocco and in the Nilo Coelho irrigation scheme in Brazil [48]. Both studies used remote sensing-derived ET to assess irrigation performance.
To reflect on productivity, CWP was used. CWP is the physical biomass production measured against water consumed via ET [26,54,55,56]. In this study we used beneficial sugarcane biomass that is defined as the tones of sucrose produced in a hectare (TSH/ha) as the measure of physical biomass production. For water consumed, we used ET per season as the measure. The pixel based ET data was aggregated to seasonal ET per farm using the sugarcane farm boundary maps. The CWP was then described in kilograms of sucrose produced per cubic meter of ET (kg/m3) per grower and summarized per cluster.
The overall performance of the sugarbelt was expressed using the average CV for all the four chosen indicators [48]. Table 2 presents the summary of all the indicators used in this research. Based on the average CV, the ‘bright spots’ and ‘hot spots’ were also be identified [57]. These can be defined by each of the cluster categories, as well as combinations of the cluster categories (e.g., between scale, or a management regime within a location). To assess the best performers, or ‘bright spots’, across all indicators, the CV was first estimated for each indicator for each cluster or assessment group. This is excluding equity, as it is already expressed in CV. Next, the average CV was taken across all indicators for the cluster. Each indicator was weighted evenly. The bright spots are defined as the best performing farms (lowest CV) or clusters and hot spots are defined as the least performing farms (highest CV). This concept is based on the target or attainable performance being present locally.

3. Results

3.1. Evapotranspiration and Potential Evoptranspiration

The most frequently occurring ET value (the mode) was found to be around 1100 mm/yr. Miller-cum planters in the north (Royal Swaziland Sugar Corporation) and south (Illovo Sugar Limited) average ET was 1079 and 1100 mm/yr respectively and 1000 mm/yr was recorded in the Inkomati sub-basins. Malkerns is the only cluster of sugarcane growers located in the lower Middleveld. It is also the only cluster with an annual average rainfall (918 mm/yr) that exceeds ET (848 mm/yr). All the other sugarcane growing areas, which are located in the Lowveld, had an annual ET greater than the annual average rainfall.
The annual average ET for farms with different irrigation methods showed little change. Center pivot systems with average ET of 1142 mm/yr, had the highest ET and the farms equipped with sprinkler irrigation systems had the lowest at 1028 mm/yr. The annual average ET for farms with drip and furrow systems were 1090 and 1070 mm/yr, respectively.
PET in this study was based on the industry norm PET by SSA. The comparison of this PET value and the 95 percentile actual ET is provided in Table 3. The average PET, of 1250 mm/yr, is 9% higher than the average 95 percentile actual ET in different grower clusters. This shows that the adopted PET, i.e., industry norm PET, provides a fairly accurate representation of PET in Swaziland. Further comparison showed that the upper range of PET, 1348 mm/yr and 1365 mm/yr, is in agreement with the 1400 mm/yr figures reported for sugarcane in South Africa [44,58].

3.2. Irrigation Performance Assessment

3.2.1. Equity

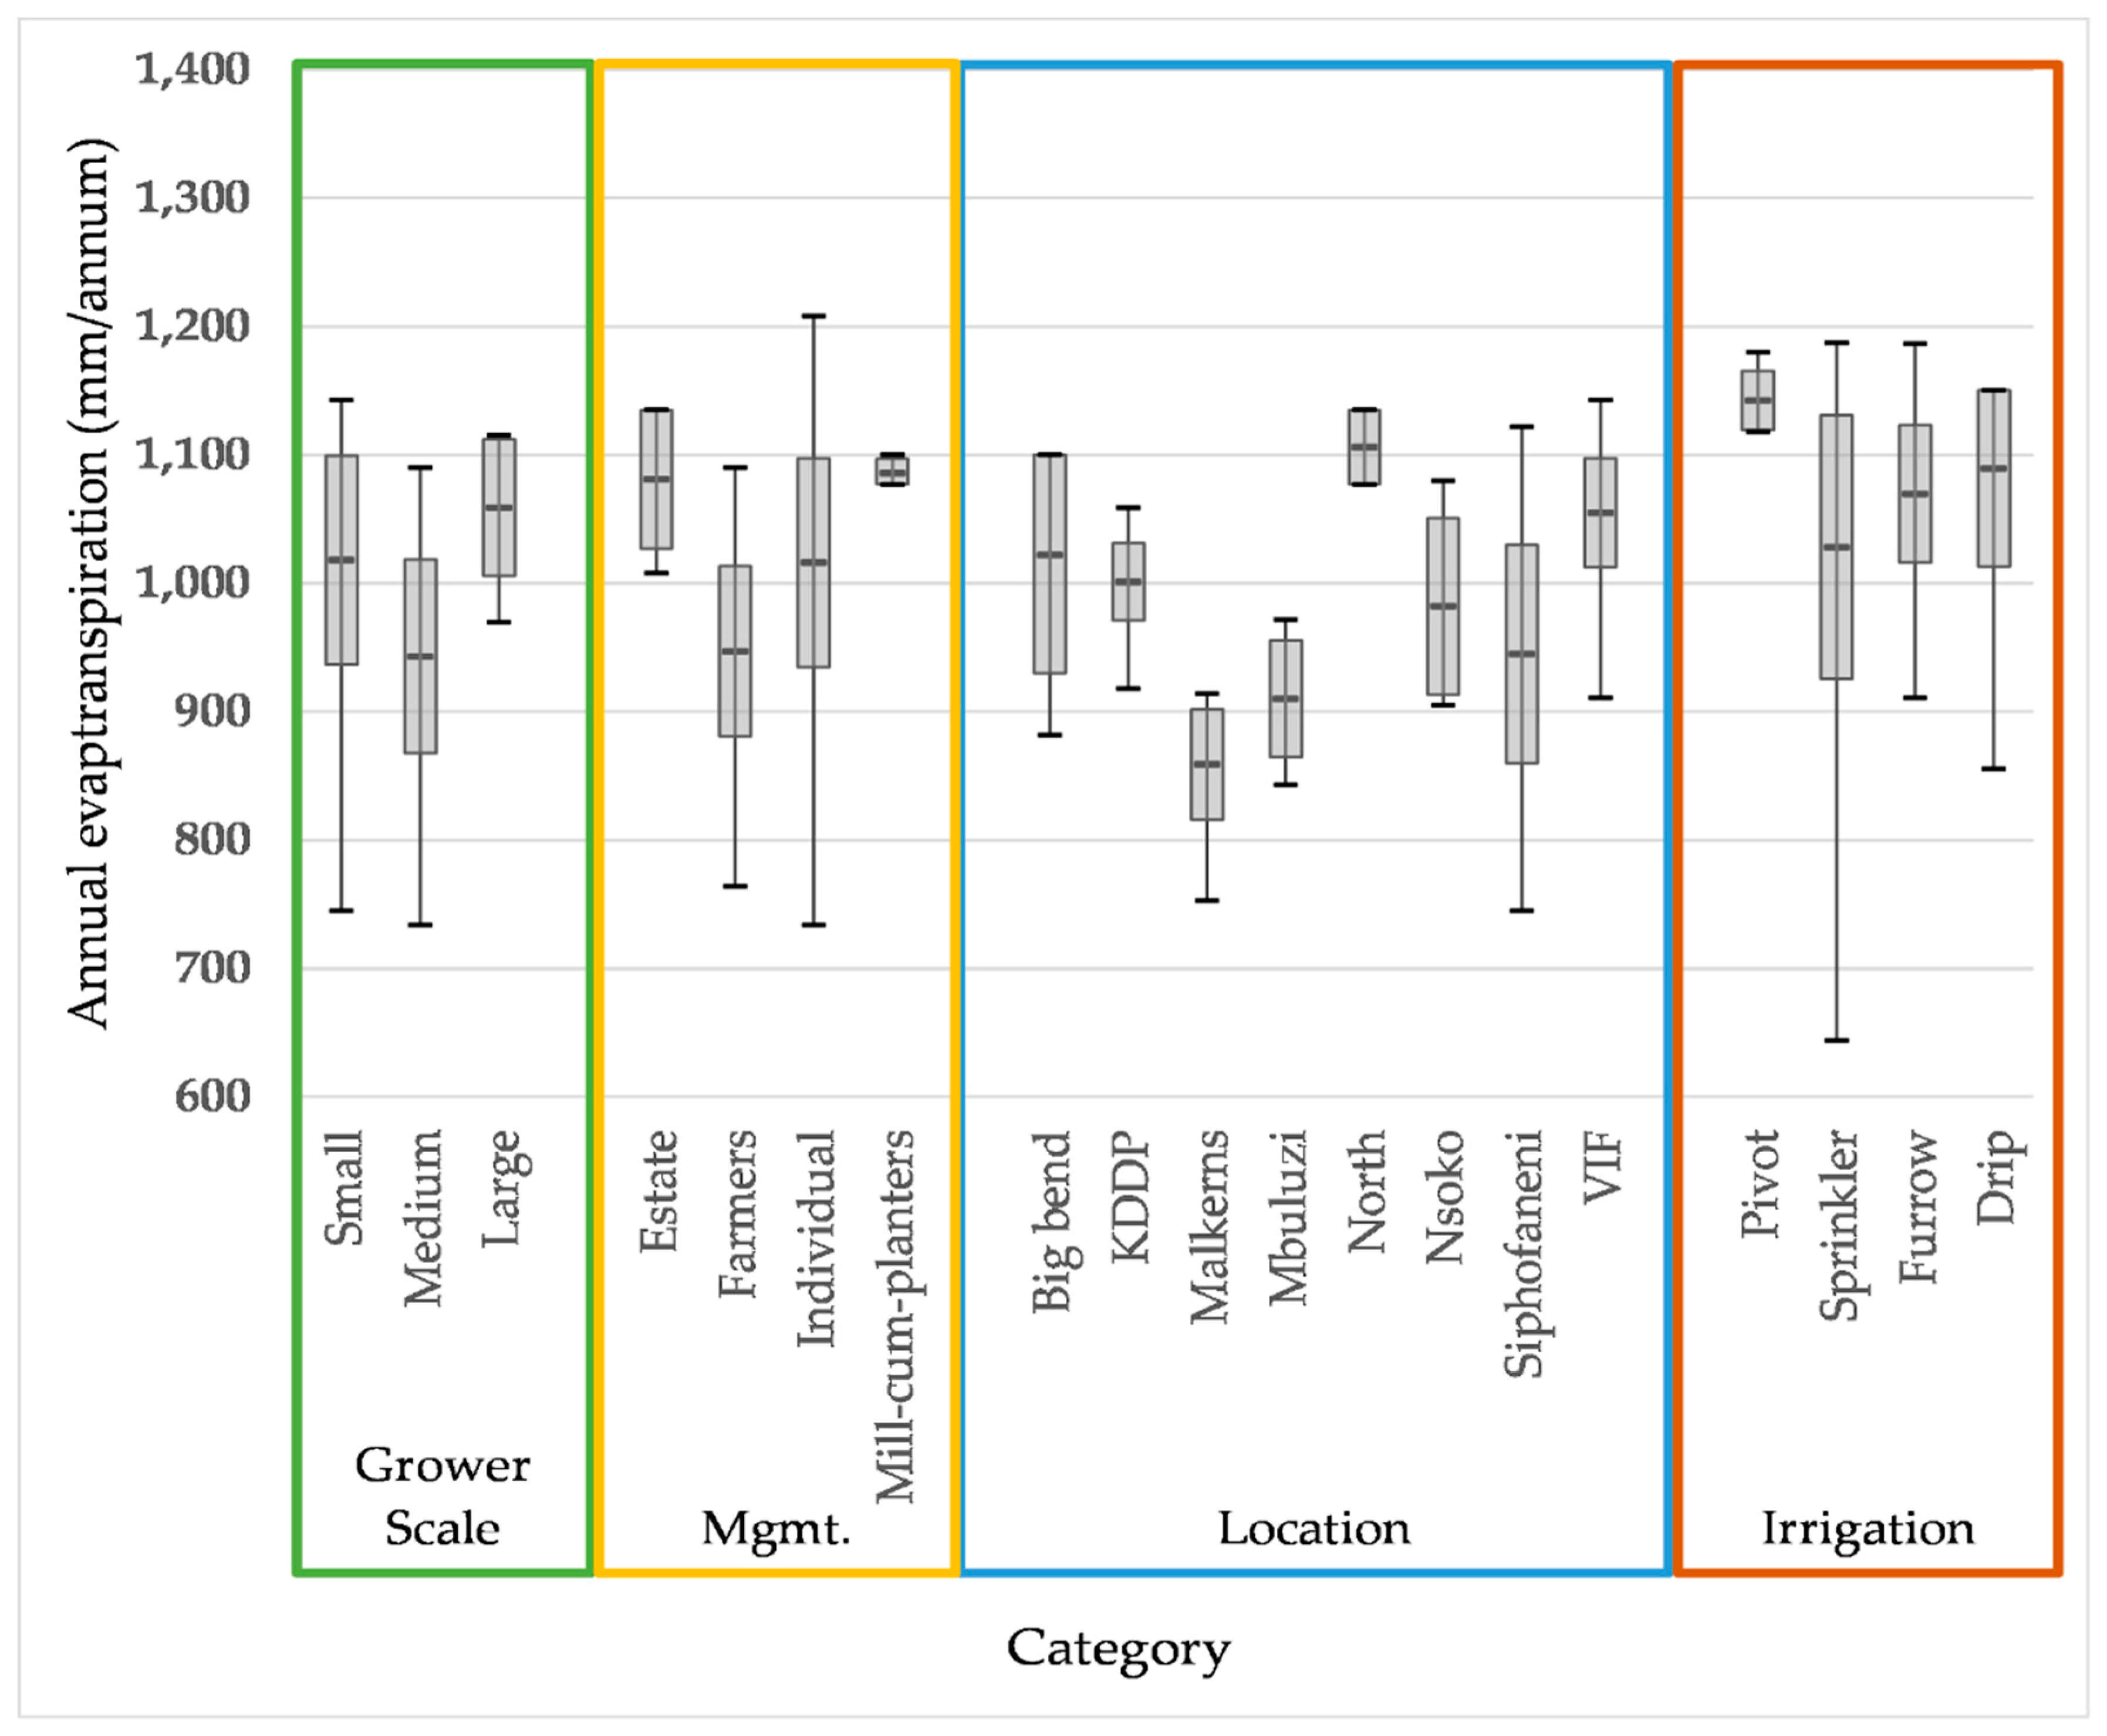
Figure 5 shows the average annual ET for sugarcane in a different grower cluster. Rather than presenting quartiles, the box and whisker plot shows minimum (lower whisker), maximum (upper whisker), mean (middle bar in the box) upper CV ranges (lower and upper bar of the box). The maximum ET values vary from 5% (North) to 25% (VIF) greater than the minimum ET based on location, 2% (Mill-cum-planters) to 65% (individual growers) greater than the minimum ET based on the management regime and 15% (large scale) to 53% (small scale) greater than minimum ET based on the grower scale. However, due to the distribution of the ET, the CV is relatively small compared to the range i.e., a high density of ET values around the mean or a low standard deviation compared to the mean. Small and medium scale farmers, with a CV-value of 0.08 (8%), have the highest heterogeneity in water use when compared to the large scale producers, with a CV of 0.05 (5%). A further breakdown of the ‘scale’ cluster into a smaller group characterized by the management regime revealed that equity within the three sugar mills is almost 100%. Individual growers, on the other hand, have the highest heterogeneity with a CV of 8%, which despite being higher than the sugar mill, is within an acceptable level of equity (<10%).
The water use of growers clustered according to the location of the different irrigation schemes was also investigated. Sugarcane farmers located in the southern sugarbelt (i.e., Big Bend, Siphofaneni and Nsoko) have the least water consumption uniformity when compared to growers established in the northern sugarbelt (i.e., KDDP, Mbuluzi, North and VIF). The highest equity in water consumption in this cluster was recorded in the KDDP, primarily formed of Farmers Associations, and within the ‘North’ cluster constituted by the Simunye, Mhlume and Tabankulu Estates.
It must be noted that the CV of ET, the indictor for equity, across all the clusters were found to be lower than the bias of the ET product used (11%). Hence, the results of the equity assessment in this study could be affected by the uncertainty of the ET product and must be treated with caution when drawing any conclusions and recommendations.

3.2.2. Adequacy

The RET of medium scale growers, in particular Farmer Associations and Big Bend, Nsoko and Siphofaneni-based growers are almost on the critical threshold of 0.68 (~0.7). Moreover, these growers recorded the heterogeneity in water stress as indicated by the CV of RET. Large scale growers, managed by Miller-cum planters and Estates, located at Komati and North are within the ‘operational range’. The rest of the growers are operating below the target level. Mbuluzi based growers, on the other hand, were found to be experiencing severe water shortages with RET below the critical threshold of 0.68. The minimum RET values indicate that some growers are experiencing severe water shortages, operating at or below the critical threshold in the ‘poor performance’ zone. Farms with low CV values are expected to experience nearly optimal sugarcane development, whilst the stress that occurred in FA and IG could result in poorly developed crops. Irrigation systems managed by Miller-cum planter with RET of 0.80 and the least CV of 2% could be considered as the benchmark of adequate water supply for sugarcane growers in Swaziland. The average RET of all the growers is 0.75 with 0.06 standard deviation and 0.08 (8%) CV. Adequacy of water can be affected by reason beyond the general water availability, for instance smallholder farmers in VIF had issues with having continuous water supply during the study period due to issues over water bills.
Choice of irrigation methods did not appear to have a significant impact on the level of adequacy. Areas under the four different irrigation methods had RET ranging from 0.78 to 0.84, with the center pivot having the highest and the sprinkler the lowest of the four. The center pivot systems also had a very low RET CV of 2% while the sprinkler systems had a relatively higher RET CV of 9%.

3.2.3. Reliability

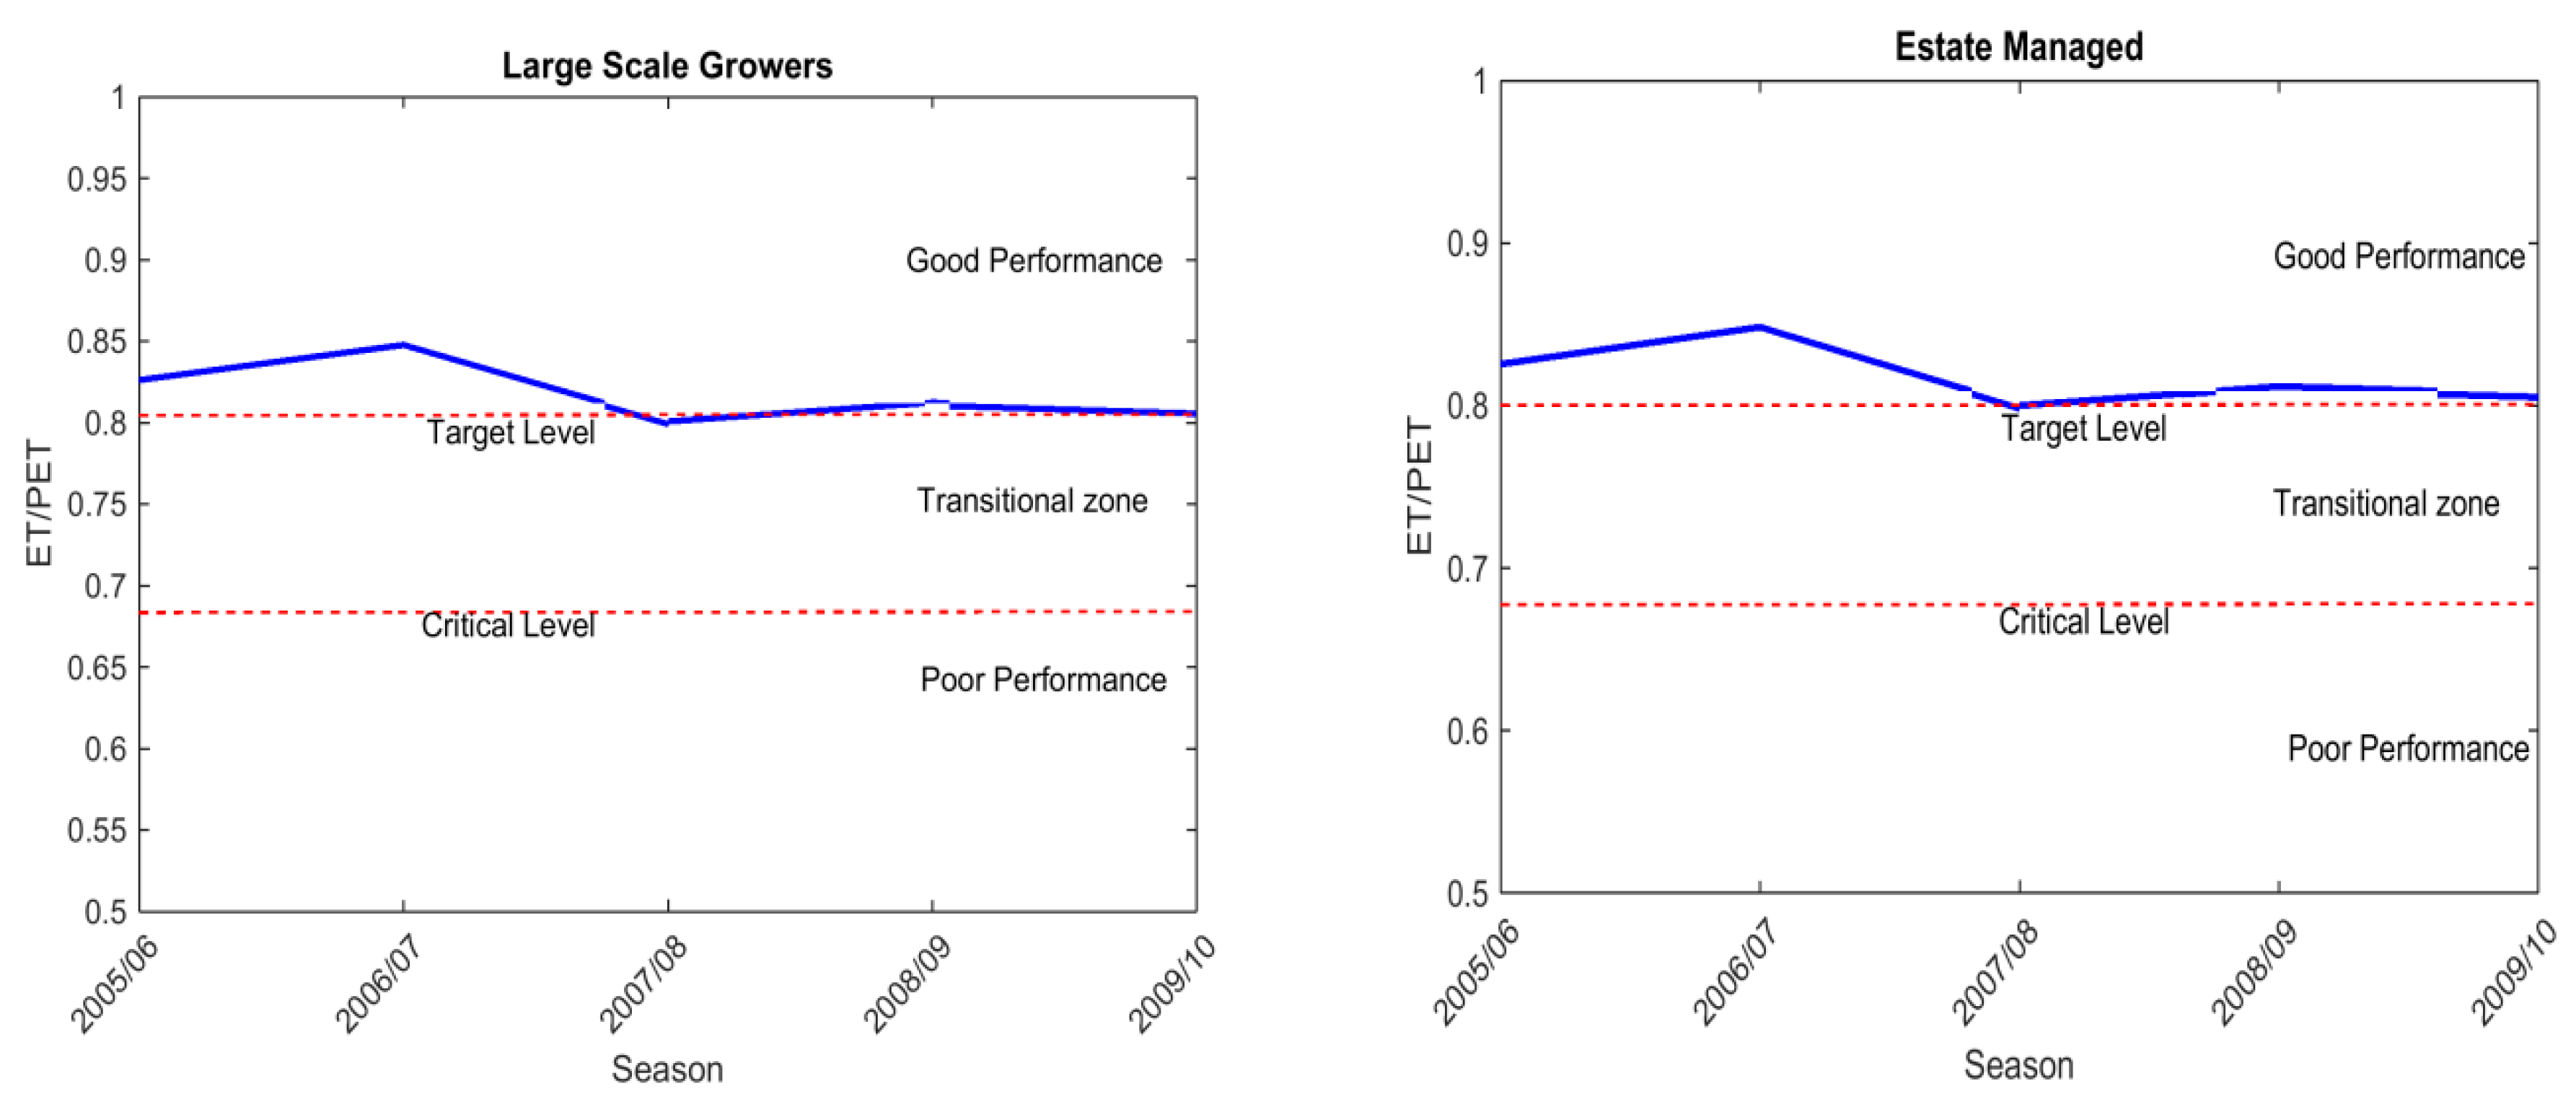
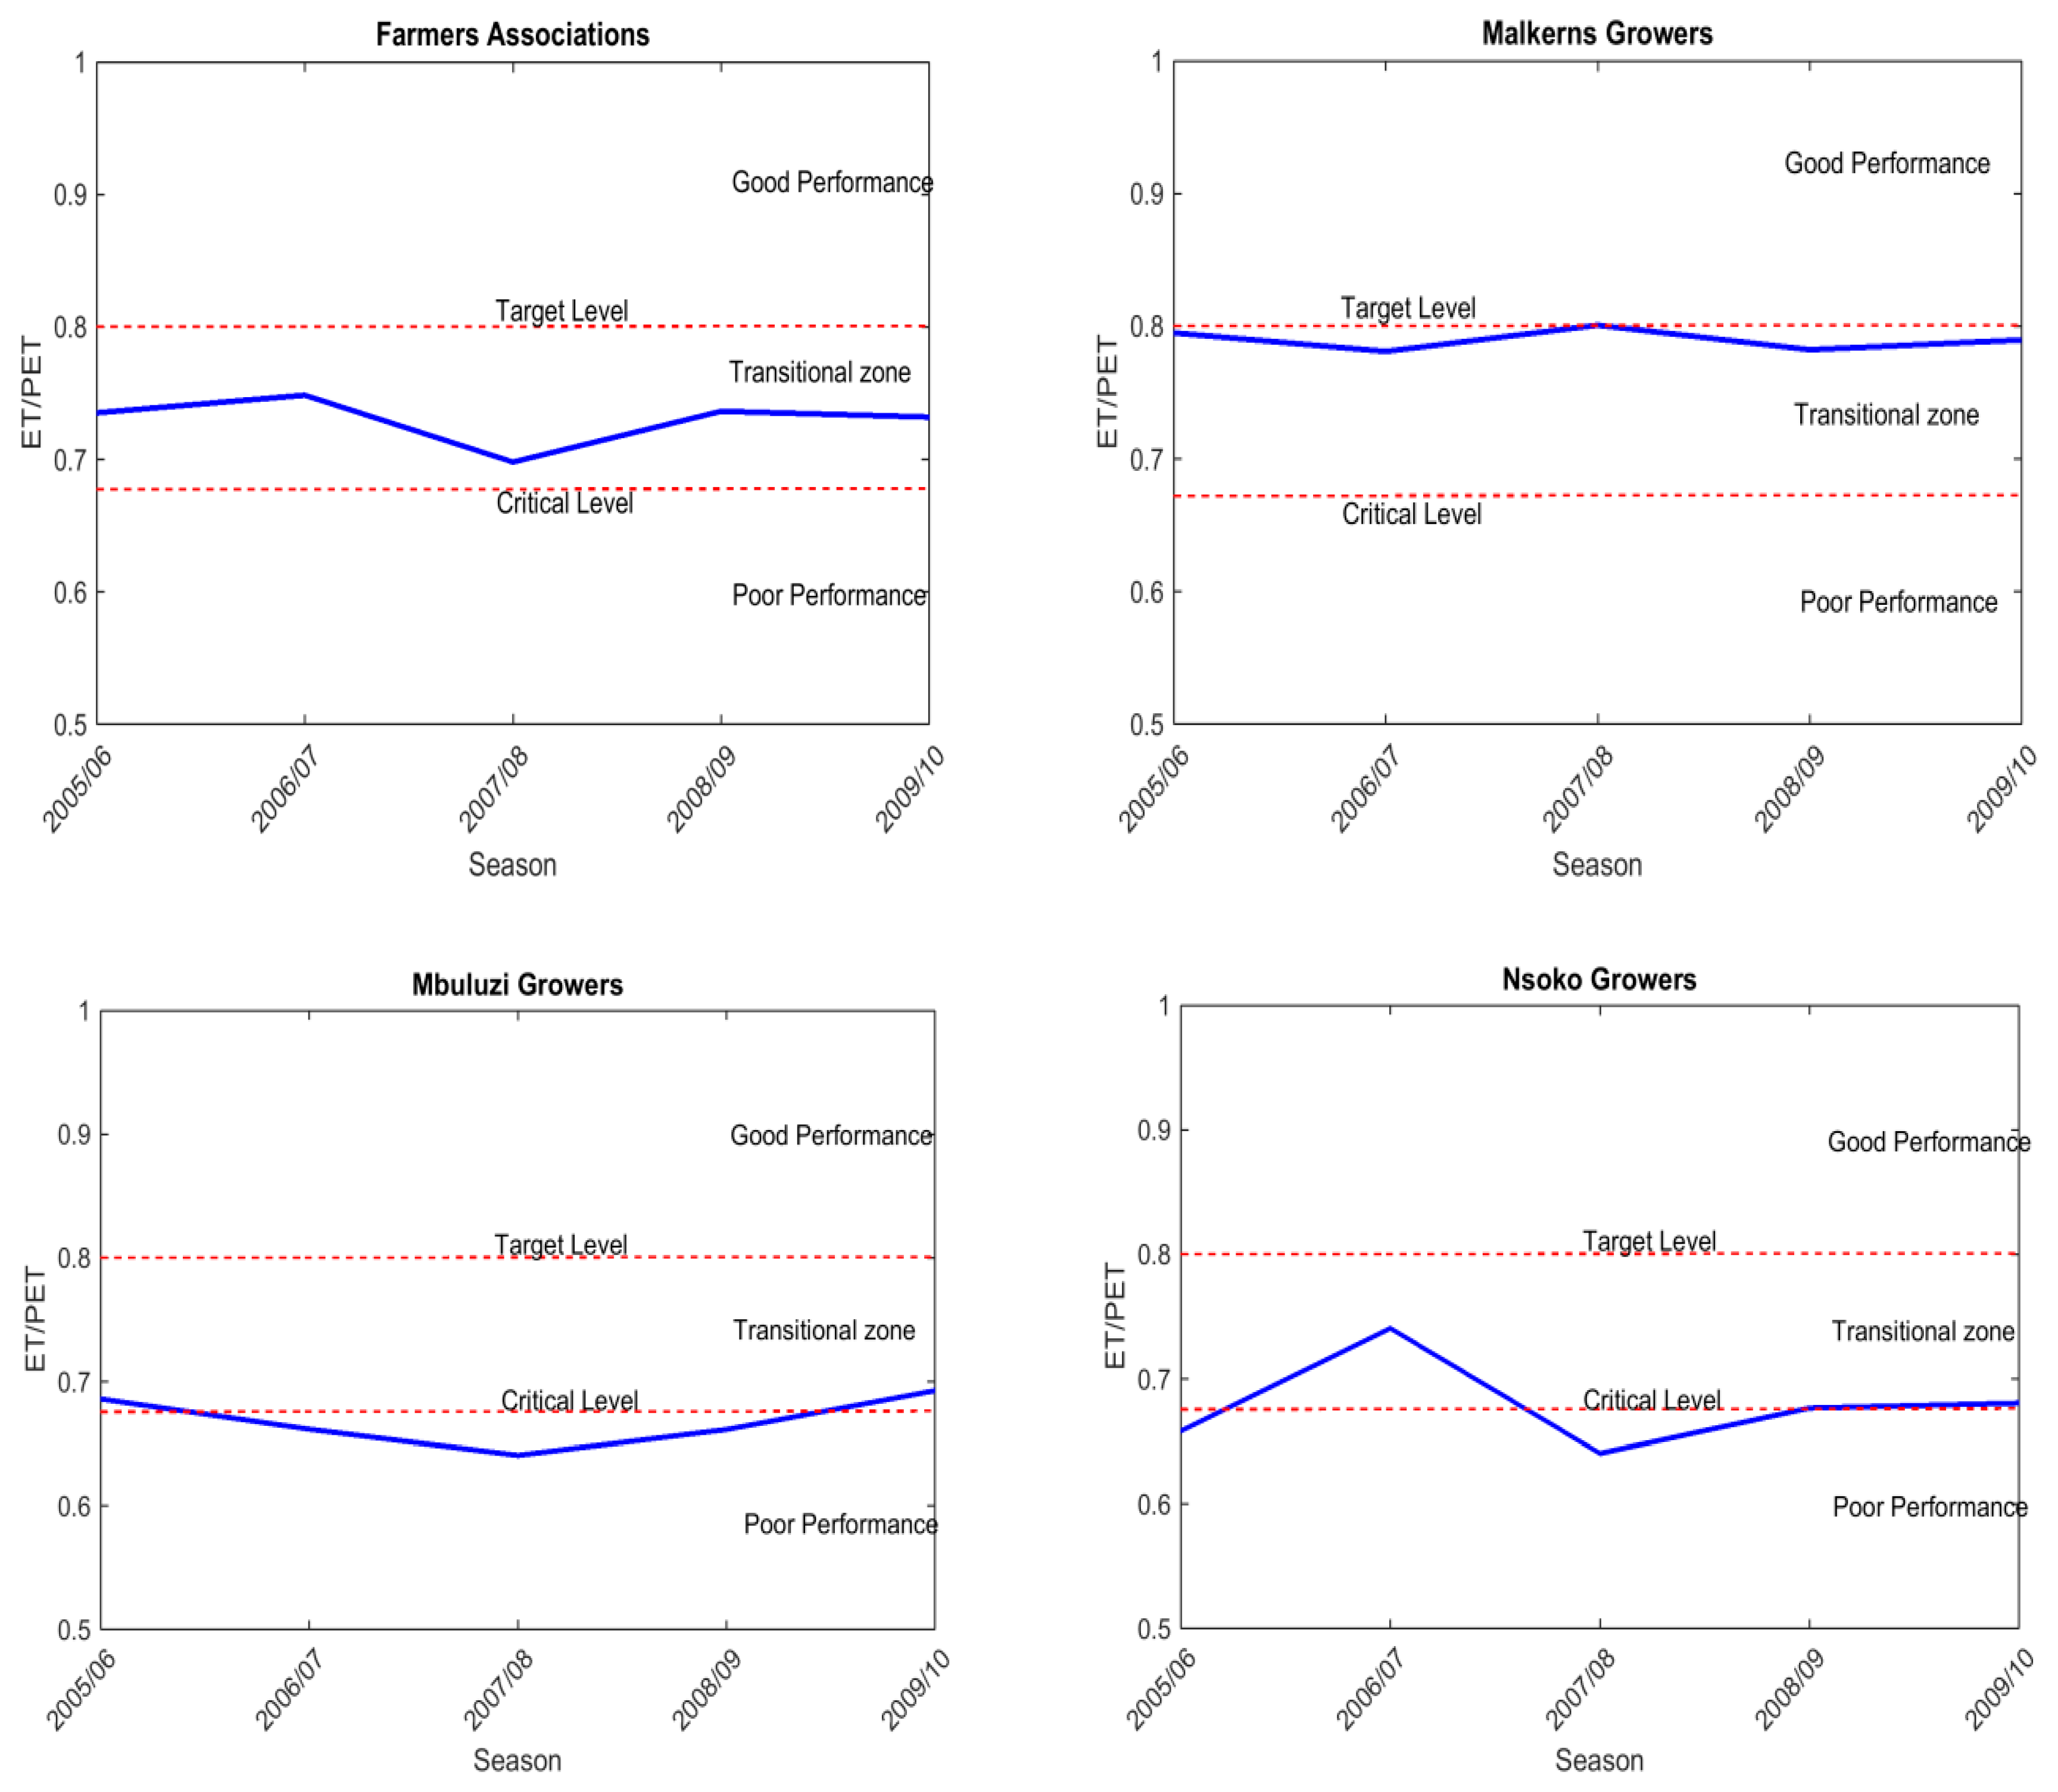
Using time series of relative ET (Figure 6), the absolute deviation from the target level was analyzed for each of the clusters. The same trend was observed in all clusters; RET increased between the June 2005 and July 2006 seasons, a notable decrease is observed between July 2006 and August 2007. Thereafter, the slight increase in September 2008 is followed by a steady RET. Farmers Associations are operating closer to the critical threshold than any of the growers whilst Large scale and Estates managed irrigation systems are operating above the target level.
In order to elaborate further on the non-steady water use patterns that were observed, the ‘location’ cluster was investigated. From this evaluation, growers based in Malkerns and Mbuluzi showed a different trend. In three seasons, Mbuluzi-based grower’s ET/PET is below the critical level, indicating inadequate water use by sugarcane. The relative ET of Malkerns growers increased between the July 2006 and August 2007 growing seasons, contrary to all the growers in the sugarbelt. The highest non-steady pattern was observed in growers located in the southern sugarbelt, namely Nsoko and Siphofaneni growers. Ideally the crop water use is supposed to be steady or at least show an increasing trend.
The effects caused by the observed fluctuations in relative ET on sugarcane yield were investigated for each of the 5 growing seasons. The same trend between the observed relative ET trend and cane yield was observed (Figure 7). Similar to the relative ET trend, a notable increase in the average industry yield from 97.54 TCH to 101.06 was observed in July 2006 and declined to 98.5 TCH in August 2007 (Figure 7). In some clusters this ratio increased to above the target yield of 100 TCH, which was used in determining the target threshold of relative ET. The average annual yield during this 5 year investigation did exceed the target level of 100 TSH in July 2006 and September 2008, but did not reach the maximum theoretical attainable yield of 130 TCH. In October 2009 the average industry yield dropped to near the critical level. The critical level was calculated based on the 5th percentile of the average yield records in the past 30 years.

3.2.4. Crop Water Productivity

Sugarcane production levels in Swaziland are below average when compared to international production statistics. The average yield of small, medium and large scale growers, averaged from June 2005 to October 2009, is 87, 94 and 104 TCH with 12.4, 13.3 and 15.1 TSH respectively. The mean industry yield for this period is 95 TCH and 13.6 TSH. This is lower than the 120 TCH with 14 TSH considered by FAO as a good yield under full irrigation [59].
Water productivity levels on the other hand, were found to align with the CWP values published on regional and international literature. The average industry water productivity in Swaziland was quantified to be 1.42 kg/m3 with a range of 0.21–2.24 kg/m3 and a standard deviation of 0.34. Globally, water productivity in terms of sugarcane beneficial sucrose and ET was reported by FAO to range from 1.3 kg/m3 to 2.2 kg/m3 [59]. It has also been reported that there is a linear relationship between sugarcane yield and ET with a slope of about 10 kg/m3 and with a corresponding value of 1.3 kg/m3 for sucrose [60].
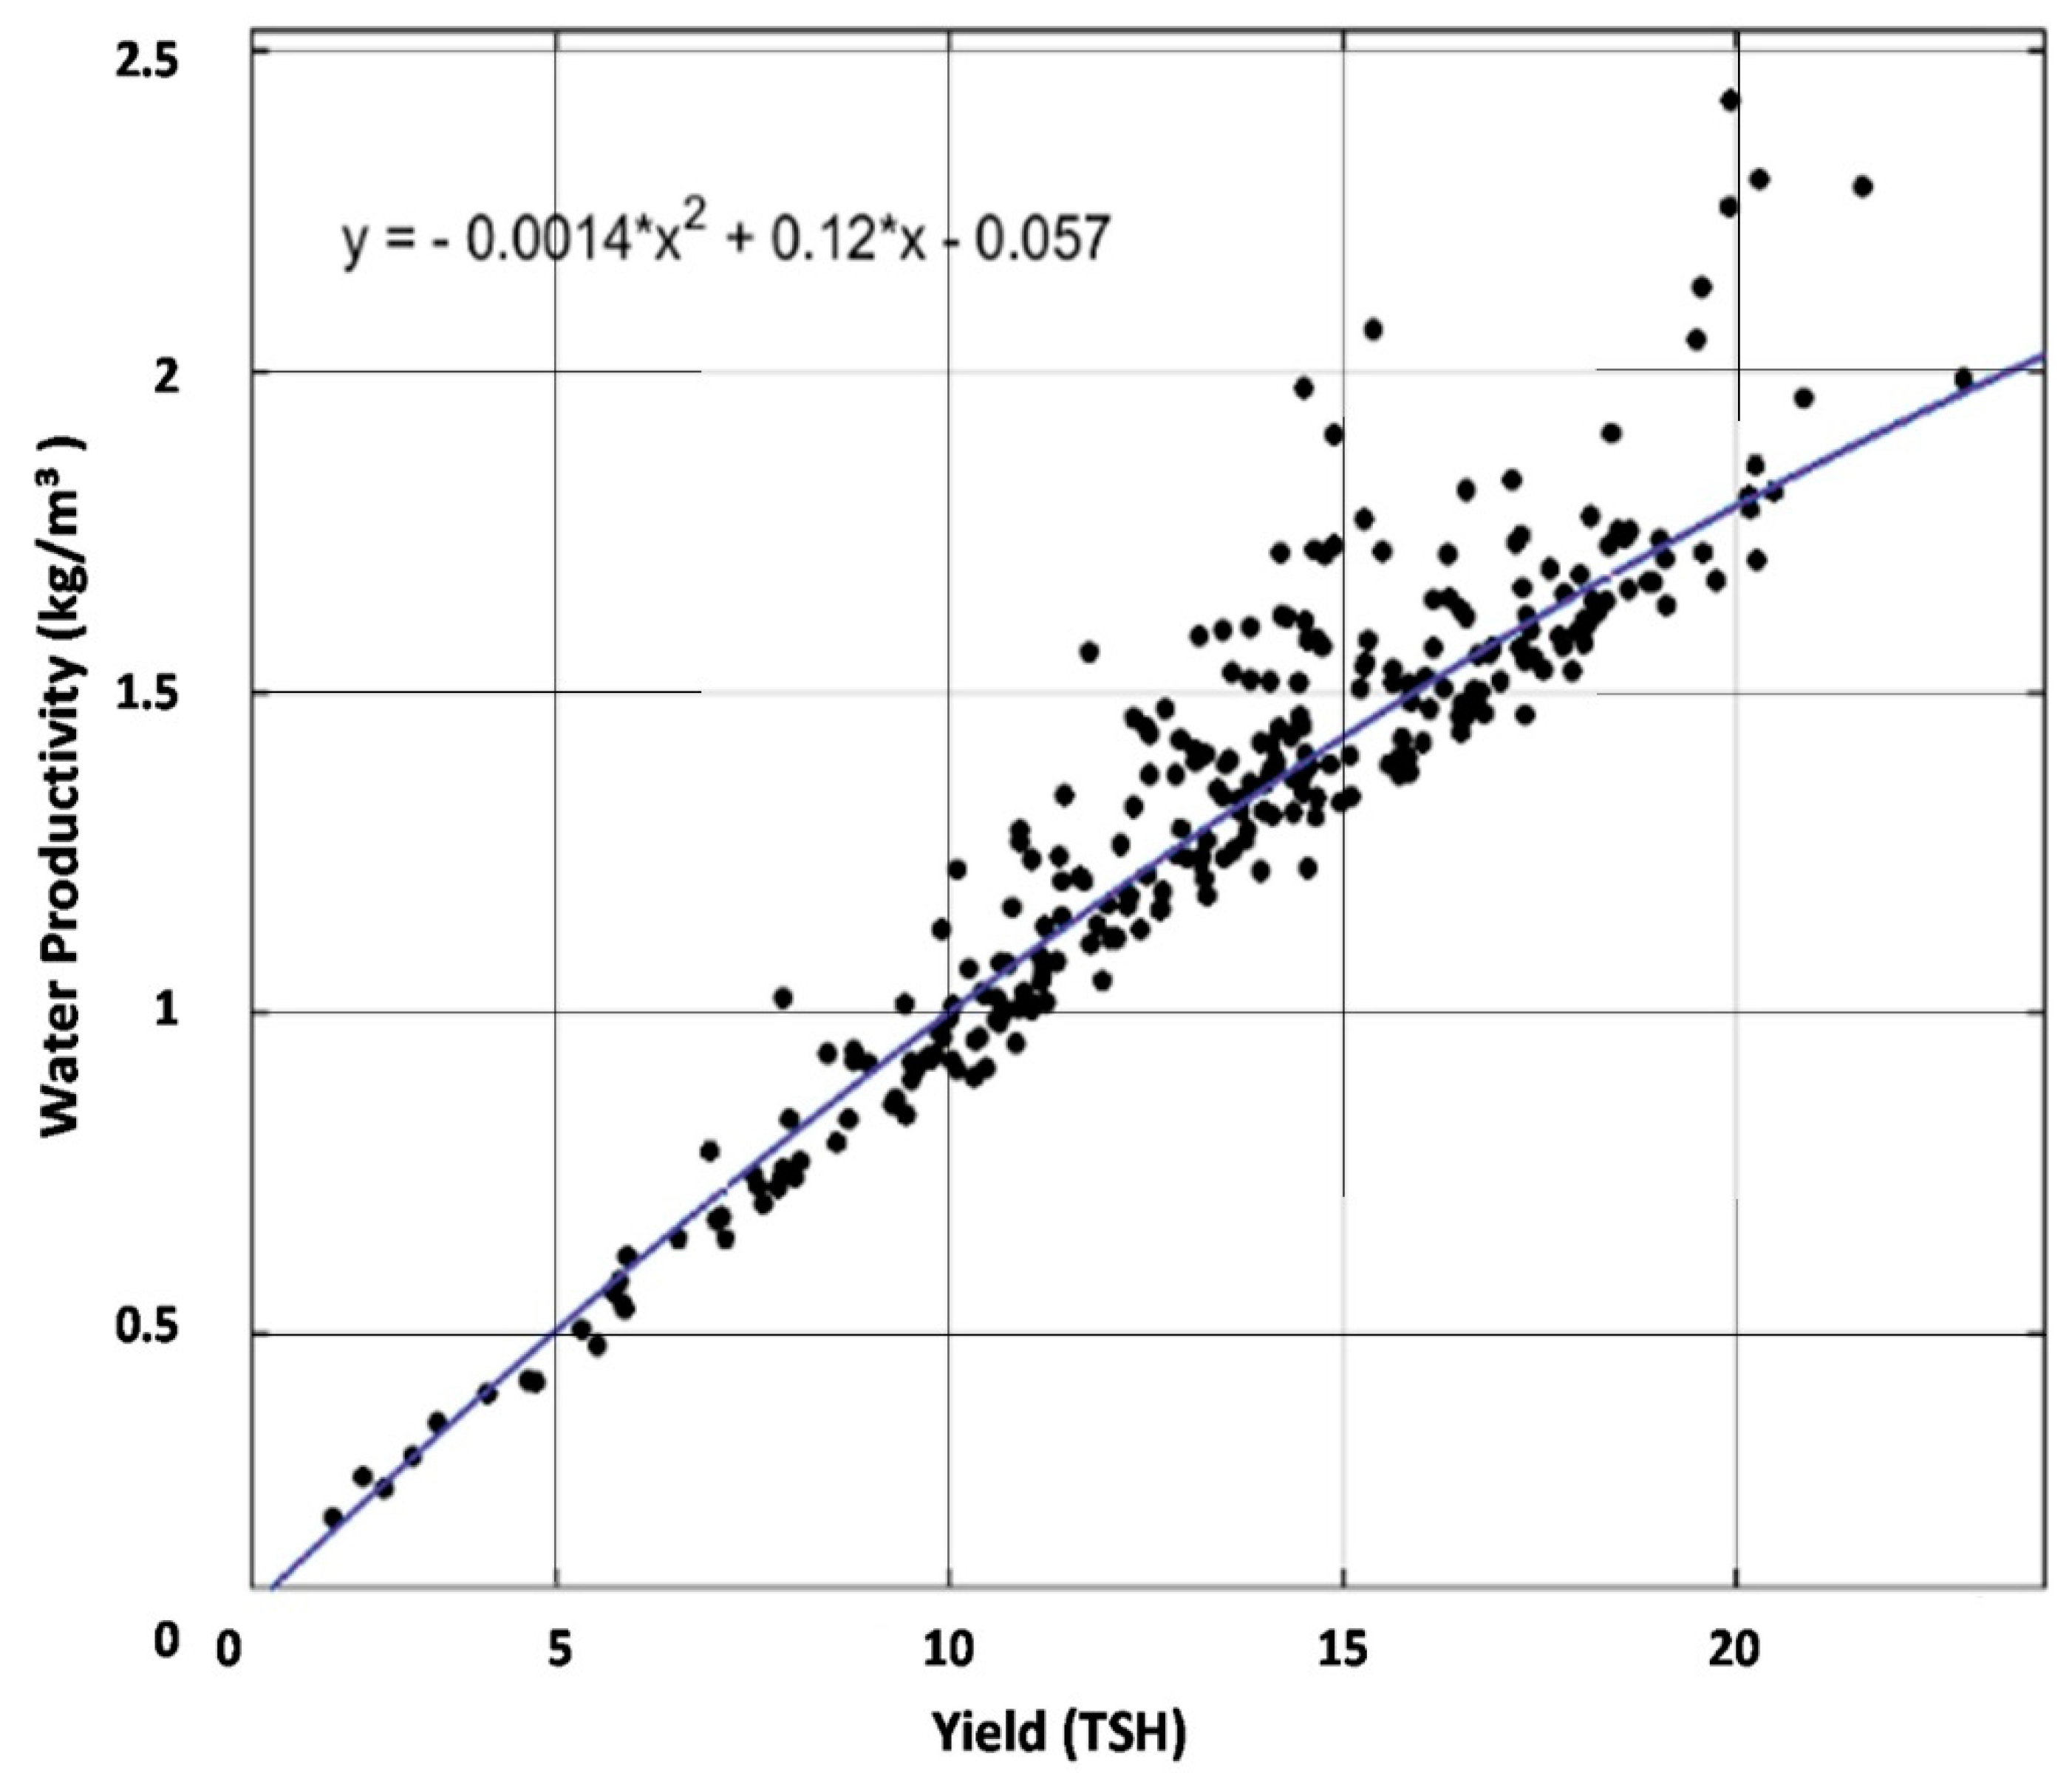
The CWP is plotted against the sugarcane yield in Figure 8. The best fit CWP-Yield regression function (R2 = 0.86) increases faster at lower yields and levels off at higher yields. This means that incremental gains in CWP become smaller with higher sugarcane yield. For, example, raising sugarcane yield from, say, 1 to 10 TSH will yield more gains in CWP than increasing the yield from 15 TSH to 20 TSH, which is similar to trends previously reported in literature [61] for maize and wheat. However, The CWP variability increases with increasing yield. This is converse to expectations, where CWP is expected to have a lower spatial variability with increased yield due to more optimal on-farm practices [62]. This may suggest that optimal conditions are not yet reached, or that the variations in climate zones are influencing the attainable maximum CWP. Some authors have attempted to normalize for climate due to its observed influence on CWP [62,63].
In order to further elaborate on the observed variations, the industry-wide CWP was segmented using the different clusters and is summarized in Figure 9. The CWP indicates an increasing relationship between the efficiency of water use by sugarcane and grower scale. Small scale growers produce the least sugarcane per unit of consumed water at 1.20 kg/m3 and the most efficient sugarcane is produced by medium scale growers with 1.44 kg of sucrose per m3 of water. Estate Managed irrigation systems have the highest average CWP of 1.57 kg/m3 for the study period. 1.44 kg/m3 was recorded for Miller-cum-planters and the least water productive is Individual Growers, producing only 1.14 kg of sucrose per m3 of water. An investigation of CWP for sugarcane growers clustered based on the location of the irrigation schemes (or group of farmers) revealed that sugarcane produced by Malkerns based farmers was the most efficient with 1.63 kg sucrose per m3 of water. The least was Vuvulane Irrigation Scheme farmers with 1.02 kg/m3.
Among the different irrigation methods, center pivot had the highest CWP at 1.63 kg/m3. It was closely followed by areas under sprinkler and drip irrigation which had CWP of 1.52 kg/m3 and 1.48 kg/m3, respectively. Furrow irrigation, however, showed significantly lower CWP compared with the other methods. The CWP of furrow systems on average were 30% less than those of center pivot systems. The main contributing factor to this low CWP is the lower yield, 12.2 TSH, in the furrow system compared to center pivot’s performance at 18.6 TSH.

3.2.5. Relation of All Indicators

The link between the equity, adequacy and reliability indicators is shown in Table 4. Sugarcane yield with water productivity were also included in this analysis of the performance indicators. The overall performance of the different clusters in the sugarbelt was expressed using the average CV for all indicators, which was found to be 18%. Large scale growers, managed by Miller-cum planters and Estates have the least variation in performance. Growers in the northern sugarbelt, i.e., North (RSSC and Tabankulu), Inkomati (KDDP) and Vuvulane are performing better (CV = 9%) than growers in the southern sugarbelt (CV = 13%) namely Siphofaneni, Nsoko and Big Bend.
The adequacy of water use by small scale growers is higher than medium scale, but they produce the least amount of sugarcane. Large scale growers have the highest crop water use but their water productivity is lower than mediums scale growers. This is likely attributed to the decreasing marginal CWP with increasing yield as identified in Figure 8.
The highest performing irrigation schemes in Swaziland were found to be managed by Estates and IG-managed schemes are the lowest performing. Miller-cum-planters and Estate’s ET have almost the same amount but the former were found to have higher sugarcane yields and with better water productivity. Water productivity of Farmer associations are almost identical to Miller-cum-planters, especially because their crop water use is much lower.
While there is a uniform distribution of water use in Vuvulane (CV of ET = 0.04), the least productive growers, in term of water productivity, in Swaziland are in this area (CWP=1.02 kg/m3). Sugarcane produced by Mbuluzi-based growers is experiencing crop water stresses but the crop water productivity is high. A surprising combination of low crop water use and good sugarcane yield was observed in Malkerns base growers. Consequently, the most efficient growers in term of water productivity were found in Malkerns.
Among the different irrigation methods, center pivot had the highest ET, adequacy, yield and CWP and the lowest CV. Sprinkler systems had the second highest CWP but performed lower than drip systems in yield. Drip systems showed higher ET and yield than furrow and sprinkler. Furrow systems had the least yield associated with their CWP, while their overall water consumption is close to those of sprinkler and drip systems.

4. Discussion

A CV value of value of 0%–10%, 10%–25% and >25% was classified by [64] to indicate good, fair and poor uniformity in water use respectively, therefore suggesting that all grower scales, management regimes and grower locations have good equity. However, the fact that some growers have achieved much higher equity within this range suggests that there is a room for further improvements for growers who have relatively lower equity. The lowest obtainable CV value from the systems being evaluated was considered as the target levels for equity indicators in this study, as this indicates best practice and the obtainable equity. The lowest obtainable CV under practical conditions in each of the clusters i.e., 0.01 (1%) observed from irrigation schemes managed by Miller-cum planters, 5% observed from large scale irrigation schemes and 3% for irrigation schemes located in the North was used as target levels of equity in Swaziland. The results therefore indicate that the greatest deficiency in the management of irrigation scheme is prevalent in growers located in the southern sugarbelt, i.e., Nsoko, Siphofaneni and Big Bend. The highest performance seen in the Miller-cum-planters and Estate may be attributed to good irrigation infrastructure and efficient crop husbandry.
Small and medium scale growers on the other hand were characterized by less uniform crop water consumption. This was the case for both FA-managed and IG-managed irrigation schemes. The difference in uniformity between Estate/Miller-cum plants managed irrigation schemes and small scale growers, especially those located in Siphofaneni, could be explained by either varying agricultural practices amongst farmers mainly due to financial difficulties, inadequate irrigation infrastructure or improper irrigation scheduling [65]. Uniform water consumption throughout an irrigation scheme should be expected when water is distributed equally and in a timely manner amongst growers, and where agronomic practices are optimal [33].
Lower equitable water deliveries (by water users associations) between growers was considered not to have contributed to the higher CV values because almost all growers in Swaziland obtain water directly from rivers which almost always support a sufficient amount of water for all downstream users [11]. Hence, the observed variation in equity could be attributed to differences in management, especially given the higher differences in CV between the management clusters.
The target level of relative ET quantified as 0.8 was found to be well acceptable for sugarcane as it was supported by several local and international studies [23,48]. The same cannot be said concerning the critical level because several factors are required when determining the brake-even-point. Information such as: supply-demand interrelations, seasonal cultivation costs, price of sugar are all required to calculate the farmers’ returns on investment. This information was not collected because it was considered to be outside the scope of this research. The yield estimate of 80 TCH used in calculating the ratio of 0.68 for critical level was however considered to be a fair representation of the break-even point because it was based on expert knowledge and was adopted by all stakeholder as an industry norm.
In general while the equity is high in sugarcane irrigation in Swaziland, adequacy in many clusters is below the optimal level. Water deficits is observed more often in schemes which are managed by Farmers Associations, especially those based in Siphofaneni, Nsoko and Mbuluzi. While the supply of water is not the constraining factor, the low adequacy indicates improper irrigation scheduling or recurrent breakdown of irrigation infrastructures that interrupts timely flow of water to the filed. The prevalence of under-irrigation in small and medium scale growers in Swaziland was also reported by [65,66] supporting the findings in this research. The deficit recorded in Mbuluzi-based growers (0.67) could have been caused by the fact that most of the Farmers Associations in this basin are using drip irrigation systems, which has been shown to be unfavorable for small scale farmers [67,68].
Several reviews [45] show the difficultly of quantifying reliability in the field. This is due to the complexity and cost attached into collecting long-term data on evapotranspiration, either through in-situ methods such as lysimeter or eddy covariance, or field water balance methods where water delivery and drainage data is required. The utilization of remote sensing-based measurements in this study made it possible to assess the reliability of water supply for the entire sugarbelt and for five growing seasons.
The observed relative ET trend could be attributed mainly to variations in rainfall patterns from 2005 to 2010. The peak in relative ET observed during the July 2006 growing season was attributed to the notably high erratic rainfall that was received, particularly, between January and March 2006. Both CHIRPS rainfall and the available weather stations data indicated significantly higher rainfall in this period when compared to all the other years. For instance, the Mhlume weather station in Vuvulane received approximately 480 mm within this 3-month period, an amount that is almost equal to the annual total of 600 mm for the Lowveld. At the beginning of the July 2006 growing season, there was enough soil moisture to enhance germination of new sugarcane stool and for crop establishment. Subsequent to this wet season, rainfall records indicate August 2007 to be the driest of all the seasons. This might explain the drop in relative ET observed in the same growing season.
The relative ET of Malkerns growers increased between the July 2006 and August 2007 growing seasons, contrary to all the growers in the sugarbelt. Malkerns is the only sugarcane growing area found in the lower Middleveld, characterized by annual rainfall average which is higher than ET. The different climatic conditions for these growers, as compared to those in Highveld and Lowveld, were perceived to be the main reason for this trend. Similarly, it was identified that varying climatic conditions caused the high season variation of relative ET between different parts of the irrigation system in the Khorezm region [23]. The observed water deficit in three seasons of Mbuluzi-based growers underlines the plausibility of the reasoning given earlier. The improvement in water use observed during the October 2009 season may be due to increased crop water use after sugarcane replant for selected growers yielding below 80 TCH that was initiated around the same time.
Sugarcane yield was found to correlate with the relative ET patterns. The low industry yield could therefore be explained by these fluctuations in relative ET. Growing seasons where the relative ET was high (implying minimal stress to the crop) cane yield was high and the opposite was also true. Primarily ET and yield are linearly related for a crop that is not constrained by improper agronomic practices, such as insufficient fertilizers or pest and disease infestation [59]. Several factors complicate this linear relationship, but under non-limiting conditions, with respect to other inputs, the linear relationship should not deviate [55]. A more significant variation in CWP originates from variant crop husbandry practices that influence potential yield of crop when water is not limiting [69].
The highest CWP was recorded under center pivot irrigation systems followed by center pivot systems. Contrarily to what was expected, the CWP under drip, a system acclaimed to have the highest irrigation efficiency of about 95%, was found to be lower than center pivot ad sprinkler irrigation systems. This finding was not just constrained to Farmer Associations and/or IG; but Estate managed irrigation schemes were included in the analysis. The ease of operation combined with high application rates and the fact that center pivots and sprinklers are highly visible, making it easy for the grower to spot and remedy faults, was believed to have contributed to its high CWP. While drip irrigation can be associated with high CWP [70], many researchers have identified that drip irrigation can be sensitive to operation and management, especially for small scale growers [67,71].
The lowest CWP was observed in Vuvulane. Sugarcane productivity in this 1470 ha irrigation scheme was affected due to issues with water supply from Mhlume canal system. The VIF is a smallholder scheme that is predominantly under furrow irrigation system, this further exacerbated the reduction in CWP because the furrow irrigation system was found to have the lowest CWP. In addition the fertilizer application rates by smallholders are lower than their commercial counterparts in other areas [72]. Contrary to the observed low performance of Farmer Associations and IG, better crop growth conditions and better sugarcane management practices, resulting to high yields, is observed in Estate Managed and Miller-cum-planters irrigation schemes.
Increasing water productivity is of vital importance given the growing competition for water in Swaziland. To better inform intervention to improve CWP, additional analysis is required to ascertain the underlying causes of good and bad CWP levels. For example, ground investigations on soil types, sugarcane variety and planting density may further explain the observed water productivity levels. These efforts must be coupled with a water accounting system that informs policy makers on better allocation of water and shows where “real water savings” can be achieved [73].

Relationship of All Indicators

The overall performance of the different clusters in the sugarbelt, expressed using the average CV for all the performance indicators is 18%. Large scale growers, managed by Miller-cum planters and Estates have the least average variation in performance. Growers in the northern sugarbelt, i.e., Tabankulu Estate, RSSC, KDDP and Vuvulane are performing better (CV = 9%) than growers in the southern sugarbelt (CV = 13%), namely Siphofaneni, Nsoko and Big Bend. The results indicate that under good management, high water consumption (ET) should correspond to high cane yield and high water productivity. Estate and Miller-cum-planter managed irrigation schemes are the ‘bright spots’ in the sugarbelt of Swaziland. IG-managed irrigation schemes, found to be under-performing in all performance indicators, are the ‘hot spots’.
The surprisingly low average crop water use and high cane yield of medium scale growers characterized this cluster to be the ‘bright spot’ in terms of CWP. This relates to the use of drought tolerant varieties such as N25 by the medium scale growers in Swaziland, covering an area of almost 17,000 ha. The large scale growers, however, have the lowest spatial variability in terms of CWP and could be considered the ‘bright spot’ in terms of the uniformity of farm management practices. This is an expected outcome given the increasing heterogeneity of management practices by decreasing the average farm sizes.
CWP shows the highest variation, i.e., the mean CWP CV among categories was approximately 2.5× greater than the CV of ET and RET. For example Vuvulane was a top performer for equity (3rd lowest CV) and adequacy (2nd> lowest CV), but did not perform well in CWP (2nd highest CV), which influenced its overall performance to put it as the 2nd lowest overall performer. This suggests that (1) the approach to assess the overall performance by averaging the CV of all indicators is useful, but limited, and (2) to understand variation in terms of output and overall performance at largescale, CWP can offer more as it links up with both water use and crop production. This is of importance when it comes to guiding regional or national level investment decisions which seek to formulate polices to improve agriculture.
Center pivot systems were the best performing irrigation method in almost all the indictors. While the difference was significant in aspects such as the CWP and the yield, the difference in adequacy was marginal. This is expected as the adequacy of water is related to the availability of the supply, which is more impacted by the location of the farm and type of the management than the technology used in irrigation. Drip systems showed no reduction of overall water consumption compared to sprinkler and furrow systems. This, as discussed before, is attributed to issues with proper operation and management of the drip systems, which leads to the lack of gains in water saving. Furrow systems are the ‘hot spots’ for improvement where the irrigation methods are concerned. The overall low productivity observed, both in terms of land productivity and water productivity, in furrow systems indicates that improvement must be made to bring up the level of productivity. There is a need for a focused study on this issue in which the specific contributing factors are identified and improvement recommendations are made.

5. Conclusions

This research assesses several aspects of irrigation performance of sugarcane in Swaziland, based on location, grower scale and grower management schemes. The findings indicate that water consumption patterns were most homogenous on a large scale irrigation schemes. Small and medium scale growers, on the other hand, were characterized by less-uniform crop water consumption. Utilization of remote sensing-based measurements in this study made it possible to assess the reliability of water supply for the entire sugarbelt starting from June 2005 to October 2009. Without RS-derived measurements, the task of quantifying reliability is far from trivial due to the complexity and cost attached into collecting long-term secondary data. The overall results of performance assessment indicated that growers in the northern sugarbelt are performing better than the growers in the southern sugarbelt. In terms of the managements regime, Estate and Miller-cum-planters managed irrigation schemes are the ‘bright spots’ and IG-managed irrigation schemes, found to be under-performing in all performance indicators, are the ‘hot spots’. In terms of the land holding size, large scale growers were found to be the ‘bright spots’ and small scale growers are the ‘hot spots’. Considering the spatial variation in each performance indicator, along with the overall performance, results suggest that there is room for improvement in each of the observed performance aspects. ‘Bright spots’ can be used as the performance target and ‘hot spots’ can be used as targets for improvement.
Center pivot irrigation method showed better performance that other irrigation methods in almost all performance criteria. The average CWP was the highest under center pivot and the lowest in furrow systems, suggesting that transfer from furrow to center pivot could come with gains in CWP. However, it must be noted that most of the furrow systems are operated by the small holders that is likely to have less resources than the commercial entities who operate center pivots. Hence the low CWP in furrow system could be also due to input constraints. The drip irrigation method showed no particular gain in reducing water consumption which calls for improved operation and management of the drip systems
This research showcases that by combining publicly available global remote sensing products, production statistics, and the spatial and temporal variability of these variables, several irrigation performance indicators can be quantified that reveal messages on specific local issues pertaining to irrigation schemes. However, the relatively coarse resolution of the remote sensing data could affect the accuracy of the results in estimating indicators such as equity that are based on CV of ET. This is especially true in the case of smallholders who have small plot sizes. The accuracy of the performance indictors can also be affected by the bias and inaccuracy of the ET estimates used. For instance in this study the observed 10% bias in ET estimate may have impact on the assessment results. Hence, further work on locally calibrating and validating the used remote sensing products could help improve the accuracy of the results and provide the needed rigor to link the analysis with specific filed level recommendations at the local scale. Even though this dataset was demonstrated to be able to detect areas under ‘hot spots’ and ‘bright spots’ in the sugarbelt, the author acknowledges the intricate nature of diagnostic irrigation assessment and that more research is required to find the underlying reasons for the observed low performance in some of the growers.

Author Contributions

Conceptualization, P.K. and B.B.; methodology, P.K. and B.B.; software, B.B. and P.K.; validation, B.B. and P.K.; formal analysis, B.B. and P.K; data curation, B.B.; writing—original draft preparation, B.B., P.K. and M.B.; writing—review and editing, P.K. and M.B.; visualization, B.B., M.B. and P.K.; supervision, C.D.

Acknowledgments

Authors are thankful to Prof. Wim Bastiaanssen and Mr. Gert Mulder for their contributions to this work. This research has been possible due the financial support of the EU funding under Experienced Water Postdoc Fellowship COFUND Programme.

Conflicts of Interest

The authors declare no conflict of interest.

References

  1. Steffen, W.; Richardson, K.; Rockström, J.; Cornell, S.E.; Fetzer, I.; Bennett, E.M.; Biggs, R.; Carpenter, S.R.; De Vries, W.; De Wit, C.A.; et al. Planetary boundaries: Guiding human development on a changing planet. Science 2015, 347, 1259855. [Google Scholar] [CrossRef]
  2. Molden, D.J. Water for Food, Water for Life: A Comprehensive Assessment of Water Management in Agriculture; Routledge: Abington, UK, 2007; ISBN 9781844073962. [Google Scholar]
  3. Conijn, J.G.; Bindraban, P.S.; Schröder, J.J.; Jongschaap, R.E.E. Can our global food system meet food demand within planetary boundaries? Agric. Ecosyst. Environ. 2018, 251, 244–256. [Google Scholar] [CrossRef]
  4. Rockstrom, J.; Lannerstad, M.; Falkenmark, M. Assessing the water challenge of a new green revolution in developing countries. Proc. Natl. Acad. Sci. USA 2007, 104, 6253–6260. [Google Scholar] [CrossRef] [Green Version]
  5. Falkenmark, M.; Rockström, J.; Karlberg, L. Present and future water requirements for feeding humanity. Food Secur. 2009, 1, 59–69. [Google Scholar] [CrossRef]
  6. Alcamo, J.; Flörke, M.; Märker, M. Future long-term changes in global water resources driven by socio-economic and climatic changes. Hydrol. Sci. J. 2007, 52, 247–275. [Google Scholar] [CrossRef] [Green Version]
  7. Rockström, J.; Gordon, L. Assessment of green water flows to sustain major biomes of tthe world: Implications for future ecohydrological landscape management. Phys. Chem. Earth Part B Hydrol. Ocean. Atmos. 2001, 26, 843–851. [Google Scholar] [CrossRef]
  8. Hess, T.M.; Sumberg, J.; Biggs, T.; Georgescu, M.; Haro-Monteagudo, D.; Jewitt, G.; Ozdogan, M.; Marshall, M.; Thenkabail, P.; Daccache, A.; et al. A sweet deal? Sugarcane, water and agricultural transformation in Sub-Saharan Africa. Glob. Environ. Chang. 2016, 39, 181–194. [Google Scholar] [CrossRef] [Green Version]
  9. Swaziland Sugar Association (SSA). Annual Report.; Swaziland Sugar Association: Mbabane, Swaziland, 2013. [Google Scholar]
  10. Knox, J.W.; Rodríguez Díaz, J.A.; Nixon, D.J.; Mkhwanazi, M. A preliminary assessment of climate change impacts on sugarcane in Swaziland. Agric. Syst. 2010, 103, 63–72. [Google Scholar] [CrossRef] [Green Version]
  11. Swaziland Government. Integrated Water Resources Master Plan (IWRMP); Swaziland Government: Mbabane, Swaziland, 2011.
  12. Molden, D.J.; Sakthivadivel, R.; Habib, Z. Basin-Level Use and Productivity of Water: Examples from South Asia; International Water Management Institute: Colombo, Sri Lanka, 2001; Volume 49. [Google Scholar]
  13. Gowda, P.H.; Chavez, J.L.; Colaizzi, P.D.; Evett, S.R.; Howell, T.A.; Tolk, J.A. ET mapping for agricultural water management: Present status and challenges. Irrig. Sci. 2008, 26, 223–237. [Google Scholar] [CrossRef]
  14. Almazroui, M. Calibration of TRMM rainfall climatology over Saudi Arabia during 1998–2009. Atmos. Res. 2011, 9, 400–414. [Google Scholar] [CrossRef]
  15. Gowda, P.H.; Senay, G.B.; Howell, T.A.; Marek, T.H. Lysimetric evaluation of simplified surface energy balance approach in the Texas high plains. Appl. Eng. Agric. 2009, 25, 665–669. [Google Scholar] [CrossRef]
  16. Immerzeel, W.W.; Rutten, M.M.; Droogers, P. Spatial downscaling of TRMM precipitation using vegetative response on the Iberian Peninsula. Remote Sens. Environ. 2009, 113, 362–370. [Google Scholar] [CrossRef]
  17. Jia, S.; Zhu, W.; Lu, A.; Yan, T. A statistical spatial downscaling algorithm of TRMM precipitation based on NDVI and DEM in the Qaidam Basin of China. Remote Sens. Environ. 2011, 115, 3069–3079. [Google Scholar] [CrossRef] [Green Version]
  18. Kumar, D.N.; Reshmidevi, T.V. Remote sensing applications in water resources. J. Indian Inst. Sci. 2013, 93, 163–188. [Google Scholar]
  19. Bastiaanssen, W.G.M.; Bos, M.G. Irrigation performance indicators based on remotely sensed data: A review of literature. Irrig. Drain. Syst. 1999, 13, 291–311. [Google Scholar] [CrossRef]
  20. Zwart, S.J.; Leclert, L.M.C. A remote sensing-based irrigation performance assessment: A case study of the Office du Niger in Mali. Irrig. Sci. 2010, 28, 371–385. [Google Scholar] [CrossRef]
  21. Pareeth, S.; Karimi, P.; Shafiei, M.; De Fraiture, C. Mapping agricultural landusep from time series of Landsat 8 using random forest based hierarchial approach. Remote Sens. 2019, 11, 601. [Google Scholar] [CrossRef]
  22. Bastiaanssen, W.G.M.; Pelgrum, H.; Wang, J.; Ma, Y.; Moreno, J.F.; Roerink, G.J.; Van Der Wal, T. A remote sensing surface energy balance algorithm for land (SEBAL): 2. Validation. J. Hydrol. 1998, 212–213, 213–229. [Google Scholar] [CrossRef]
  23. Conrad, C.; Dech, S.W.; Hafeez, M.; Lamers, J.P.A.; Tischbein, B. Remote sensing and hydrological measurement based irrigation performance assessments in the upper Amu Darya Delta, Central Asia. Phys. Chem. Earth 2013, 61–62, 52–62. [Google Scholar] [CrossRef]
  24. Droogers, P.; Bastiaanssen, W.G.M. Irrigation Performance using Hydrological and Remote Sensing Modeling. J. Irrig. Drain. 2002, 128, 11–18. [Google Scholar] [CrossRef]
  25. Fang, J.; Du, J.; Xu, W.; Shi, P.; Li, M.; Ming, X. Spatial downscaling of TRMM precipitation data based on the orographical effect and meteorological conditions in a mountainous area. Adv. Water Resour. 2013, 61, 42–50. [Google Scholar] [CrossRef]
  26. Roerink, G.J.; Bastiaanssen, W.G.M.; Chambouleyron, J.; Menenti, M. Relating Crop Water Consumption to Irrigation Water Supply by Remote Sensing. Water Resour. Manag. 1997, 11, 445–465. [Google Scholar] [CrossRef]
  27. Kharrou, M.H.; Le Page, M.; Chehbouni, A.; Simonneaux, V.; Er-Raki, S.; Jarlan, L.; Ouzine, L.; Khabba, S.; Chehbouni, G. Assessment of Equity and Adequacy of Water Delivery in Irrigation Systems Using Remote Sensing-Based Indicators in Semi-Arid Region, Morocco. Water Resour. Manag. 2013, 27, 4697–4714. [Google Scholar] [CrossRef]
  28. Velpuri, N.M.; Senay, G.B.; Singh, R.K.; Bohms, S.; Verdin, J.P. A comprehensive evaluation of two MODIS evapotranspiration products over the conterminous United States: Using point and gridded FLUXNET and water balance ET. Remote Sens. Environ. 2013, 139, 35–49. [Google Scholar] [CrossRef]
  29. Taghvaeian, S.; Neale, C.M.U.; Osterberg, J.C.; Sritharan, S.I.; Watts, D.R. Remote Sensing and GIS Techniques for Assessing Irrigation Performance: Case Study in Southern California. J. Irrig. Drain. Eng. 2018, 144, 05018002. [Google Scholar] [CrossRef]
  30. Bos, M.G.; Burton, M.; Molden, D.J. Irrigation and Drainage Performance Assessment. Practical Guidelines; CABI Publishing: London, UK, 1999; ISBN 0851999670. [Google Scholar]
  31. Senay, G.B.; Budde, M.; Verdin, J.P.; Melesse, A.M. A coupled remote sensing and simplified surface energy balance approach to estimate actual evapotranspiration from irrigated fields. Sensors 2007, 7, 979–1000. [Google Scholar] [CrossRef]
  32. Esterhuizen, D.; Kreamer, R. Sugar Annual Report: Production and usage of sugar in Swaziland; USDA: Washington, DC, USA, 2012. [Google Scholar]
  33. Malano, H.M.; van Hofwegen, P. Management of Irrigation and Drainage Systems; CRC Press: Boca Raton, FL, USA, 1999; ISBN 90-5410-483-X. [Google Scholar]
  34. Senay, G.B.; Budde, M.E.; Verdin, J.P. Enhancing the Simplified Surface Energy Balance (SSEB) approach for estimating landscape ET: Validation with the METRIC model. Agric. Water Manag. 2011, 98, 606–618. [Google Scholar] [CrossRef]
  35. Guerschman, J.P.; Van Dijk, A.I.J.M.J.M.; Mattersdorf, G.; Beringer, J.; Hutley, L.B.; Leuning, R.; Pipunic, R.C.; Sherman, B.S. Scaling of potential evapotranspiration with MODIS data reproduces flux observations and catchment water balance observations across Australia. J. Hydrol. 2009, 369, 107–119. [Google Scholar] [CrossRef]
  36. Senay, G.B.; Schauer, M.; Friedrichs, M.; Velpuri, N.M.; Singh, R.K. Satellite-based water use dynamics using historical Landsat data (1984–2014) in the southwestern United States. Remote Sens. Environ. 2017, 202, 98–112. [Google Scholar] [CrossRef]
  37. King, E.A.; Van Niel, T.G.; Van Dijk, A.I.J.M.; Wang, Z.; Paget, M.J.; Raupach, T.; Guerschman, J.; Haverd, V.; Mcvicar, T.R.; Miltenburg, I.; et al. Actual Evapotranspiration Estimates for Australia Inter-Comparison and Evaluation; CSIRO: Canberra, Australia, 2011. [Google Scholar]
  38. Hofste, R.W. Comparative Analysis among Near-Operational Evapotranspiration Products for the Nile Basin Based on Earth Observations. Master’s Thesis, TU Delft, Delft, The Netherlands, 2014. [Google Scholar]
  39. Da Motta Paca, V.H.; Espinoza-Dávalos, G.E.; Hessels, T.M.; Moreira, D.M.; Comair, G.F.; Bastiaanssen, W.G.M. The spatial variability of actual evapotranspiration across the Amazon River Basin based on remote sensing products validated with flux towers. Ecol. Process. 2019, 8, 6. [Google Scholar] [CrossRef]
  40. Prior, A. WA+ as a Technical Tool for Transboundary Water Governance: The Potential of Satellite Data for Water Accounting in Ungauged Basins. Master’s Thesis, Vrije Universiteit Brussel, Brussels, Belgium, 2016. [Google Scholar]
  41. Karimi, P.; Bastiaanssen, W.G.M. Spatial evapotranspiration, rainfall and land use data in water accounting—Part 1: Review of the accuracy of the remote sensing data. Hydrol. Earth Syst. Sci. 2015, 19, 507–532. [Google Scholar] [CrossRef]
  42. Hessels, T.M. Comparison and Validation of Several Open Access Remotely Sensed Rainfall Products for the Nile Basin. Master’s Thesis, TU Delft, Delft, The Netherlands, 2015. [Google Scholar]
  43. Toté, C.; Patricio, D.; Boogaard, H.; van der Wijngaart, R.; Tarnavsky, E.; Funk, C. Evaluation of satellite rainfall estimates for drought and flood monitoring in Mozambique. Remote Sens. 2015, 7, 1758–1776. [Google Scholar] [CrossRef]
  44. Bezuidenhout, C.N.; Lecler, N.L.; Gers, C.; Lyne, P.W.L. Regional based estimates of water use for commercial sugar-cane in South Africa. Water SA 2006. [Google Scholar] [CrossRef]
  45. Alexandridris, T.; Asif, S.; Ali, S. Water Performance Indicators Using Satellite Imegery for the Fordwah Eastern Sadiqia (South) Irrigation and Drainage Project; International Water Management Institute: Colombo, Sri Lanka, 1999; pp. 1–30. [Google Scholar]
  46. Bastiaanssen, W.; Bandara, K. Evaporative depletion assessments for irrigated watersheds in Sri Lanka. Irrig. Sci. 2001, 21, 1–15. [Google Scholar]
  47. Ahmad, M.D.; Turral, H.; Nazeer, A. Diagnosing irrigation performance and water productivity through satellite remote sensing and secondary data in a large irrigation system of Pakistan. Agric. Water Manag. 2009, 96, 551–564. [Google Scholar] [CrossRef]
  48. Bastiaanssen, W.G.M.; Brito, R.A.L.; Bos, M.G.; Souza, R.A.; Cavalcanti, E.B.; Bakker, M.M. Low cost satellite data for monthly irrigation performance monitoring: Benchmarks from Nilo Coelho, Brazil. Irrig. Drain. Syst. 2001, 15, 53–79. [Google Scholar] [CrossRef]
  49. Kirkham, M.B. Potential Evapotranspiration. In Principles of Soil and Plant Water Relations; Elsevier Inc.: Amsterdam, The Netherlands, 2005; pp. 455–468. [Google Scholar]
  50. Stewart, J.; Hagan, R.; Pruitt, W.; Danielson, R.; Franklin, W.; Hanks, R.; Riley, J.; Jackson, E. Optimizing Crop Production through Control of Water and Salinity Levels in the Soil; The University of Utah: Salt Lake City, UT, USA, 1977. [Google Scholar]
  51. Allen, R.G.; Pereira, L.S.; Raes, D.; Smith, M. Crop Evapotranspiration: Guidelines for Computing Crop Requirements; FAO Irrigation and Drainage Paper No. 56; FAO: Rome, Italy, 1998. [Google Scholar]
  52. Bandara, K.M.P. Assessing Irrigation Performance by Using Remote Sensing. Ph.D. Thesis, Wageningen University, Wageningen, The Netherlands, 2006. [Google Scholar]
  53. Ellis, R.D.; Lankford, B.A. The tolerance of sugarcane to water stress during its main development phases. Agric. Water Manag. 1990, 17, 117–128. [Google Scholar] [CrossRef]
  54. Hellegers, P.J.G.J.; Soppe, R.; Perry, C.J.; Bastiaanssen, W.G.M. Remote Sensing and Economic Indicators for Supporting Water Resources Management Decisions. Water Resour. Manag. 2010, 24, 2419–2436. [Google Scholar] [CrossRef]
  55. Perry, C. Irrigation reliability and the productivity of water: A proposed methodology using evapotranspiration mapping. Irrig. Drain. Syst. 2005, 19, 211–221. [Google Scholar] [CrossRef]
  56. Karimi, P.; Molden, D.; Notenbaert, A.; Peden, D. Nile basin farming systems and productivity. In The Nile River Basin: Water, Agriculture, Governance and Livelihoods; Awulachew, S.B., Smakhtin, V., Molden, D., Peden, D., Eds.; Routledge-Earthscan: Abingdon, UK, 2012; pp. 133–153. [Google Scholar]
  57. Cai, X.; Sharma, B.R.; Matin, M.A.; Sharma, D.; Gunasinghe, S. An Assessment of Crop Water Productivity in the Indus and Ganges River Basins: Current Status and Scope for Improvement; International Water Management Institute: Colombo, Sri Lanka, 2010; Volume 140, ISBN 9789290907350. [Google Scholar]
  58. Kruger, F.; Bosch, J.; Everson, C.; Burger, C. Land-Based Activities that May Be Declared Stream Flow Reduction Activities in Terms of Section 36 of the National Water Act; Report to the Sub-Directorate: Stream Flow Reduction Activities of the Department of Water Affairs and Forestry, South Africa; Department of Water Affairs and Forestry: Pretoria, South Africa, 2000. [Google Scholar]
  59. Steduto, P.; Hsiao, T.C.; Fereres, E.; Raes, D. Crop Yield Response to Water; FAO: Rome, Italy, 2012; ISBN 9789251072745. [Google Scholar]
  60. Carr, M.K.V.; Knox, J.W. The Water Relations and Irrigation Requirements of Sugar Cane (Saccharum officinarum): A Review. Exp. Agric. 2011, 47, 1–25. [Google Scholar] [CrossRef]
  61. Zwart, S.J.; Bastiaanssen, W.G.M. Review of measured crop water productivity values for irrigated wheat, rice, cotton and maize. Agric. Water Manag. 2004, 69, 115–133. [Google Scholar] [CrossRef]
  62. Bastiaanssen, W.G.M.; Steduto, P. The water productivity score (WPS) at global and regional level: Methodology and first results from remote sensing measurements of wheat, rice and maize. Sci. Total Environ. 2017, 575, 595–611. [Google Scholar] [CrossRef]
  63. Blatchford, M.L.; Karimi, P.; Bastiaanssen, W.G.M.; Nouri, H. From Global Goals to Local Gains—A Framework for Crop Water Productivity. ISPRS Int. J. Geo-Inf 2018, 7, 414. [Google Scholar] [CrossRef]
  64. Molden, D.J.; Gates, T.K. Performance Measures for Evaluation of Irrigation-Water-Delivery Systems. J. Irrig. Drain Eng. 1990, 116, 804–823. [Google Scholar] [CrossRef]
  65. Malaza, S.; Myeni, D. Integrating Smallholder Growers into Competitive Sugarcane Production; South African Sugar Technologists’ Association: Pretoria, South Africa, 2009. [Google Scholar]
  66. Swaziland Cane Growers Association. Terms of Reference: Assessment of Irrigation Systems for Smallholder Sugarcane Growers; Swaziland Cane Growers Association: Mbabane, Swaziland, 2012. [Google Scholar]
  67. Annandale, J.G.; Stirzaker, R.J.; Singels, A.; van der Laan, M.; Laker, M.C. Irrigation scheduling research: South African experiences and future prospects. Water SA 2011, 37, 751–764. [Google Scholar] [CrossRef]
  68. Merry, R.E. “Dripping with success”: The challenges of an irrigation redevelopment project. Irrig. Drain. 2003, 52, 71–83. [Google Scholar] [CrossRef]
  69. Hellegers, P.J.G.J.; Soppe, R.; Perry, C.J.; Bastiaanssen, W.G.M. Combining remote sensing and economic analysis to support decisions that affect water productivity. Irrig. Sci. 2009, 27, 243–251. [Google Scholar] [CrossRef]
  70. Magwenzi, O. Efficiency of subsurface drip irrigation in commercial sugarcane field in Swaziland. In Proceedings of the Annual General Meeting of the South African Sugarcane Agronomists Association, Mount Edgecomb, Swaziland, 30 July–02 August 2001. [Google Scholar]
  71. Reinders, F.B.; van der Stoep, I.; Backeberg, G.R. Improved efficiency of irrigation water use: A south african framework. Irrig. Drain. 2013, 62, 262–272. [Google Scholar] [CrossRef]
  72. Lankford, B. The Rise of Large Scale Formal Smallholder Irrigation Schemes in Swaziland; An Appropriate Solution for Rural Livelihoods and Agricultural Production? DEV Working Paper Series; University of East Anglia: Norwich, UK, 2007. [Google Scholar]
  73. Karimi, P.; Molden, D.; Bastiaanssen, W.; Cai, X. Water accounting to assess use and productivity of water: Evolution of a concept and new frontiers. In Water Accounting: International Approaches to Policy and Decision-Making; Chalmers, K., Godfrey, J., Eds.; Edgar Elger: Cheltenham, UK, 2012; pp. 76–88. [Google Scholar]
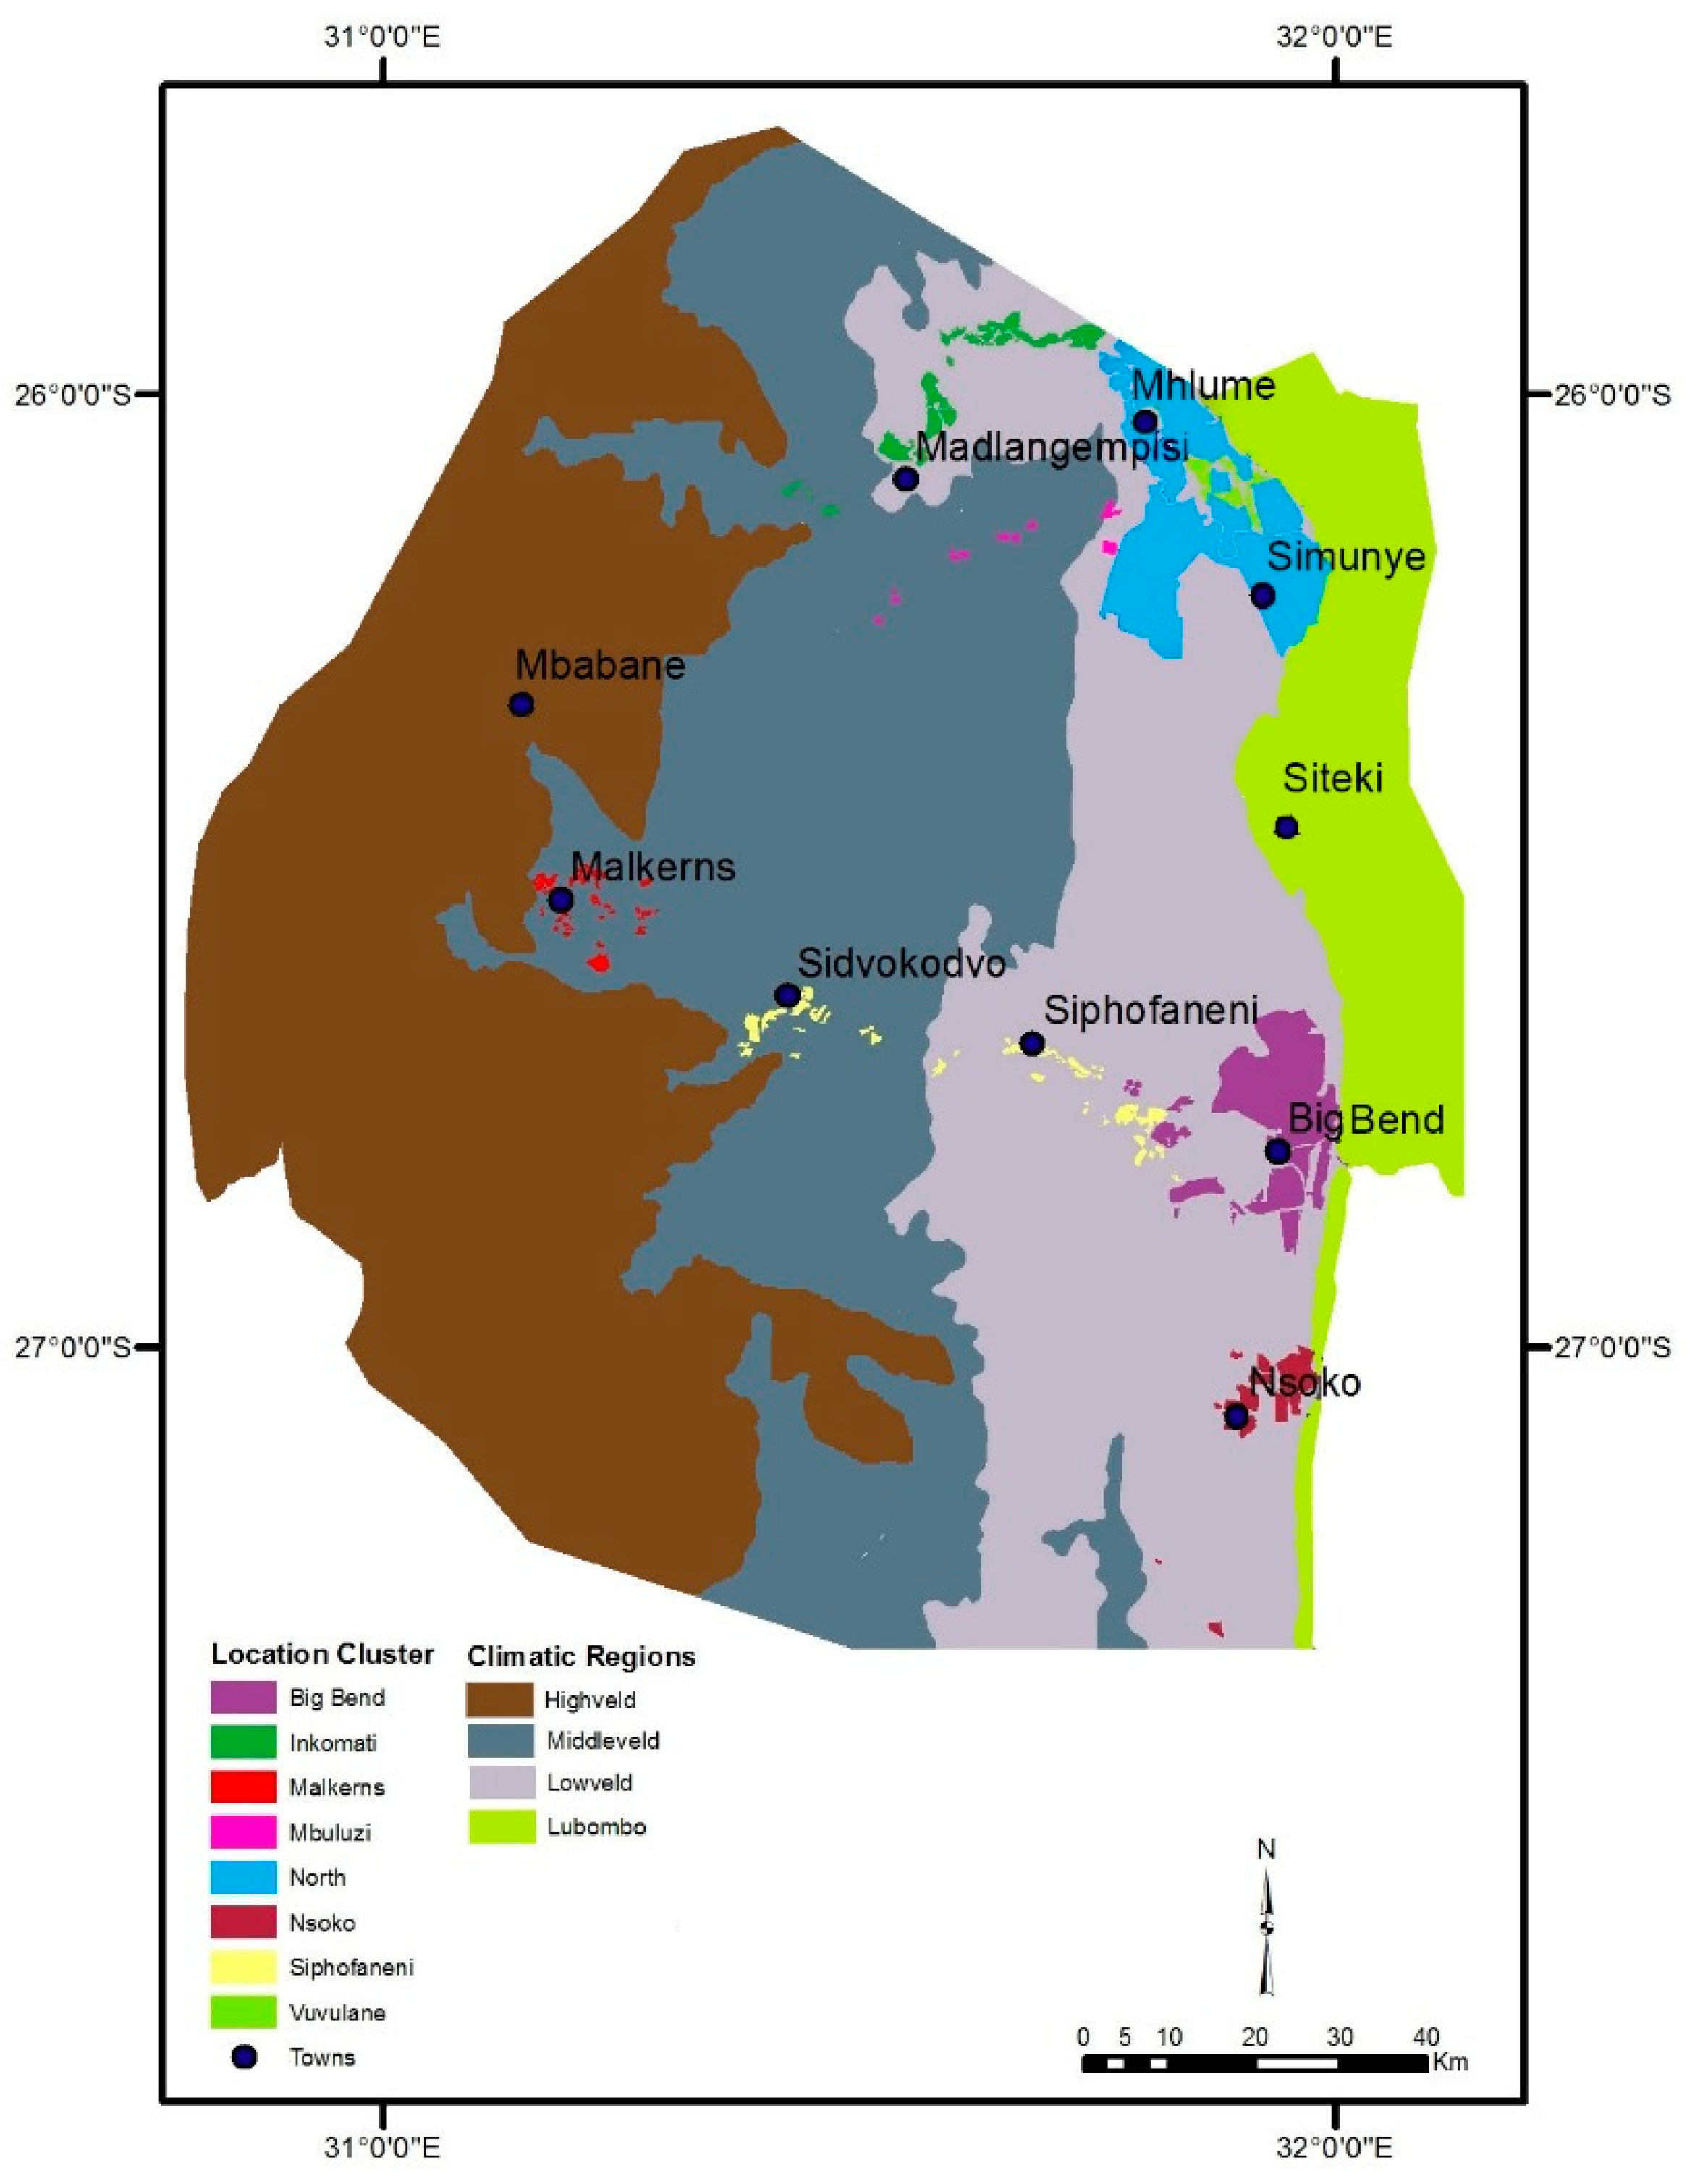
Figure 1. Spatial distribution of ‘location’ clusters (Grower boundaries were obtained courtesy of SWADE).
Remotesensing 11 00705 g001
Figure 2. Spatial distribution of annual ET averaged from 2005 to 2010, computed using SSEBop–CMRSET mean Ensemble.
Remotesensing 11 00705 g002
Figure 3. Sugarcane yield in tones sucrose per hectare (TSH) and tones cane per hectare (TCH).
Remotesensing 11 00705 g003
Figure 4. The linear relationship between sugarcane yield and relative ET to establish the target and critical level of relative ET.
Remotesensing 11 00705 g004
Figure 5. The annual ET for sugarcane in different grower clusters.
Remotesensing 11 00705 g005
Figure 6. Temporal variation of relative ET of selected grower clusters.
Remotesensing 11 00705 g006aRemotesensing 11 00705 g006b
Figure 7. Temporal variation of yield (TCH/season) of the sugarcane industry.
Remotesensing 11 00705 g007
Figure 8. A plot of sugarcane yield versus water productivity calculated using ET.
Remotesensing 11 00705 g008
Figure 9. Mean crop water productivity calculated using beneficial biomass for the different cluster grower scale, management regime and location.
Remotesensing 11 00705 g009
Table 1. Description of growers’ clusters used in this research.
CategoryCluster NameCommand AreaType of Management
Land HoldingSmall Scale Growers<50 haRun along modern business lines
Medium Scale Grower50 ≥ 1000 haFarmer managed and commercial growers
Large Scale Grower>1000 haFarmers Associations and commercial growers
Management Type Estate managed>1000 haRun along modern business lines
Miller-cum-planters>1000 haRun along modern business lines
Farmers Associations50–500 ha per farmFarmer managed—communally
Individual growers3–100 ha per farmFarmer managed—individually
LocationIncomati (KDDP)4,500 ha Farmer managed—communally
North26,000 haRun along modern business lines
Vuvulane (VIF) 1470 haFarmer managed—individually
Malkerns1100 haFarmers Associations and commercial growers
Siphofaneni (including Sidvokodvo and LUSIP farmers) 3500 ha Farmers Associations and commercial growers
Big Bend16,500 haFarmers Associations and commercial growers
Nsoko 3000 ha Farmers Associations and commercial growers
Mbuluzi900 haFarmers Associations and individual growers
Irrigation methodCenter Pivot12% -
Sprinkler45%-
Furrow22%-
Drip20%-
Table 2. Irrigation performance indicators proposed for the study area; selected based on operational activities and resource utilization.
CriteriaPerformance IndicatorDefinition
EquityCV of evapotranspiration Standard   deviation   ET Mean   ET
AdequacyRelative Evapotranspiration ET PET
ReliabilityTemporal variation of the relative evapotranspiration ET PET
Productivity Crop Water Productivity (CWP) beneficial   biomass ET
Table 3. Comparison of the industry norm PET and the 95 percentile ET actual.
Grower Cluster The 95 Percentile ET (mm/yr)Industry Norm PET (mm/yr)
Komati11601200
Vuvulane
North12311365
Mbuluzi
Malkerns10041088
Siphofaneni
Big Bend11911348
Nsoko
Average11471250
Table 4. Summary of seasonal values of indicators for all clusters averaged from June 2005 to October 2009.
Category NameCluster NameETEquityAdequacyYieldWater Productivity
(mm/yr)CV of ETRETCV of RETTSH (tones)kg/m3
Grower scaleSmall Scale10180.080.750.0811.581.15
Medium Scale9430.080.740.1013.521.44
Large Scale10600.050.810.0315.091.37
Management regime of growerEstate Managed10800.050.800.0417.421.57
Farmers Associations9470.070.730.1113.431.42
Individual Growers10160.080.760.0711.501.14
Mill-cum-planters10860.010.800.0215.221.44
Location of growersBig Bend10220.090.740.0813.461.35
KDDP10000.030.820.0514.561.48
Malkerns8590.050.790.0513.951.63
Mbuluzi9100.050.670.0513.581.49
North11060.030.810.0316.041.57
Nsoko9820.070.710.0813.881.41
Siphofaneni9450.090.700.0913.011.38
VIF10550.040.770.0410.751.02
Irrigation method Pivot11420.020.840.0218.611.63
Sprinkler10280.100.780.0915.521.52
Furrow10700.050.830.0712.201.13
Drip10900.070.810.0516.181.48