1. Introduction
Accurate estimates of above ground biomass (AGB) of vegetation in forests are fundamental for quantifying and monitoring forest conditions and trends. AGB and other forest structure metrics provide baseline information required to derive estimates of available wood supply, habitat quality for wildlife, and fire threat, among other ecosystem attributes [
1,
2,
3,
4]. Such information can help guide, for example, national policies on forest management, carbon sequestration, and ecosystem health [
5]. While in-situ measurements can provide a direct local-scale quantification of forest structure attributes, they can also be cost prohibitive, time consuming, and limited in spatial extent [
6]. Therefore, utilization of widely available remotely sensed data with new modeling methods have become an essential approach for estimating AGB and other forest metrics in recent decades [
7].
In recent years, advanced methods utilizing satellite or airborne sensor technology have resulted in regional and global-scale estimates of forest structure [
8,
9,
10,
11,
12]. These sensors range from very high spatial resolution optical/laser datasets (Quickbird and airborne LiDAR) to moderate or low spatial resolution datasets (Landsat, radar, and MODIS), each with their own advantages and disadvantages [
7,
13]. Airborne LiDAR is currently the most advanced platform and has recently become ubiquitous in the literature. This is due to the high accuracy in forest structure metrics estimation produced by its very high spatial resolution (sub 1-m), and its ability to represent three-dimensional structure with point clouds [
14]. However, despite its growing usage, airborne LiDAR acquisitions are costly, limited in spatial and temporal coverage, and can contain fly-over data gaps, thus limiting their utility for large continuous regional analyses of forest structure [
7].
Landsat has been the most widely used sensor to measure forest structure due to its free availability, medium temporal resolution (16-day return interval), and effective global spatial coverage [
15]. The wall-to-wall access of data globally has led to advancements in understanding not only of the patterns and dynamics of AGB, but also of net primary productivity and forest canopy cover change dynamics [
9,
16]. Yet, its moderate spatial resolution (30-m) has led to issues of “data saturation,” in which a single pixel’s reflectance has high uncertainty and/or underestimates at AGB values above 150 Mg/ha [
1,
17,
18]. This is due to mature forests often containing a complex mixed age structure, resulting in canopy layering, which can be difficult to discern at a 30-m spatial resolution [
19]. One data source that has the potential to resolve issues with Landsat’s data saturation and LiDAR’s limited coverage is the USDA National Agriculture Imagery Program (NAIP) [
20]. Since 2002, the NAIP program has provided freely accessible, 1-m resolution aerial photography, approximately every two years and for each state in the conterminous US [
20]. Using texture/pattern recognition software, such high resolution imagery can help to overcome data saturation issues and provide better estimates of forest structure metrics [
21,
22].
In the past couple of decades, development of newer machine learning methods, including deep learning, have led to an explosion of computer vision research, lending itself to the creation of complex and computationally efficient relationship models in the field of remote sensing [
23,
24,
25,
26,
27,
28,
29]. One application for which deep learning is particularly well-suited is image interpretation and pattern recognition with spatial data through use of convolutional neural networks (CNN) [
30]. CNNs have proven to outperform all other existing methods when applied to these tasks [
31,
32,
33]. Yet, this method has not been readily adopted for forest metric estimation, such as AGB [
1]. Predictions of forest structure metrics have been shown to improve when including image textures as predictors, e.g., gray level co-occurrence matrix (GLCM), standard deviation of gray levels (SDGL). However, these, and other more complex textural features require laborious hand-crafting to identify and implement in model fitting [
34,
35,
36]. CNNs have the ability to identify similar relevant image textures from the data alone without human assistance, which allows them to be applied to solve generalized image feature detection problems [
32,
37]. Additionally, the advancement of recurrent CNNs (RCNN), convolutional neural networks that include a time dependent layer, allows identified image texture spaces to be ordered in sequence [
38,
39]. The ability of RCNNs to recognize patterns in multi-dimensional domains that have both time and space components demonstrates promise with object recognition in a wide range of remote sensing problems, from classification to segmentation [
40,
41,
42].
With the rapid adoption of CNNs for solving computer vision problems, additional advanced approaches have been developed to improve predictive accuracy, which include multi-task learning and ensembling. Multi-task learning is a method in which a neural network is trained to perform two or more similar tasks, such as identifying road characteristics while predicting steering direction for an automated driving system [
43]. This shared task method of learning has been demonstrated to increase predictive ability for each individual task [
44]. Ensembling, the technique of using multiple models together to make a single prediction, has also been demonstrated to increase predictive ability of many machine learning approaches, by reducing the bias of any single model prediction [
45]. These technical advancements and characteristics present an opportunity to apply them in an ensemble of multi-task RCNNs as a case study, and test the ability of such an architecture to classify forest cover and predict AGB and other forest structure metrics against more conventional approaches.
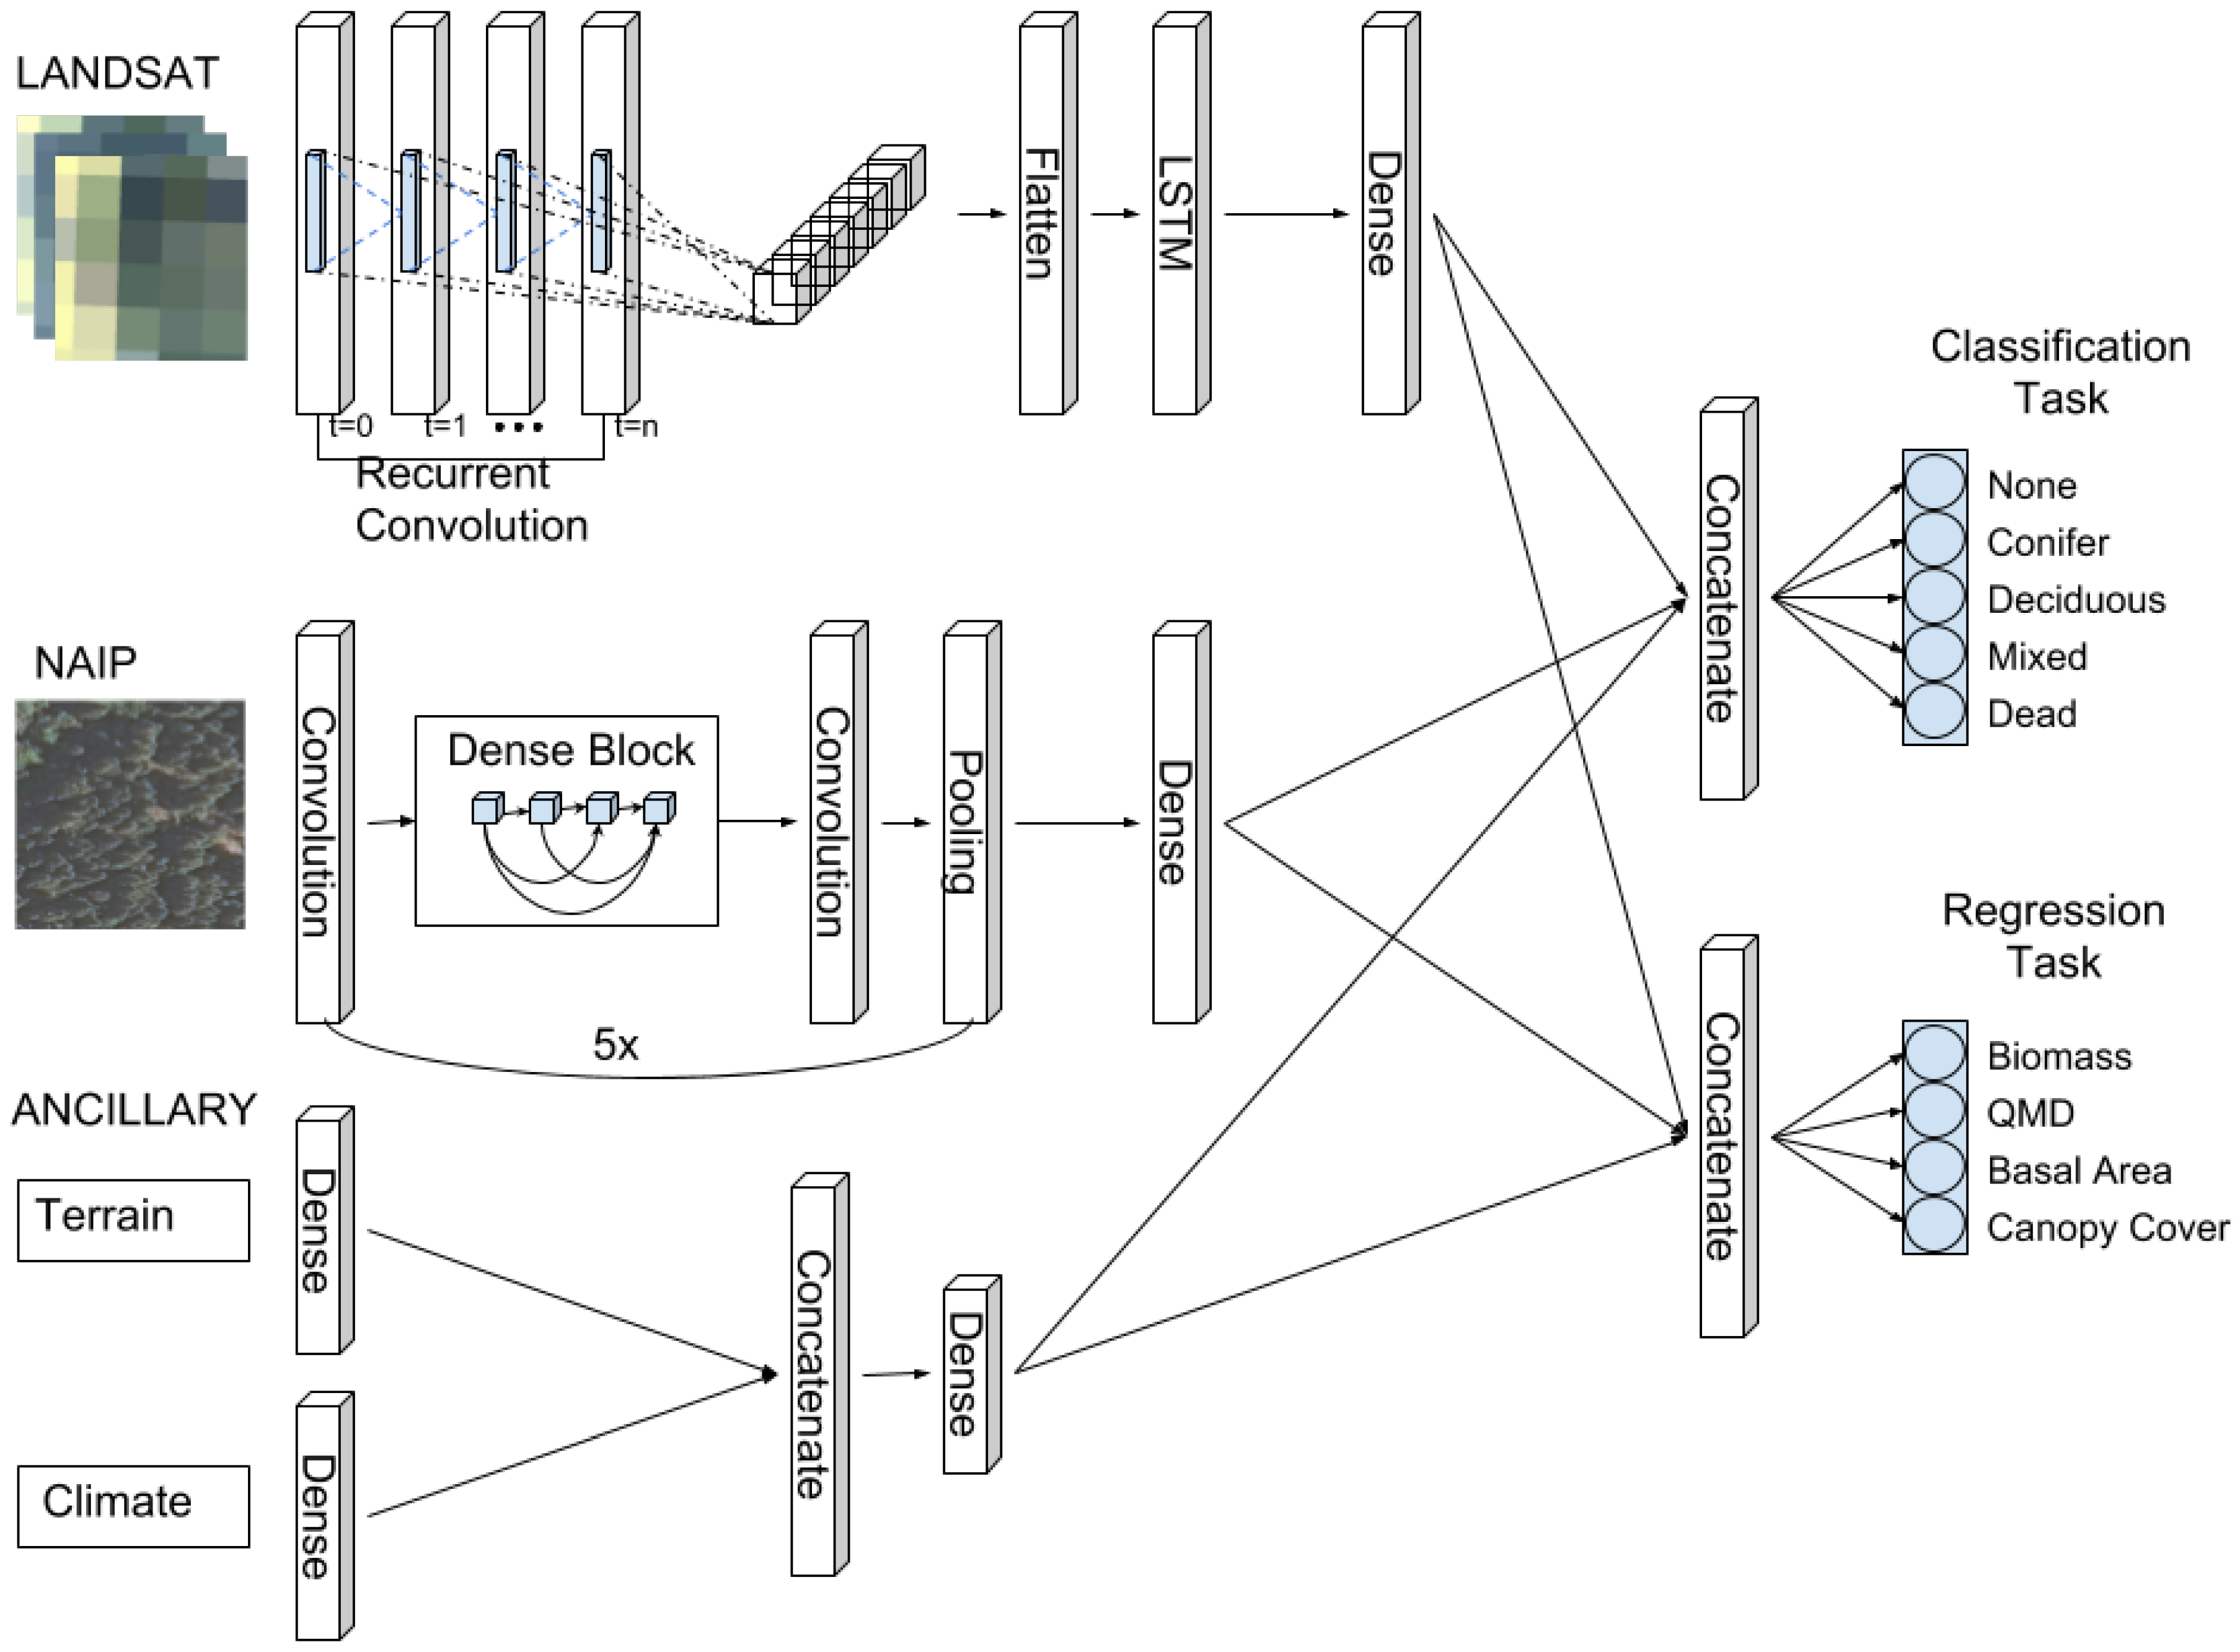
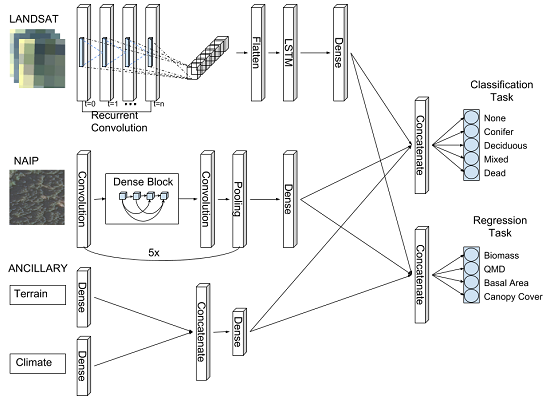
In this study, we introduce an ensemble of individual RCNN models called “Chimera” (together called the Chimera ensemble, or CE) to perform a data fusion of high resolution NAIP imagery, moderate resolution time-varying Landsat, and ancillary climate and terrain (ANC) variables, and to build prediction tiles which can then be reassembled for spatially explicit mapping of larger areas. We present performance metrics based on field plots collected from the USDA forest service forest inventory and analysis (FIA) program dataset.
Objectives
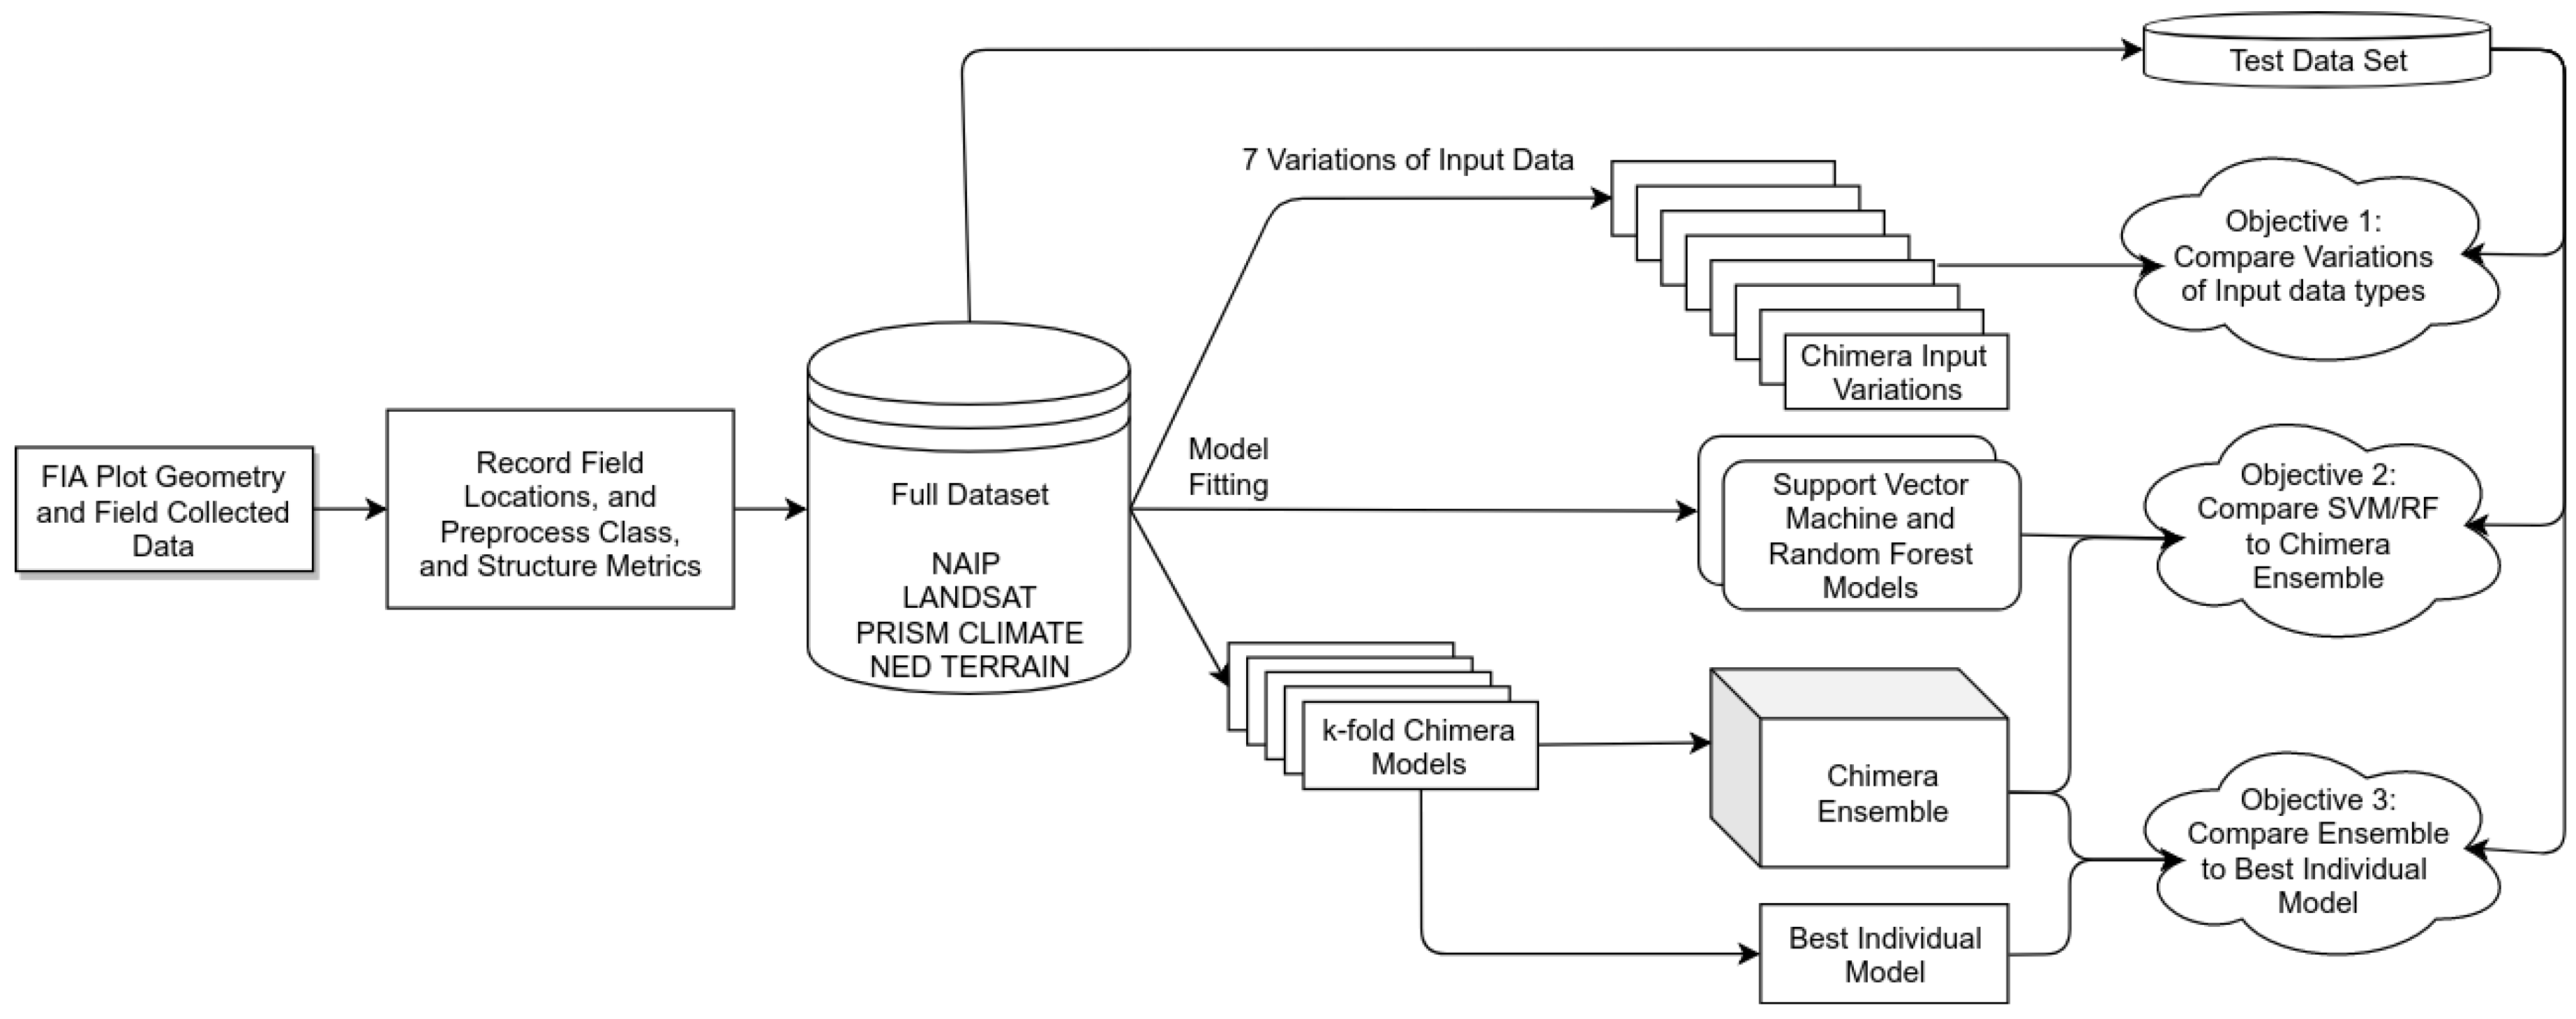
The main objective of this study is to measure the performance of a novel multi-task RCNN architecture which simultaneously classifies forest and land cover (‘conifer’, ‘deciduous’, ‘mixed’, ‘dead’, or ‘none’) and estimates forest structure metrics (AGB, quadratic mean diameter (QMD), basal area, and canopy cover). Our performance experiments will involve: (1) comparing the different combinations of input datasets, specifically, the impact of including high resolution (1-m) imagery; (2) comparing the RCNN architecture with more commonly used random forest (RF) and support vector machine (SVM) models, with similar inputs; (3) assessing the potential improvement with ensembling of RCNN models compared to an individual best fit model. It is hoped that these objectives (
Figure 1) will better inform the application of deep learning approaches in forest structure and type estimation, and present a potential architecture upon which future modeling efforts might improve.
4. Discussion
This research describes an effort to measure the ability of a novel deep learning approach for estimation of forest structure and classification simultaneously based on a fusion of multi-resolution and temporal data. There has been extensive research on estimating forest structure given the development of new modeling methodologies and the availability of free remote sensing data [
6,
7,
76]. Implementations include utilization of various combinations of models and datasets to address forest structure estimates and classification [
35,
59,
77,
78,
79,
80]. Blackard et al. [
11], performed a national scale effort to model AGB and forest classification through a tree-based algorithm approach with impressive results for AGB estimation utilizing three eight-day composited MODIS images, classified land cover information, and climate/topographic data. Three issues were cited in the study: (1) over-prediction of areas of small AGB and under-prediction of areas of large AGB due to reflectance saturation, (2) not capturing the full range in variability due to pixel size mismatch (250-m MODIS derived data) to FIA plot size, and (3) error in forest/non-forest classification due to FIA plot-based estimates pertaining to forest land use, which does not necessarily have trees on them, while satellite image-based estimates portraying forest land cover. Wilson et al. [
78] made another step forward in this effort utilizing a phenological gradient nearest neighbor approach which integrating MODIS imagery across multiple time intervals, rather than a single aggregated time-step, and ancillary environmental data that includes topography and climate, to initially estimate forest basal area at the species level and later include AGB [
8]. Our research examines a method to further include high resolution NAIP imagery in the suite of predictor variables, and utilize a unique RCNN architecture we call Chimera.
Previous work in utilizing more moderate spatial resolutions (30-m) remote sensing for estimating AGB had found that applications of machine learning methodologies more accurately estimated AGB than classical statistical methods, with an
ranging from 0.54–0.78 [
81,
82,
83]. Zolkos et al. [
6] states that, although there are no explicit required accuracy levels for AGB estimation, a map for global AGB should not exceed errors of 50 Mg/ha at 1-ha resolution. This de facto standard has led to an increased interest in more advanced sensors to improve AGB estimation. For example, Zhang et al. [
84] utilized Landsat and the Geoscience Laser Altimeter System (GLAS) space-borne platform in a large-scale modeling effort to produce gridded leaf-area index maps and canopy height maps of California, which derived AGB at a 30-m resolution across the entire state. Modeled uncertainties via their Monte Carlo methodology were in the range of 50–150 Mg/ha across the entire state, with denser forest in the Sierra Nevada Mountains closer to 100–150 Mg/ha. Chen et al. [
85] was able to report within-sample statistics of
and RMSE
Mg/ha using a model based solely on aerial LiDAR for the Lake Tahoe region. This effort represents one of the best models for AGB estimation in the region. The Chimera ensemble displays the ability to achieve similar performance in a comparable forested type landscape with high coefficient of determination (
) values (above 0.8) and low RMSE for all forest structure metrics.
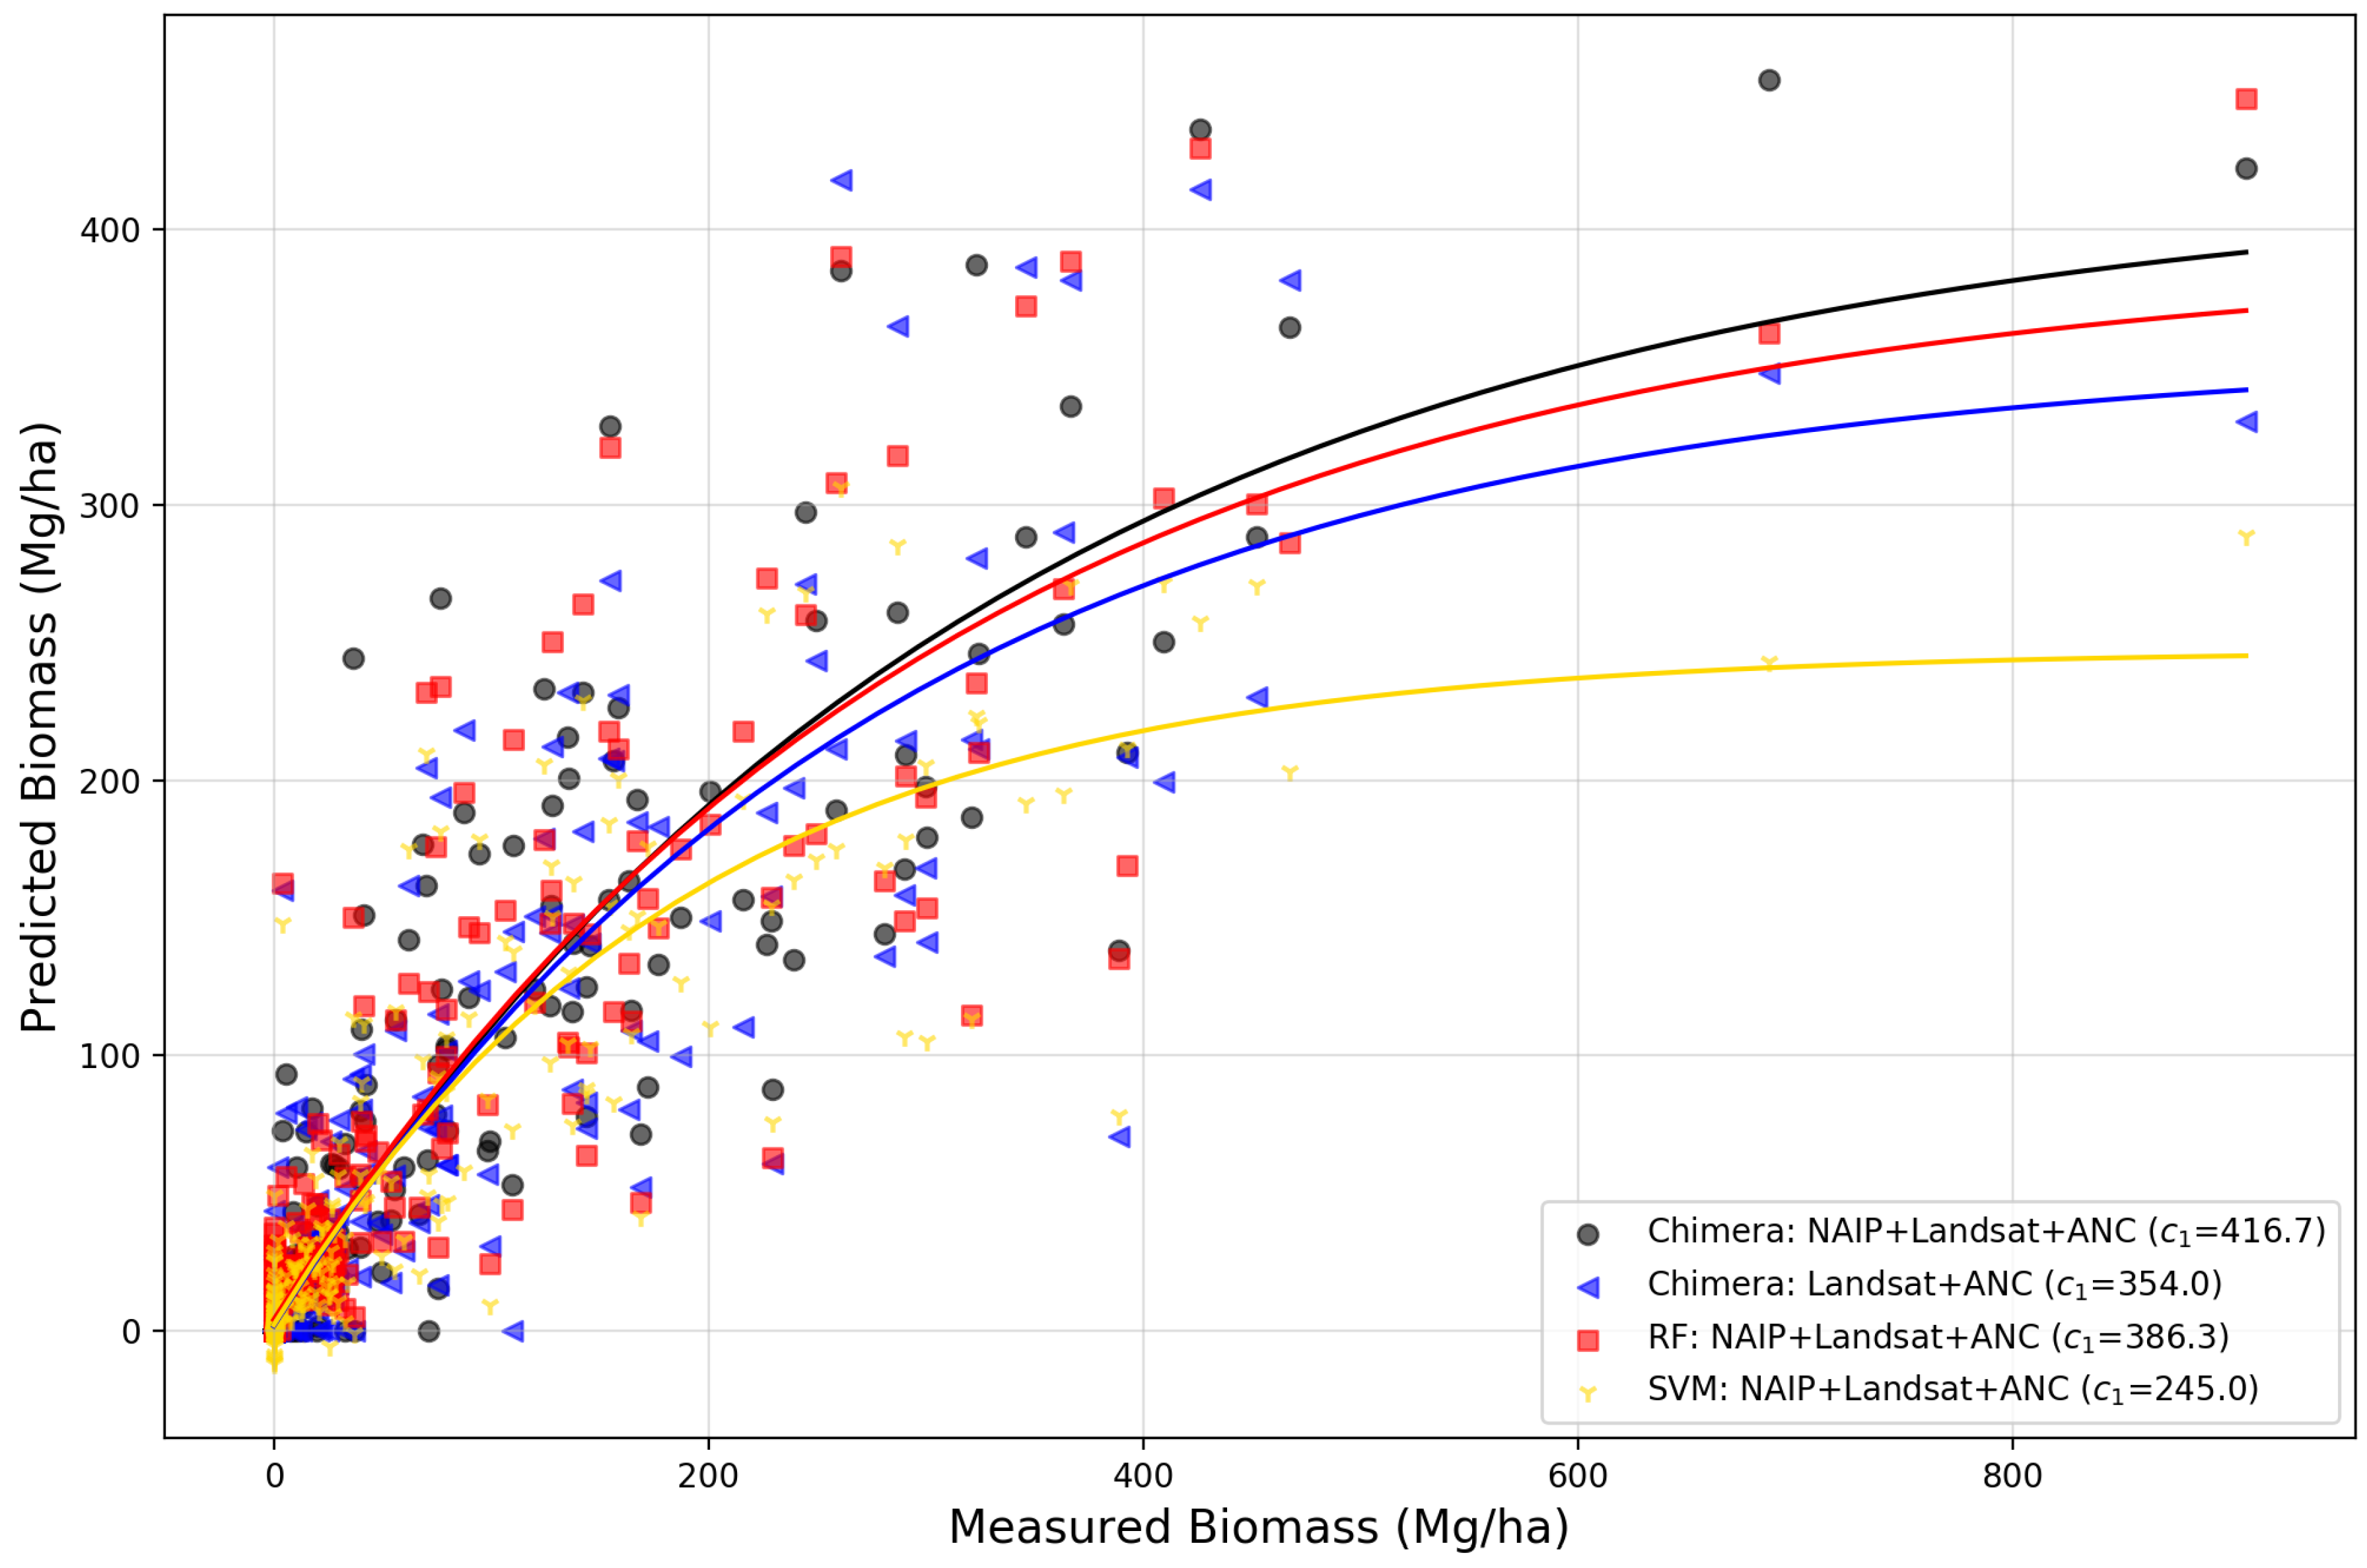
As our first step at measuring the RCNN performance at the predictor level, we ran experiments comparing various permutations which included different combinations of the input NAIP, Landsat, and ANC data. We found that combining the full suite of data performed better overall than any of the input datatypes in isolation for forest structure estimation, specifically with the highest performance increases in AGB and basal area accuracy. The inclusion of high resolution information increased the data saturation level for estimates of AGB, where estimates reached saturation at 416.7 Mg/ha, rather than 354.0 Mg/ha, when only including the Landsat time-series and ancillary variables (
Figure A2). The combination of NAIP and Landsat are found to have the best performance at the classification task overall versus Landsat alone, with an overall F1-score improvement of 0.08, which suggests that inclusion of high resolution imagery aids in AGB estimation and identification of forested and non-forested plots due to the additional textural information. This is in agreement with previous studies which demonstrated that including high resolution imagery increases a machine learning model’s ability to distinguish forest composition types [
86,
87].
Our experiments with RF and SVM models using the same training and testing datasets further demonstrated how the RCNN method of spatial feature detection can improve forest structure estimation and classification. Due to the non-convolutional characteristics of RF and SVM, even if textural summarizing functions such as SDGL were included in the predictor datasets, the RCNN model was still able to achieve higher accuracy in both classification and regression tasks. The convolutional nature is important in the regression task, where structural features such as the size of a large or small canopy can be relevant for estimates of basal area and QMD. This characteristic contributed to the CE’s increased performance versus RF, with an overall 17% reduction in RMSE for all forest structure metrics (
Table 4). Additionally, because the Chimera model utilizes a recurrent layer in its structure for Landsat images, features that are identified in the twelve month series are seen as a set of orderly and continuing sequences, rather than a one-dimensional vector of independent values [
88]. This allowed substantial improvement in distinguishing of the land use class of ‘deciduous’, with CE improving the F1-score by 0.26 and 0.14 compared to SVM and RF, respectively. This indicates that the Chimera model, with its ability to automatically identify relevant image features and incorporate information regarding spatial-temporal relationships between pixels in prediction, can efficiently and substantially improve forest structure estimation using the same input datasets.
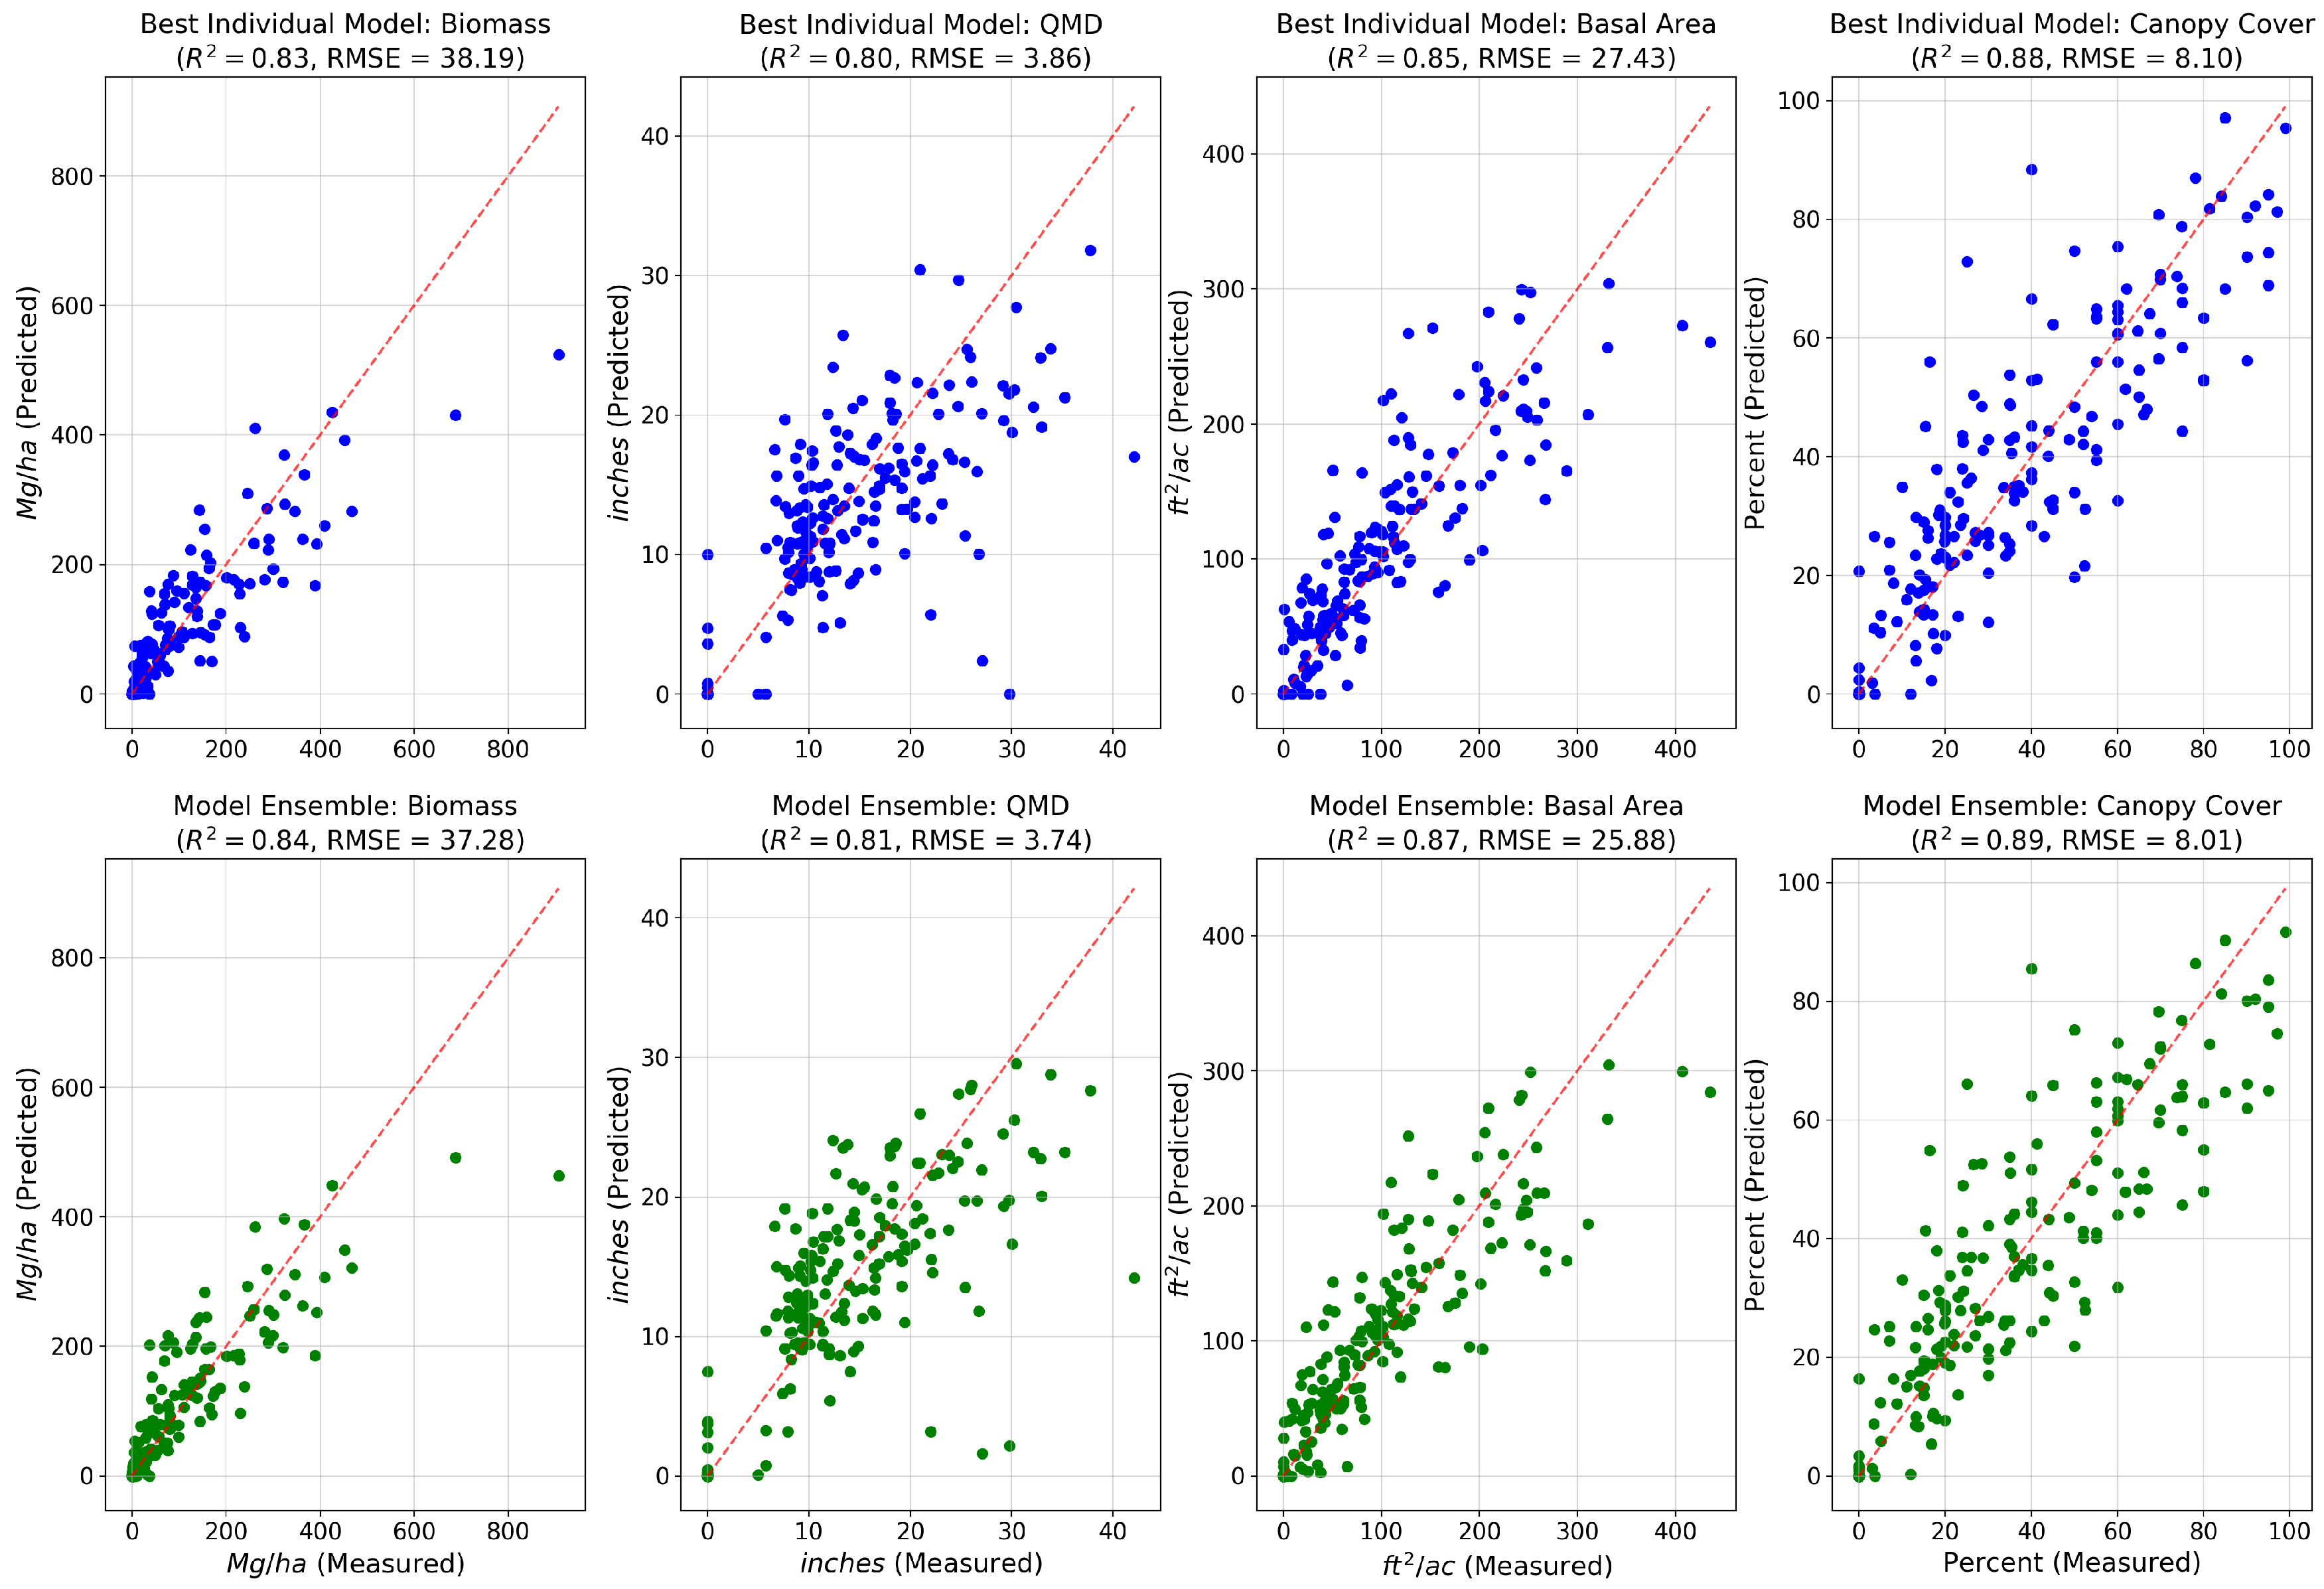
Model ensembling/stacking was found to be an improvement over a single best fit Chimera model. Although only a modest improvement was found versus the best individual
k-fold model with an increase of 0.025 in overall F1-score for classification, and regression improvements of overall
of 0.0125, and reduction of overall RMSE by 3.1%. These findings were consistent with the literature that stacking multiple models based on a linear regression weighting, can reduce individual model biases and increase the robustness of prediction [
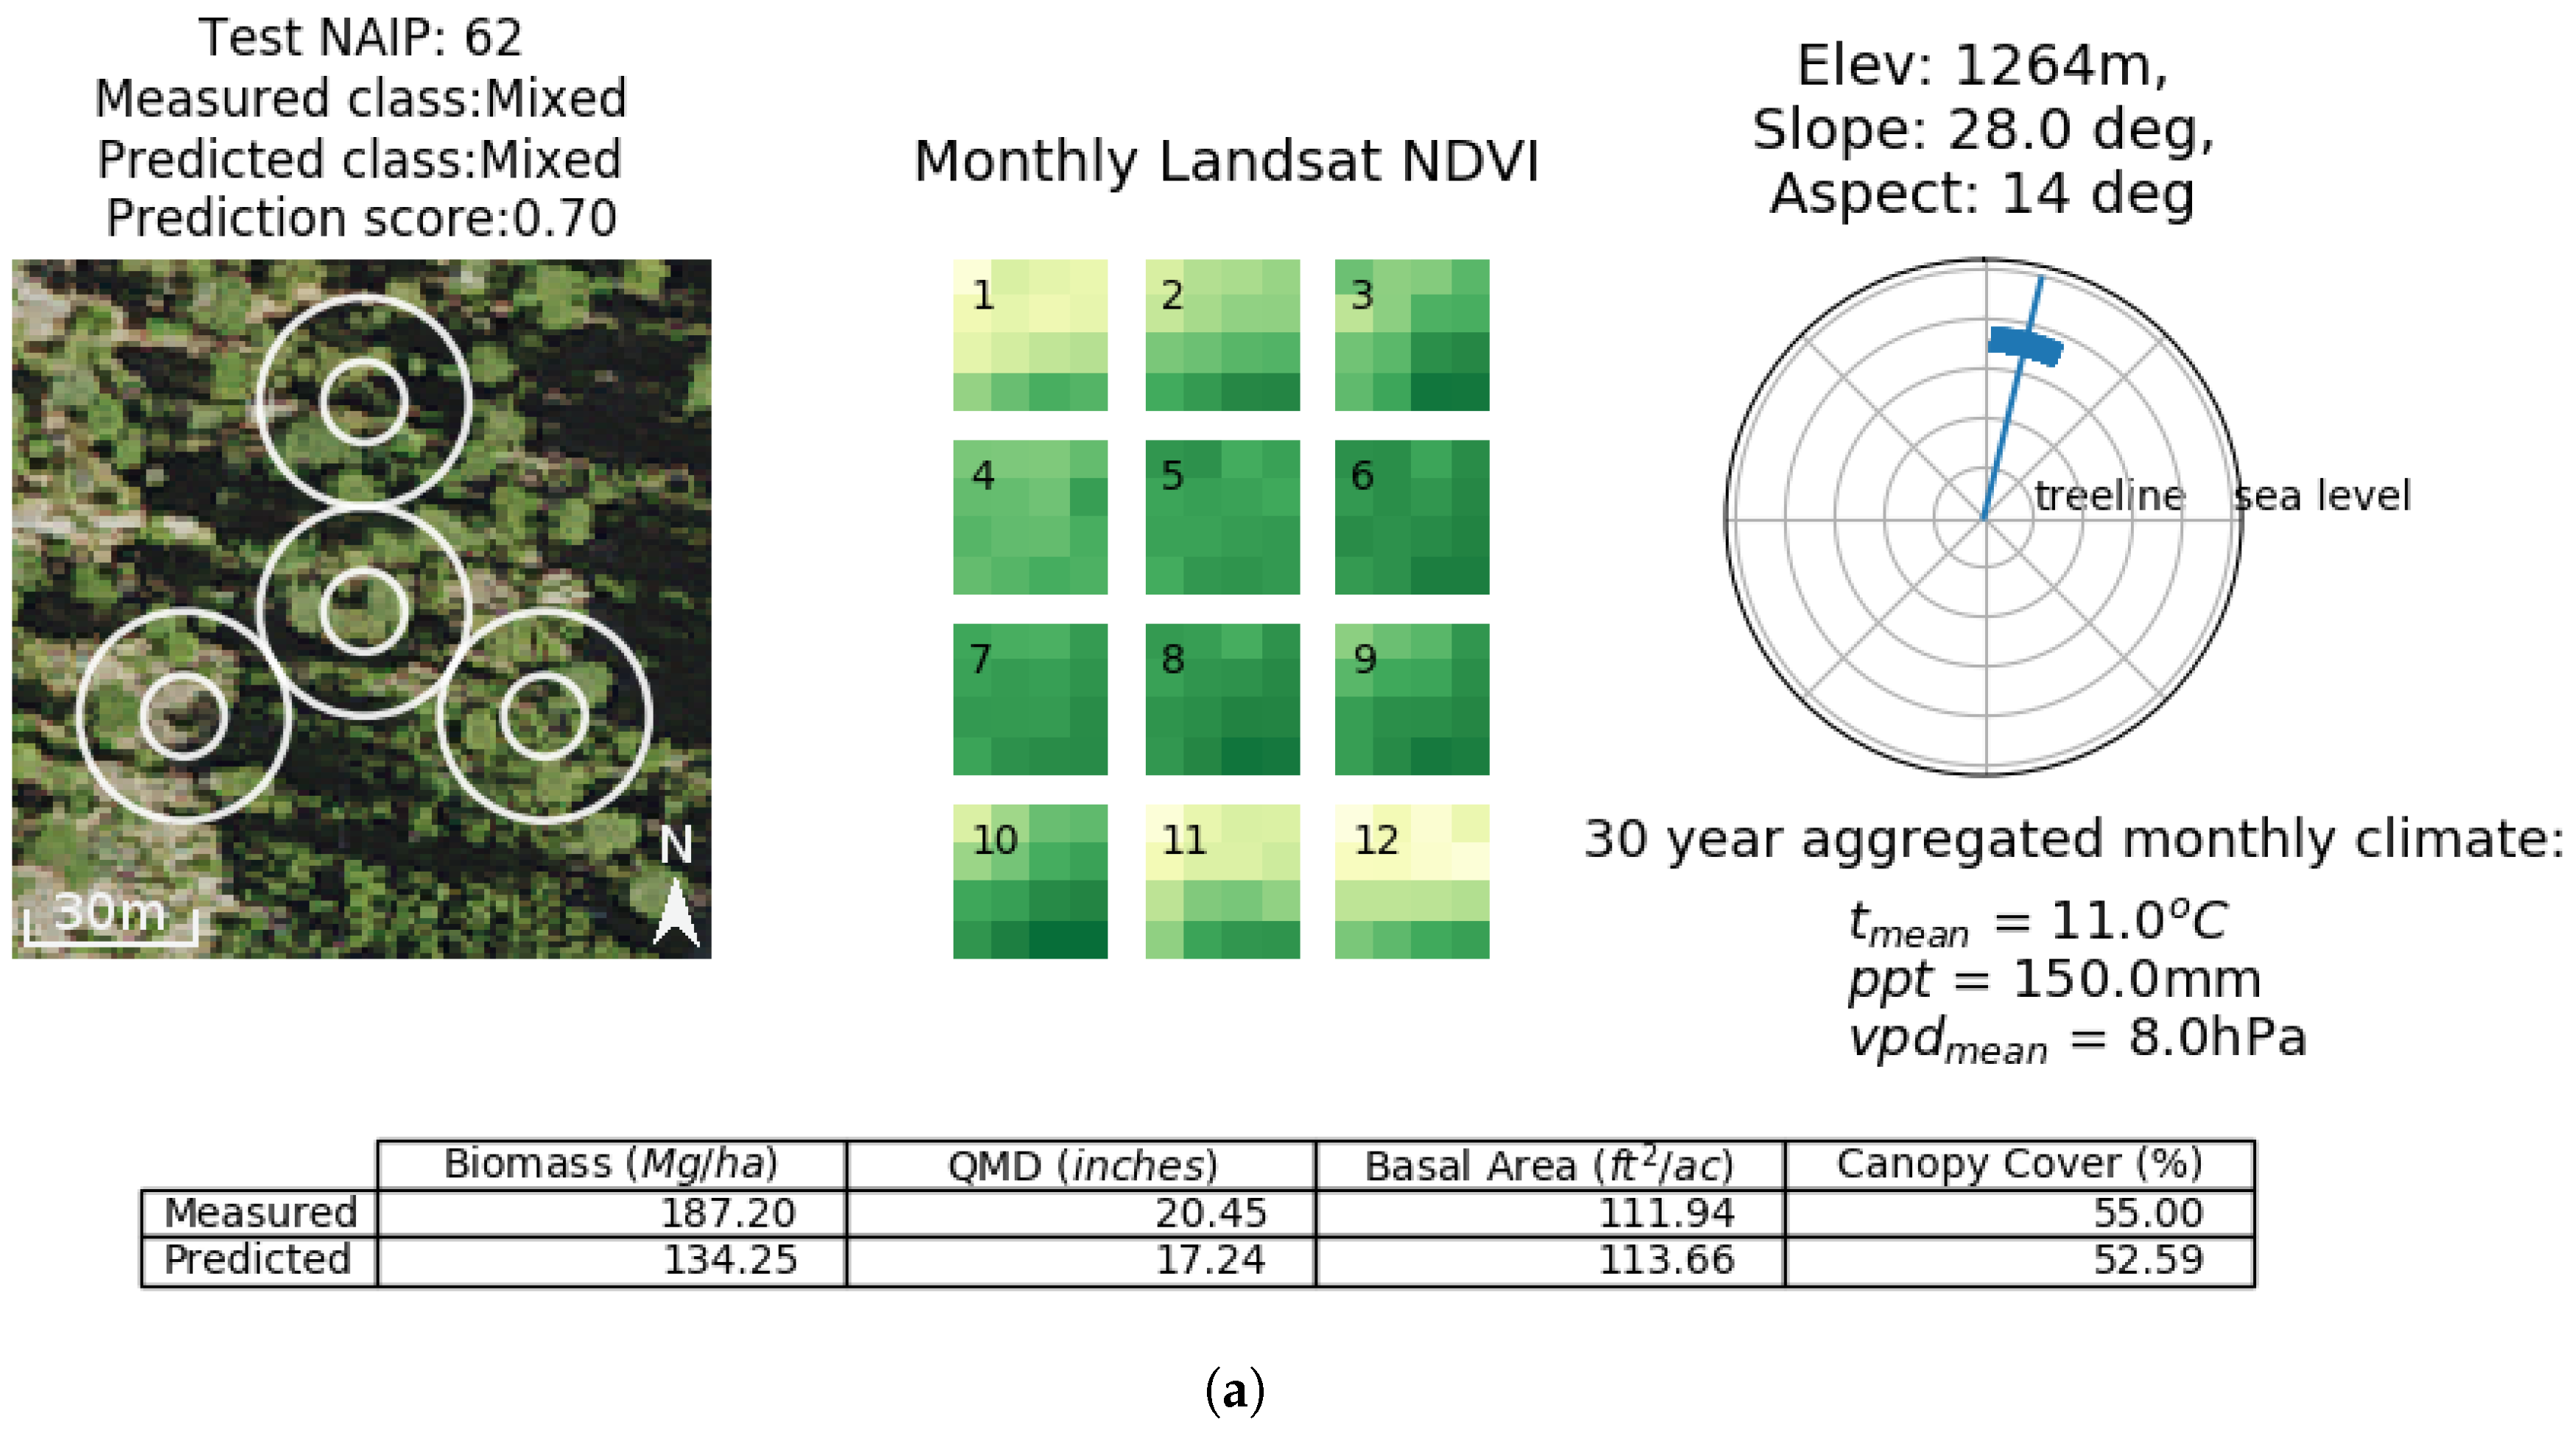
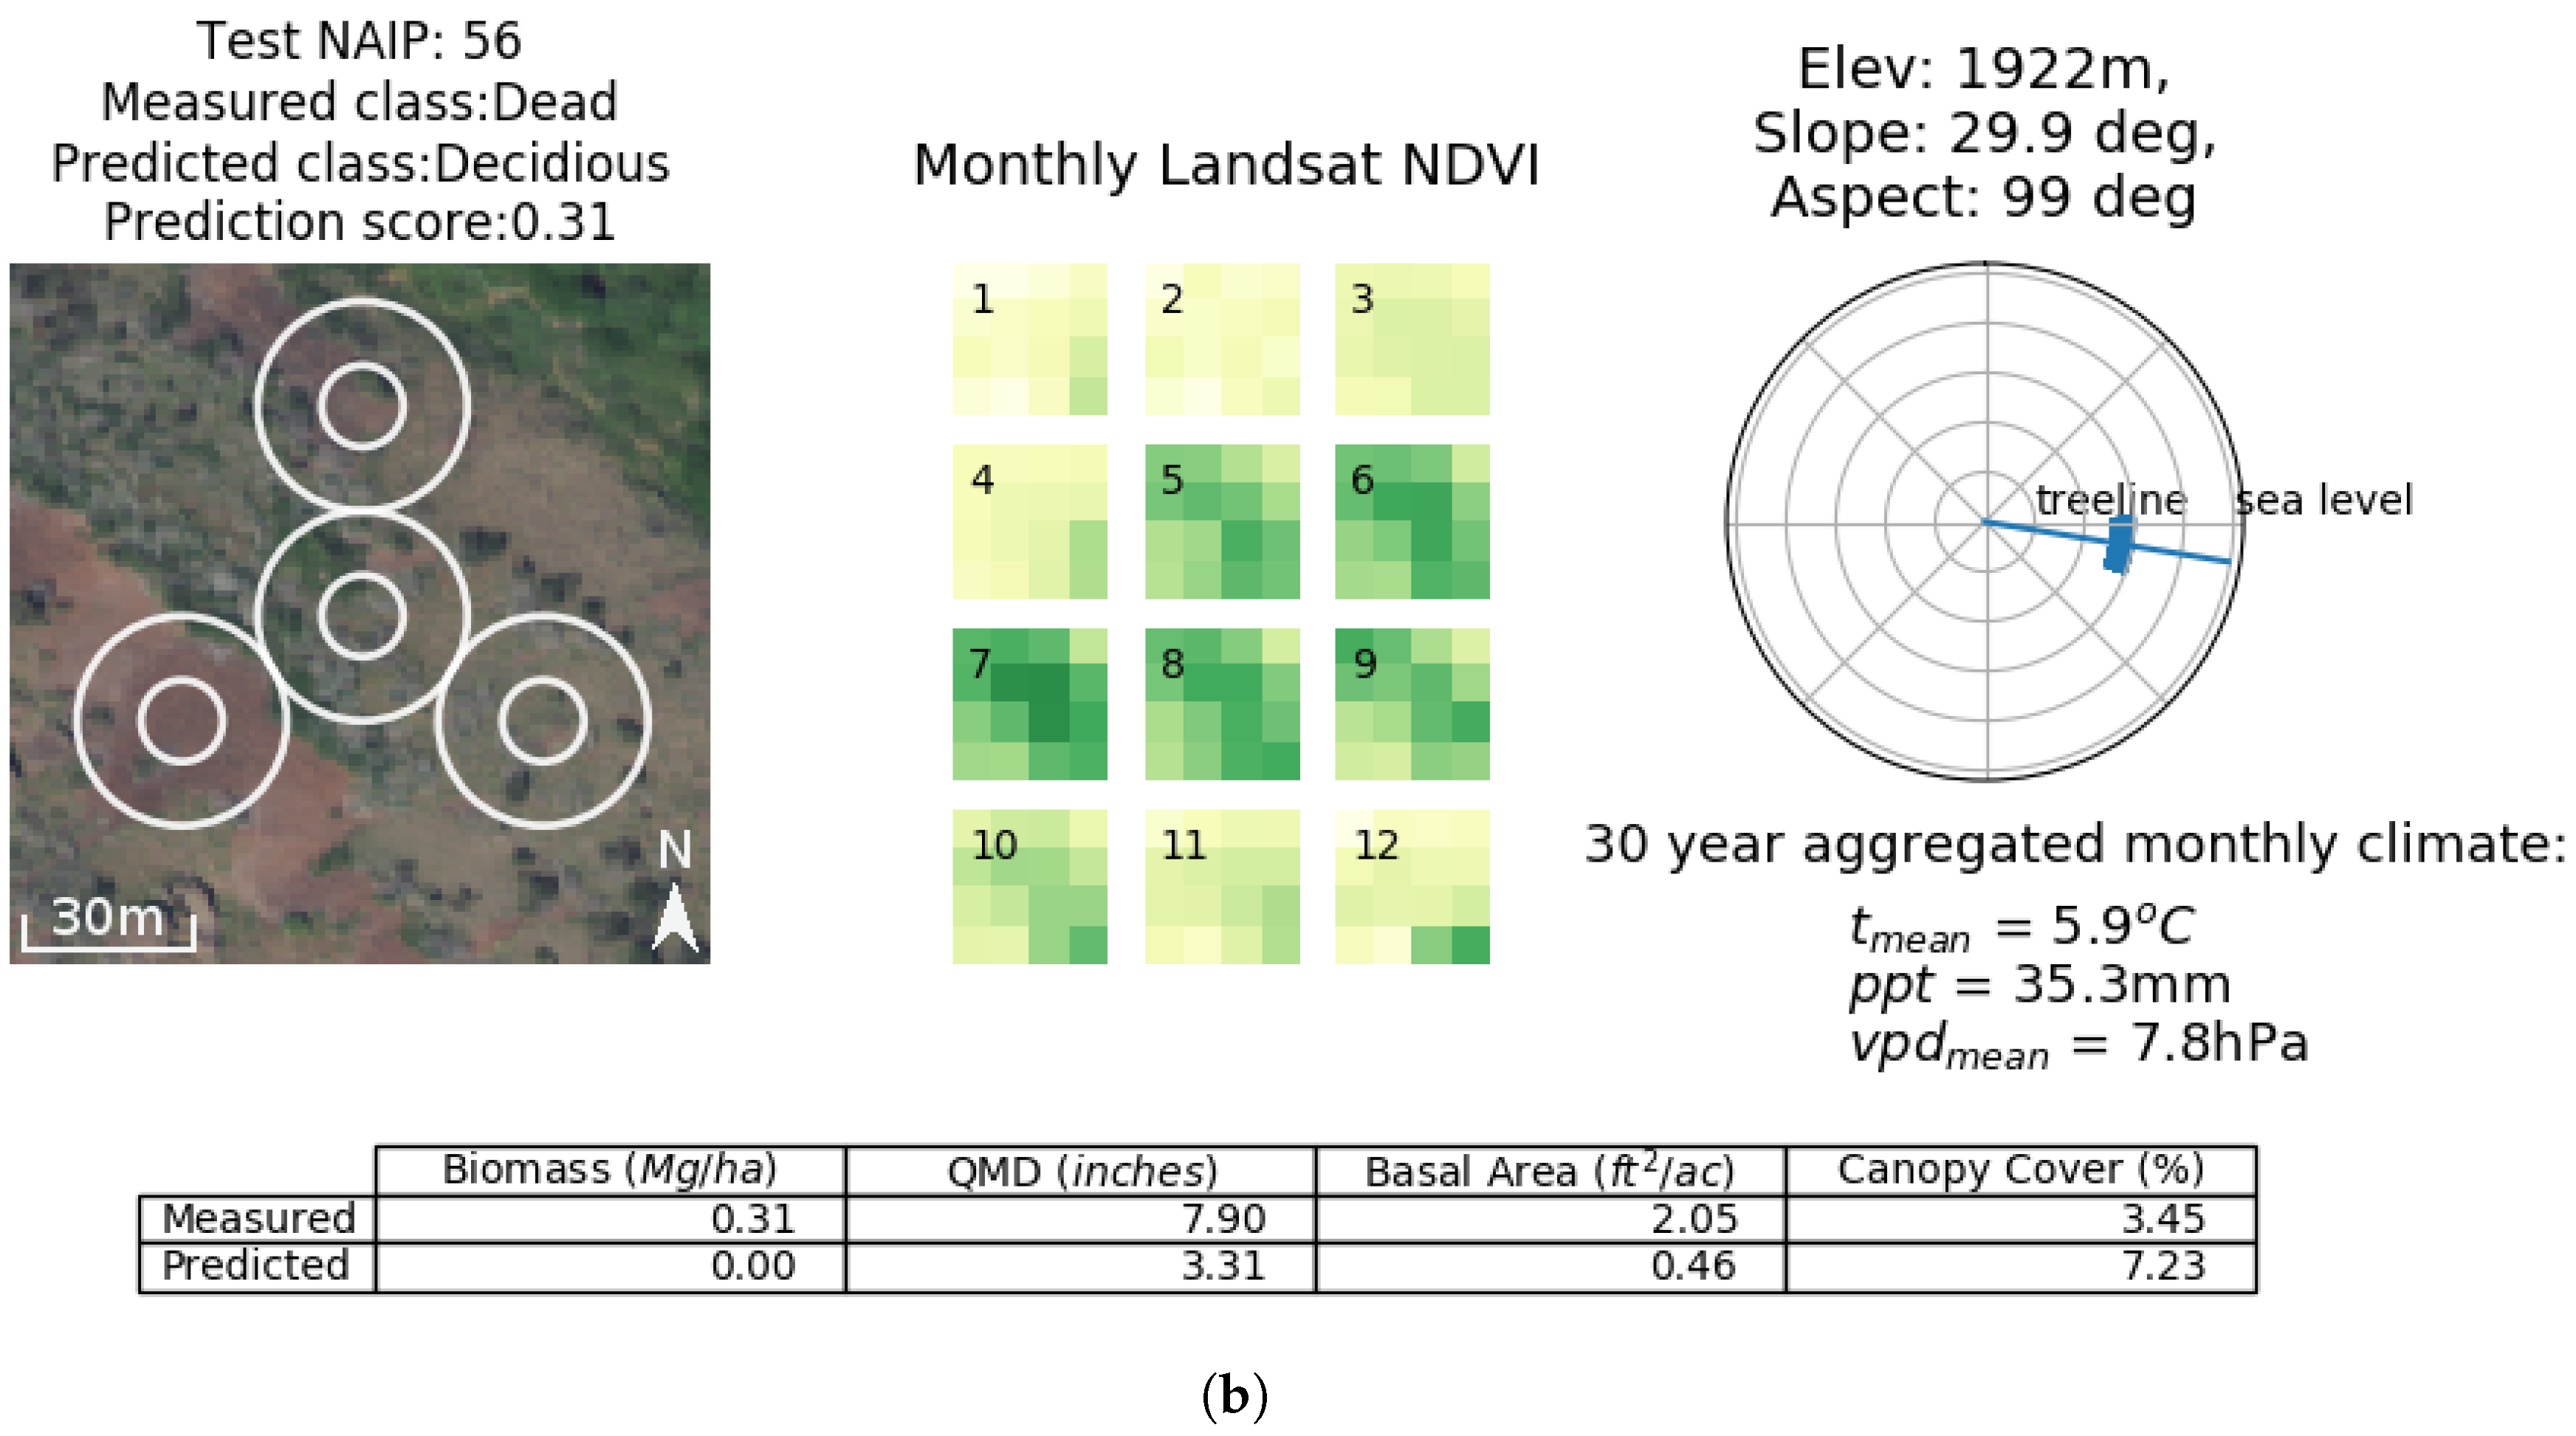
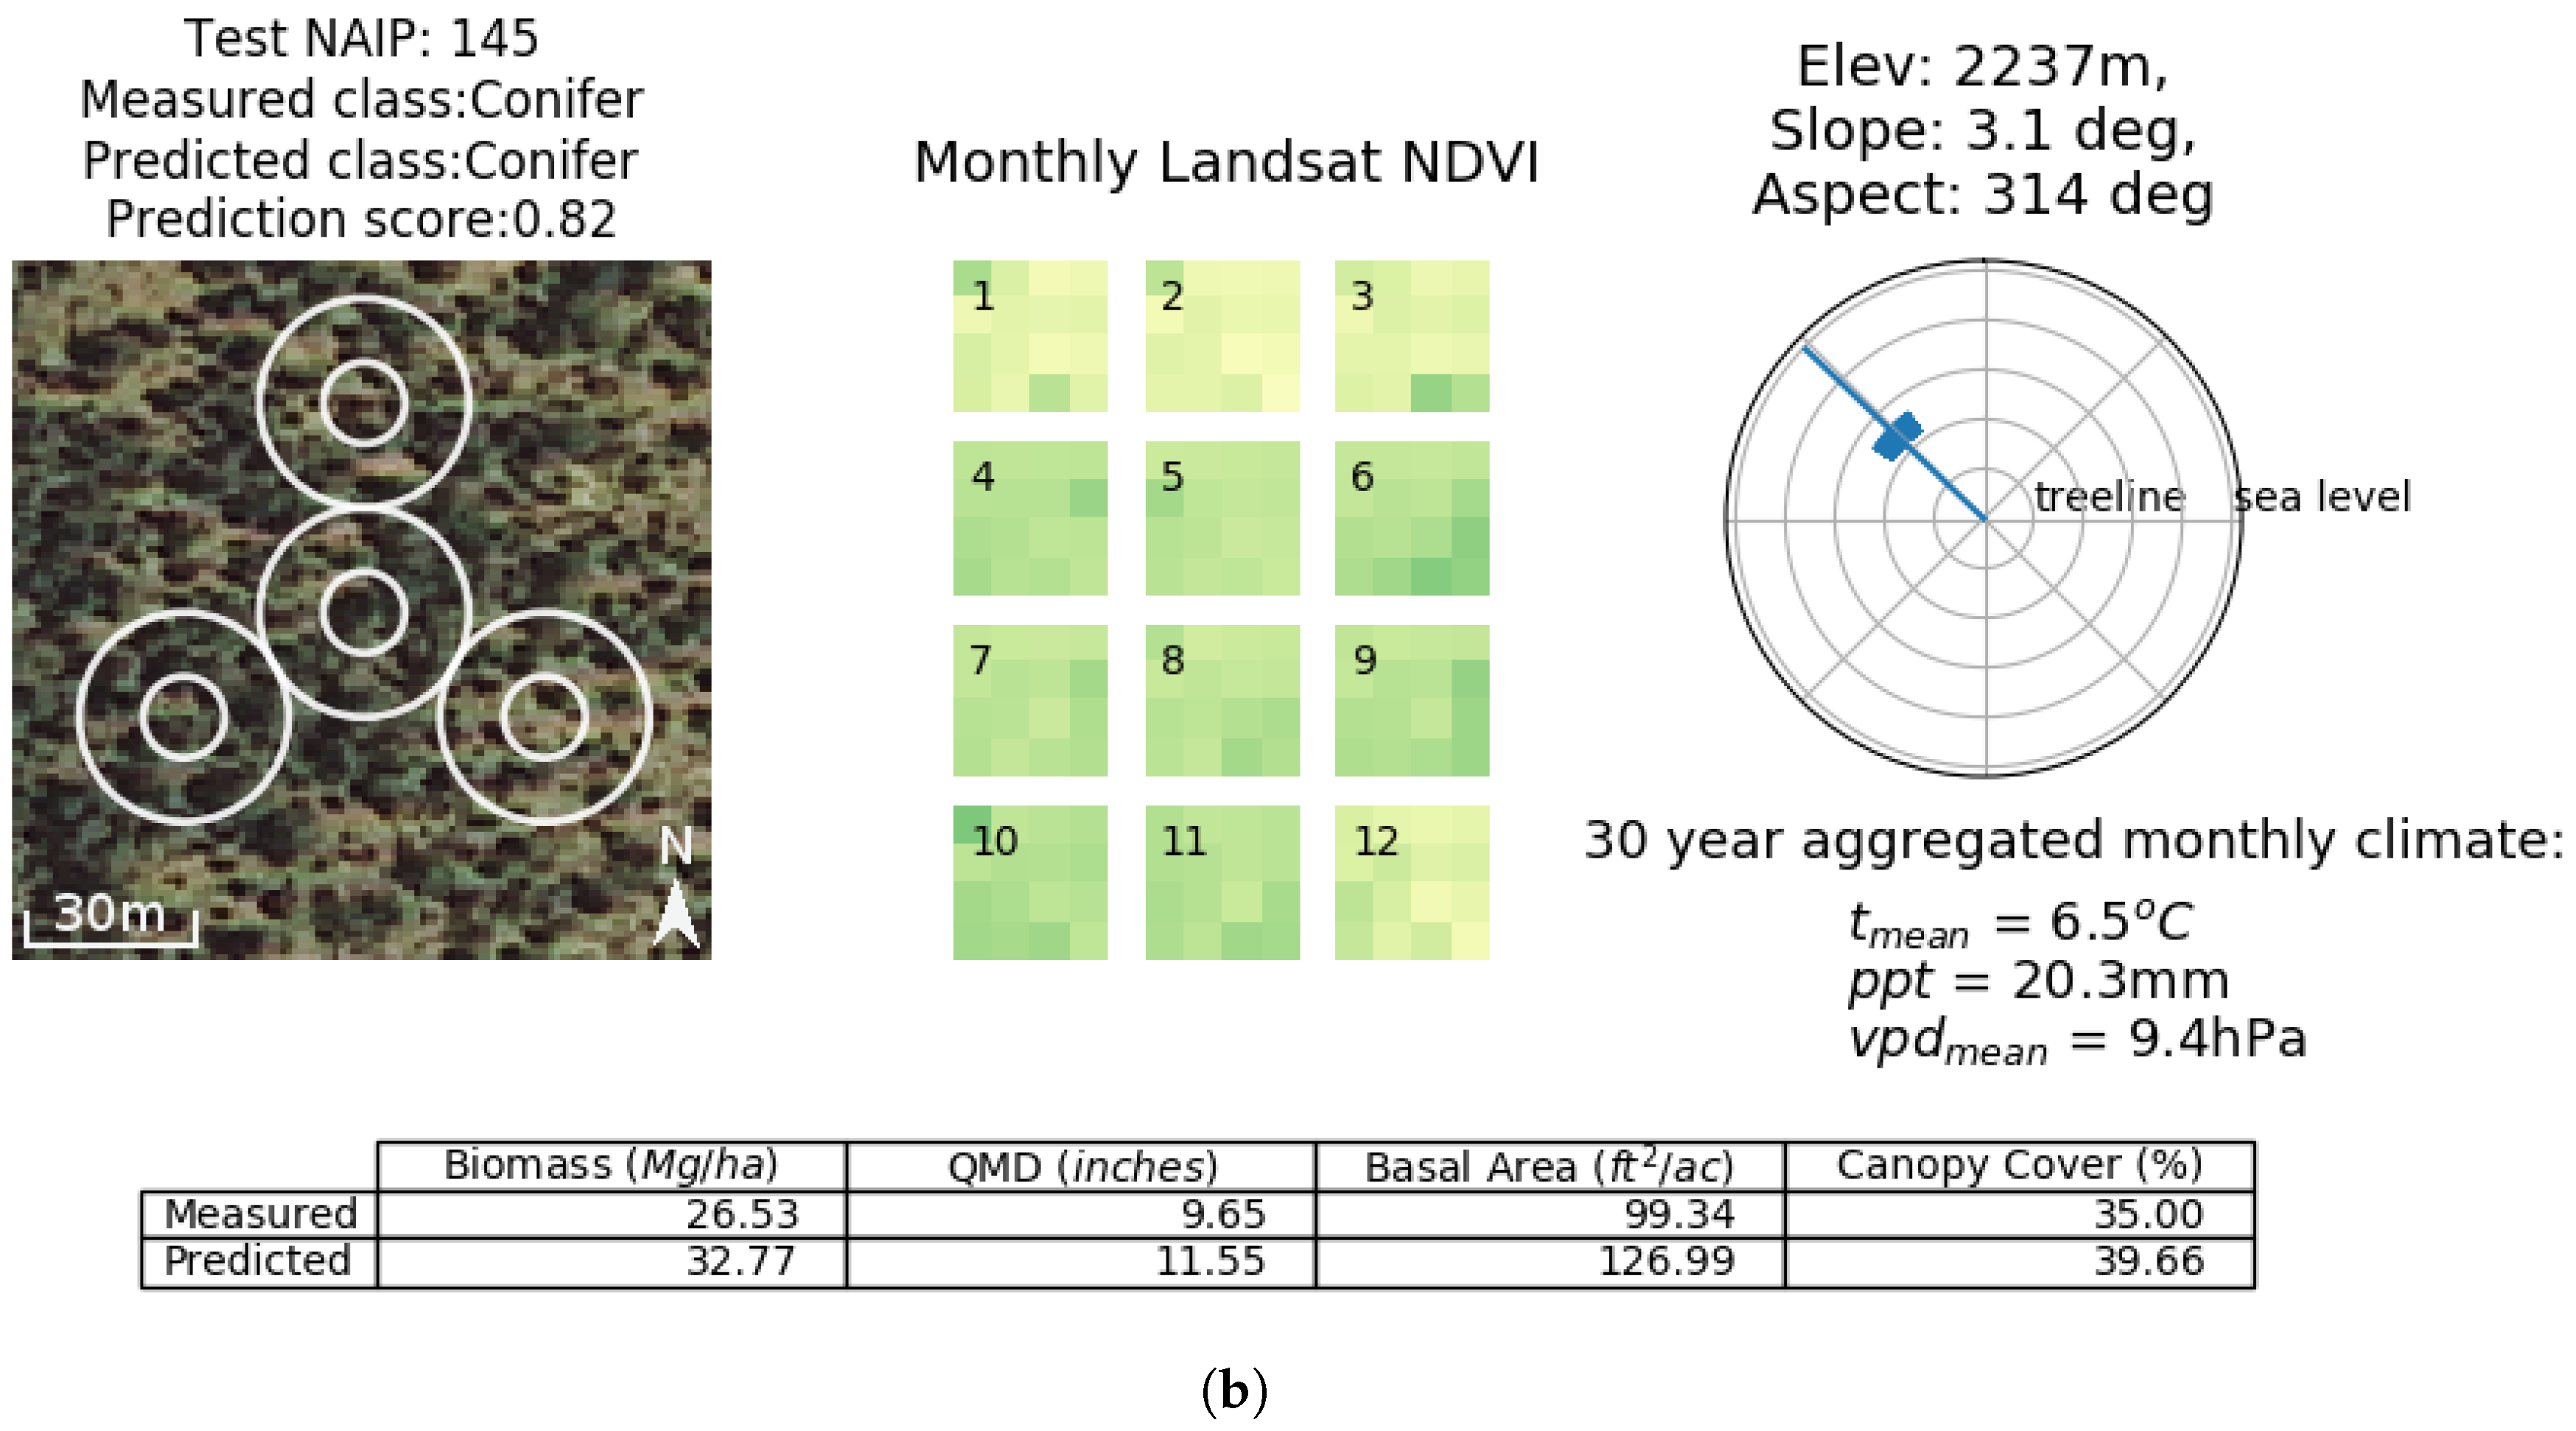
89]. These biases could include image distortion, object occlusion, and inconsistent lighting being abundant in NAIP training data due to off-nadir image acquisition, and Landsat seven commonly containing gaps due to scanline errors and poor quality pixels. By fitting multiple models and predicting in an ensemble, we show that the Chimera ensemble is able to qualitatively estimate land cover type and forest structure well (
Figure A3 and
Figure A5).
Caveats Associated with the Training Data
Although 27,966 FIA plots were available for the CA-NV study area, we removed a large proportion (>50%) of the samples after manual visual inspection, in which non-forest land-use classification defined by FIA did not correspond to the associated land cover in the NAIP image. Though time-consuming and laborious, this exercise was essential to prevent the model from learning incorrect image texture representations of the forest classes and structural attributes measured in situ [
21]. The performance of Chimera can mainly be attributed to its access to those 9967 quality data plots. CNNs are the most data-hungry method of machine learning, primarily due to the sheer number of parameters needed to fit the model, which in turn is based on the volume of training data. We also note that given the differences in FIA protocols over time and regions [
61], some forest structure response attributes such as canopy cover were measured subject to variability (in situ versus remote sensed image interpretation), which could have downstream effects on the performance of CE (
Figure A5). In terms of portability and robustness, it should be mentioned that our tests of CE are exclusively in the CA-NV region. Although a variety of US Western ecotypes, from temperate forests to semi-arid woodlands are represented in our analysis, our approach would not be applicable to make predictions of forest class or structure in rainforest ecotypes nor the hardwood forests of the Eastern US, unless CE were retrained on data from those specific forest types.
5. Conclusions and Future Research
We demonstrate the performance of a novel multi-task, multi-input recurrent convolutional neural network called the Chimera model for forest land use classification and forest structure estimation. We summarized the results of three major objectives as follows: (1) performance of the Chimera model was the highest with the full input dataset that included NAIP, Landsat time-series, and ancillary climate and topography data; (2) the Chimera model outperforms SVM and RF models with the same input data for all classification and regression tasks; and (3) ensembling of multiple Chimera models modestly increased predictive performance compared to a single best fit model alone. These results represent, to our knowledge, the first application of a RCNN with multi-input for improving estimations of forest structure.
The ability of the Chimera ensemble to distinguish between forested and non-forested land cover images within California and Nevada presents a new approach for generating a time-series of change detection for both afforestation and deforestation based on high-resolution imagery. Since our model requires only freely accessible data, we can feed new acquisitions of NAIP and Landsat scenes through the existing model to generate new predictions. This potential for continuous prediction is progress towards work similar to Wilson et al. [
8] who developed a model for imputing forest carbon stock at a nationally continuous scale. Given access to the national USFS FIA dataset, widely considered the “gold standard” of field collected forest metric samples within the entire United States, one would have a large enough sample size to parameterize multiple robust RCNN models focused on a forest of interest. A future iteration of the Chimera ensemble trained on a new subset of USFS FIA encompassing a region outside of California and Nevada could provide state-of-the-art estimates of forest structure in many completely different ecotypes. Additionally, with integration of advanced satellite technology including the GEDI and NISAR missions [
90,
91], more opportunities to combine LiDAR or radar information with existing NAIP and Landsat data could generate still better estimates of forest structure.
Finally, we see this study as just one indication of the promising application of deep learning architectures to ecology and remote sensing. Future work could include multi-task learning applied to land-cover and land-use mapping problems such as monitoring of woody encroachment on wetlands, or measuring forest loss due to wildfire or disease outbreaks. In addition to forest and stand structural characteristics, future research could inform the identification and delineation of key habitat attributes for wildlife [
92]. Wall-to-wall forest structural maps can also be used as inputs for fire modeling applications that depend on canopy cover, canopy height, canopy crown bulk density, and crown base height to determine fire behavior [
93]. Integration of our model in a “near real-time” wildfire probability model could provide estimates of fire risk and serve as a tool for prioritizing locations for fire prevention treatments [
94]. Predictive modeling applications (e.g., coastline vegetation, wetlands, grasslands, or shrublands) often require both classification (e.g., presence/absence, type) and regression (e.g., abundance/cover conditional on presence).
We have demonstrated that the Chimera architecture is capable of fusing various types of data (sensor, climate, and geophysical data, both time-varying and fixed) that are now commonplace in many ecological applications, and using the information they provide to improve predictive ability. By taking advantage of distributed cloud computing, future development of a continuously integrated pipeline could extend this model towards automatically updated landscape or global forest metric estimates. RCNN architectures similar to Chimera present an opportunity to combine disparate data types and move towards global-to-local level ecosystem monitoring.


