1. Introduction
Crop residue left in the field after harvest helps protect against water and wind erosion, increase soil organic matter, and improve soil quality [
1,
2,
3]. Because tillage intensity is the main management lever for controlling crop residue cover (CRC), a reduction in tillage is associated with increasing soil organic matter and water retention [
2,
4]. The decomposition and burning of crop residue produces carbon dioxide (CO
2) and other gases, increasing atmospheric carbon [
4,
5]. Thus, the proper management of crop residue is an integral part of many eco-friendly tillage systems and a major focus of research into the environmental effects of agricultural practices [
6,
7,
8].
Prior to the emergence of remote-sensing technology, large CRC surveys were limited by labor and resources. To date, the two traditional methods of line-point transect and photography have been used to measure the field CRC [
9,
10]. However, manual survey-based methods for quantifying CRC are time- and labor-consuming and, more importantly, are difficult to apply over large areas. In recent decades, spectral remote-sensing data acquired from ground platforms, unmanned aerial vehicles, airborne platforms, and satellite platforms have been used to capture field spectra in narrow bands and have provided information about the soil surface. As a result, tillage practices and estimating CRC based on remote-sensing data has become a topic of significant interest to environmental and agricultural researchers [
11,
12,
13,
14,
15,
16,
17].
Crop-residue reflectance spectra depend on crop type, variety, moisture content, lignin and cellulose content, and other factors [
18,
19,
20,
21,
22,
23]. Soil and crop residues have different spectral absorption features and therefore different spectral reflectance features [
5,
23,
24,
25,
26]. In recent years, a series of methods to estimate CRC based on remote-sensing data has been proposed and applied on local and regional scales to monitor crop residue. These methods may be divided into three types: (i) the linear spectral unmixing technique, (ii) the spectral index (SI) technique, and (iii) the triangle space technique. Linear spectral unmixing is a physical model that determines the relative contribution or abundance of each endmember relative to the total reflectance recorded for each pixel [
27]. The output of spectral unmixing is a series of fraction maps that indicates the proportion (range 0 to 1) of each endmember present in each pixel [
28]. Linear spectral unmixing can be applied to multispectral remote-sensing data only if reflectance is determined by a limited number of endmembers, such as soil and crop residue [
29]. The SI technique has achieved great success in remote-sensing-based farmland monitoring. An SI is a combination of two or more remotely detected reflectance bands. Estimates of CRC based on remote-sensing data are quantified by using SIs, such as the dead fuel index (DFI) [
30], the normalized difference index (NDI, NDI5, and NDI7) [
31], the normalized difference tillage index [
32], the normalized difference senescent vegetation index (NDSVI) [
33], the short-wave near-infrared normalized difference residue index (SRNDI) [
34], the cellulose absorption index (CAI) [
35], the shortwave infrared normalized difference residue index (SINDRI) [
36], and lignin cellulose absorption [
37]. A linear or exponential empirical CRC-estimation equation can be constructed and applied to remote-sensing data by using SI methods. The triangle-space technique uses two SIs or bands to create a two-dimensional scatter map, as done in the methods involving the multiband crop-residue index [
38] or the CAI normalized difference vegetation index [
39]. This approach determines the proportions of crop residue, soil, and vegetation on the soil surface based on their spatial locations in a triangular space.
However, the use of remote-sensing-based techniques to estimate CRC has been limited by the variations in the field of moisture in the crop residue and soil [
18,
20,
23]. Variations in the distribution of crop residue moisture (CRM) and of soil moisture (SM) in the field lead to variations in each pixel of the endmember spectra of crop residue and soil [
24,
40]. For example, in practice, linear spectral unmixing techniques that use fixed crop residue and soil endmember spectra can lead to inaccurate estimates of the spectral constituents that indicate the abundance of pure crop residue [
41]. In addition, the cellulose and lignin absorption features are attenuated as moisture content increases, thereby reducing the accuracy of estimates of CRC based on existing SIs [
20,
24]. Thus, an accurate estimate of CRC requires consideration of the moisture distribution in the field.
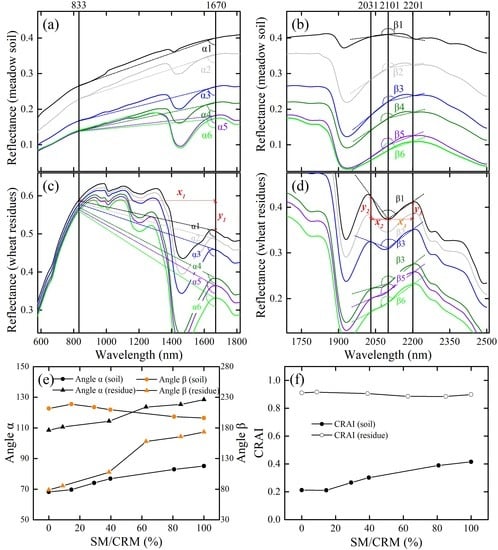
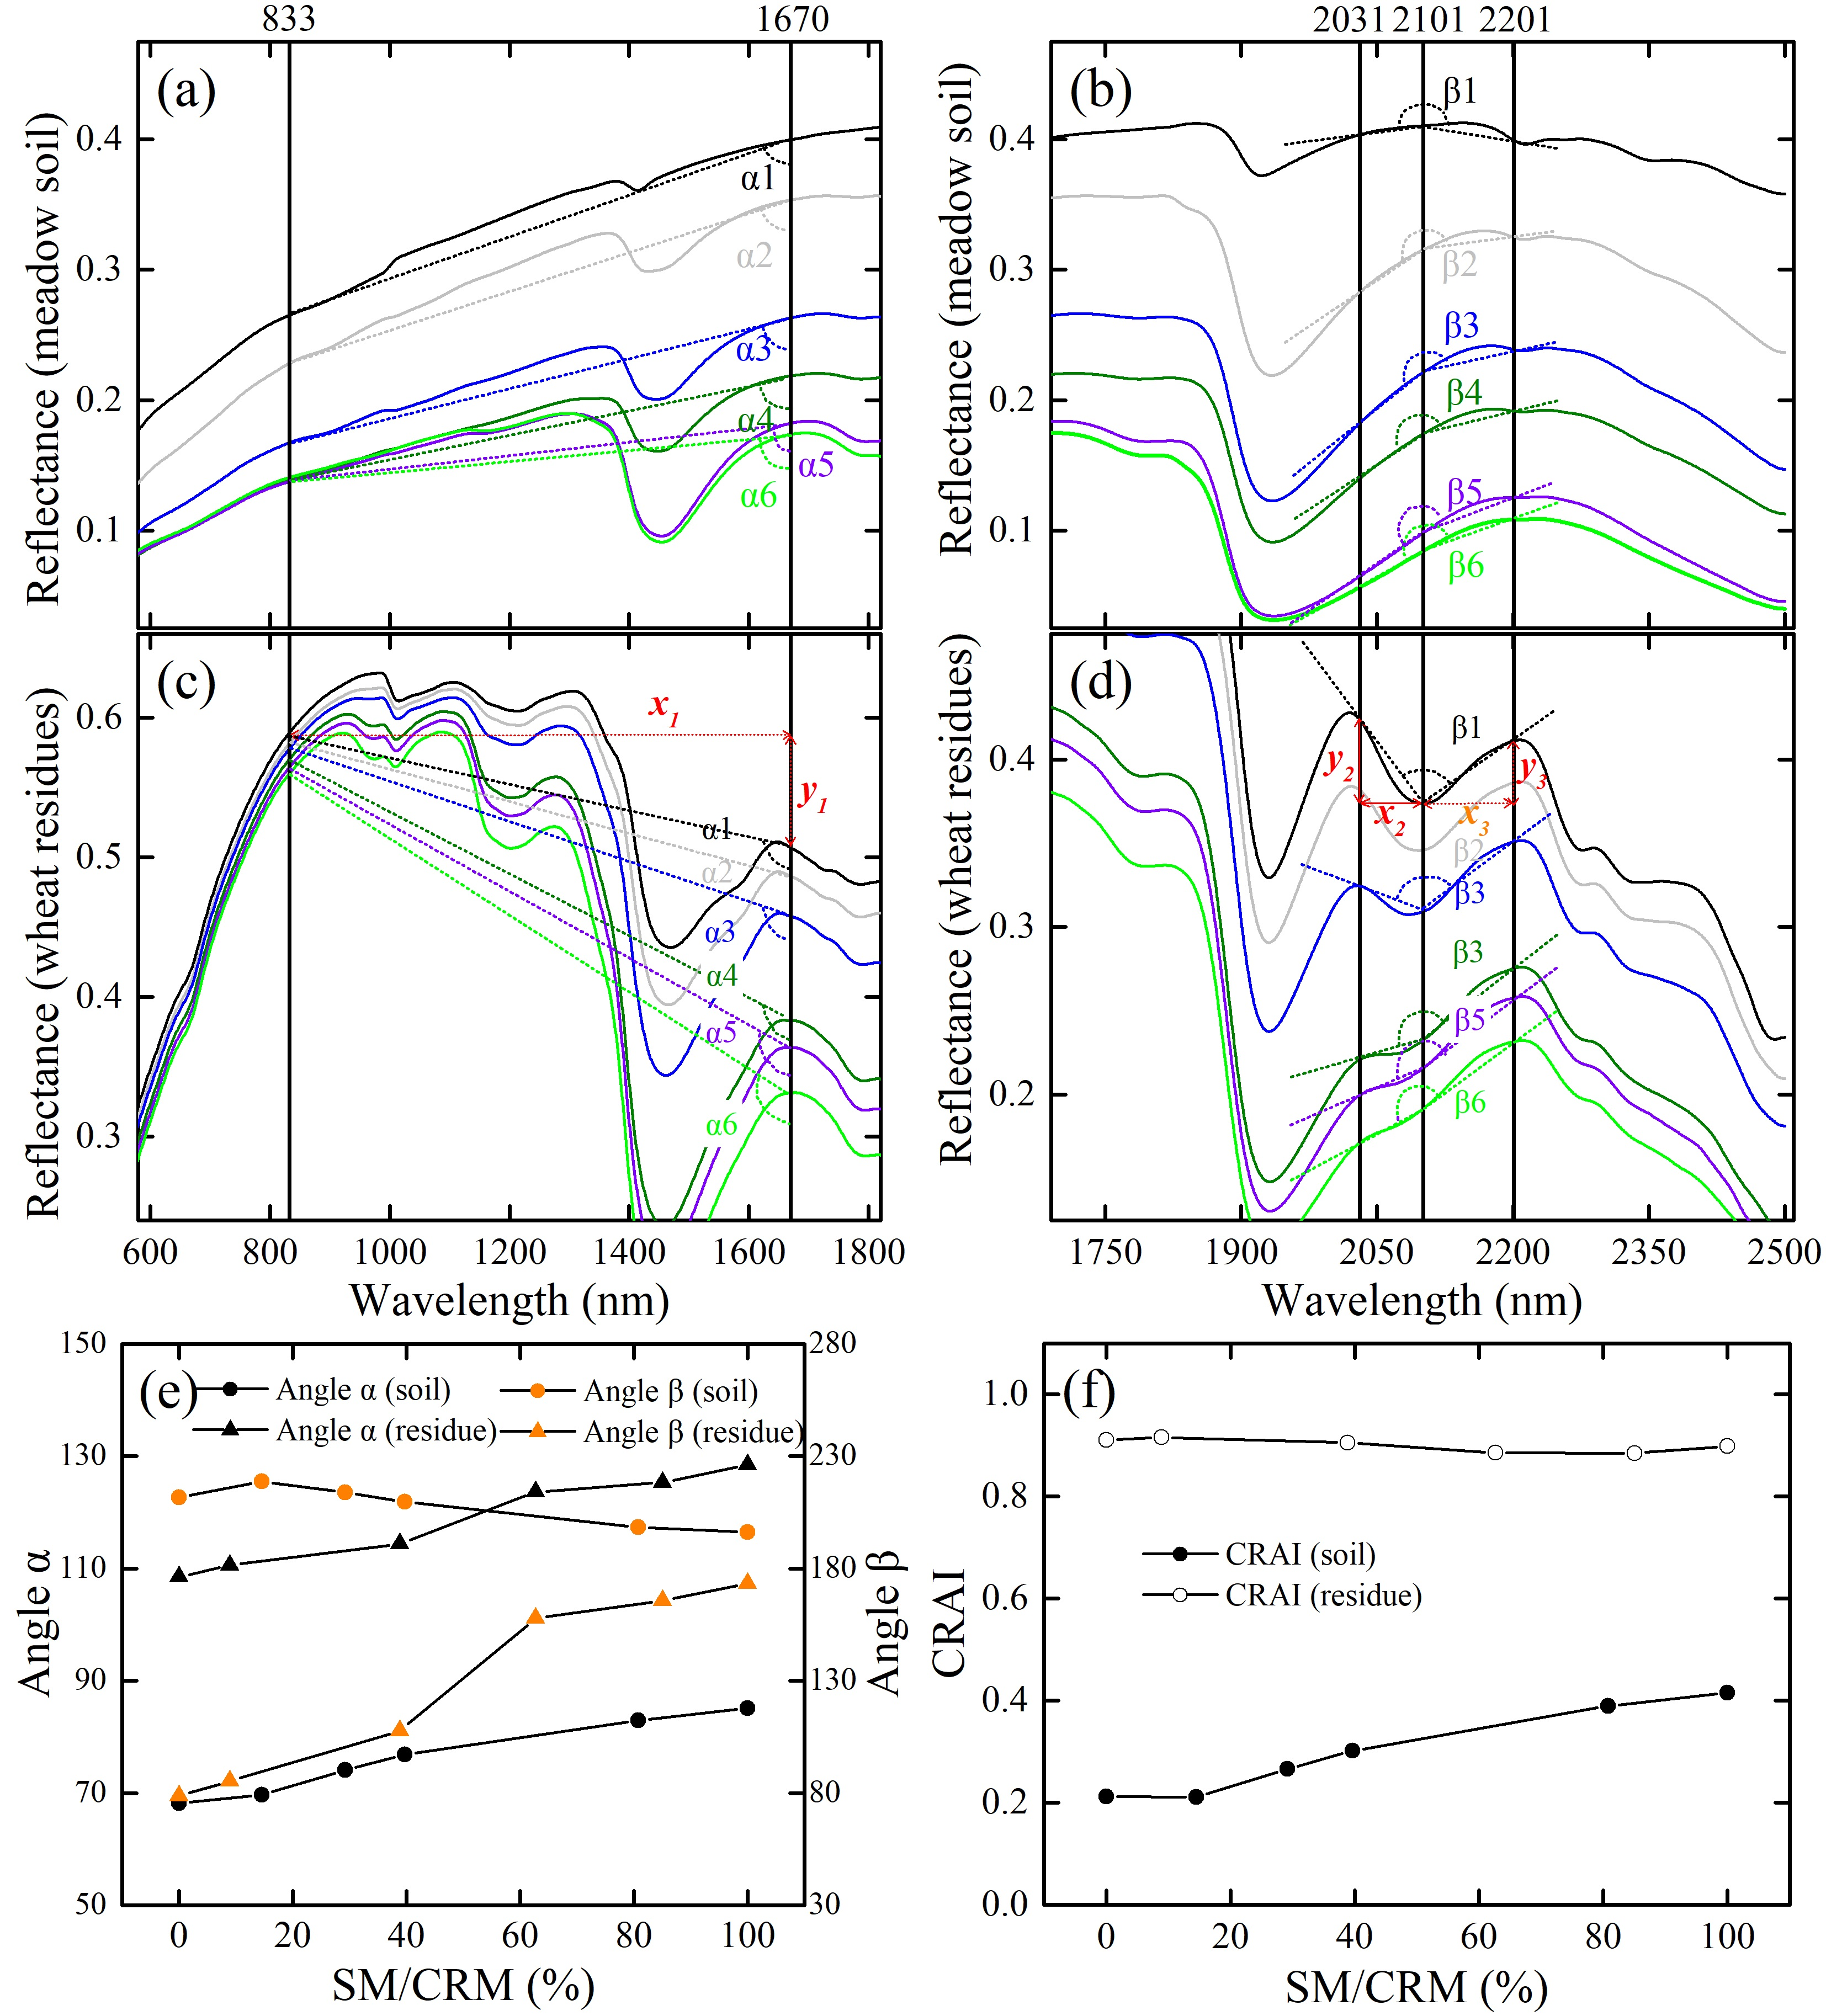
A laboratory-based hyperspectral analysis that takes into account SM/CRM effects is very meaningful to estimation of CRC accurately. The current study uses laboratory-based tests ((i) a dry dataset (air-dried soils and crop residues, n = 392); (ii) a wet dataset (wet soils and crop residues, n = 822); (iii) a saturated dataset (saturated soils and crop residues, n = 402); and (iv) all datasets (n = 1616)), which allows us to analysis the soil and crop residue hyperspectral response to varying SM/CRM. The present study proposes a crop residue angle index (CRAI) to estimate the CRC for four distinct soils, various SM/CRM. The CRAI combines two features that reflect the moisture content of soils and crop residue (
Section 2.2). The first is the that the moisture content of soil and crop residue causes differing reflectance in the near-infrared band (833 nm) and the short-wave near-infrared band (SWIR, 1670 nm), and the second is that the lignin, cellulose, and moisture content of soil and crop residue causes differing reflectance in the bands at 2101, 2031, and 2201 nm. Laboratory study suggests that the CRAI is promising for estimating CRC with the four soils and with varying SM/CRM. (Note that the CRAI has yet to be verified in the field). The method involves the following three steps:
(1) Spectral data from laboratory measurements (dry, wet, and saturated samples) are used to analyze the soils/crop residues hyperspectral response to SM/CRM (
Section 2.1), and crop residue angle index to combine two hyperspectral angle features (
Section 2.2).
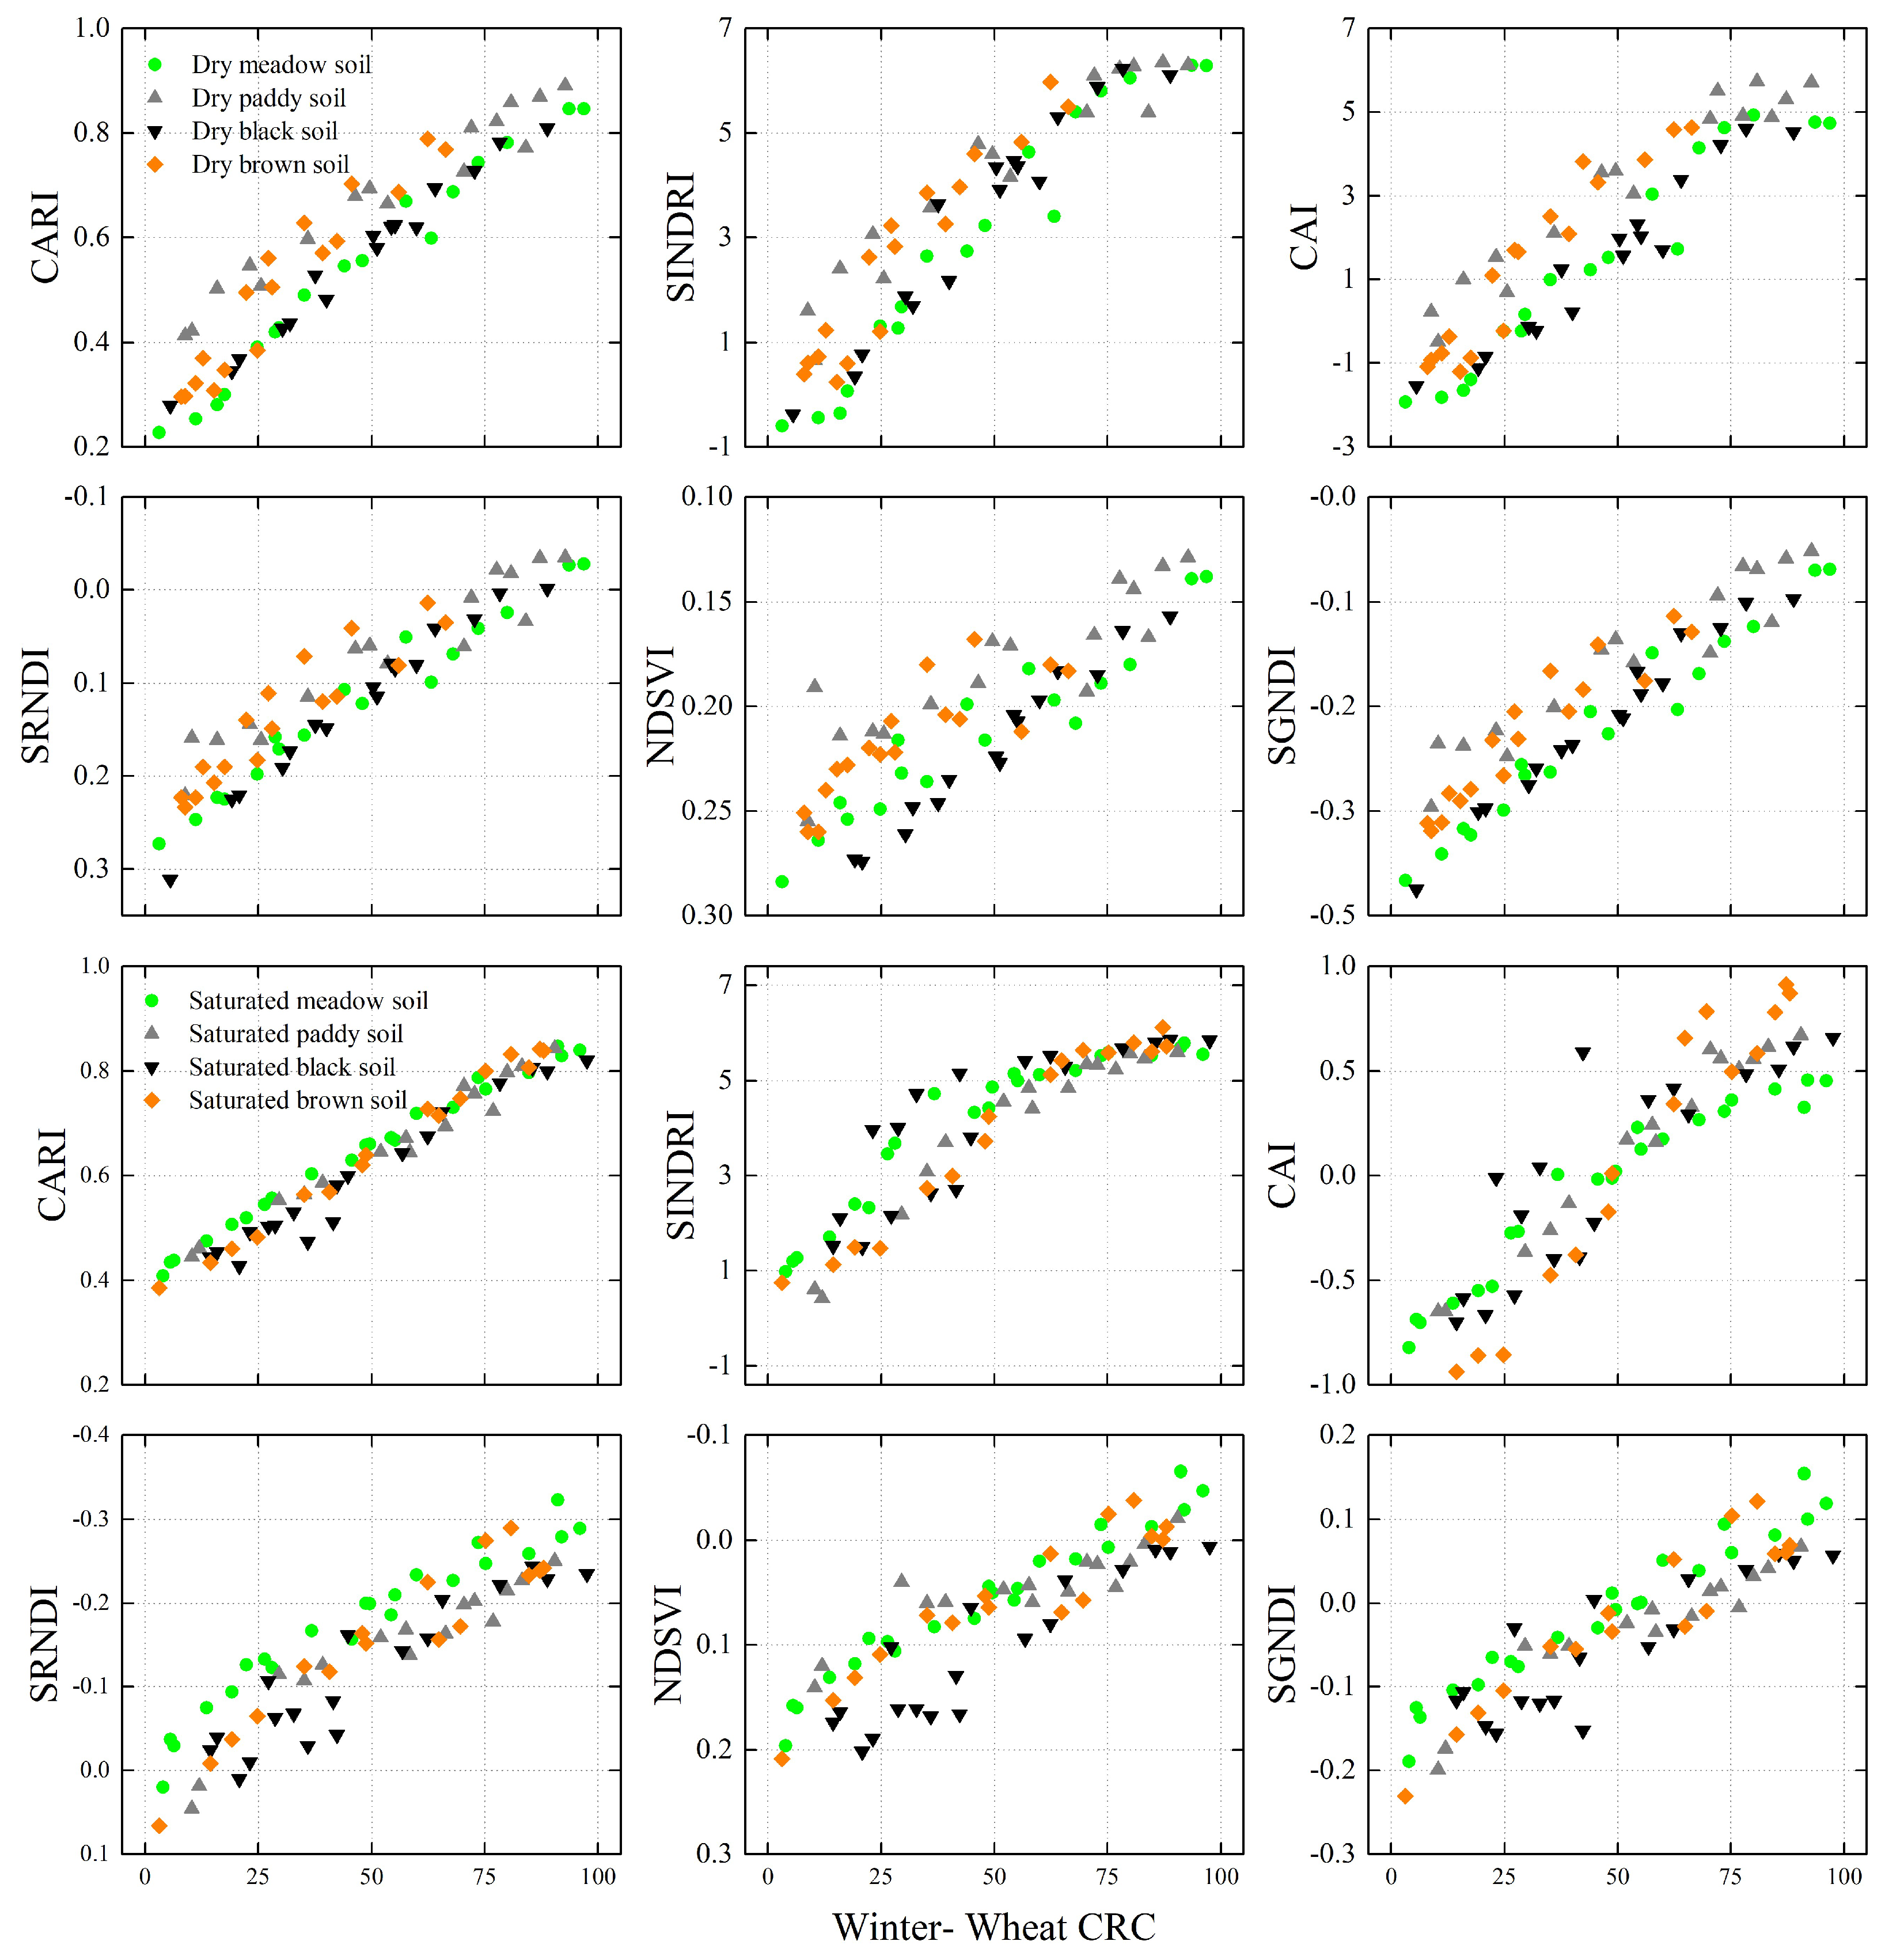
(2) Spectral data from laboratory measurements are used to analyze the correlation coefficients between CRC and (i) nine broad-band SIs, (ii) the SINDRI, and (iii) the CAI (
Section 4.1).
(3) Spectral data from laboratory measurements are used to analyze the response of SIs to SM/CRM and soil background. Laboratory-based (i) dry, (ii) wet, (iii) saturated, and (iv) all datasets are used to compare how moisture content and soil background affect the selected SIs ((i) the proposed CRAI, (ii) the CAI, (iii) the SINDRI, and (iv) selected broad-band-based Sis) (
Section 4.2).
(4) Random sampling validation is used to evaluate the accuracy of estimates of CRC based on these SIs (
Section 4.3). We also discuss the accuracy of CRC estimates based on SIs (
Section 5).
3. Laboratory Data Collection
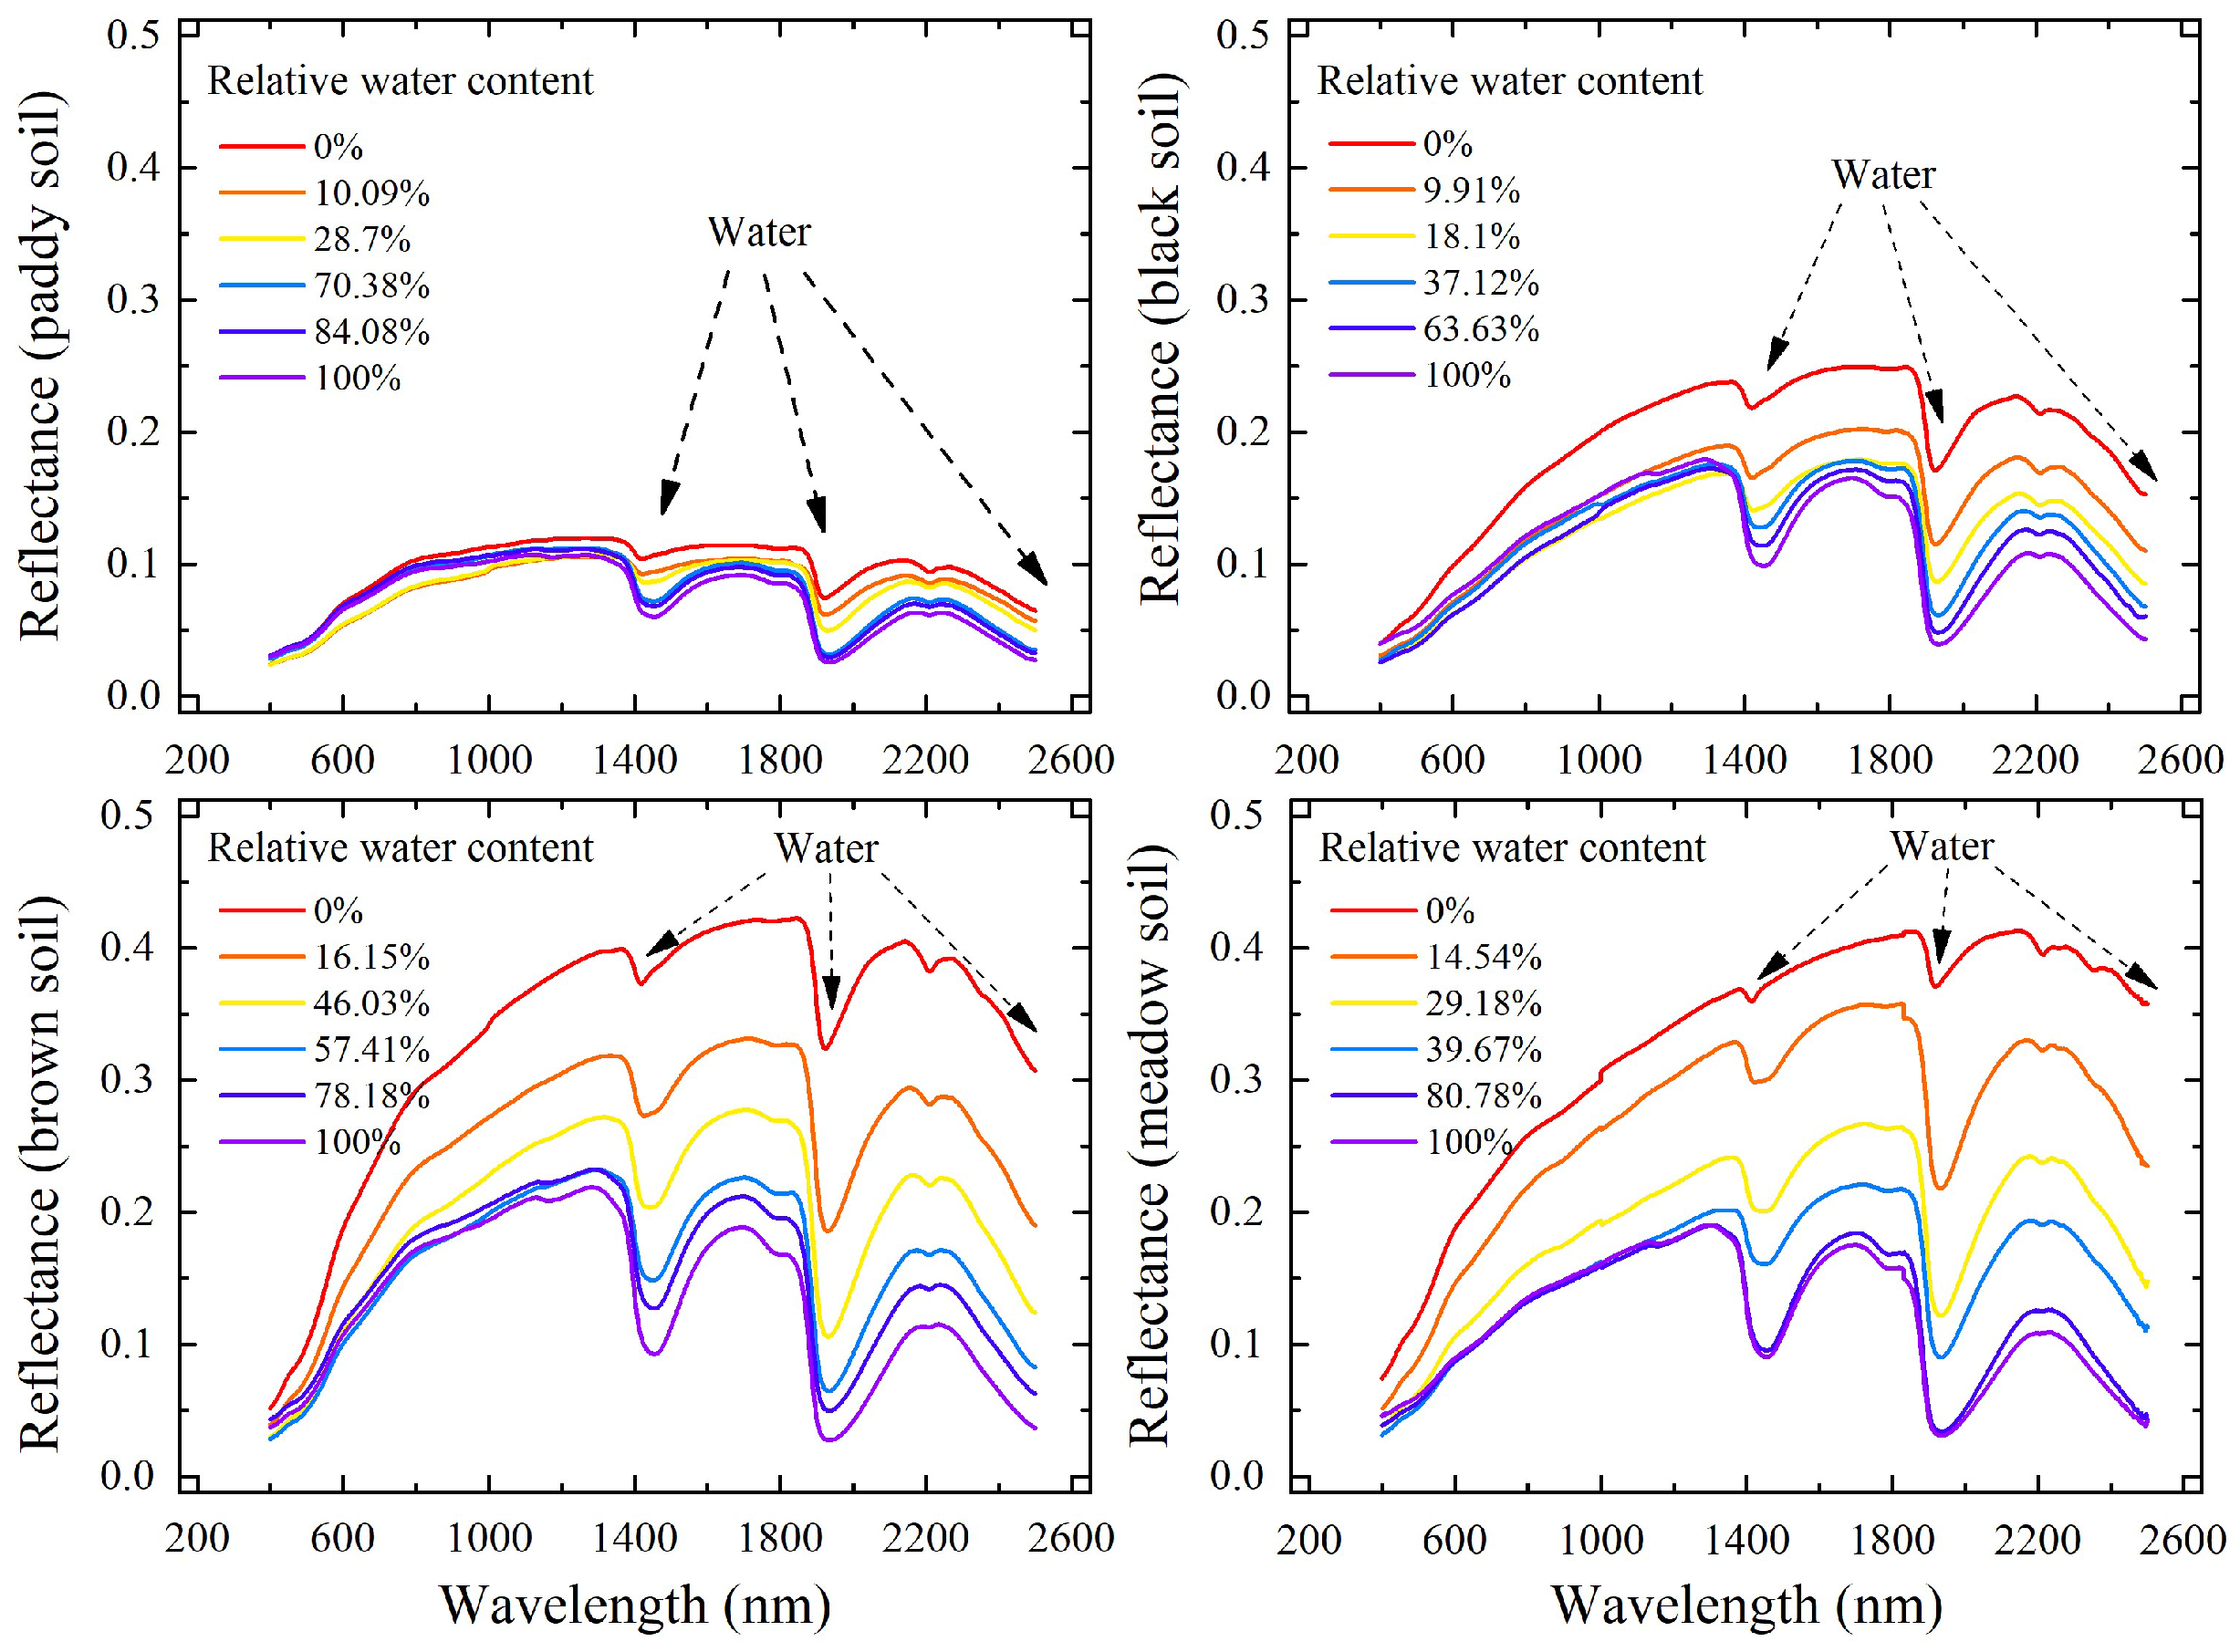
Two crop residues (winter wheat and maize) and four spectrally distinct soils (paddy soil, black soil, meadow soil, and brown soil; see details in
Table A1) were collected from fields (soil reflectance spectra are shown in
Figure 1, crop residue reflectance spectra are shown in
Figure 2) in Jining City and Nanjing City (
Table A1). Jining City has a medium-latitude monsoon climate, an average rainfall of 751 mm, and an average temperature of 13.6 °C. (Meteorological data were acquired from the China Meteorological Data Service,
http://data.cma.cn/). Winter wheat, maize and soya bean are the main crops in Jining. Winter-wheat residue was collected in Jining City (harvested in early June, 2018). Nanjing City has an average altitude of 20 m, a subtropical humid monsoon climate, an average rainfall of 1106 mm, and an average temperature of 15.4 °C. Maize, winter wheat, and rice are the main crops in Nanjing. Maize residue was collected in Nanjing City (harvested at the end of October, 2018). The soil texture was analyzed, and the percentage of clay, silt, and sand in soil samples was calculated.
Table A1 summarizes the characteristics of the field soil and shows that the soils texture is clay.
3.1. Laboratory Measurements
3.1.1. Hyperspectral Measurements
In a spectral laboratory, we measured the dry, wet, and saturated soils and the crop residue mixed hyperspectral reflectance by using an ASD FieldSpec 3 spectrometer (see
Figure 4). The ASD FieldSpec 3 spectrometer offers full-range detection (350–2500 nm with a spectral resolution of 3 nm at 700 nm, 8.5 nm at 1400 nm, and 6.5 nm at 2100 nm) and acquires visible/NIR/SWIR data over the entire solar spectrum. In addition, the data were automatically resampled for 1 nm spacing. As shown in
Figure 4, all samples were illuminated by a halogen lamp mounted on the arm of a camera stand and held 50 cm above the workbench to create a 45° illumination zenith angle. The bench was covered with a black tablecloth. The field spectrometer was calibrated by using the reflectance from a 40 × 40 cm BaSO
4 reference panel, and the hyperspectral reflectance of each sample was acquired with the ASD FieldSpec 3 spectrometer fore-optic at 40 cm above the sample at a 0° zenith angle, resulting in a 0.177 m diameter field of view. Five reflectance spectra were acquired from each sample, the average of which was recorded as the reflectance spectrum for the sample.
The experimental process was as follows: (i) The four soils (
Table A1) were air-dried, crushed, and passed through a 2 mm screen, and then deposited to a depth of 1 cm in a round 23-cm-radius tray. The crop residue samples (air-dried) were then cut into 10 cm sections; (ii) Beginning with the bare dry soils, dry crop residue segments were gradually added onto the soil surface in the round trays. We then measured the mixed hyperspectral reflectance of the soils and crop residue and took digital photographs. When the soils were all covered by crop residue, we started to remove the crop residue sections until bare soil was reached; (iii) The crop residue samples were then placed in a round black plastic bowl and sprayed with water, and the soils were sprayed with water until saturated. As in step (ii), we then measured the mixed hyperspectral reflectance of the soils and crop residue and took digital photographs; and (iv) The saturated soil and crop residue samples were then placed in a dark room at about 24 °C for 6 and 12 hours, following which we again measured the hyperspectral reflectance of the (wet) soil and (wet) crop residue. Because crop residue was added manually, the number of samples in the various groups ranged from 43 to 56 (see
Table 2).
The hyperspectral reflectance acquired in the spectroscopy laboratory was resampled to generate broad-band multispectral remote-sensing data (see
Table 1) by using the corresponding spectral response functions, which were obtained from the spectral laboratory tools available in the ENVI image-processing and analysis software (ITT Visual Information Solutions, Boulder, CO, USA).
3.1.2. Crop Residue Cover and Moisture Measurements
We used a digital camera (Canon SX710 HS, Canon Inc., Tokyo, Japan) to take top-view photographs of each sampling position. The crop residue and soil fractions in the field of view of the spectrometer were visually analyzed by using a 125 dot overlay [
22] on the digital image (
Figure 5). Next, the CRC was calculated by using:
where
SUMresidue is the total number of crop residue dots obtained by manual counting.
In this study, the relative SM/CRM were calculated by using:
where
msat (
mdry) is the mass of saturated (air-dried) soil or crop residue sample, and
m0 is the mass of the soil or crop residue sample.
3.2. Estimate of Crop Residue Cover and Statistical Analysis
3.2.1. Estimate of Crop Residue Cover
Triangle-space techniques (e.g., DFI-NDVI [
16], CAI-NDVI [
39].) are widely used to estimate cropland CRC because crops and vegetation both appear in remote-sensing images. Thus, linear spectral unmixing is used to estimate the proportions of crop residue, soil, and vegetation, which makes it essential to evaluate the linear-equation-based CRC performance. In this study, we used a linear model (formula: CRC = a × Index + b) to estimate the wheat and maize CRC. From the laboratory measurements, we acquired a total of 1616 (835 for wheat, 781 for maize) sets of residues, soil hyperspectral reflectance measurements, and CRCs.
Table 2 gives the descriptive statistics for the measurements of SM/CRM content.
We used random sampling from all 1616 samples to evaluate the performance of the proposed CRAI and other SIs. Of these random samples, one third of the dataset (279 wheat and 261 maize) were used to analyze the relationship between the spectral indices, and the CRC. The equations for estimating the CRC from the indices were then established, and the remaining two thirds of the datasets (556 wheat and 520 maize) were used for validation.
3.2.2. Statistical Analysis
The coefficient of determination (
R2), root mean square error (RMSE), normalized root mean square error (nRMSE), and mean absolute error (MAE) were used to evaluate the performance of each model. Mathematically, a higher
R2 corresponds to a smaller RMSE and MAE, and thus indicates a more accurate model. The following equations were used to calculate
R2, RMSE, nRMSE, and MAE:
where
xi and
yi are the estimated and measured values, respectively,
and
are the average estimated and measured values, respectively,
n is the sample number, and
ymax and
ymin are the measured maximum and minimum CRC, respectively.


