Decreasing the Uncertainty of the Target Center Estimation at Terrestrial Laser Scanning by Choosing the Best Algorithm and by Improving the Target Design


Abstract
:1. Motivation
- How accurate is the TCE in general?
- How large is the influence of the algorithm on the TCE?
- How large is the influence of the target design on the TCE?
- How can the accuracy of the TCE be increased?
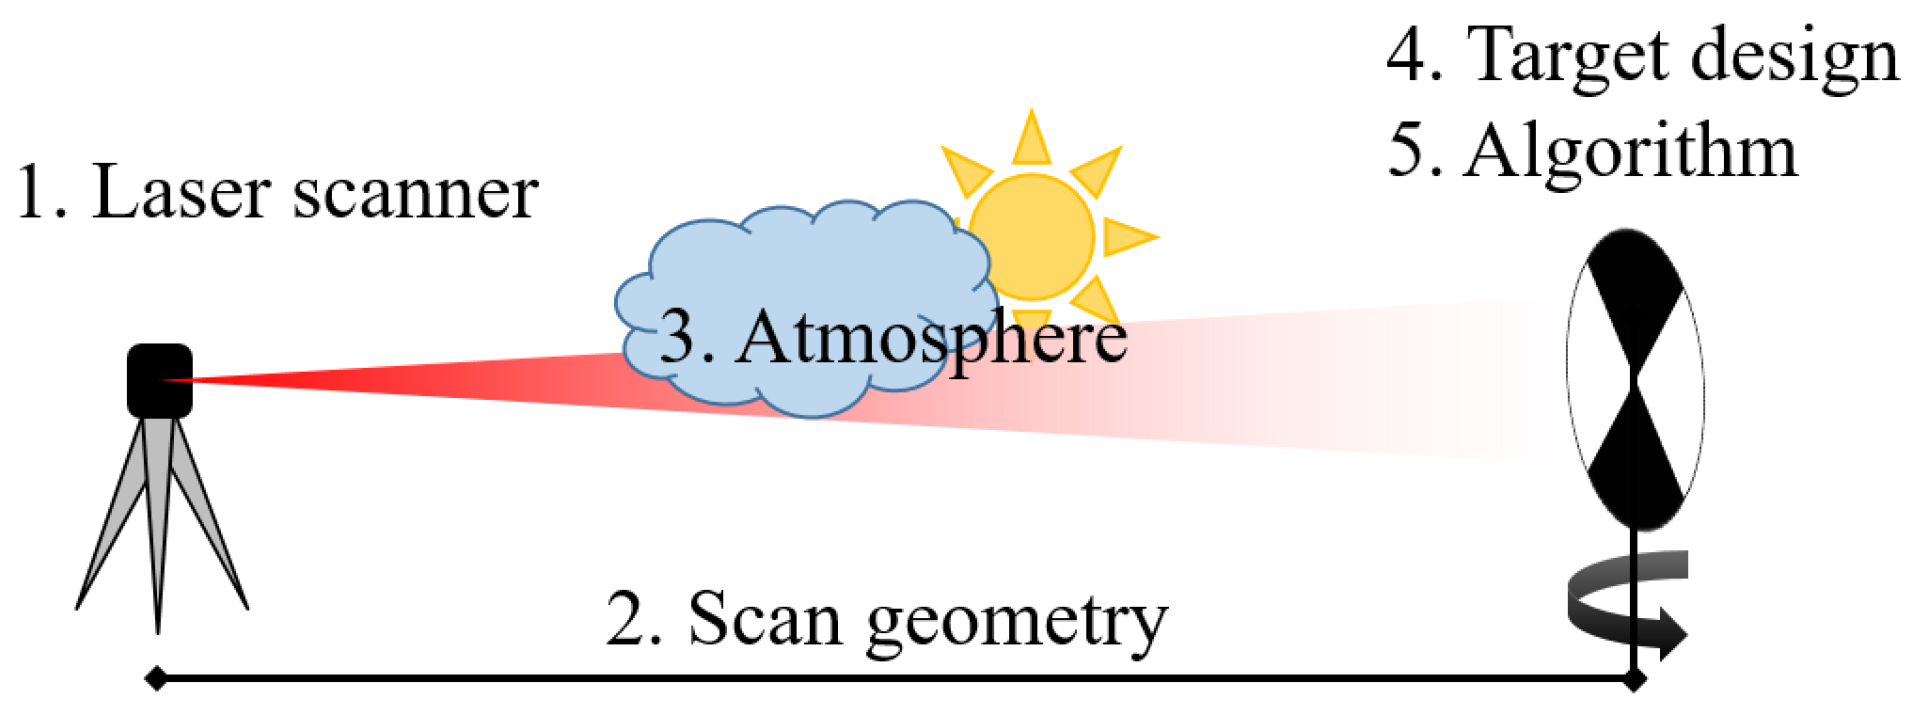
2. Influencing Factors on the Precision of Target Center Estimation
- Laser scanner: The influence of the laser scanner on the uncertainty of the TCE essentially depends on two variables:
- (a)
- The uncertainty of the scan points: Random errors of the angle and distance measurements lead to random errors in the three-dimensional point cloud, which is used for the TCE [10]. The systematic errors of the laser scanner shift the target center systematically. However, eliminating these systematic errors is the task of laser scanner calibration [3,11]. The systematic errors of the laser scanner are therefore not considered in this study.
- (b)
- The angular resolution and divergence of the laser beam: They define the effective spatial point density on the target [12,13]. It is assumed that a higher point density can lead to a more precise TCE than a lower point density, since the transition between black and white parts can be reconstructed sharper.
Both points lead to the fact that the precision of the TCE differs for different laser scanners and angular resolution settings. - Scan geometry: The geometry includes the distance and the incidence angle of the laser scanner to the target [14]. The returning intensity of the laser beam decreases with increasing distance, as well as with increasing incidence angle [15,16]. This leads to a decrease in the precision of the point cloud [17,18]. Since the target center is estimated from this point cloud, it can be assumed that the geometry also has an influence on the precision of the TCE. Zámečníková et al. [19] show that systematic errors in the single point measurement can also occur due to the incidence angle.
- Atmosphere: As with all electro-optical distance measurements, the atmosphere has an influence on the precision of the point. Due to the usual target distances of a few hundred meters and the sufficient correction models, which take temperature, air pressure, and humidity into account [20], it is of minor importance for TLS and thus also for the precision of the TCE. Therefore, the atmosphere will not be considered further in the following.
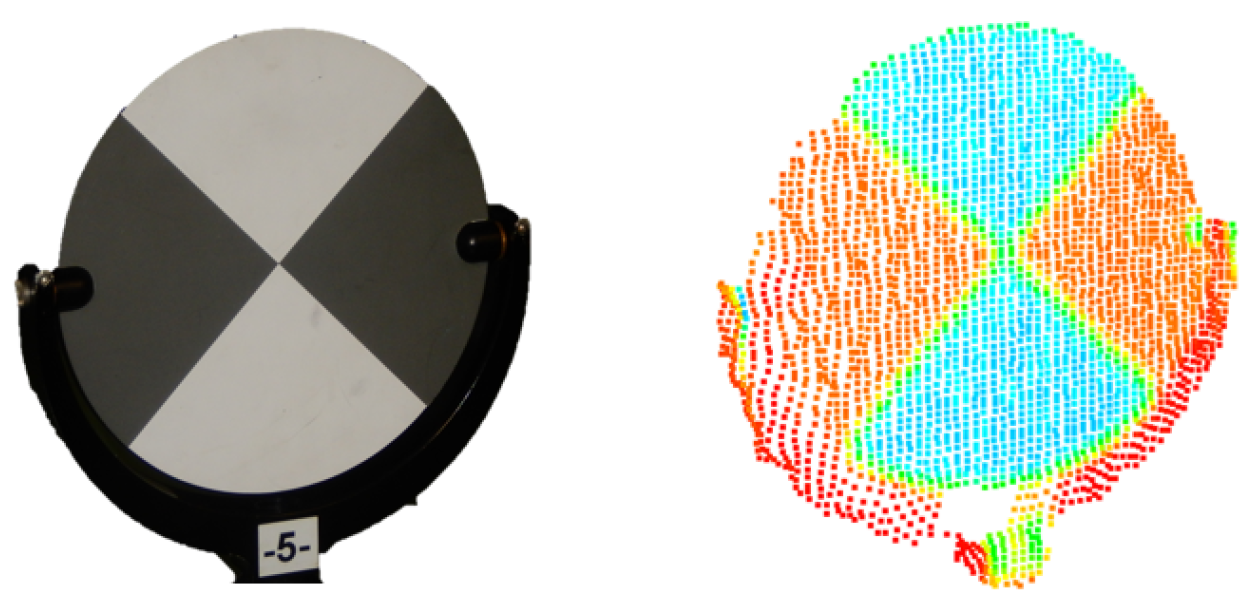
- Target design: It is known from the literature that the properties of the measured object, such as material, surface finish, color, and reflectivity, also affect the precision of the point cloud [8,10,21]. As with scan geometry, it can be assumed that the precision of the single point also influences the precision of the TCE. In addition to the object properties mentioned, the shape and pattern of the target have to be considered. A detailed description of these properties can be found in Section 4.1. Some studies have already investigated isolated parameters of targets [22,23,24], but no comparison of different commercially available targets has been made yet.
- Algorithm: From the point cloud recorded by the laser scanner, the coordinates of the target are estimated by means of an algorithm. For this, there are multiple algorithmic approaches [26,27,28]. It is assumed that not all algorithms provide equally precise coordinates. Hence, the following section investigates different algorithms for the TCE.
3. Influence of the Algorithm on the Uncertainty of the Target Center Estimation
3.1. Algorithmic Approaches for Target Center Estimation
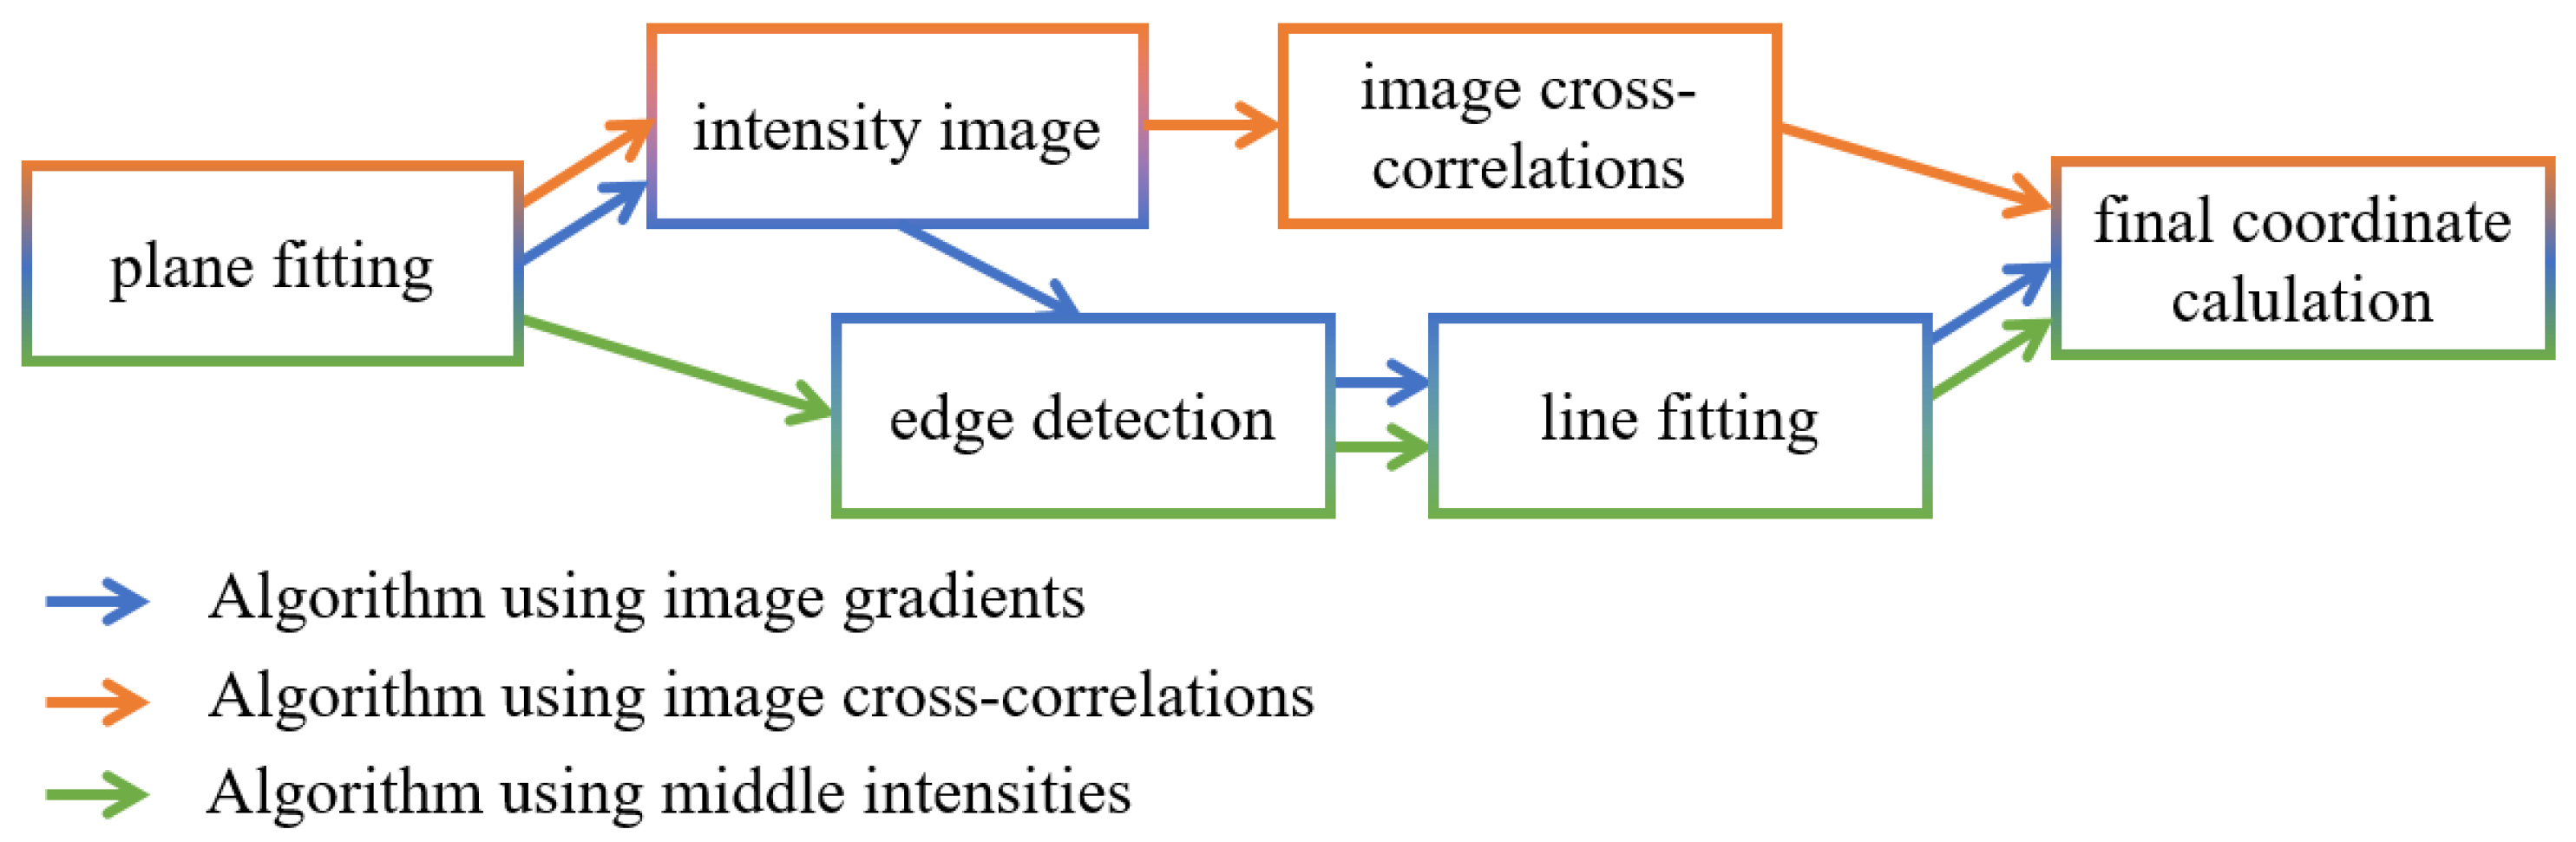
3.1.1. Algorithm Using Image Gradients (B.1)
- Plane fitting: Since the algorithm is limited to plane targets, a plane can first be estimated through the point cloud of the target. The RANSAC algorithm [39] is used to estimate a plane and thus identify all points that belong to this plane. Then, a final plane is estimated through the identified points of the target plane using the least squares adjustment [40]. To ensure a correct plane estimation, the stochastic model of a single point with its distance standard deviation and angular standard deviation has to be considered.After the plane estimation, the points are projected into the plane according to their residuals. So, in the following, the component orthogonal to the plane is neglected and only the remaining 2D point cloud is considered.
- Intensity image: The 2D point cloud is segmented into grid cells to derive an intensity image from the point cloud. Each grid cell forms a pixel to which a unique x and y coordinate can be assigned. The grey value of the pixel is interpolated from the intensities of the point cloud.The pixel size is theoretically arbitrary, but further investigations in preparation for the present study have shown that a pixel size smaller than 1 mm does not further improve the precision of the algorithm. Therefore, the pixel size is set to 1 mm in this paper.
- Edge detection: The edges between the black and white areas of the image are now extracted from the intensity image with the help of image gradients. For this, the Canny algorithm [41] is used. As a result, an edge image is obtained.
- Line fitting: The extracted edge pixels are used to estimate two lines, which represent the transitions of the checkerboard pattern. Again, the RANSAC algorithm first estimates the two best lines through all edge pixels in to classify whether the pixels belong to one of the two lines and if so, to which line. These pixels are then used to estimate the two best lines and using a least squares adjustment.
- Final coordinate calculation: From the intersection of the two lines and , the two-dimensional coordinates of the target center are obtained. The plane parameters from step 1 are used to transform the coordinate back into the three-dimensional space and to obtain the final 3D coordinate of the target center.
3.1.2. Algorithm Using Image Correlations (C.2)
- Plane fitting: Same procedure as for the algorithm using image gradients, see Section 3.1.1.
- Intensity image: Same procedure as for the algorithm using image gradients, see Section 3.1.1.
- Image correlation: An artificial template is generated, which contains an image of an ideal black and white target. Then, the cross-correlations between the template and the intensity image are calculated. For the location, where the image correlation is highest, the x and y values are taken from the grid of step 2 and the 2D coordinate of the target is derived. This procedure can also be referred to as correlation-based image registration.In order to extend the approach of Kregar et al. [28] from radially symmetric targets, such as circles, to targets with checkerboard pattern, this step is repeated for different rotations of the template. The 2D coordinates of the different rotations with the highest overall image correlation gives the best solution. The step size used for the various rotations is set to because further investigations in preparation for the present study have shown that smaller step sizes have no influence on the precision of the algorithm.In order to improve the precision of the algorithm, the translations are estimated in the subpixel range, according to the method described by Guizar-Sicairos et al. [42].
- Final coordinate calculation: The location with the highest image correlation already provides the 2D coordinate of the target center. With the help of the plane parameters from step 1, the 2D coordinate can be calculated into the aimed 3D coordinate of the target center.
3.1.3. Algorithm Using Middle Intensities (B.2)
- Plane fitting: Same procedure as for the algorithm using image gradients, see Section 3.1.1.
- Edge detection: The idea is to extract the edges directly from the intensities of the scan points. Hence, no intensity image is generated in contrast to the algorithm using image gradients.It is assumed that points which lie on the edges between the white and black areas also have middle intensity values. Ge & Wunderlich [27] named them “middle values”. Their intensities are therefore smaller than the intensities of the white areas and larger than the intensities of the black areas.Ge & Wunderlich [27] use fixed thresholds to classify the middle intensities. However, as these change greatly depending on the current scan situation, the algorithm is extended by an automatic threshold setting. Using the k-mean algorithm, the intensities are clustered into “white” and “black”. Intensities that do not belong to any of the two clusters lie in between and are assumed to be points on the edges.
- Line fitting: Analogous to the algorithm using image gradients, two lines are estimated through the points of the edges from step 2. Again, the RANSAC algorithm first estimates which points belong to which line. Subsequently, the two final lines and are estimated through these points with the help of a least squares adjustment.
- Final coordinate calculation: Same procedure as for the algorithm using image gradients, see Section 3.1.1.
3.2. Empirical Comparison of the Different Algorithms
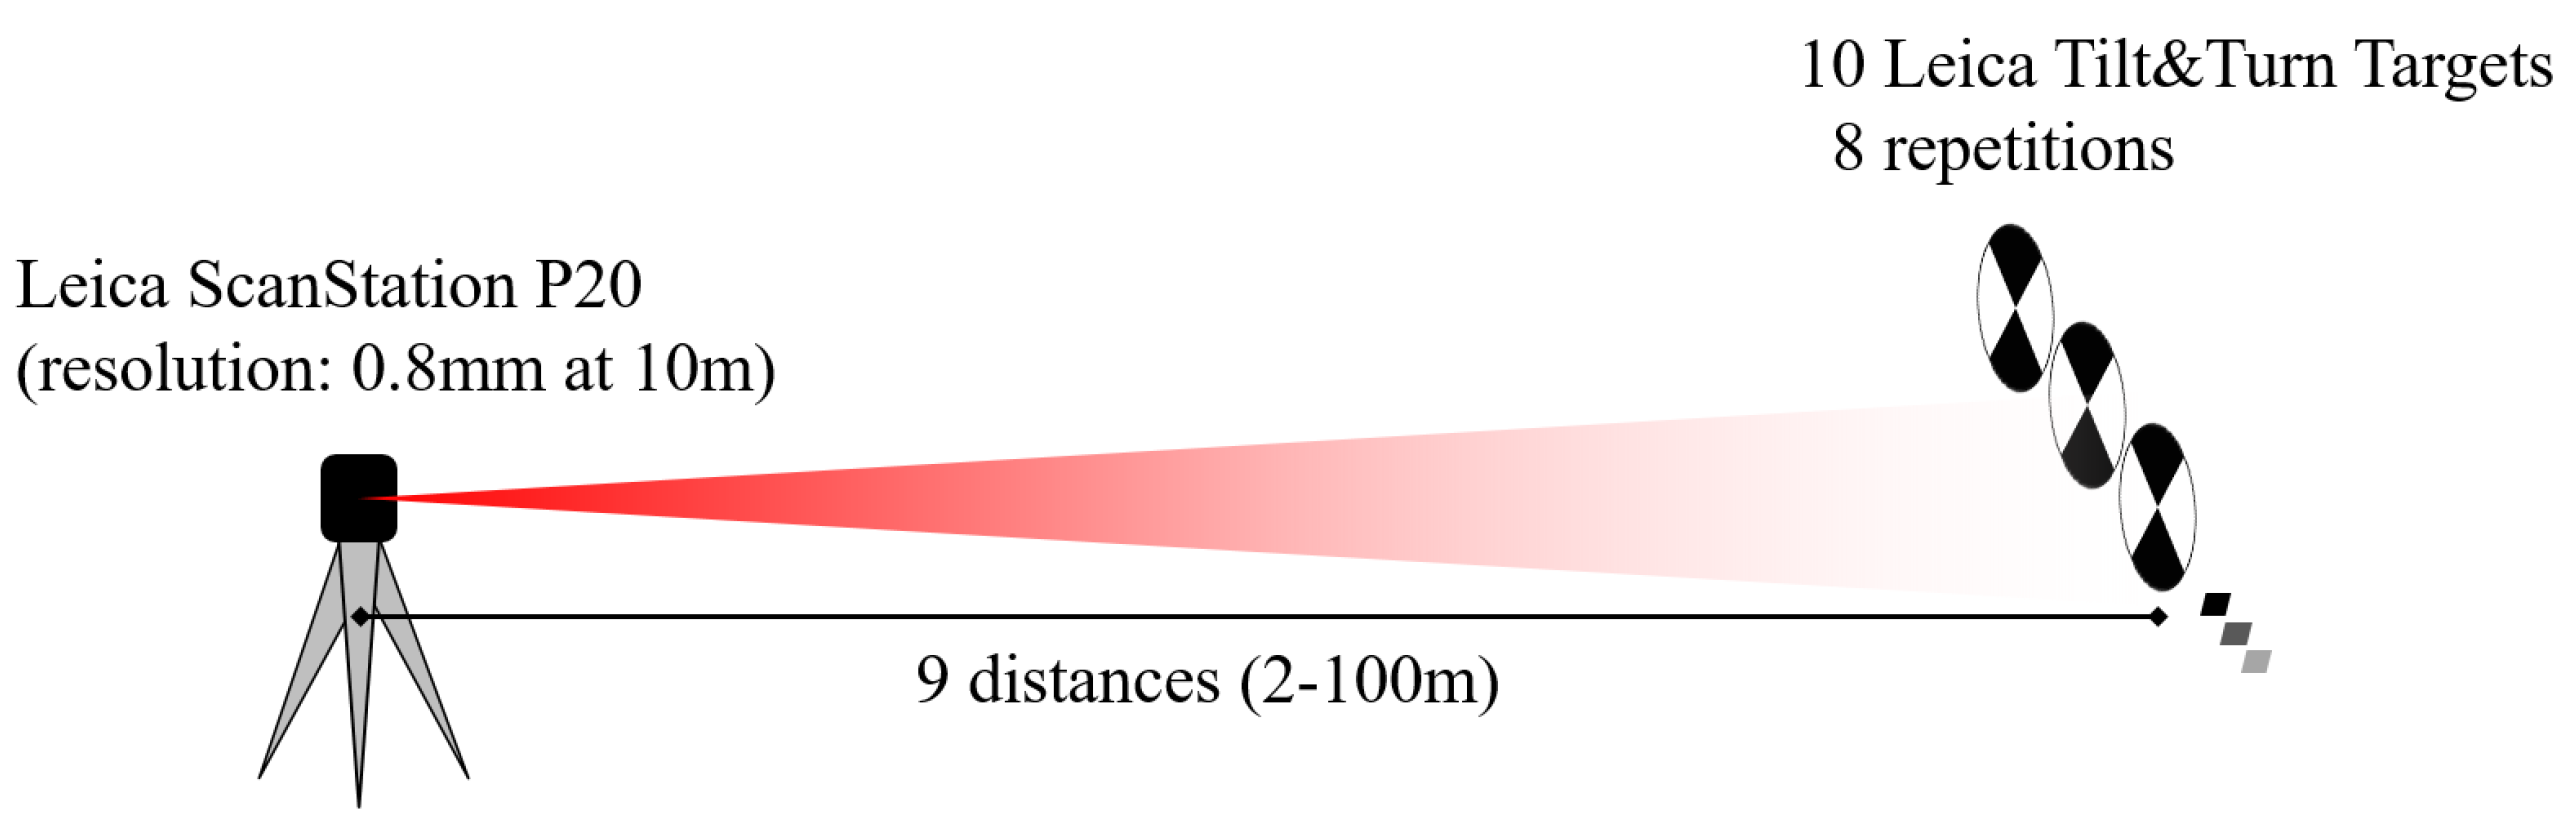
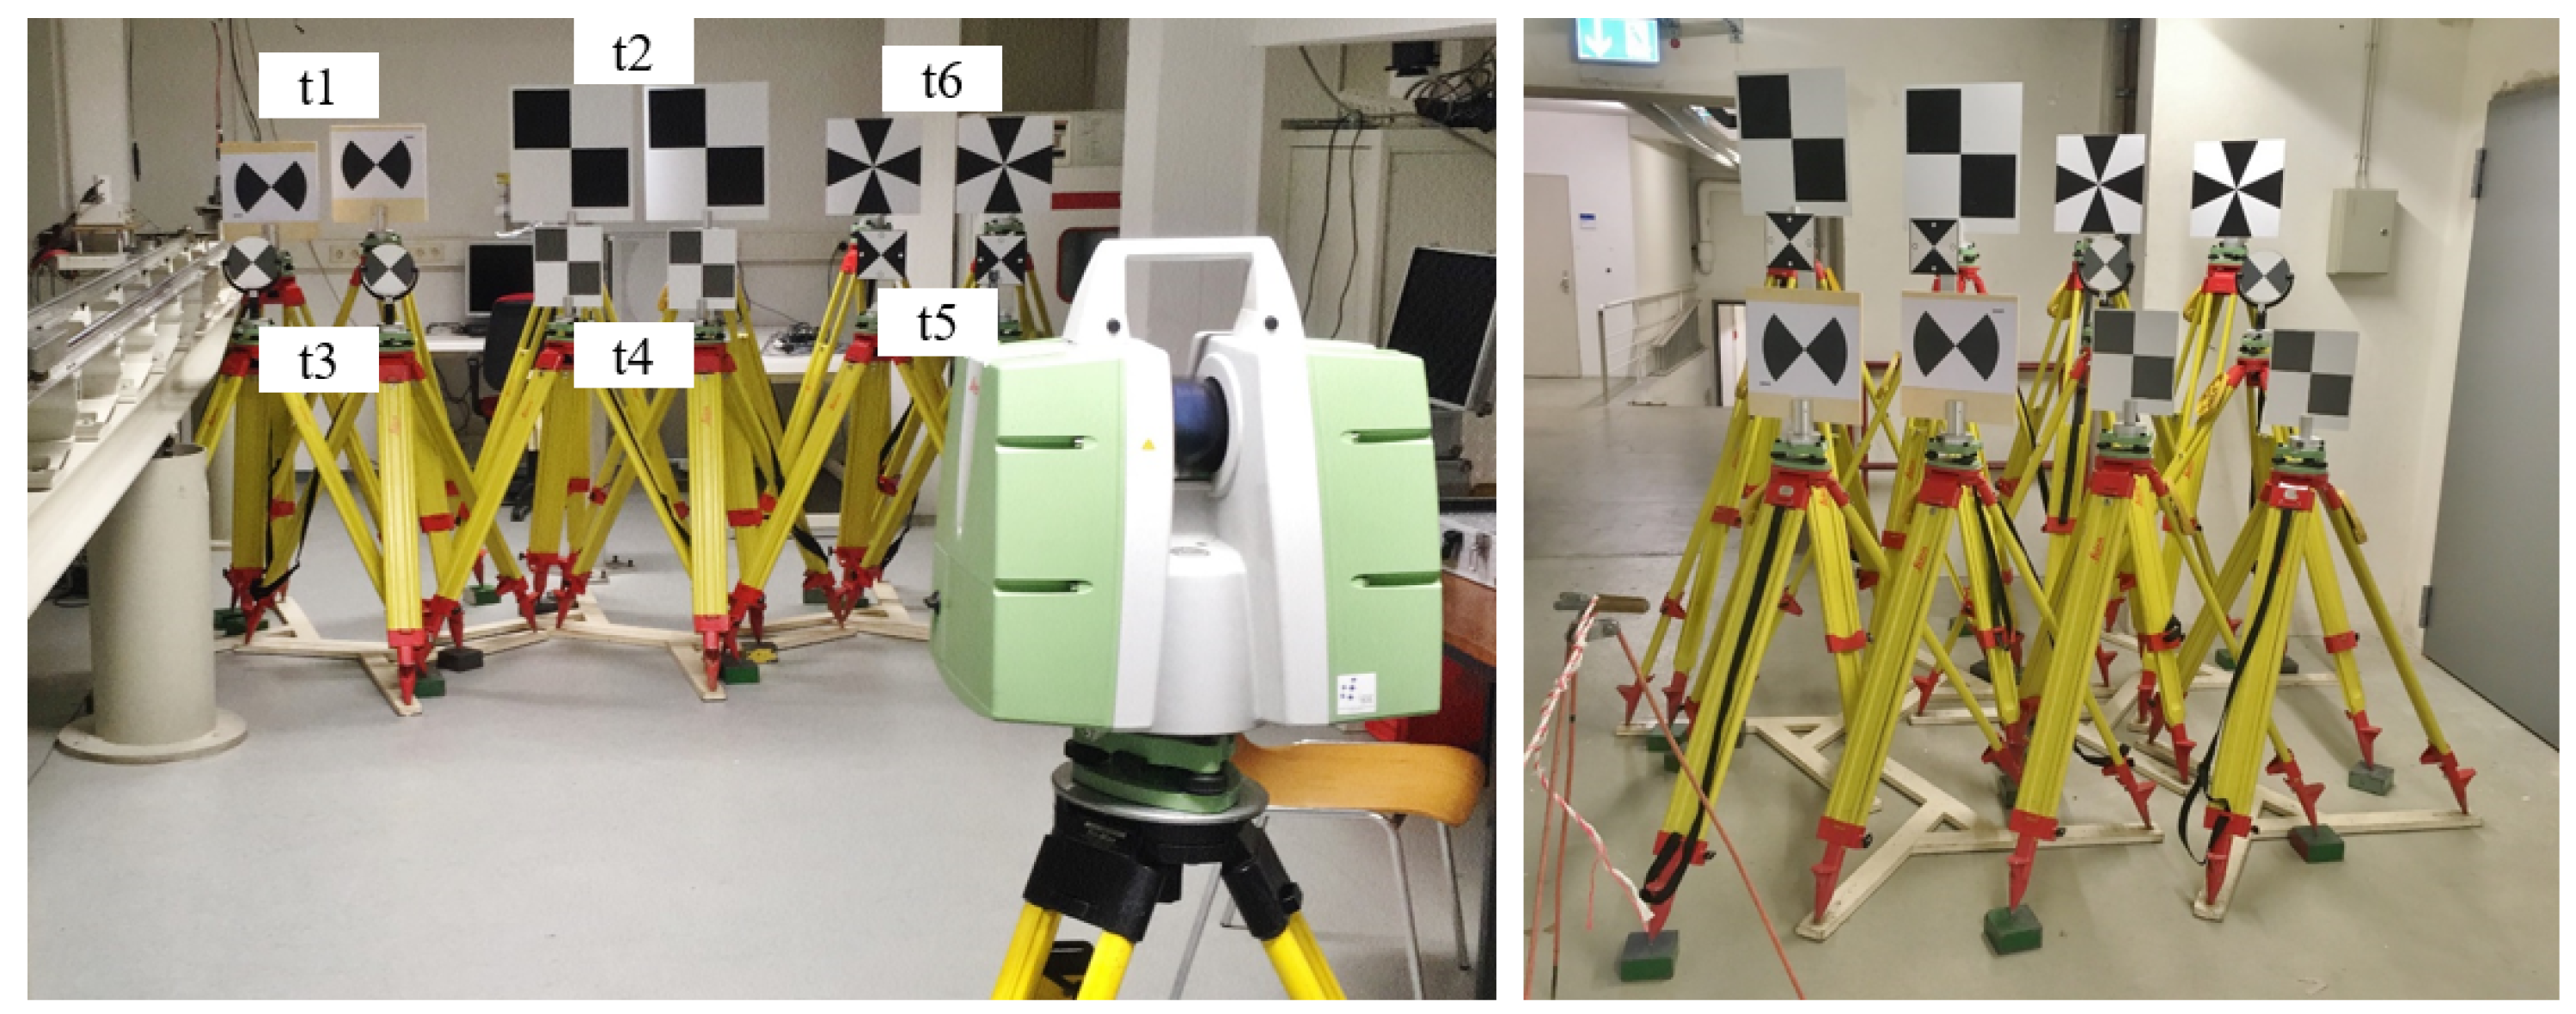
3.2.1. Experimental Setup
3.2.2. Methodology for Evaluation
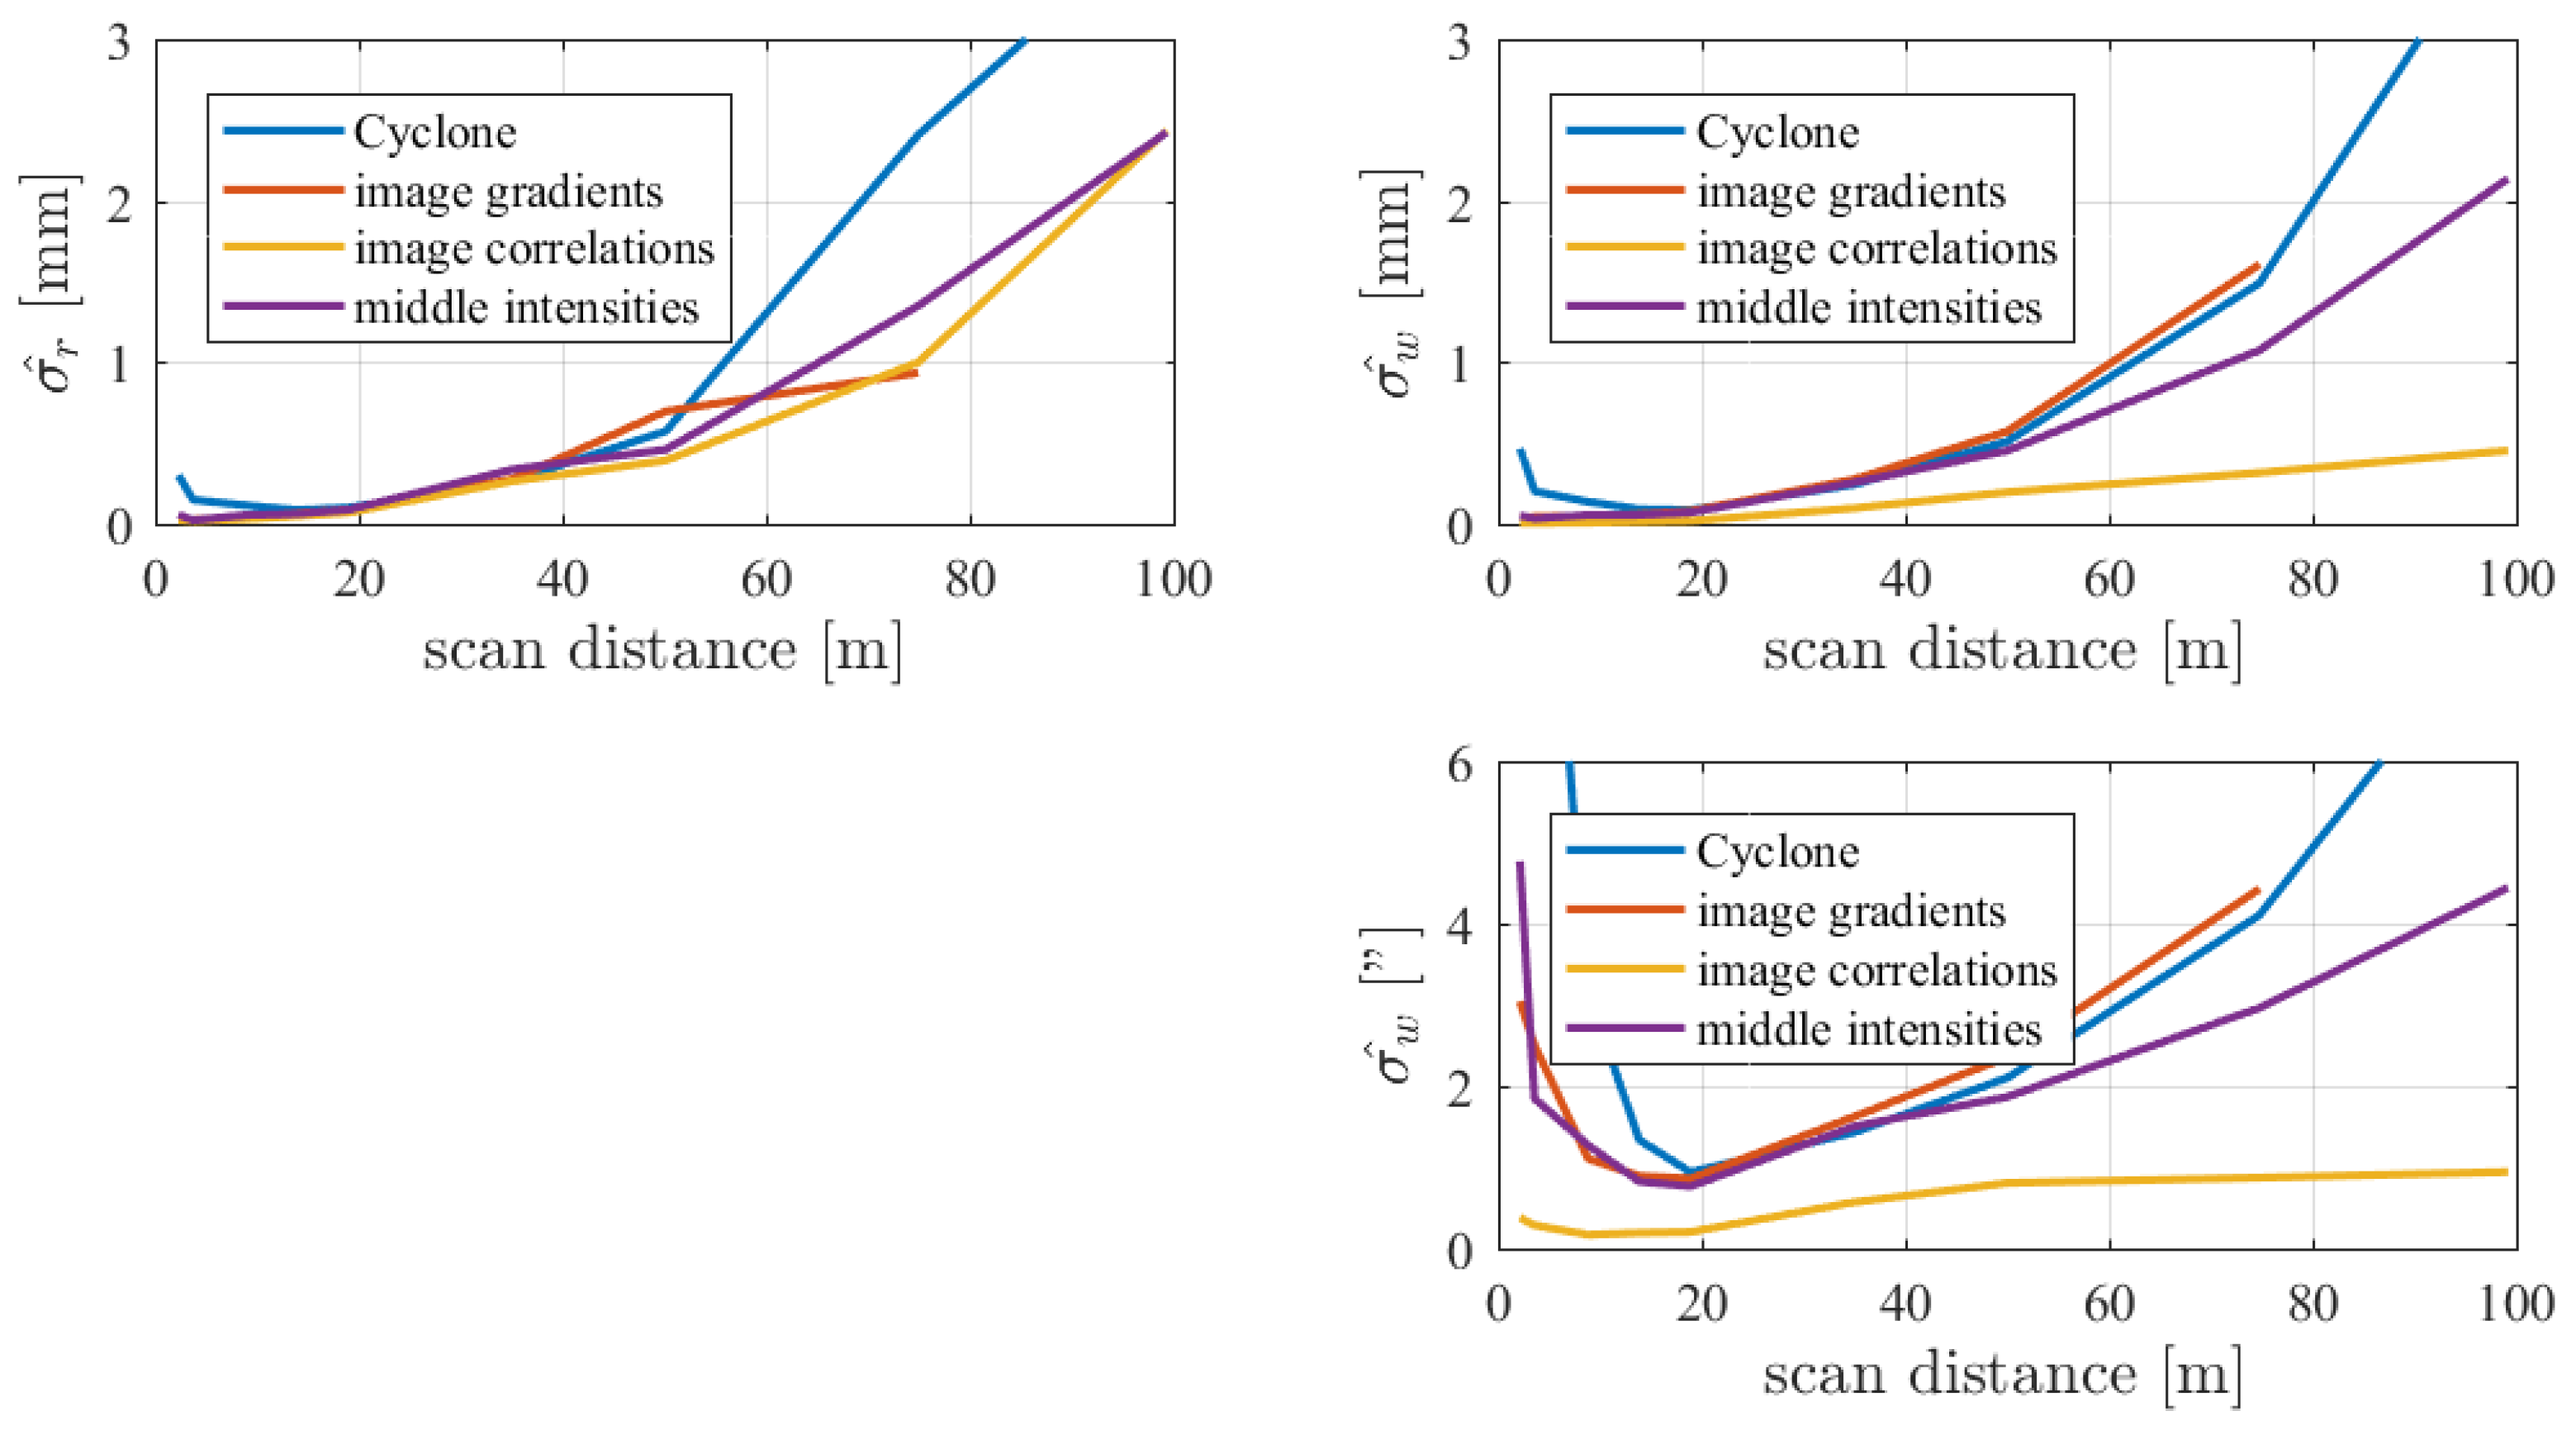
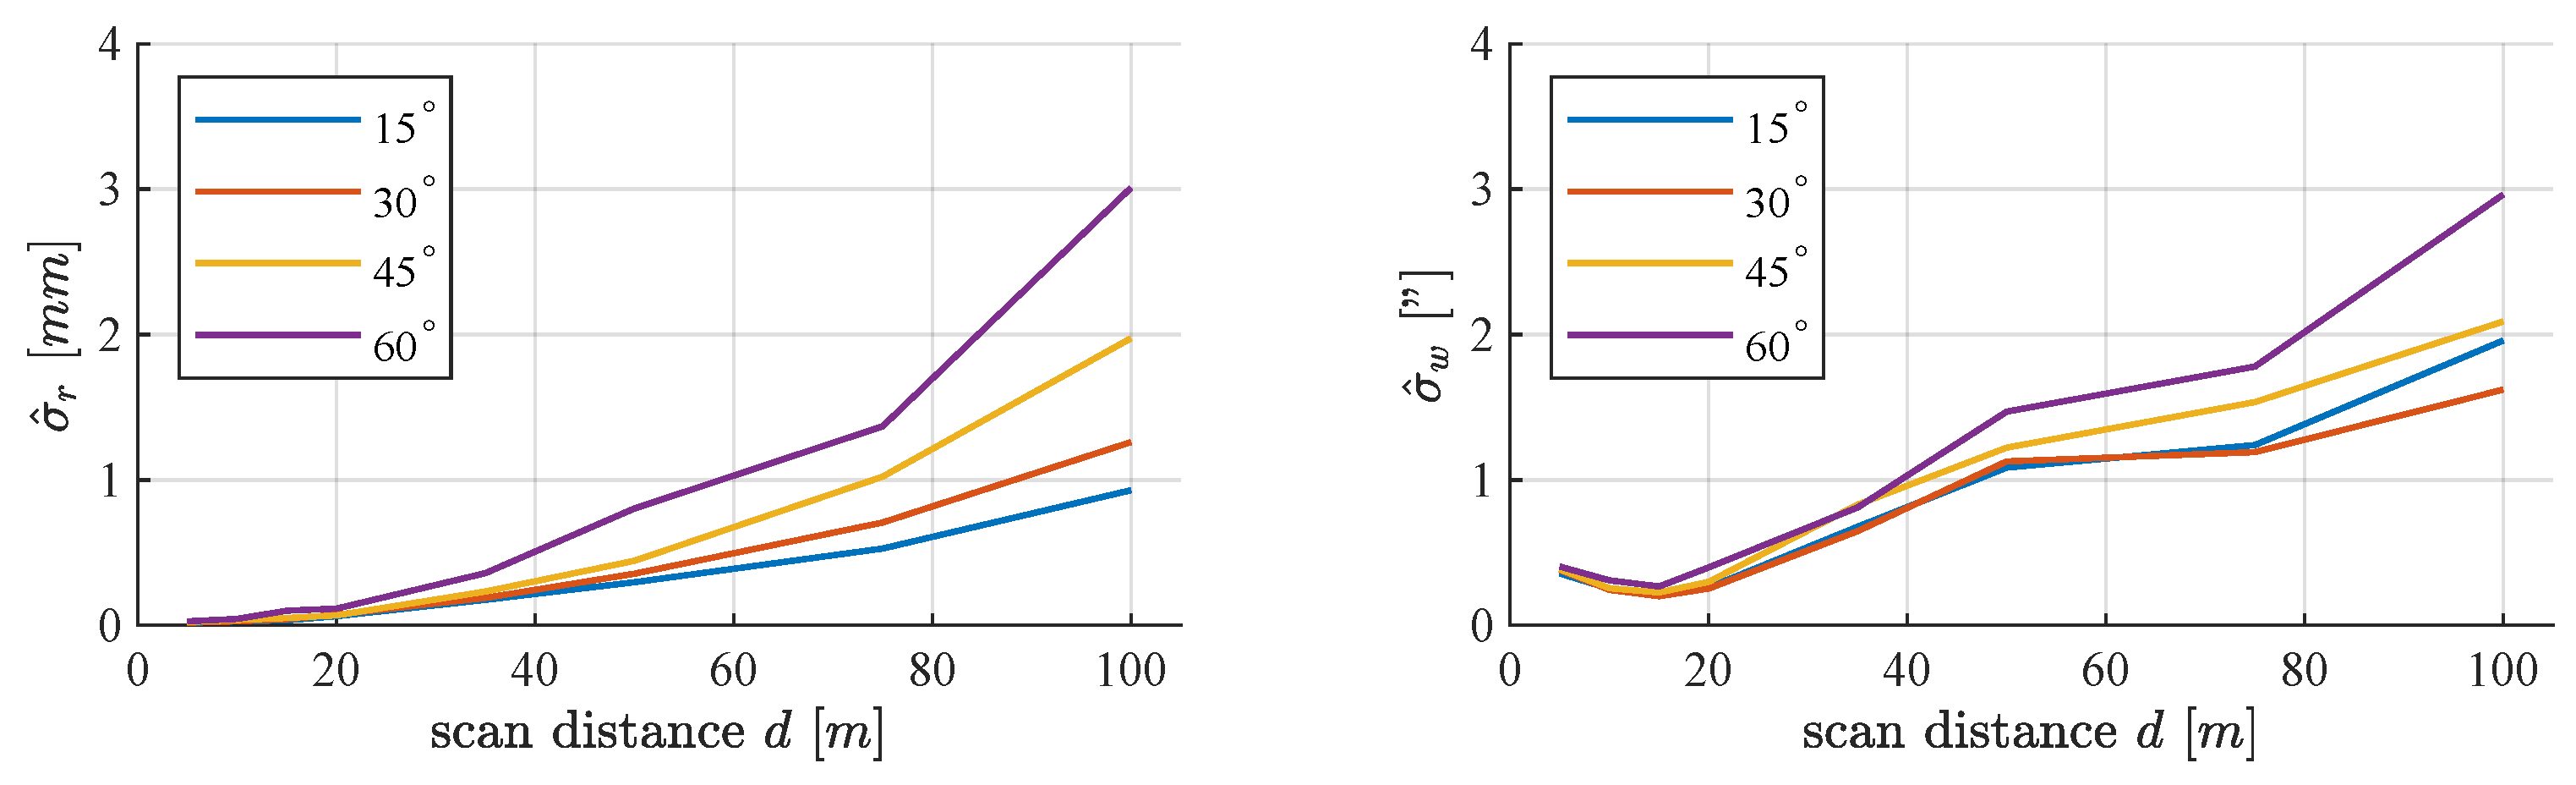
3.2.3. Analysis of the Algorithms’ Precisions
- The precision of the TCE is significantly higher than generally expected and specified by the manufacturer. In the close range (up to 20 m), the standard deviations are all in the submillimetre range and, for longer distances (up to 100 m), they equal a few millimetres.
- For the precision in distance direction it is irrelevant which algorithm is used for the TCE, except for the manufacturer software Leica Cyclone.
- Contrastingly, the algorithms differ significantly in their angular precision. Here, the algorithm using image correlations achieves the best results with a standard deviation of just slightly more than 1 arcsec over the entire measuring range.
4. Influence of the Target Design on the Uncertainty of the Target Center Estimation
4.1. Preliminary Considerations of Target Designs
- Geometry: In the geometric form of targets, a differentiation is made between plane and spatial targets. Spatial targets, e.g., spheres, can signal a reference point only by their geometric shape. For plane targets, radiometric information (intensities) have to be used to determine the reference point in the plane. However, because of the “squishing” and “flaring” effect [23,25], mentioned in Section 2, only plane targets are considered in the following.
- Material: The material of the target usually refers to the substrate material. Depending on the material (and wavelength of the laser), the laser beam penetrates the material to different depths. This can lead to systematic errors in the distance measurements. According to Muralikrishnan et al. [24], the materials aluminium and wood have the smallest errors and thus seem to be the most suitable materials for targets. The use of synthetic materials, such as plastic, should be avoided following the studies by Reshetyuk [21] and Rachakonda et al. [25]. The material, together with the surface finish and color, defines the reflectivity of a target.
- Surface finish: Surface finish refers to the physical property of the target surface (border material to the atmosphere). It is defined by the roughness of the surface and is decisively responsible for the type of reflection (diffuse or reflective). According to Gordon et al. [46] and Rachakonda et al. [23], diffuse surfaces provide the most precise measurement results. The surface finish can be influenced by treatments such as sandblasting or painting. Muralikrishnan et al. [24] say that sandblasting aluminium results in a scan-friendly, matt, grey surface. The surface finish also influences the reflectivity of a target.
- Color: The surface color of the target affects the reflected intensities [19,47] and thus the random errors of the distance measurement [48]. When plane targets are used, the color must not only lead to a precise geometric measurement of the target, but also make it possible to determine the target coordinates on the basis of radiometric information. This means that the color of the pattern must have a sufficiently high intensity contrast to enable an exact TCE (see Section 3). Therefore, the colors white and black are frequently selected.
- Reflectivity: The reflectivity is the quotient of reflected and injected intensity. The aforementioned properties (material, surface finish, and color) influence the reflectivity of targets. This, in turn, affects the quality of the distance measurement and the scanned intensities. A high reflectivity leads to higher intensities and thus to more precise distance measurements [19,48]. This is helpful for the exact geometric detection of targets. It should be noted that the reflectivity is a physical property of the target [19].
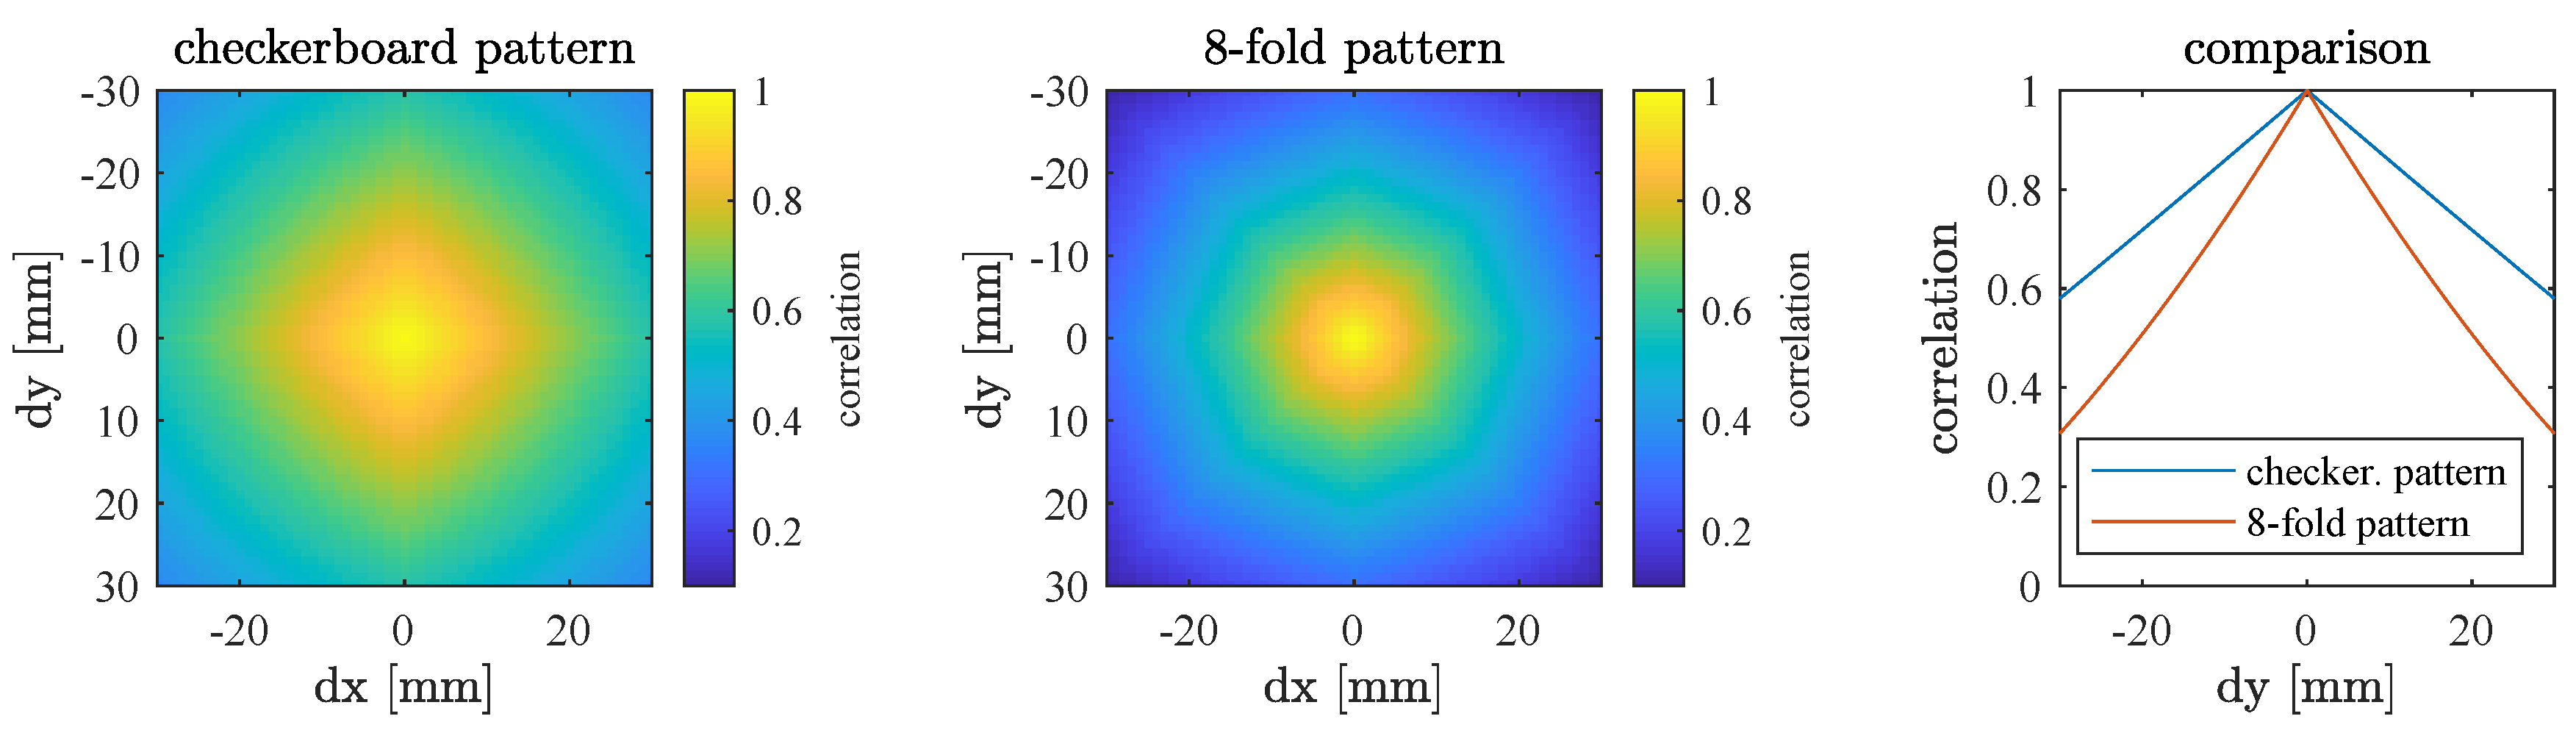
- Pattern: When using plane targets, the coordinates on the planes are estimated using the radiometric information (intensities) of the point cloud. The target center is signalled with the help of a colored pattern. For almost all commercial targets, the checkerboard pattern is used. Omidalizarandi et al. [38] show that, in image assisted total stations, other target patterns lead to more precise results. It is not known to what extent a different target pattern improves the precision of the target center coordinates in TLS. Therefore, this influence is investigated in Section 4.3.
4.2. Empirical Investigations
4.2.1. Experimental Setup
4.2.2. Methodology for Evaluation
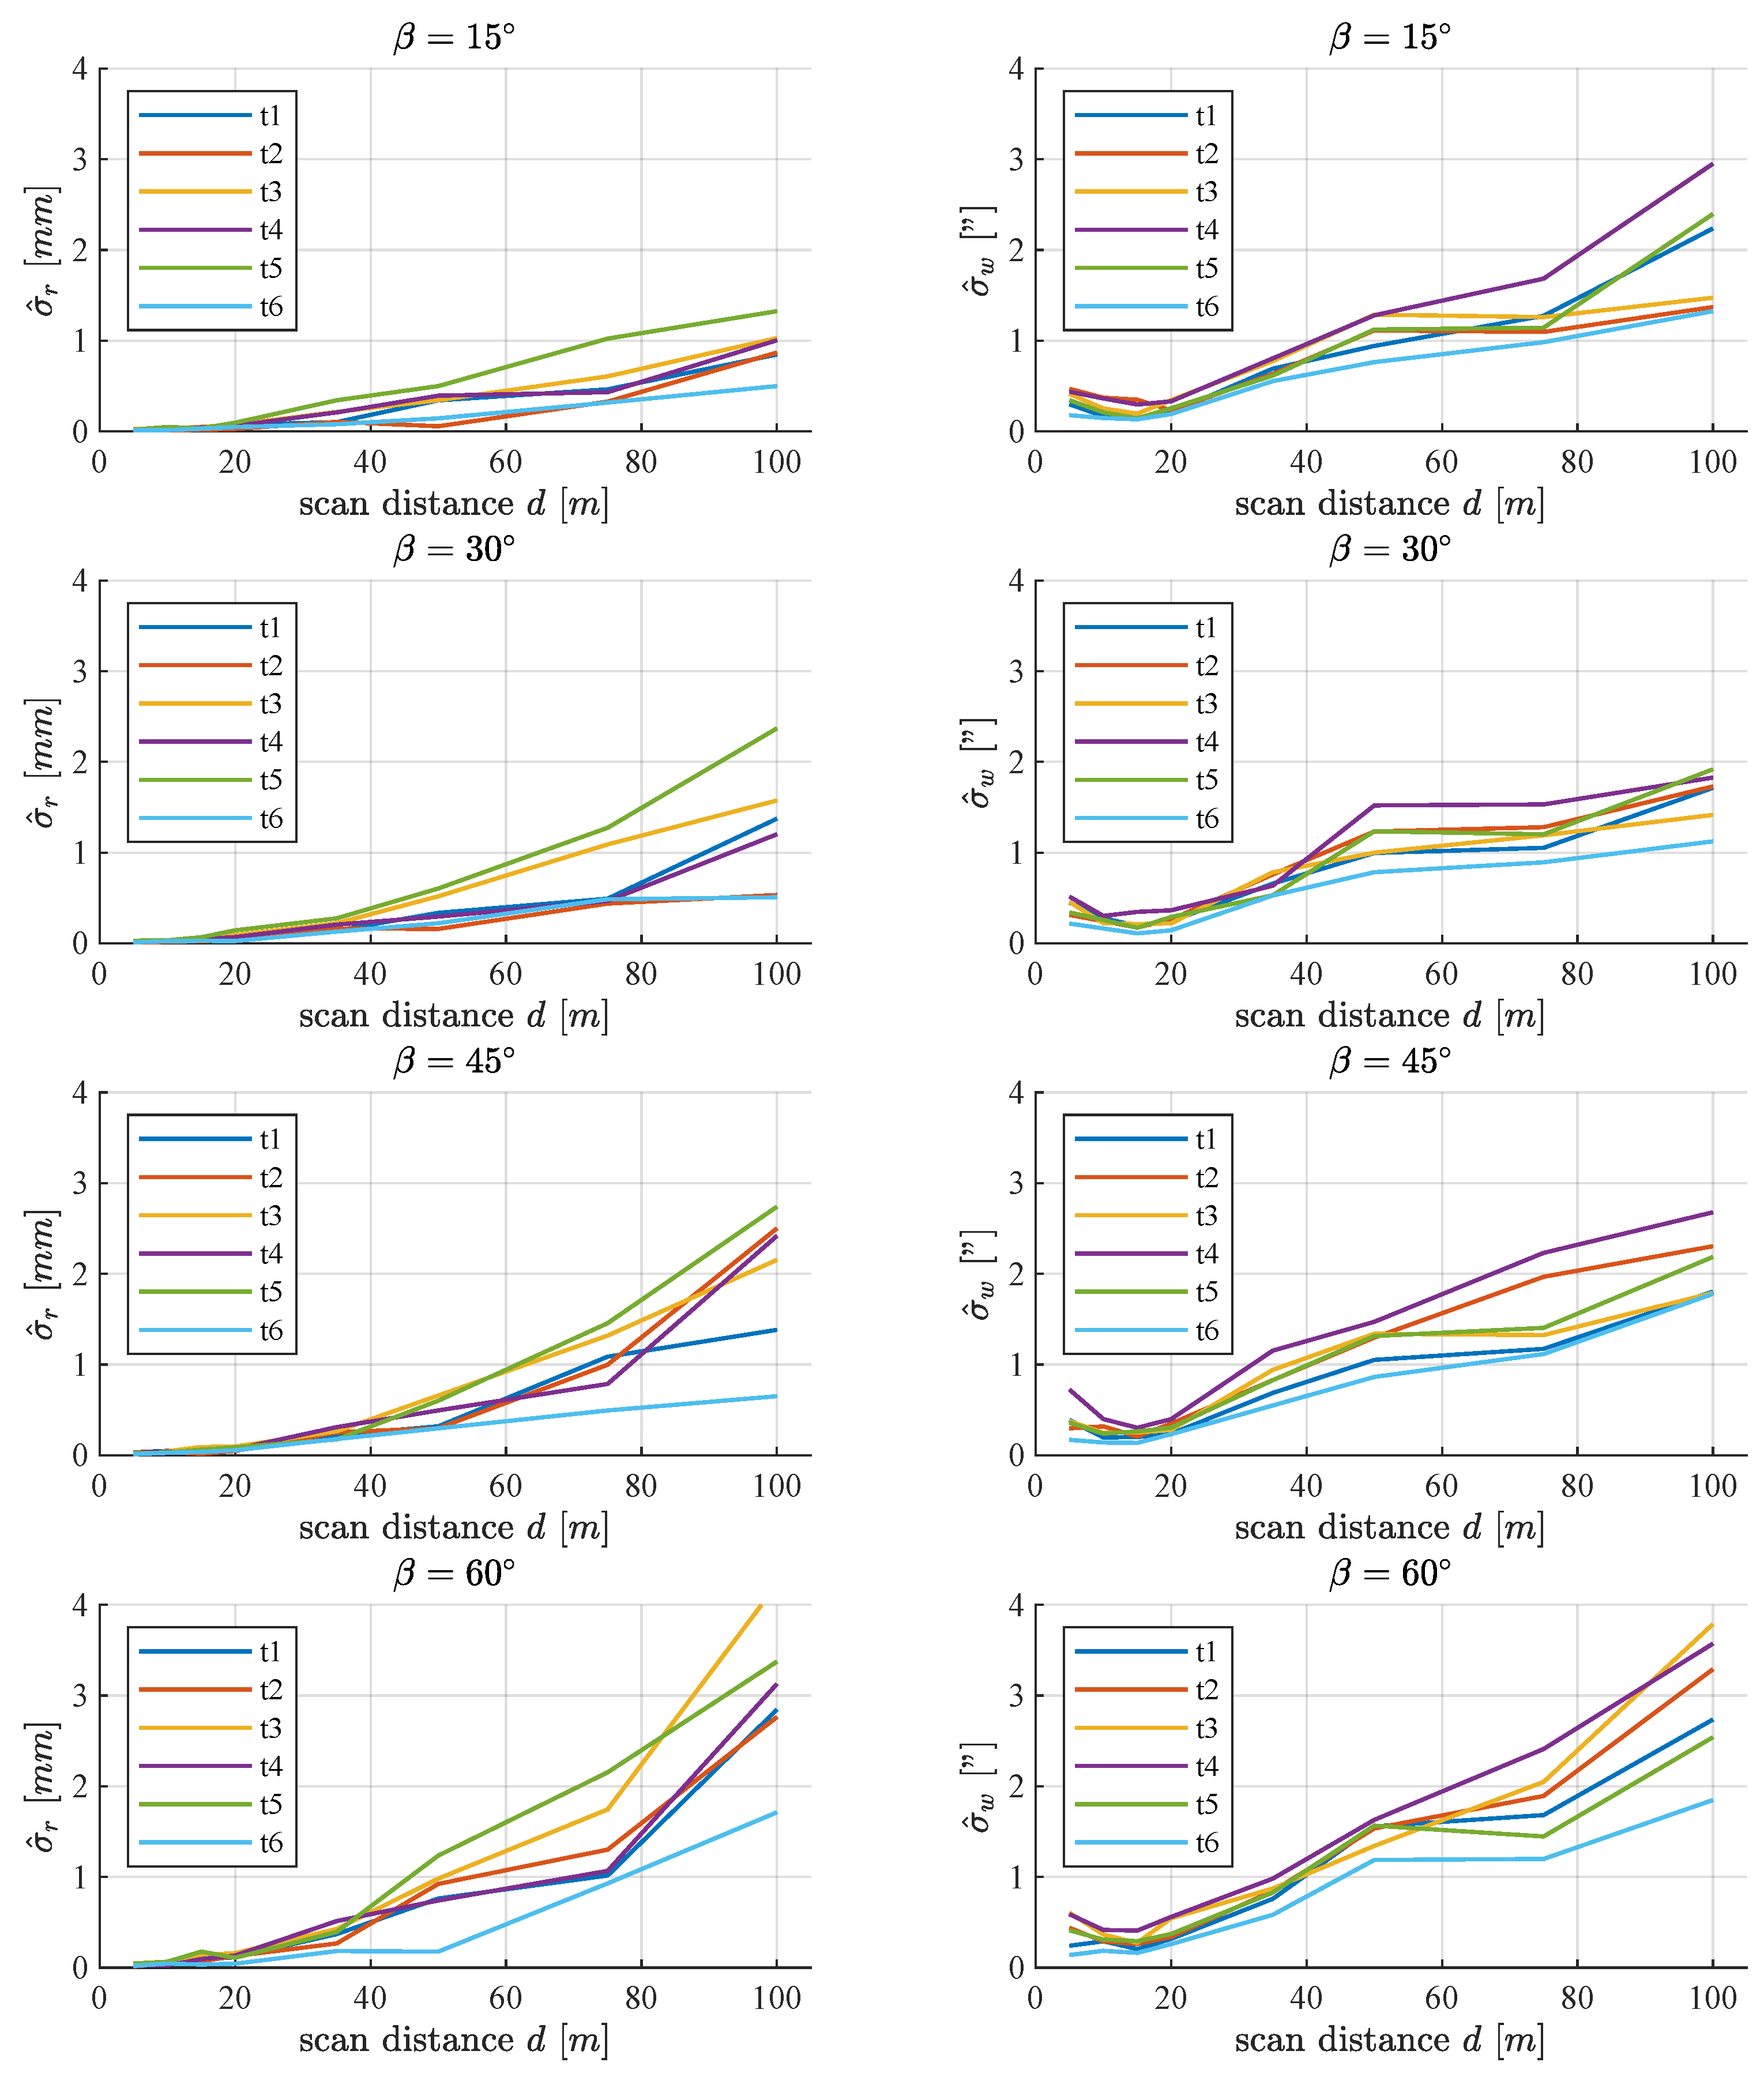
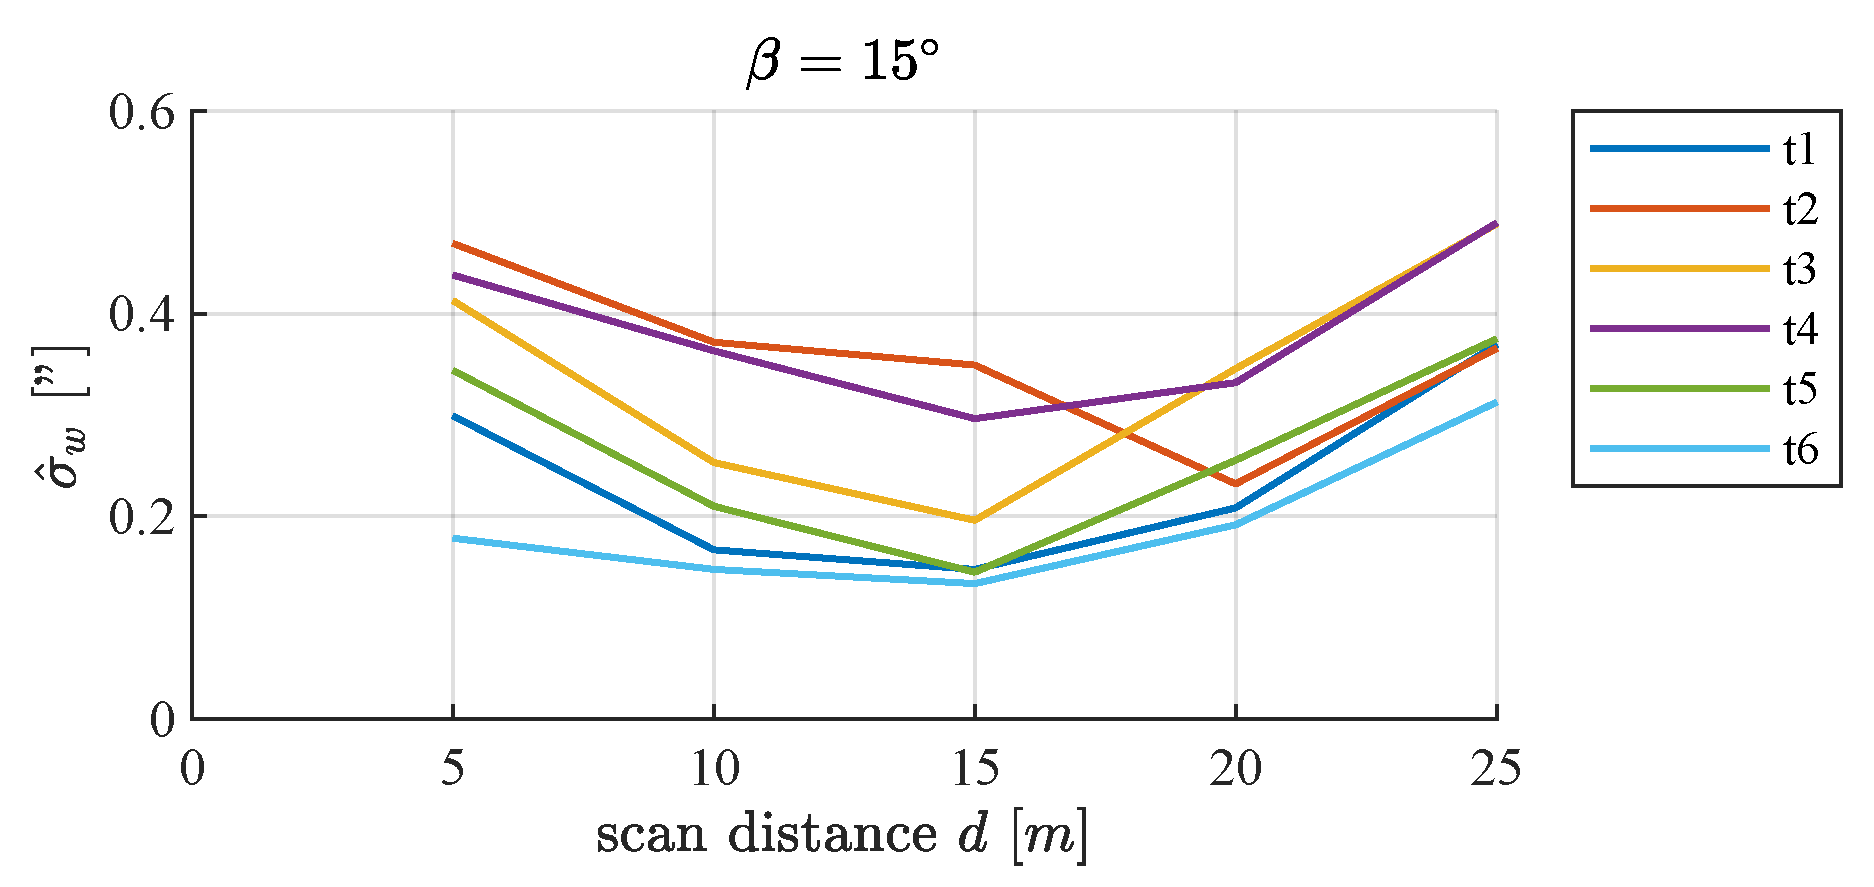
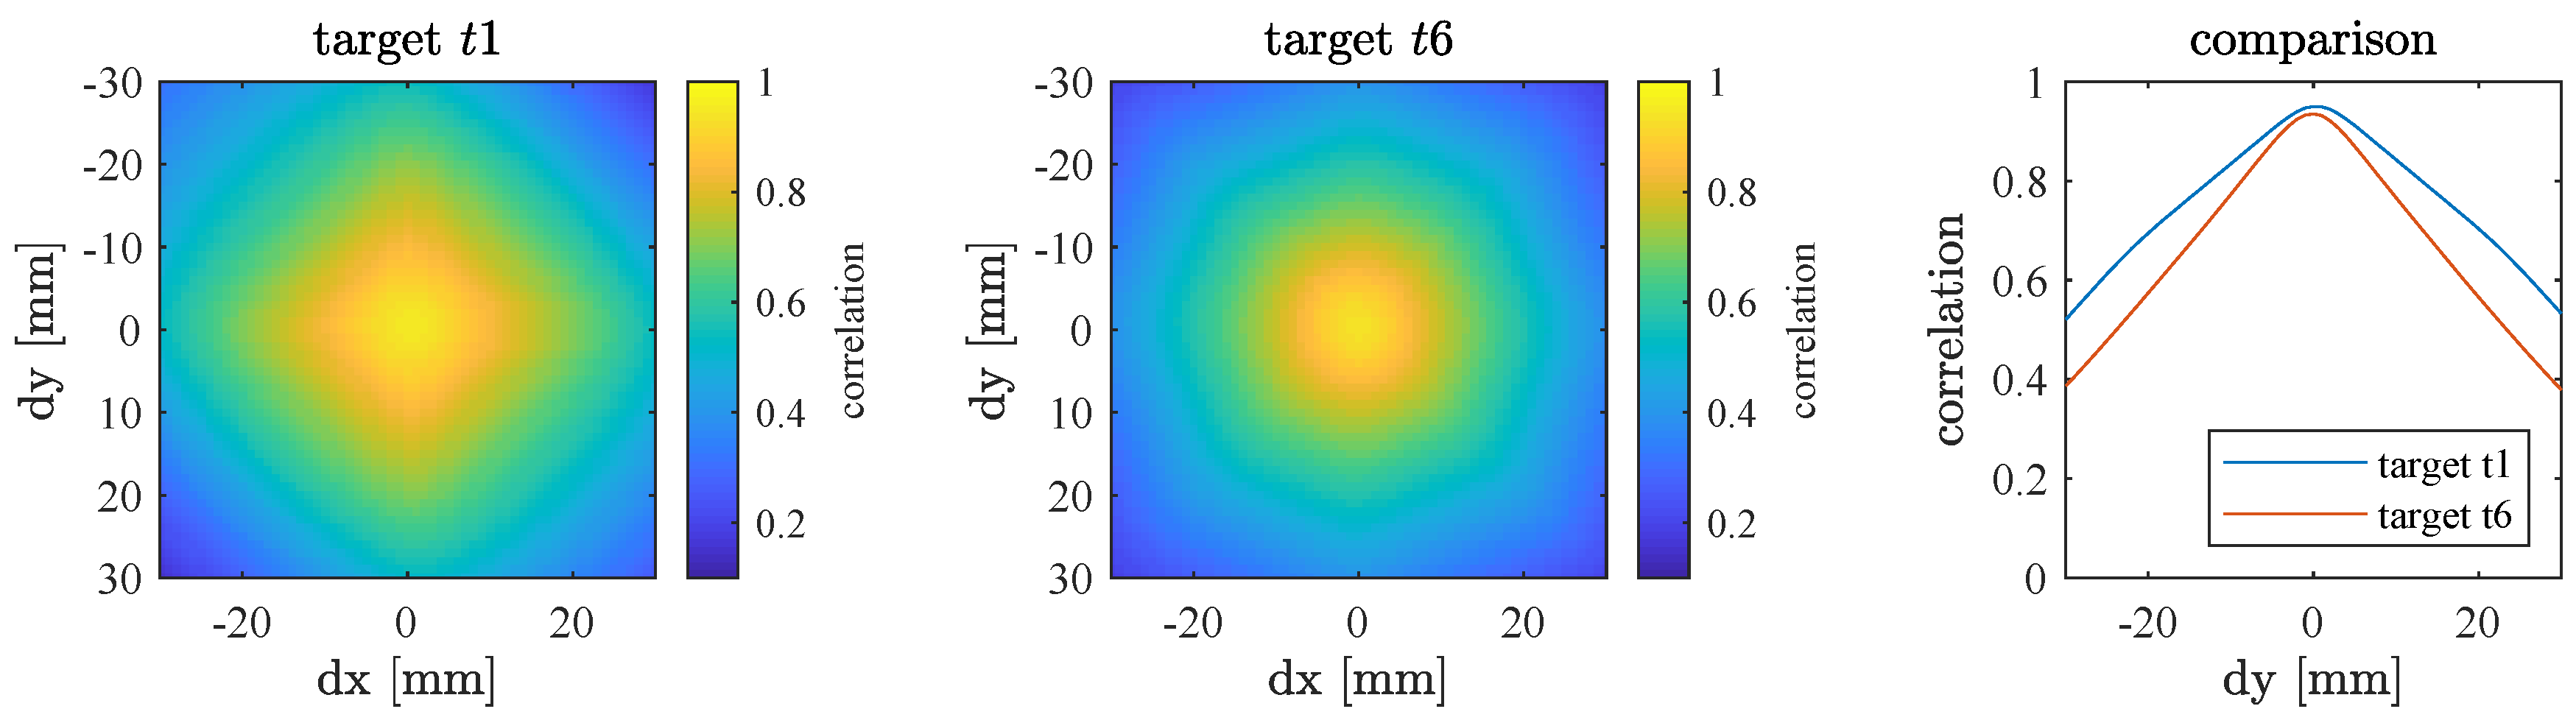
4.2.3. Analysis of the Influence of Target Designs
4.3. Improving the Target Design
4.3.1. Conception of the New Target (BOTA8)
4.3.2. Benefit of the New Target (BOTA8)
5. Conclusions and Outlook
- The calculated standard deviations of all algorithms are significantly smaller than the accuracies specified by the manufacturer and thus significantly smaller than generally assumed. For the TCE with the Leica ScanStation P20 and a resolution level of 0.8 mm at 10 m, standard deviations in the lower submillimeter range could be achieved for scan distances up to 20 m and standard deviations of a few millimeters for scan distances up to 100 m.
- The algorithm applied has a large influence on the precision of the TCE. The algorithm using correlations provides significantly smaller standard deviations than the other tested algorithms, especially in angular direction.
- The target design is of lesser importance for the precision of the TCE than assumed from theoretical considerations. The investigated target designs differ only slightly in their precision. However, it was observed that the size of the target is an important factor for the distance standard deviation.
- The precision of the TCE was improved by a new target design, the BOTA8.
Author Contributions
Funding
Acknowledgments
Conflicts of Interest
References
- Holst, C.; Klingbeil, L.; Esser, F.; Kuhlmann, H. Using point cloud comparisons for revealing deformations of natural and artificial objects. In Proceedings of the 7th International Conference on Engineering Surveying (INGEO 2017), Lisbon, Portugal, 18–20 October 2017; pp. 265–274. [Google Scholar]
- Yang, H.; Omidalizarandi, M.; Xu, X.; Neumann, I. Terrestrial laser scanning technology for deformation monitoring and surface modeling of arch structures. Compos. Struct. 2017, 169, 173–179. [Google Scholar] [CrossRef] [Green Version]
- Medić, T.; Holst, C.; Kuhlmann, H. Towards System Calibration of Panoramic Laser Scanners from a Single Station. Sensors 2017, 17, 1145. [Google Scholar] [CrossRef] [PubMed]
- Muralikrishnan, B.; Ferrucci, M.; Sawyer, D.; Gerner, G.; Lee, V.; Blackburn, C.; Phillips, S.; Petrov, P.; Yakovlev, Y.; Astrelin, A.; et al. Volumetric performance evaluation of a laser scanner based on geometric error model. Precis. Eng. 2015, 40, 139–150. [Google Scholar] [CrossRef]
- Ferrucci, M.; Muralikrishnan, B.; Sawyer, D.; Phillips, S.; Petrov, P.; Yakovlev, Y.; Astrelin, A.; Milligan, S.; Palmateer, J. Evaluation of a laser scanner for large volume coordinate metrology: A comparison of results before and after factory calibration. Meas. Sci. Technol. 2014, 25, 105010. [Google Scholar] [CrossRef]
- Menditto, A.; Patriarca, M.; Magnusson, B. Understanding the meaning of accuracy, trueness and precision. Accredit. Qual. Assur. 2007, 12, 45–47. [Google Scholar] [CrossRef]
- Organización Internacional de Normalización (Ginebra). ISO 5725-1 Accuracy (Trueness and Precision) of Measurement Methodsand Results—Part 1: General Principlesand Definitions; ISO: Geneva, Switzerland, 1994. [Google Scholar]
- Zogg, H.M. Investigations of High Precision Terrestrial Laser Scanning with Emphasis on the Development of a Robust Close-Range 3D-Laser Scanning System. Ph.D. Thesis, ETH Zurich, Zurich, Switzerland, 2008. [Google Scholar]
- Soudarissanane, S. The Geometry of Terrestrial Laser Scanning; Identification of Errors, Modeling and Mitigation of Scanning Geometry. Ph.D. Thesis, TU Delft, Geoscience and Remote Sensing, Delft, The Netherlands, 2016. [Google Scholar]
- Soudarissanane, S.; Lindenbergh, R.; Menenti, M.; Teunissen, P. Scanning geometry: Influencing factor on the quality of terrestrial laser scanning points. ISPRS J. Photogramm. Remote Sens. 2011, 66, 389–399. [Google Scholar] [CrossRef]
- Lichti, D.D.; Chow, J.; Lahamy, H. Parameter de-correlation and model-identification in hybrid-style terrestrial laser scanner self-calibration. ISPRS J. Photogramm. Remote Sens. 2011, 66, 317–326. [Google Scholar] [CrossRef]
- Boehler, W.; Vicent, M.B.; Marbs, A. Investigating laser scanner accuracy. Int. Arch. Photogramm. Remote Sens. Spat. Inf. Sci. 2003, 34, 696–701. [Google Scholar]
- Lichti, D.D.; Jamtsho, S. Angular resolution of terrestrial laser scanners. Photogramm. Rec. 2006, 21, 141–160. [Google Scholar] [CrossRef]
- Schaer, P.; Skaloud, J.; Landtwing, S.; Legat, K. Accuracy estimation for laser point cloud including scanning geometry. In Proceedings of the 5th International Symposium on Mobile Mapping Technology (MMT2007), Padua, Italy, 29–31 May 2007. [Google Scholar]
- Jelalian, A.V. Laser Radar Systems; Artech House: Boston, MA, USA; London, UK, 1992. [Google Scholar]
- Kaasalainen, S.; Ahokas, E.; Hyyppa, J.; Suomalainen, J. Study of surface brightness from backscattered laser intensity: Calibration of laser data. IEEE Geosci. Remote Sens. Lett. 2005, 2, 255–259. [Google Scholar] [CrossRef]
- Wujanz, D.; Holst, C.; Neitzel, F.; Kuhlmann, H.; Niemeier, W.; Schwieger, V. Survey Configuration for Terrestrial Laser Scanning. AVN 2016, 6, 158–169. [Google Scholar]
- Schmitz, B.; Holst, C.; Medic, T.; Lichti, D.D.; Kuhlmann, H. How to Efficiently Determine the Range Precision of 3D Terrestrial Laser Scanners? Sensors 2019. under review. [Google Scholar] [CrossRef]
- Zámečníková, M.; Wieser, A.; Woschitz, H.; Ressl, C. Influence of surface reflectivity on reflectorless electronic distance measurement and terrestrial laser scanning. J. Appl. Geod. 2014, 8, 311–326. [Google Scholar]
- Joeckel, R.; Stober, M.; Huep, W. Elektronische Entfernungs—und Richtungsmessung und ihre Integration in aktuelle Positionierungsverfahren; Wichmann Verlag: Berlin, Germany, 2008. [Google Scholar]
- Reshetyuk, Y. Investigation of the influence of surface reflectance on the measurements with the terrestrial laser scanner Leica HDS 3000. Z. Geod. Geoinf. Landmanag. 2006, 131, 96–103. [Google Scholar]
- Cheok, G.S.; Leigh, S.; Rukhin, A. Calibration Experiments of a Laser Scanner; NASA STI/Recon Technical Report N 2; 2002. Available online: https://www.nist.gov/publications/calibration-experiments-laser-scanner (accessed on 8 April 2019).
- Rachakonda, P.; Muralikrishnan, B.; Cournoyer, L.; Cheok, G.S.; Lee, V.; Shilling, M.; Sawyer, D. Methods and considerations to determine sphere center from terrestrial laser scanner point cloud data. Meas. Sci. Technol. 2017, 28, 105001. [Google Scholar] [CrossRef] [PubMed]
- Muralikrishnan, B.; Rachakonda, P.; Lee, V.; Shilling, M.; Sawyer, D.; Cheok, G.; Cournoyer, L. Relative range error evaluation of terrestrial laser scanners using a plate, a sphere, and a novel dual-sphere-plate target. Measurement 2017, 111, 60–68. [Google Scholar] [CrossRef] [PubMed]
- Rachakonda, P.; Muralikrishnan, B.; Shilling, M.; Cheok, G.; Lee, V.; Blackburn, C.; Everett, D.; Sawyer, D. Targets for relative range error measurement of 3D imaging systems. J. CMSC 2017, 12. Available online: https://ws680.nist.gov/publication/get_pdf.cfm?pub_id=923831 (accessed on 8 April 2019).
- Chow, J.C.K.; Teskey, W.F.; Loves, J. In-situ Self-calibration of Terrestrial Laser Scanners and Deformation Analysis Using Both Signalized Targets and Intersection of Planes for Indoor Applications. In Proceedings of the 14th FIG Symposium on Deformation Measurements and Analysis, 5th IAG Symposium on Geodesy for Geotechnical and Structural Engineering, and 2nd International Workshop on Spatial Information Technologies for Monitoring the Deformation of Large-Scale Man-Made Linear Features, Hong Kong, China, 2–4 November 2011; pp. 2–16. [Google Scholar]
- Ge, X.; Wunderlich, T. Target identification in terrestrial laser scanning. Surv. Rev. 2015, 47, 129–140. [Google Scholar] [CrossRef]
- Kregar, K.; Grigillo, D.; Kogoj, D. High precision target center determination from a point cloud. ISPRS Ann. Photogramm. Remote Sens. Spat. Inf. Sci. 2013, II, 139–144. [Google Scholar] [CrossRef]
- Lichti, D.D.; Stewart, M.P.M.; Tsakiri, M.; Snow, A.J. Benchmark tests on a three-dimensional laser scanning system. Geomat. Res. Aust. 2000, 72, 1–23. [Google Scholar]
- Gordon, S.; Lichti, D.; Stewart, M.; Tsakiri, M. Metric performance of a high-resolution laser scanner. Proc. SPIE 2001, 4309, 174–184. [Google Scholar]
- Valanis, A.; Tsakiri, M. Automatic target identification for laser scanners. In Proceedings of the XXth ISPRS Congress, Istanbul, Turkey, 12–23 July 2004. [Google Scholar]
- Eling, D. Terrestrisches Laserscanning für die Bauwerksüberwachung. Available online: https://www.dgk.badw.de/fileadmin/user_upload/Files/DGK/docs/c-641.pdf (accessed on 8 April 2019).
- Chow, J.; Ebeling, A.; Teskey, B. Low cost artificial planar target measurement techniques for terrestrial laser scanning. In Proceedings of the FIG Congress 2010: Facing the Challenges–Building the Capacity. Citeseer, Sydney, Australia, 11–16 April 2010. [Google Scholar]
- Rachakonda, P.; Muralikrishnan, B.; Sawyer, D.; Wang, L. Method to determine the center of contrast targets from terrestrial laser scanner data. In Proceedings of the 32nd ASPE Annual Meeting, Charlotte, NC, USA, 29 October–3 November 2017. [Google Scholar]
- Abmayr, T.; Härtl, F.; Hirzinger, G.; Burschka, D.; Fröhlich, C. A correlation based target finder for terrestrial laser scanning. J. Appl. Geod. 2008, 2, 131–137. [Google Scholar] [CrossRef]
- Liang, Y.B.; Zhan, Q.M.; Che, E.Z.; Chen, M.W.; Zhang, D.L. Automatic registration of terrestrial laser scanning data using precisely located artificial planar targets. IEEE Geosci. Remote Sens. Lett. 2014, 11, 69–73. [Google Scholar] [CrossRef]
- Yi, C.; Xing, H.; Wu, Q.; Zhang, Y.; Wei, M.; Wang, B.; Zhou, L. Automatic Detection of Cross-Shaped Targets for Laser Scan Registration. IEEE Access 2018, 6, 8483–8500. [Google Scholar] [CrossRef]
- Omidalizarandi, M.; Paffenholz, J.A.; Neumann, I. Automatic and accurate passive target centroid detection for applications in engineering geodesy. Surv. Rev. 2018, 1–16. [Google Scholar] [CrossRef]
- Fischler, M.A.; Bolles, R.C. Random Sample Consensus: A Paradigm for Model Fitting with Applications to Image Analysis and Automated Cartography. Commun. ACM 1981, 24, 381–395. [Google Scholar] [CrossRef]
- Mikhail, E.M.; Ackerman, F. Observations and Least Squares, 1st ed.; IEP: New York, NY, USA, 1976. [Google Scholar]
- Canny, J. A computational approach to edge detection. IEEE Trans. Pattern Anal. Mach. Intell. 1986, 6, 679–698. [Google Scholar] [CrossRef]
- Guizar-Sicairos, M.; Thurman, S.T.; Fienup, J.R. Efficient subpixel image registration algorithms. Opt. Lett. 2008, 33, 156–158. [Google Scholar] [CrossRef]
- Leica Geosystems. Data Sheet for Leica ScanStation P20. 2013. Available online: www.leica-geosystems.com (accessed on 4 February 2019).
- Lichti, D.; Brustle, S.; Franke, J. Self-calibration and analysis of the Surphaser 25HS 3D scanner. In Proceedings of the Strategic Integration of Surveying Services, FIG Working Week, Hong Kong, China, 13–17 May 2007; Volume 1317. [Google Scholar]
- Muralikrishnan, B.; Rachakonda, P.; Shilling, M.; Lee, V.; Blackburn, C.; Sawyer, D. Report on the May 2016 ASTM E57.02 Instrument Runoff at NIST, Part 1—Background Information and Key Findings; Technical Report, NISTIR 8152; US Department of Commerce, National Institute of Standards and Technology: Gaithersburg, MD, USA, 2016. [CrossRef]
- Gordon, S.; Davies, N.; Keighley, D.; Lichti, D.; Franke, J. A rigorous rangefinder calibration method for terrestrial laser scanners. J. Spat. Sci. 2005, 50, 91–96. [Google Scholar] [CrossRef]
- Kersten, T.P.; Sternberg, H.; Mechelke, K. Investigations into the accuracy behaviour of the terrestrial laser scanning system Mensi GS100. In Proceedings of the Optical 3D Measurement Techniques VII, Vienna, Austria, 3–5 October 2005; Volume 1, pp. 122–131. [Google Scholar]
- Wujanz, D.; Burger, M.; Mettenleiter, M.; Neitzel, F. An intensity-based stochastic model for terrestrial laser scanners. ISPRS J. Photogramm. Remote Sens. 2017, 125, 146–155. [Google Scholar] [CrossRef]
- Tan, K.; Cheng, X. Specular Reflection Effects Elimination in Terrestrial Laser Scanning Intensity Data Using Phong Model. Remote Sens. 2017, 9, 853. [Google Scholar] [CrossRef]


| Category | Methodolgy | Publication | |
|---|---|---|---|
| A | Averaging techniques | Lichti et al. [29] Gordon et al. [30] Valanis & Tsakiri [31] | |
| B.1 | Edge detetction | Using image gradients | Eling [32] Chow et al. [33] Chow et al. [26] |
| B.2 | Using middle intensities | Ge & Wunderlich [27] Rachakonda et al. [34] | |
| C.1 | Image correlation | With symmetry | Abmayr et al. [35] Liang et al. [36] Yi et al. [37] |
| C.2 | With template | Omidalizarandi et al. [38] Kregar et al. [28] | |
| Scan Distance | ||||||||
|---|---|---|---|---|---|---|---|---|
| 2 | ||||||||
| 5 | ||||||||
| 10 | ||||||||
| 15 | ||||||||
| 20 | ||||||||
| 35 | ||||||||
| 50 | ||||||||
| 75 | ||||||||
| 100 |
| No. | Dealer | Geometry | Material | Surface Finish | Color | Reflectivity |
|---|---|---|---|---|---|---|
| self-printed | round | Paper (fixed | rough | black/white | diffuse | |
| Ø 20 cm | on wood) | |||||
| print house | square | aluminium | medium | black/white | medium | |
| Schwerte | cm | composite | ||||
| Leica Geo- | round | metal | rough | grey/white | diffuse | |
| systems | Ø 15 cm | |||||
| Laserscanning | square | aluminium | medium | grey/white | medium | |
| Europe | cm | composite | ||||
| Leibniz University | square | aluminium | slick | black/white | glossy | |
| Hannover | cm | composite | ||||
| University | square | aluminium | rough | black/white | diffuse | |
| of Bonn | cm | composite |
© 2019 by the authors. Licensee MDPI, Basel, Switzerland. This article is an open access article distributed under the terms and conditions of the Creative Commons Attribution (CC BY) license (http://creativecommons.org/licenses/by/4.0/).
Share and Cite
Janßen, J.; Medic, T.; Kuhlmann, H.; Holst, C. Decreasing the Uncertainty of the Target Center Estimation at Terrestrial Laser Scanning by Choosing the Best Algorithm and by Improving the Target Design. Remote Sens. 2019, 11, 845. https://doi.org/10.3390/rs11070845
Janßen J, Medic T, Kuhlmann H, Holst C. Decreasing the Uncertainty of the Target Center Estimation at Terrestrial Laser Scanning by Choosing the Best Algorithm and by Improving the Target Design. Remote Sensing. 2019; 11(7):845. https://doi.org/10.3390/rs11070845
Chicago/Turabian StyleJanßen, Jannik, Tomislav Medic, Heiner Kuhlmann, and Christoph Holst. 2019. "Decreasing the Uncertainty of the Target Center Estimation at Terrestrial Laser Scanning by Choosing the Best Algorithm and by Improving the Target Design" Remote Sensing 11, no. 7: 845. https://doi.org/10.3390/rs11070845
APA StyleJanßen, J., Medic, T., Kuhlmann, H., & Holst, C. (2019). Decreasing the Uncertainty of the Target Center Estimation at Terrestrial Laser Scanning by Choosing the Best Algorithm and by Improving the Target Design. Remote Sensing, 11(7), 845. https://doi.org/10.3390/rs11070845