1. Introduction
WorldView-3 (WV3) satellite was launched in August 2014 and is able to provide multispectral images with an unprecedented combination of high spatial and spectral resolutions. The platform is equipped with a 0.31 m resolution panchromatic sensor, an eight-band visible and near-infrared imager (operating between 397 and 1039 nanometres) with a ground sample distance (GSD) of 1.24 m, a short-wave infrared sensor with further eight bands (1184–2373 nm) at a resolution of 3.7 m, and finally the CAVIS (Clouds, Aerosol, Vapors, Ice and Snow) sensor with twelve additional bands at 30 m for the retrieval of atmospheric properties [
1]. The panchromatic and multispectral sensors have also stereo capabilities and the nominal geolocation accuracy of the images is about 5 m [
2], which can be greatly improved using a few ground control points [
3]. WV3 platform follows a sun-synchronous orbit at a nominal altitude of 617 km and is expected to be operational for about ten years.
These characteristics foster new applications, especially for urban environments. WV3 images have been tested in many different fields, such as mapping heterogeneous agricultural landscape [
4], mineralogical and lithological mapping through spectral indices [
5], urban land cover classification with deep learning models [
6], bathymetry retrieval [
7], among the most recent ones. It is worthwhile to mention that the strategic objectives of WV3 include also the detection of buildings and the recognition of materials.
The ability to collect stereo-pairs of panchromatic images at the resolution of 0.3 m makes WV3 suitable for the production of detailed digital elevation models (DEMs). Several authors tested the stereo capabilities of WV3 in different environments, obtaining promising results. Aguilar et al. [
8] tested two algorithms for DEM extraction on different land cover types and found a standard deviation of 0.2 m on bare soils and 0.7 m on plastic greenhouses (compared to a reference LiDAR survey). Similarly, Hu et al. [
9] found a standard deviation of 0.6 m in the model of a mountainous area in China, using four WV3 images.
Urban environments, however, present specific challenges, due to the complex morphology of the urban texture. Some authors [
10] already noted that the accuracy and completeness of models in urban areas are lower. Rupnik et al. [
11] applied a multi-view reconstruction algorithm on an urban area and reported some differences in quality indicators as a consequence of varying housing density. In this context, the geometry of acquisition appears to influence the quality of the final results [
12].
The present technical note aims at evaluating the accuracy of DEMs that can be obtained from WV3 imagery, which offers the highest spatial resolution among the currently operational and commercially available satellite sensors with stereo capabilities. Differently from previous works, the present note focuses exclusively on urban areas, which require very high resolution to correctly describe their complex morphology. In addition, urban environments are generally the most problematic for the reconstruction process, thus they constitute a particularly meaningful test to assess the performances of this imagery.
The evaluation of the obtained DEMs is carried out on different urban contexts, from extremely dense urban centres, with ancient buildings of variegated shapes and narrow hollows, to more recent residential and productive areas, with larger buildings, open spaces and wider roads. In this technical note, not only the accuracy of the generated 3D model as a whole is estimated, but different components of the urban texture (e.g., roofs, carriageways, road network orientation) are analysed separately to investigate their specific contributions to the global errors. In addition, the effects of different acquisition geometries are considered. All of these aspects, indeed, may be relevant for end-users to evaluate the suitability of WV3-derived models on the basis of the specific application requirements.
The experimentation exploits a state-of-the-art DEM extraction algorithm, the semi-global matching [
13], that is very popular in routinely production workflows where robust and efficient stereo-matching is required, even though it is capable of processing only one single pair at time (but this is a frequent scenario with expensive satellite imagery). This algorithm is considered very robust and able to reduce large outliers in low or non-textured areas while preserving edges and sharp object boundaries. The use of pixel-wise cost functions provides the capability to resolve fine spatial structures on the object surface [
14].
The following sections analyse the performance of WV3 images over the urban area of Bologna (Italy) in a production perspective.
2. Materials
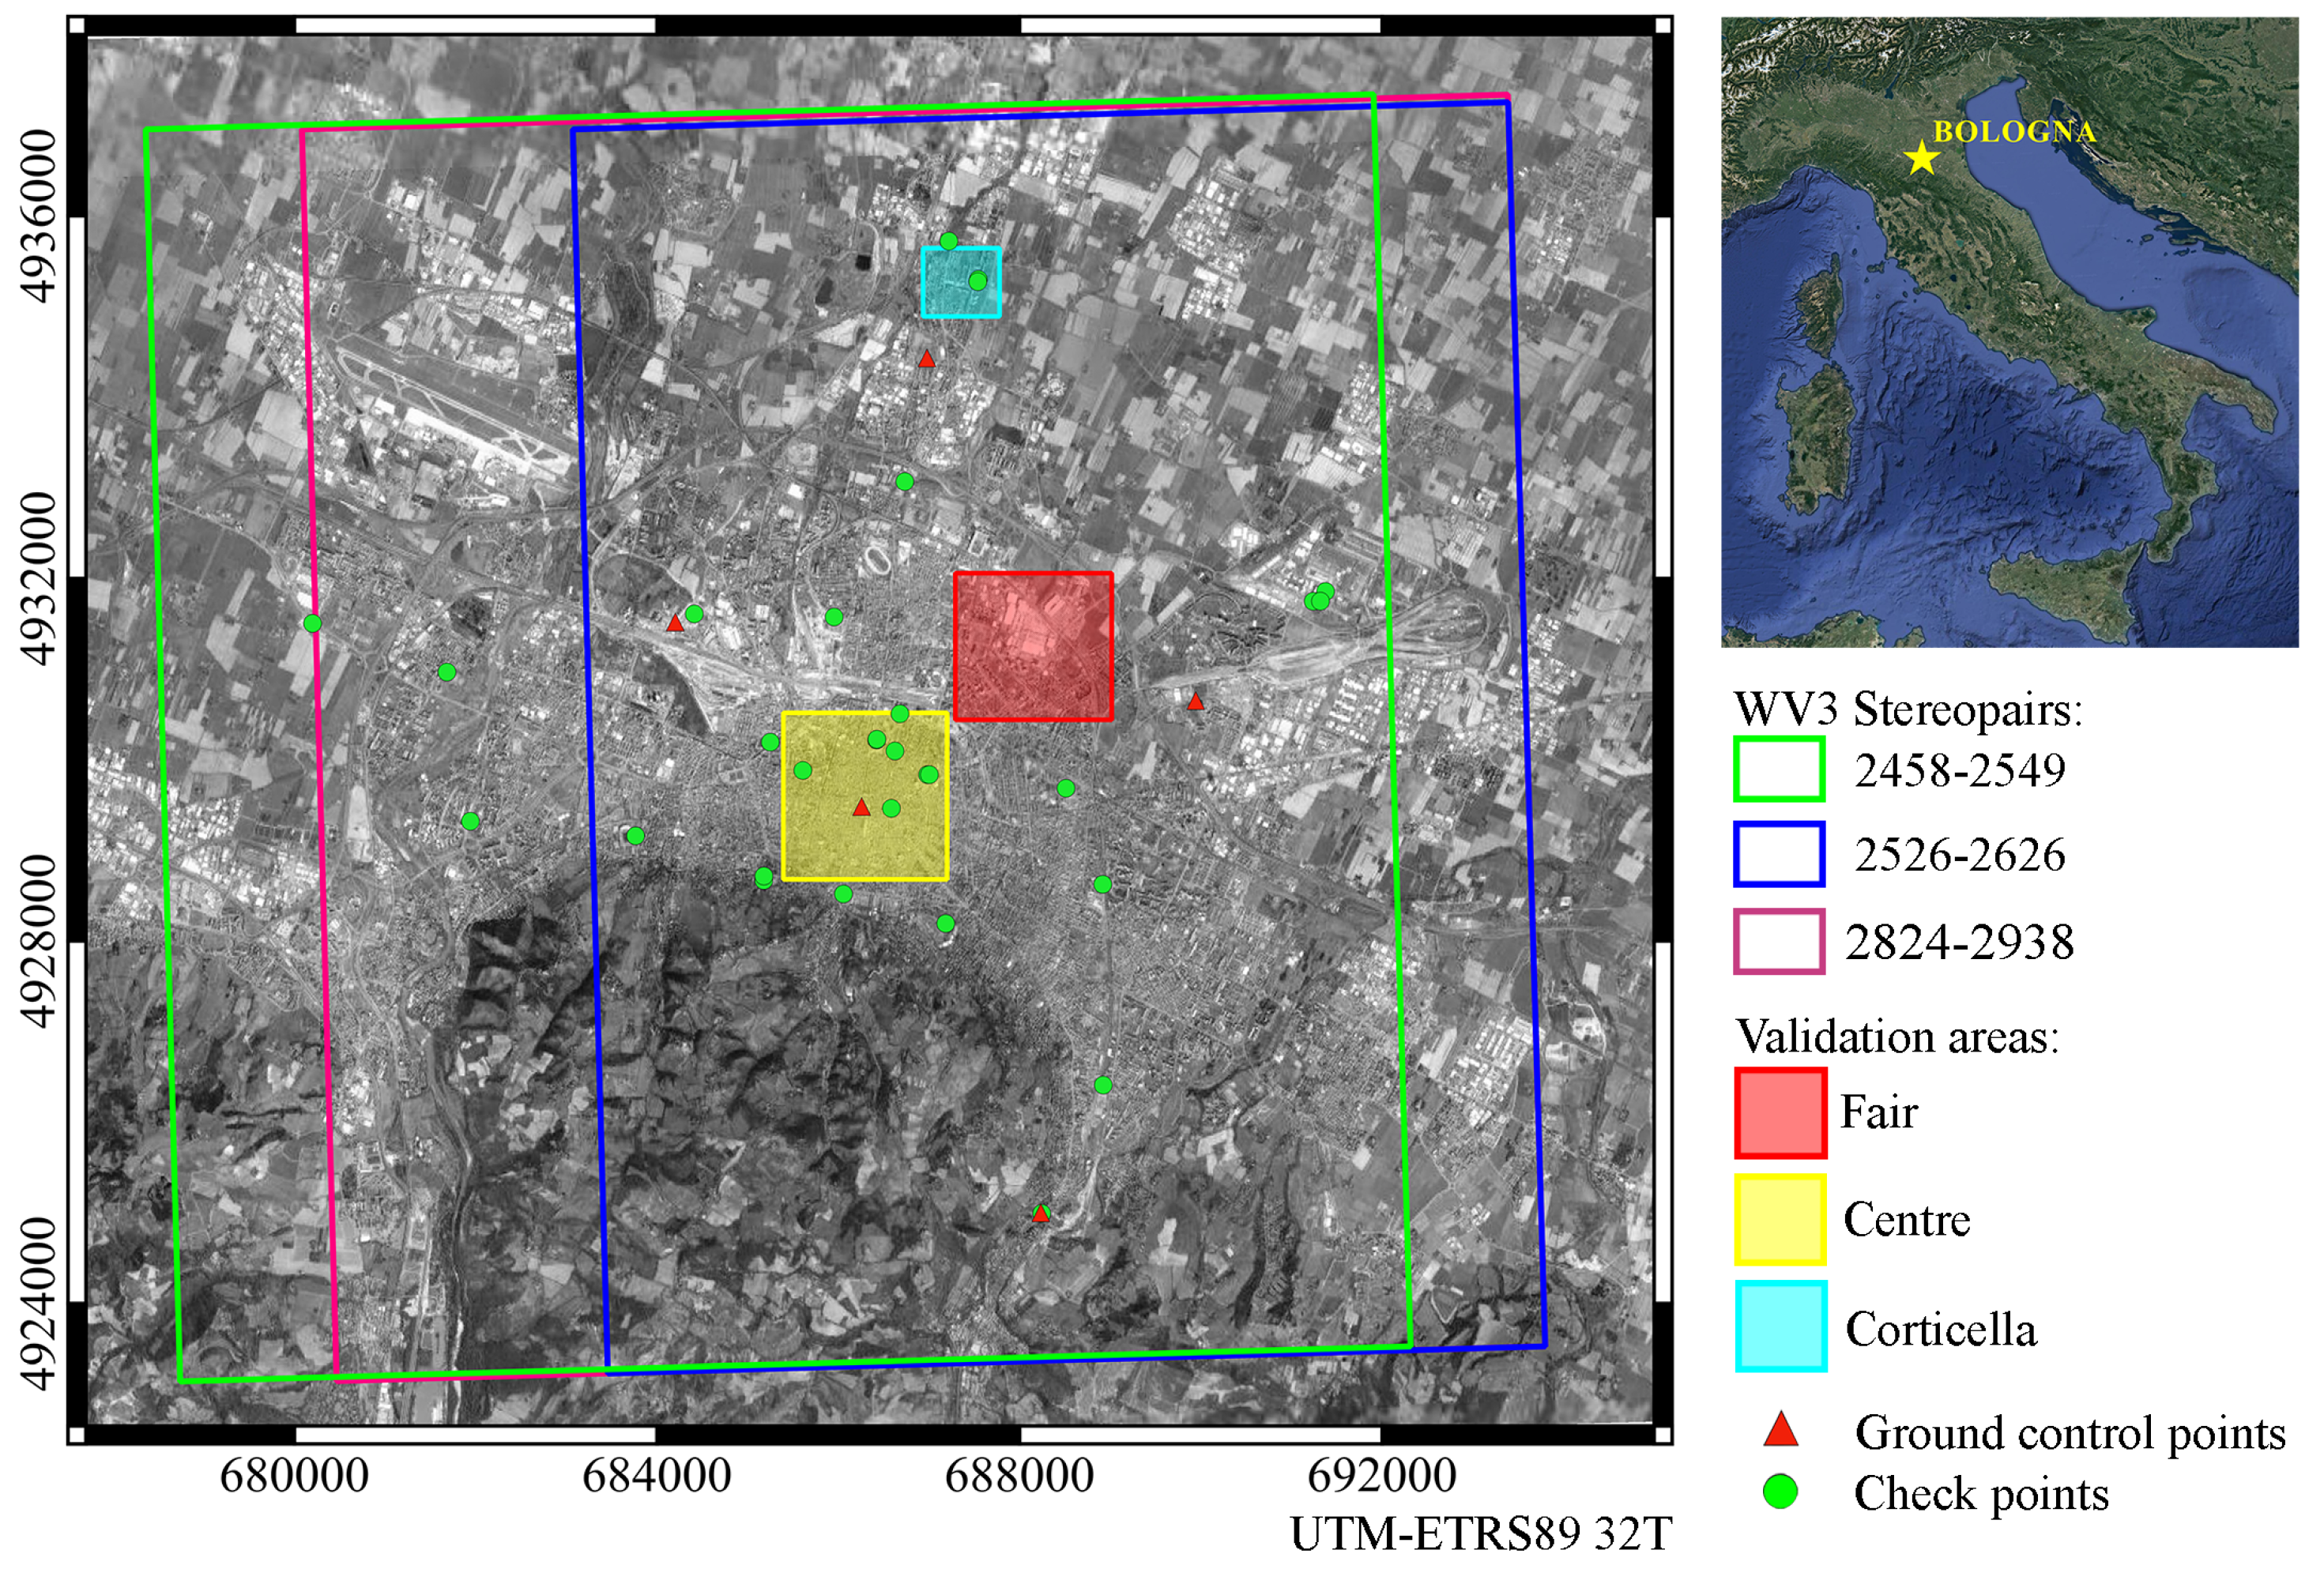
For the present experimentations, three different stereo-couples were acquired over the area of Bologna (Italy) in 2017 in a few days, the first on 14 September 2017 and the other two on 20 September (
Table 1). The names used in this paper (and reported in the first column) are made of the last four digits of the time stamp included in the original file name; the identification code used in the supplier’s catalogue is also reported (second column). All the images were acquired at noon and can be considered cloud-free and haze-free. They cover an area of approximately 100 km
2, encompassing the territory of the Municipality of Bologna (
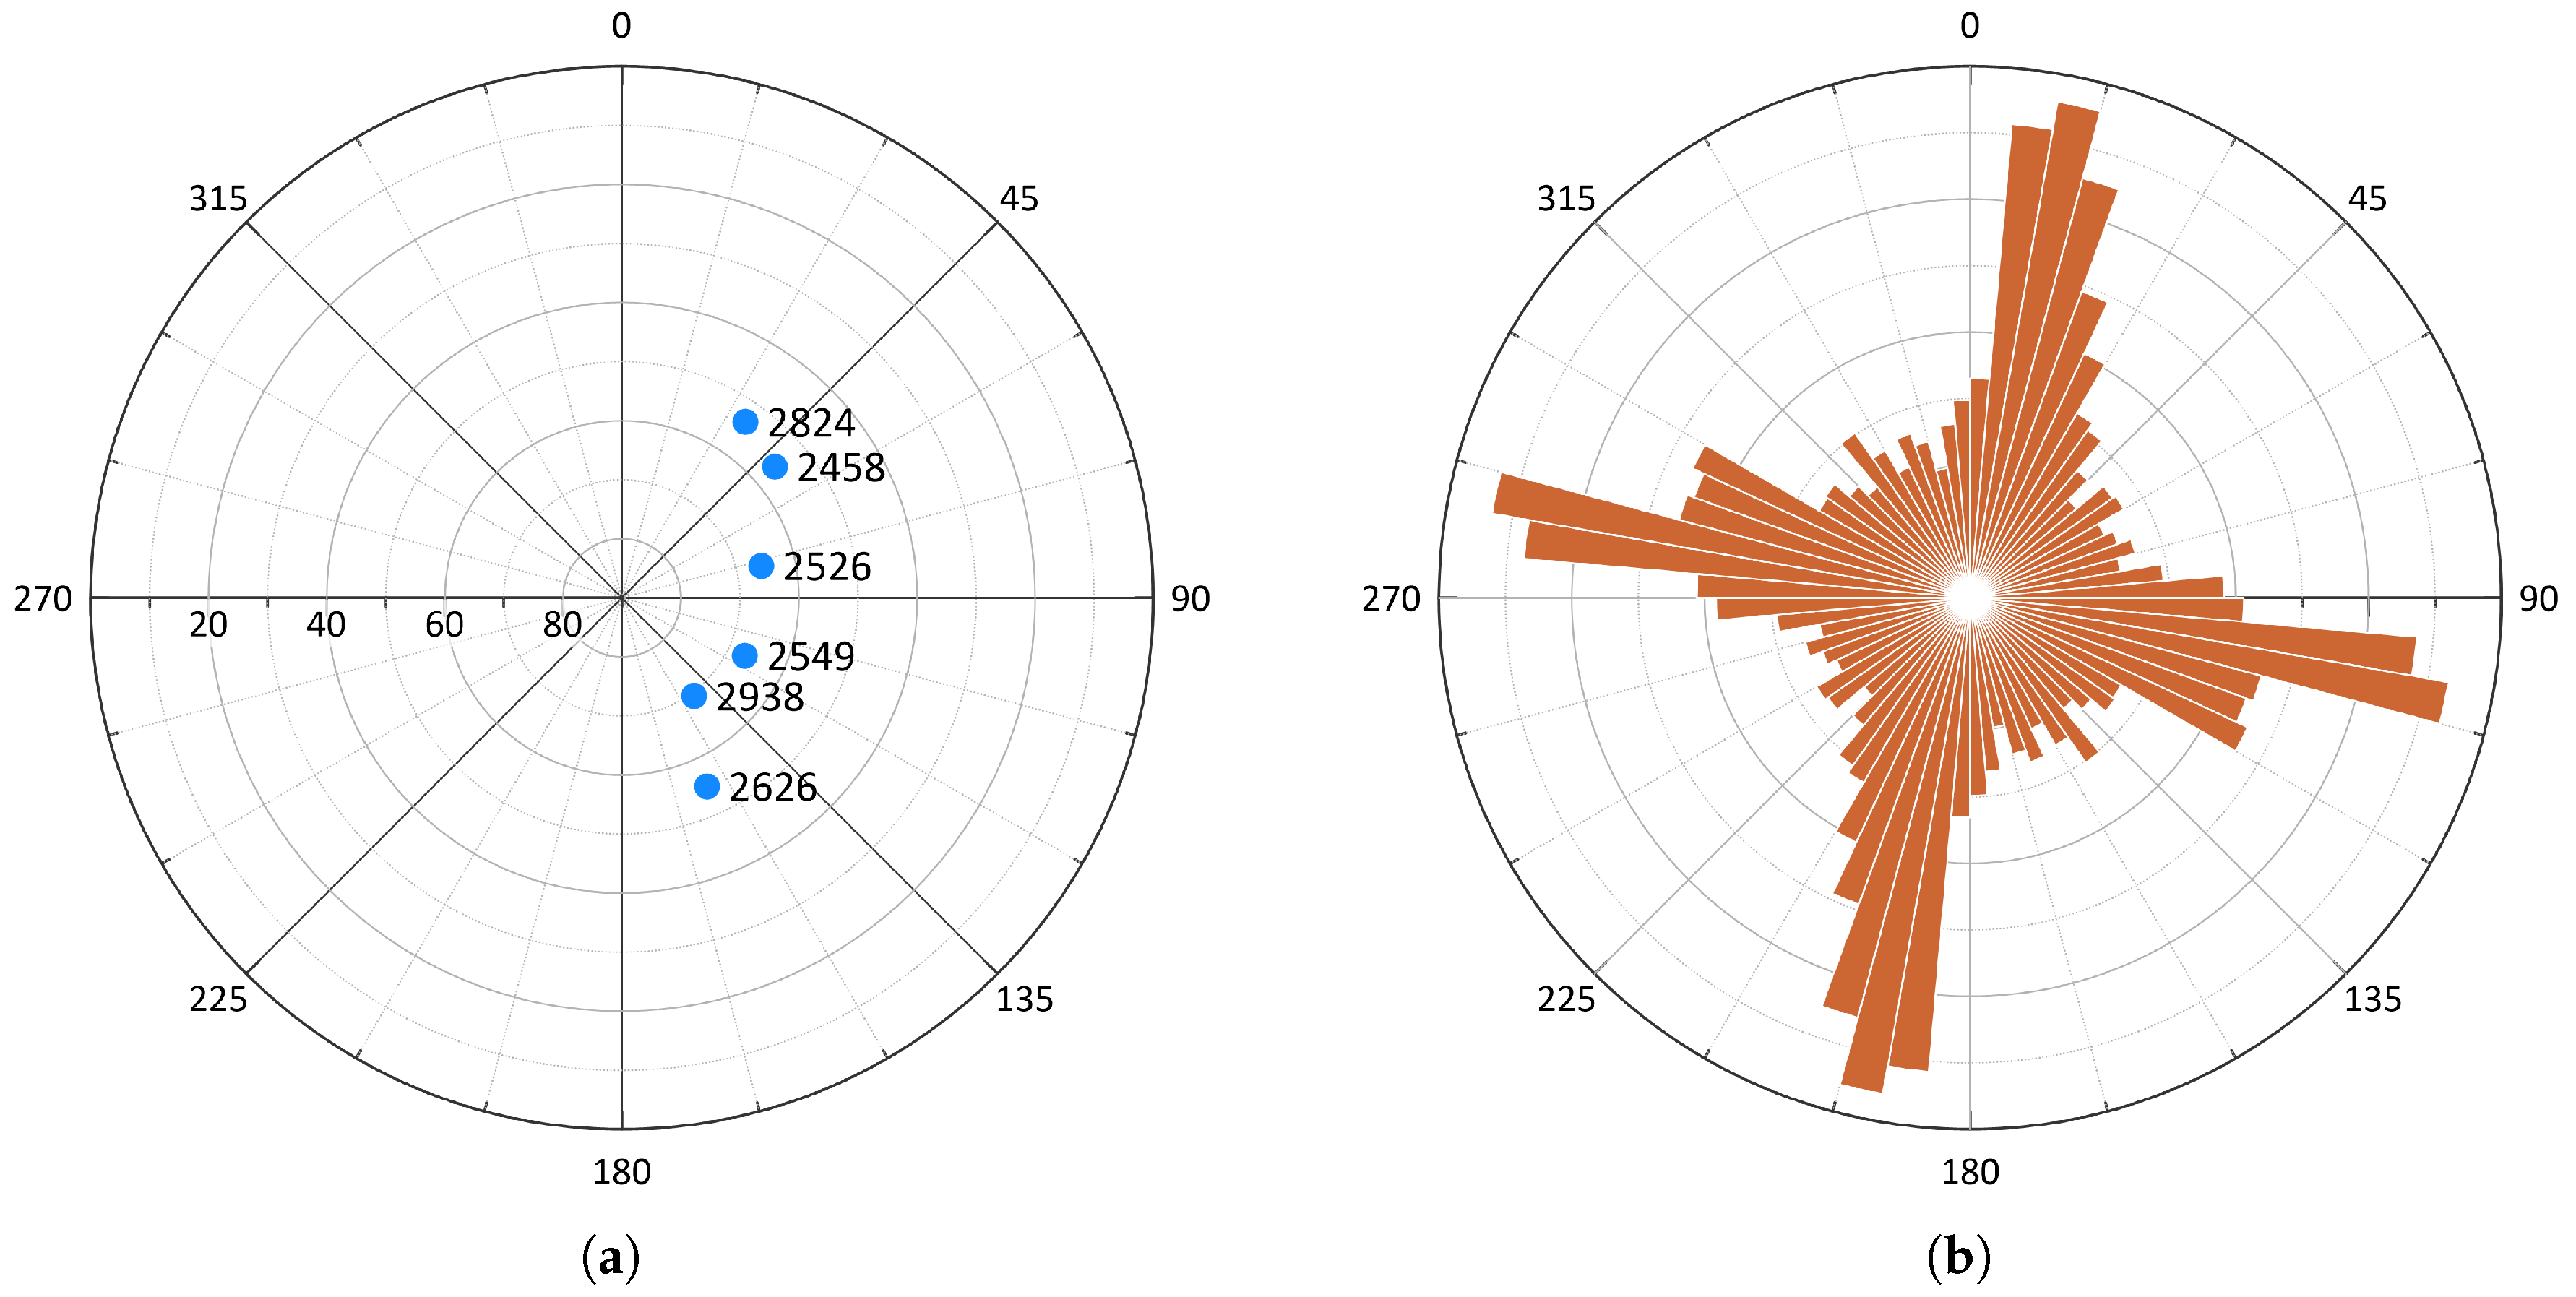
Figure 1). The elevation angle and azimuth of the satellite at the time of acquisition are reported in
Figure 2a. All the images were pre-processed by the supplier at the Ortho-Ready level, which means they underwent basic radiometric correction, they were resampled at 0.3 m square pixels and they are provided with the coefficient of a rational polynomial model for the orthorectification process.
In order to refine the rational polynomial model and to check the accuracy of the final products, a set of points were directly measured in the observed area using network real-time kinematic (NRTK) techniques, based on virtual reference stations. A dual-frequency GRS1 receiver (Topcon Positioning Systems, Livermore, CA, USA) with a PG-A1 antenna was used and connected to the NETGEO network [
15]. Overall, 35 points were measured: 24 lie on the ground level, while 11 are located on flat roofs. The precision of the measured coordinates is about 2 cm for the planimetry and about 5 cm for the altimetry [
16].
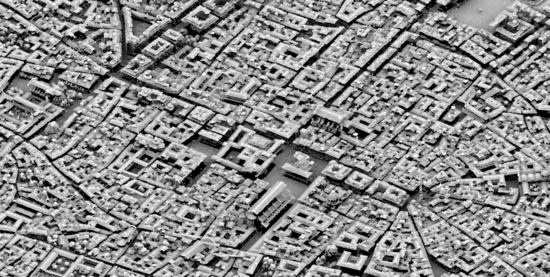
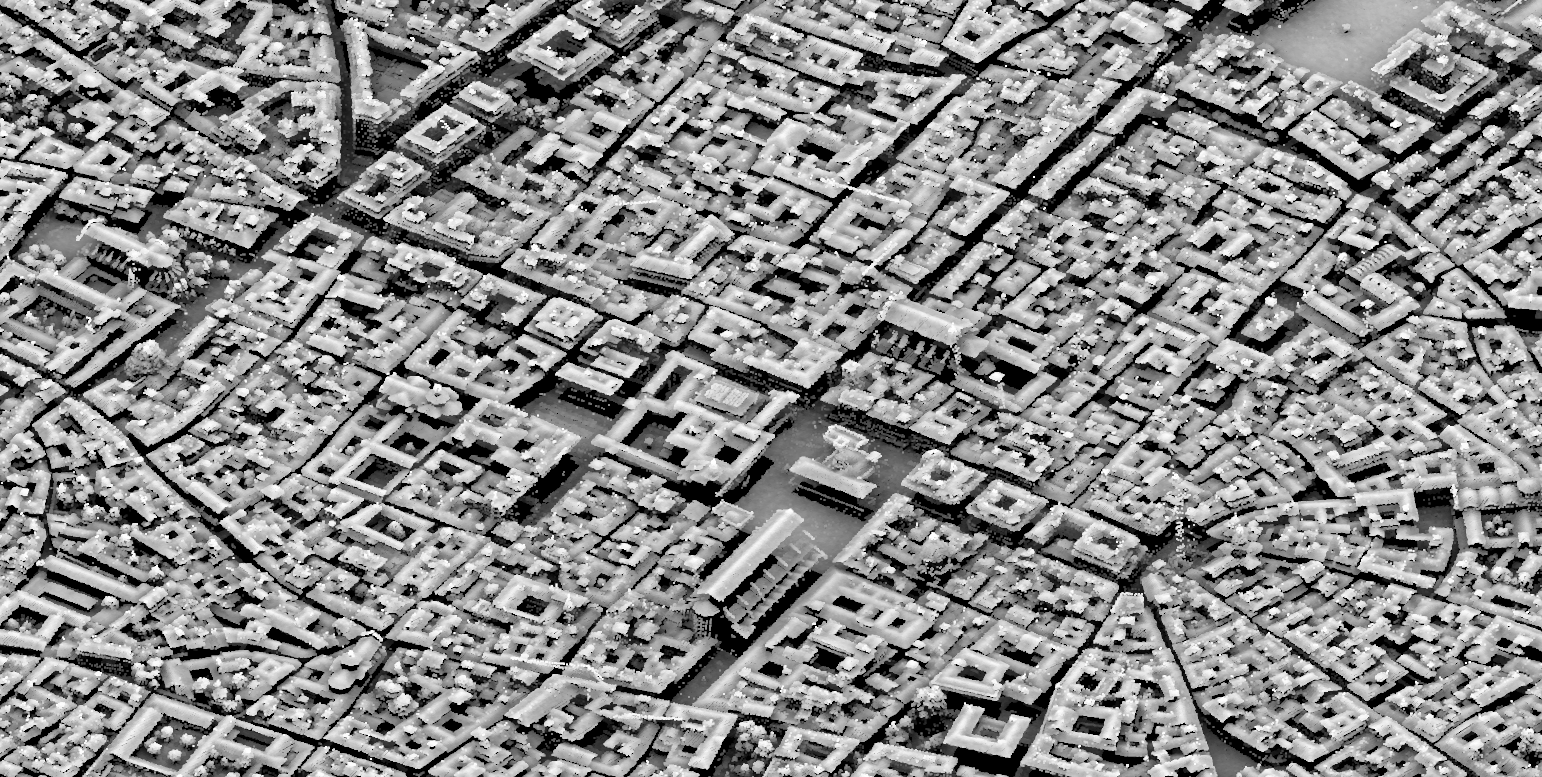
For a more exhaustive comparison of the generated DEMs, two existing products were collected: a point cloud obtained from a LiDAR survey performed on 26 January 2009 over the city centre and a model obtained from oblique aerial images and Structure-from-Motion algorithms over a smaller residential area.
The LiDAR survey used an ALTM 3033 (Optech, Toronto, ON, Canada) with a field of view of ±11 degrees. Given the operational altitude of 1250 m above the ground level and the distance between strip axes of 322 m, the horizontal accuracy is 0.6 m and the vertical one 0.2 m. The LiDAR cloud has a density of 1 point/m
2 in average [
17].
The model from the oblique images is described in detail in the paper by Bitelli et al. [
18] and only the main characteristics are reported here. A block of 132 aerial oblique images (GSD 8 cm), acquired in May 2017 using the MIDAS5 system (Track’Air, Enschede, Netherlands), was processed by the ContextCapture Structure-from-Motion software package (version 4.4.9, Bentley Systems, Exton, PA, USA). In addition, 350 million points with an average spacing of 5 cm constitute the obtained point cloud for the area of interest, covering 1.5 km
2. The accuracy of the final model can be considered in the order of few centimetres.
Finally, the technical cartography of the Municipality of Bologna, which comes with a nominal scale of 1:2000 and a tolerance for planimetric coordinates of about 0.5 m, was used for GIS analyses.
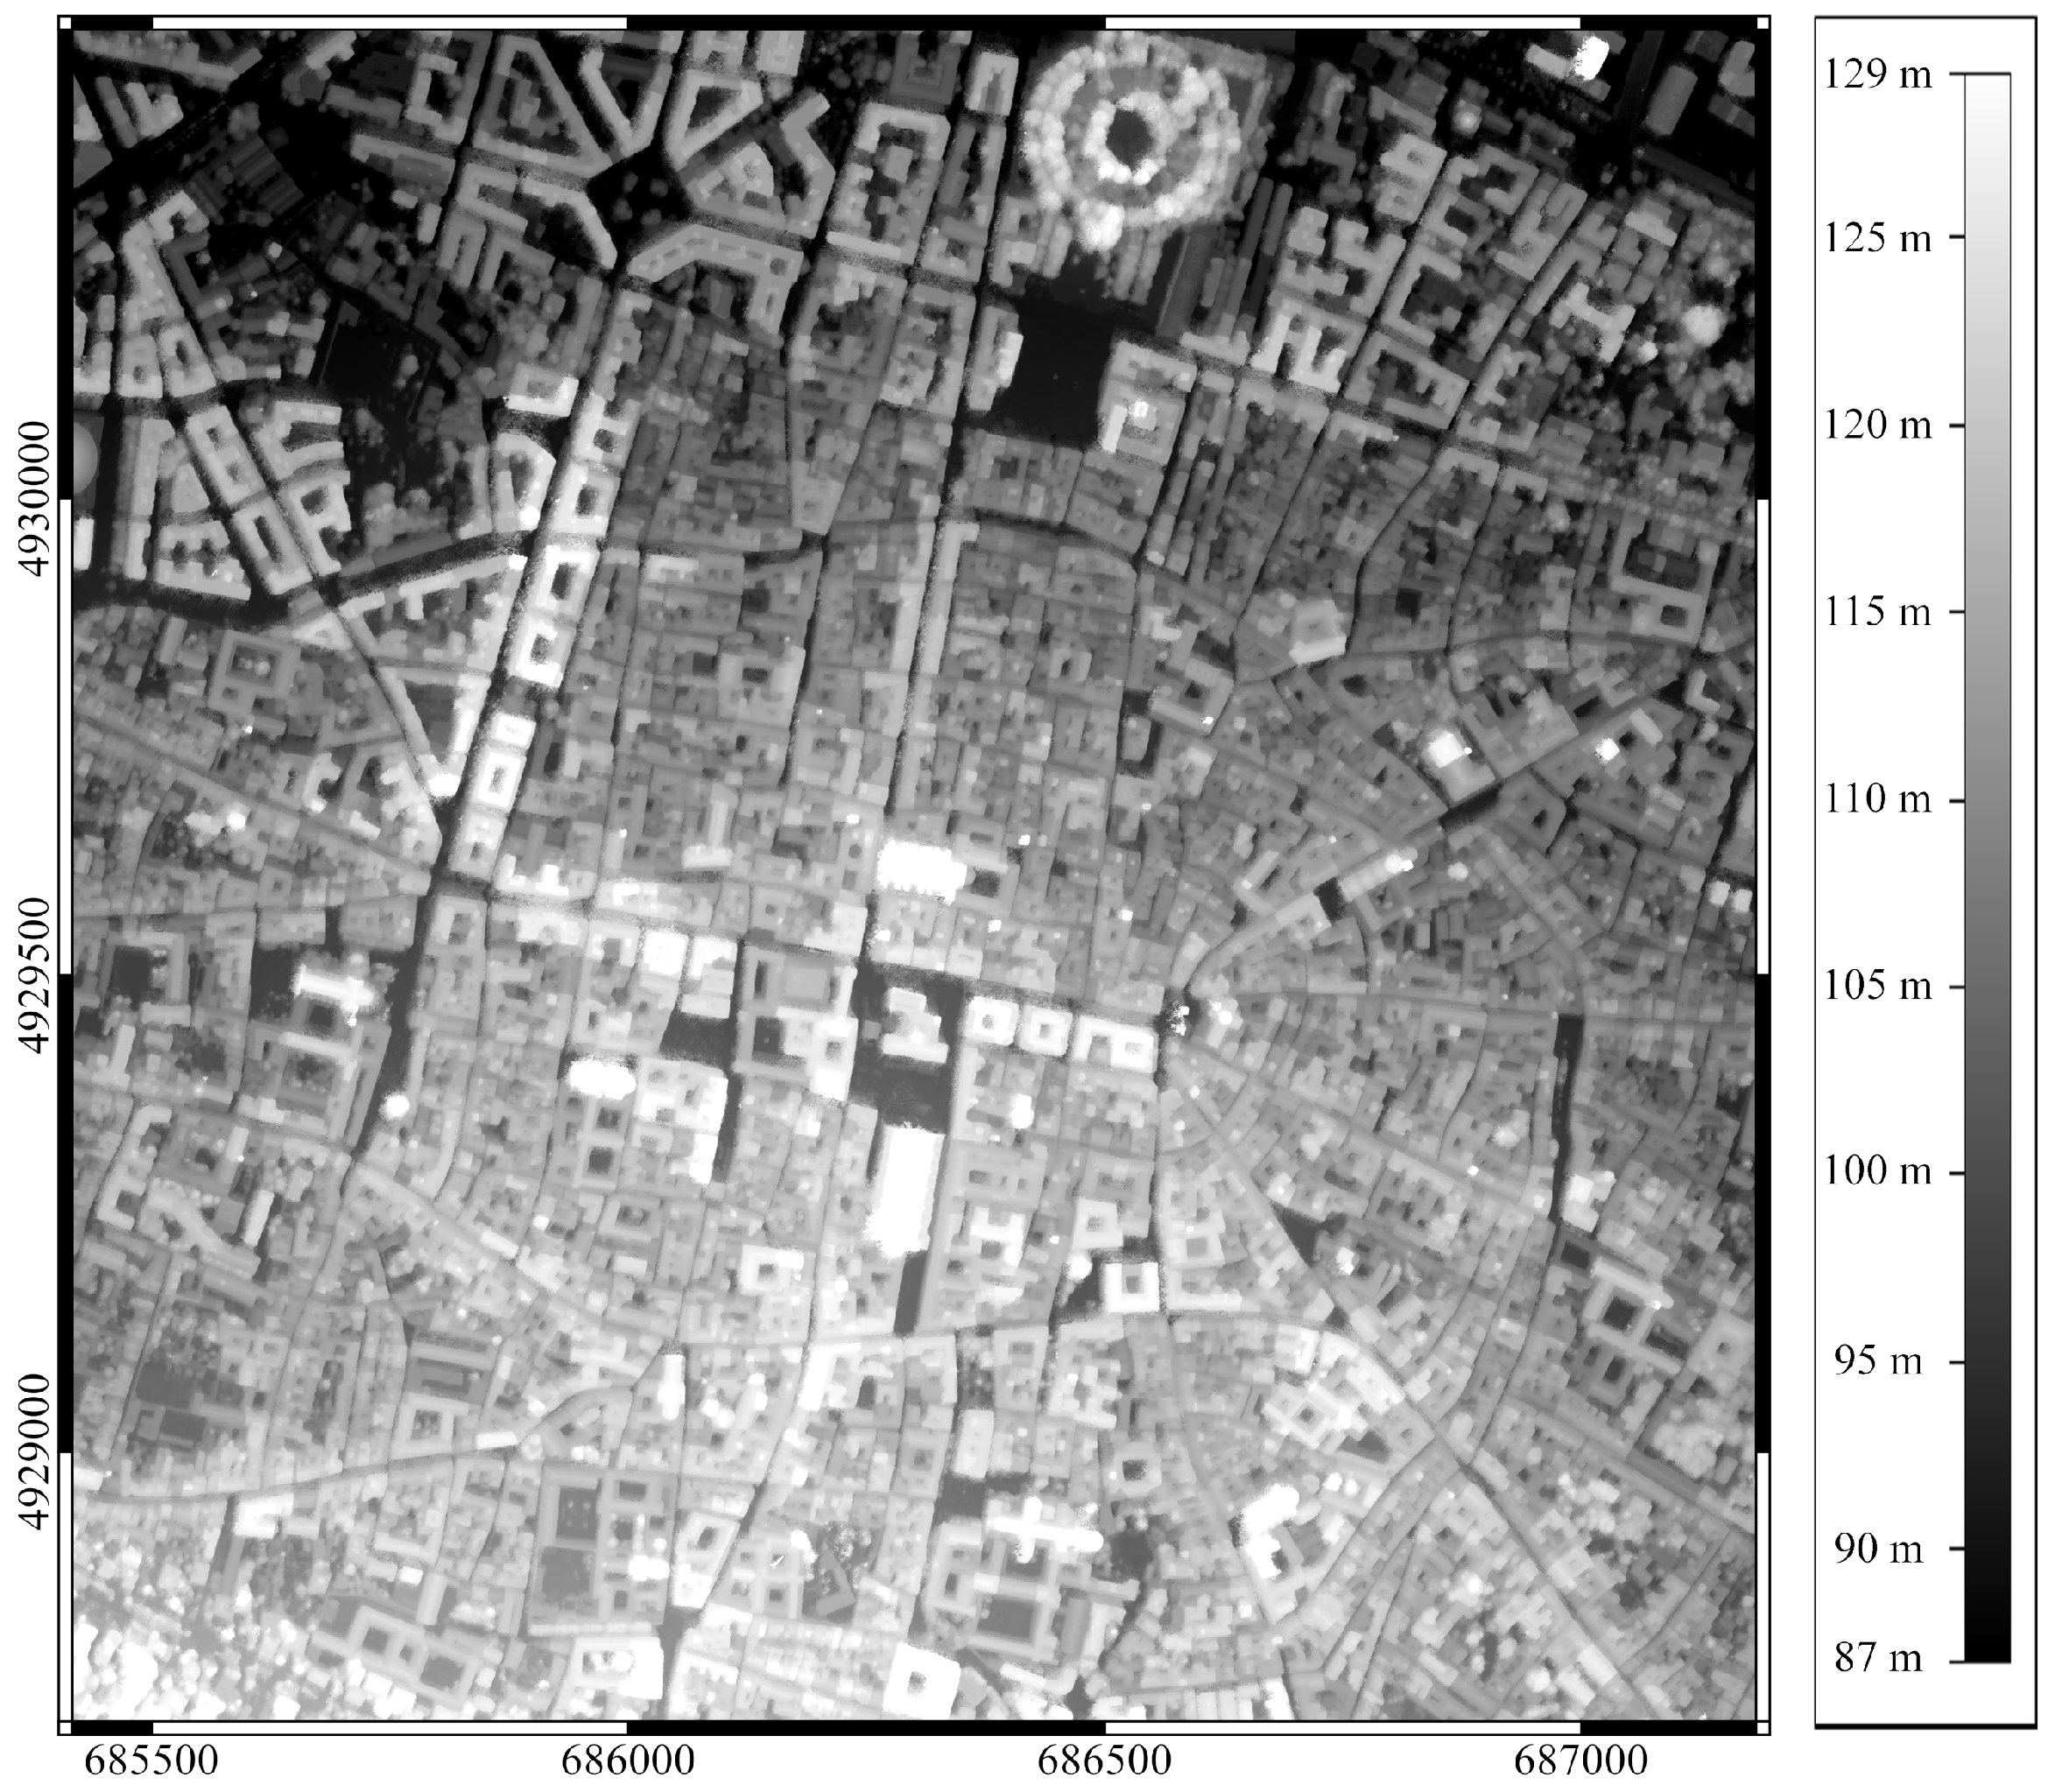
Figure 2b, for example, shows the frequency distribution of the azimuth angles of the roads in the city centre.
All the data were coherently framed in the ETRF2000 (epoch 2008), which is the official geodetic framework for Italy, using the NRTK points.
4. Results and Discussion
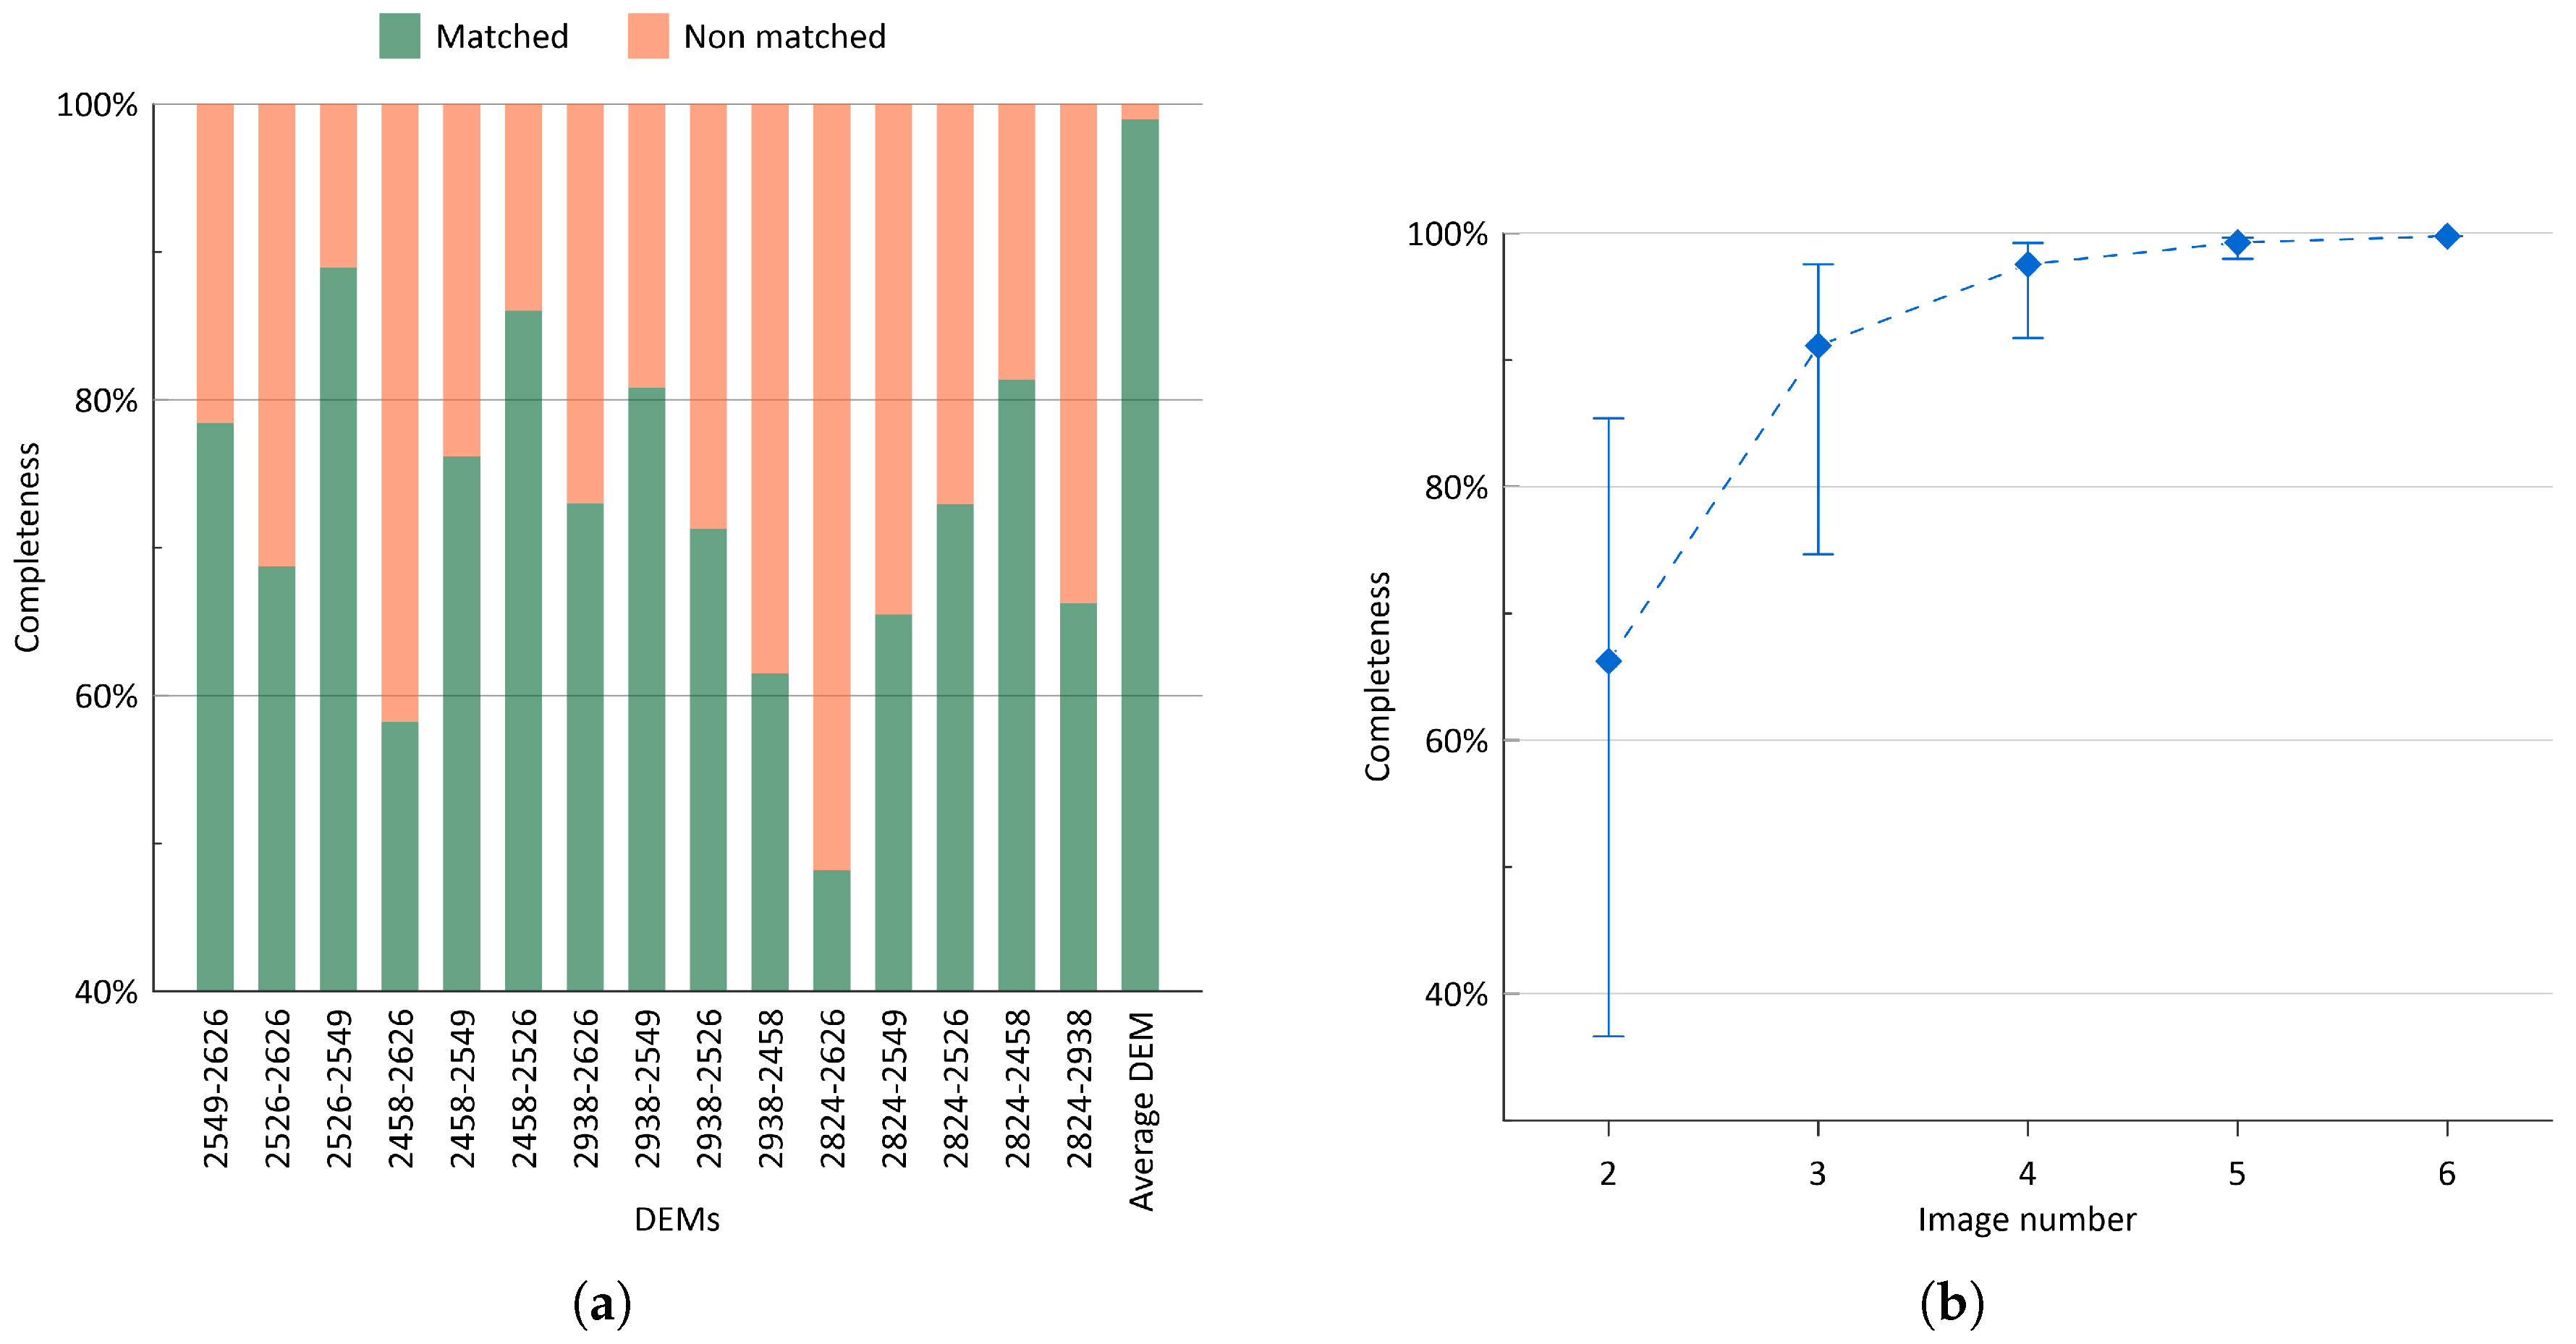
The results in terms of completeness of the whole model are summarised in
Figure 4a. Considering the models derived by the individual stereo-pairs, the best solution is given by the 2526–2549 couple that reaches completeness of about 89%, while the less complete solution is given by the 2824–2626 couple (48%). An inverse correlation was found between completeness and convergence angle, with a coefficient of determination (R
2) equal to 0.8, if the entire 100 km
2 area is considered. A similar trend was observed also by Aguilar et al. [
12], even though with a lower R
2, and seems to be typical of urban areas. The comparison of the three validation areas suggests a connection with building density: R
2, indeed, rises up to 0.90 in Fair area and even 0.97 in the Centre, whilst drops to 0.69 at Corticella. The success of the matching is highly dependent on the visibility of the mapped surfaces. Obviously, tall buildings hide many façades and portions of carriageways; this problem is exacerbated by the lack of a really nadiral image (as for
Table 1, off-nadir angles range from 18 to 33 degrees), which is very common for satellite imagery.
The Average DEM (which was obtained as a weighted average of the fifteen DEMs from the single stereo-pairs,
Section 3.1) took advantage of the different view points of all the six images and reached completeness of 99%. Many tests were carried out to assess the achievable completeness with an increasing number of images, by merging the DEMs computed from all the possible pairwise combinations of only three, four and five images, respectively. Results in
Figure 4b show a monotonic but asymptotic growth of the average completeness with the number of images available and a simultaneous narrowing of the variability (clearly, the range for the completeness with six images is not drawn because only one solution—which is the Average DEM of
Figure 4a—is possible with the available dataset).
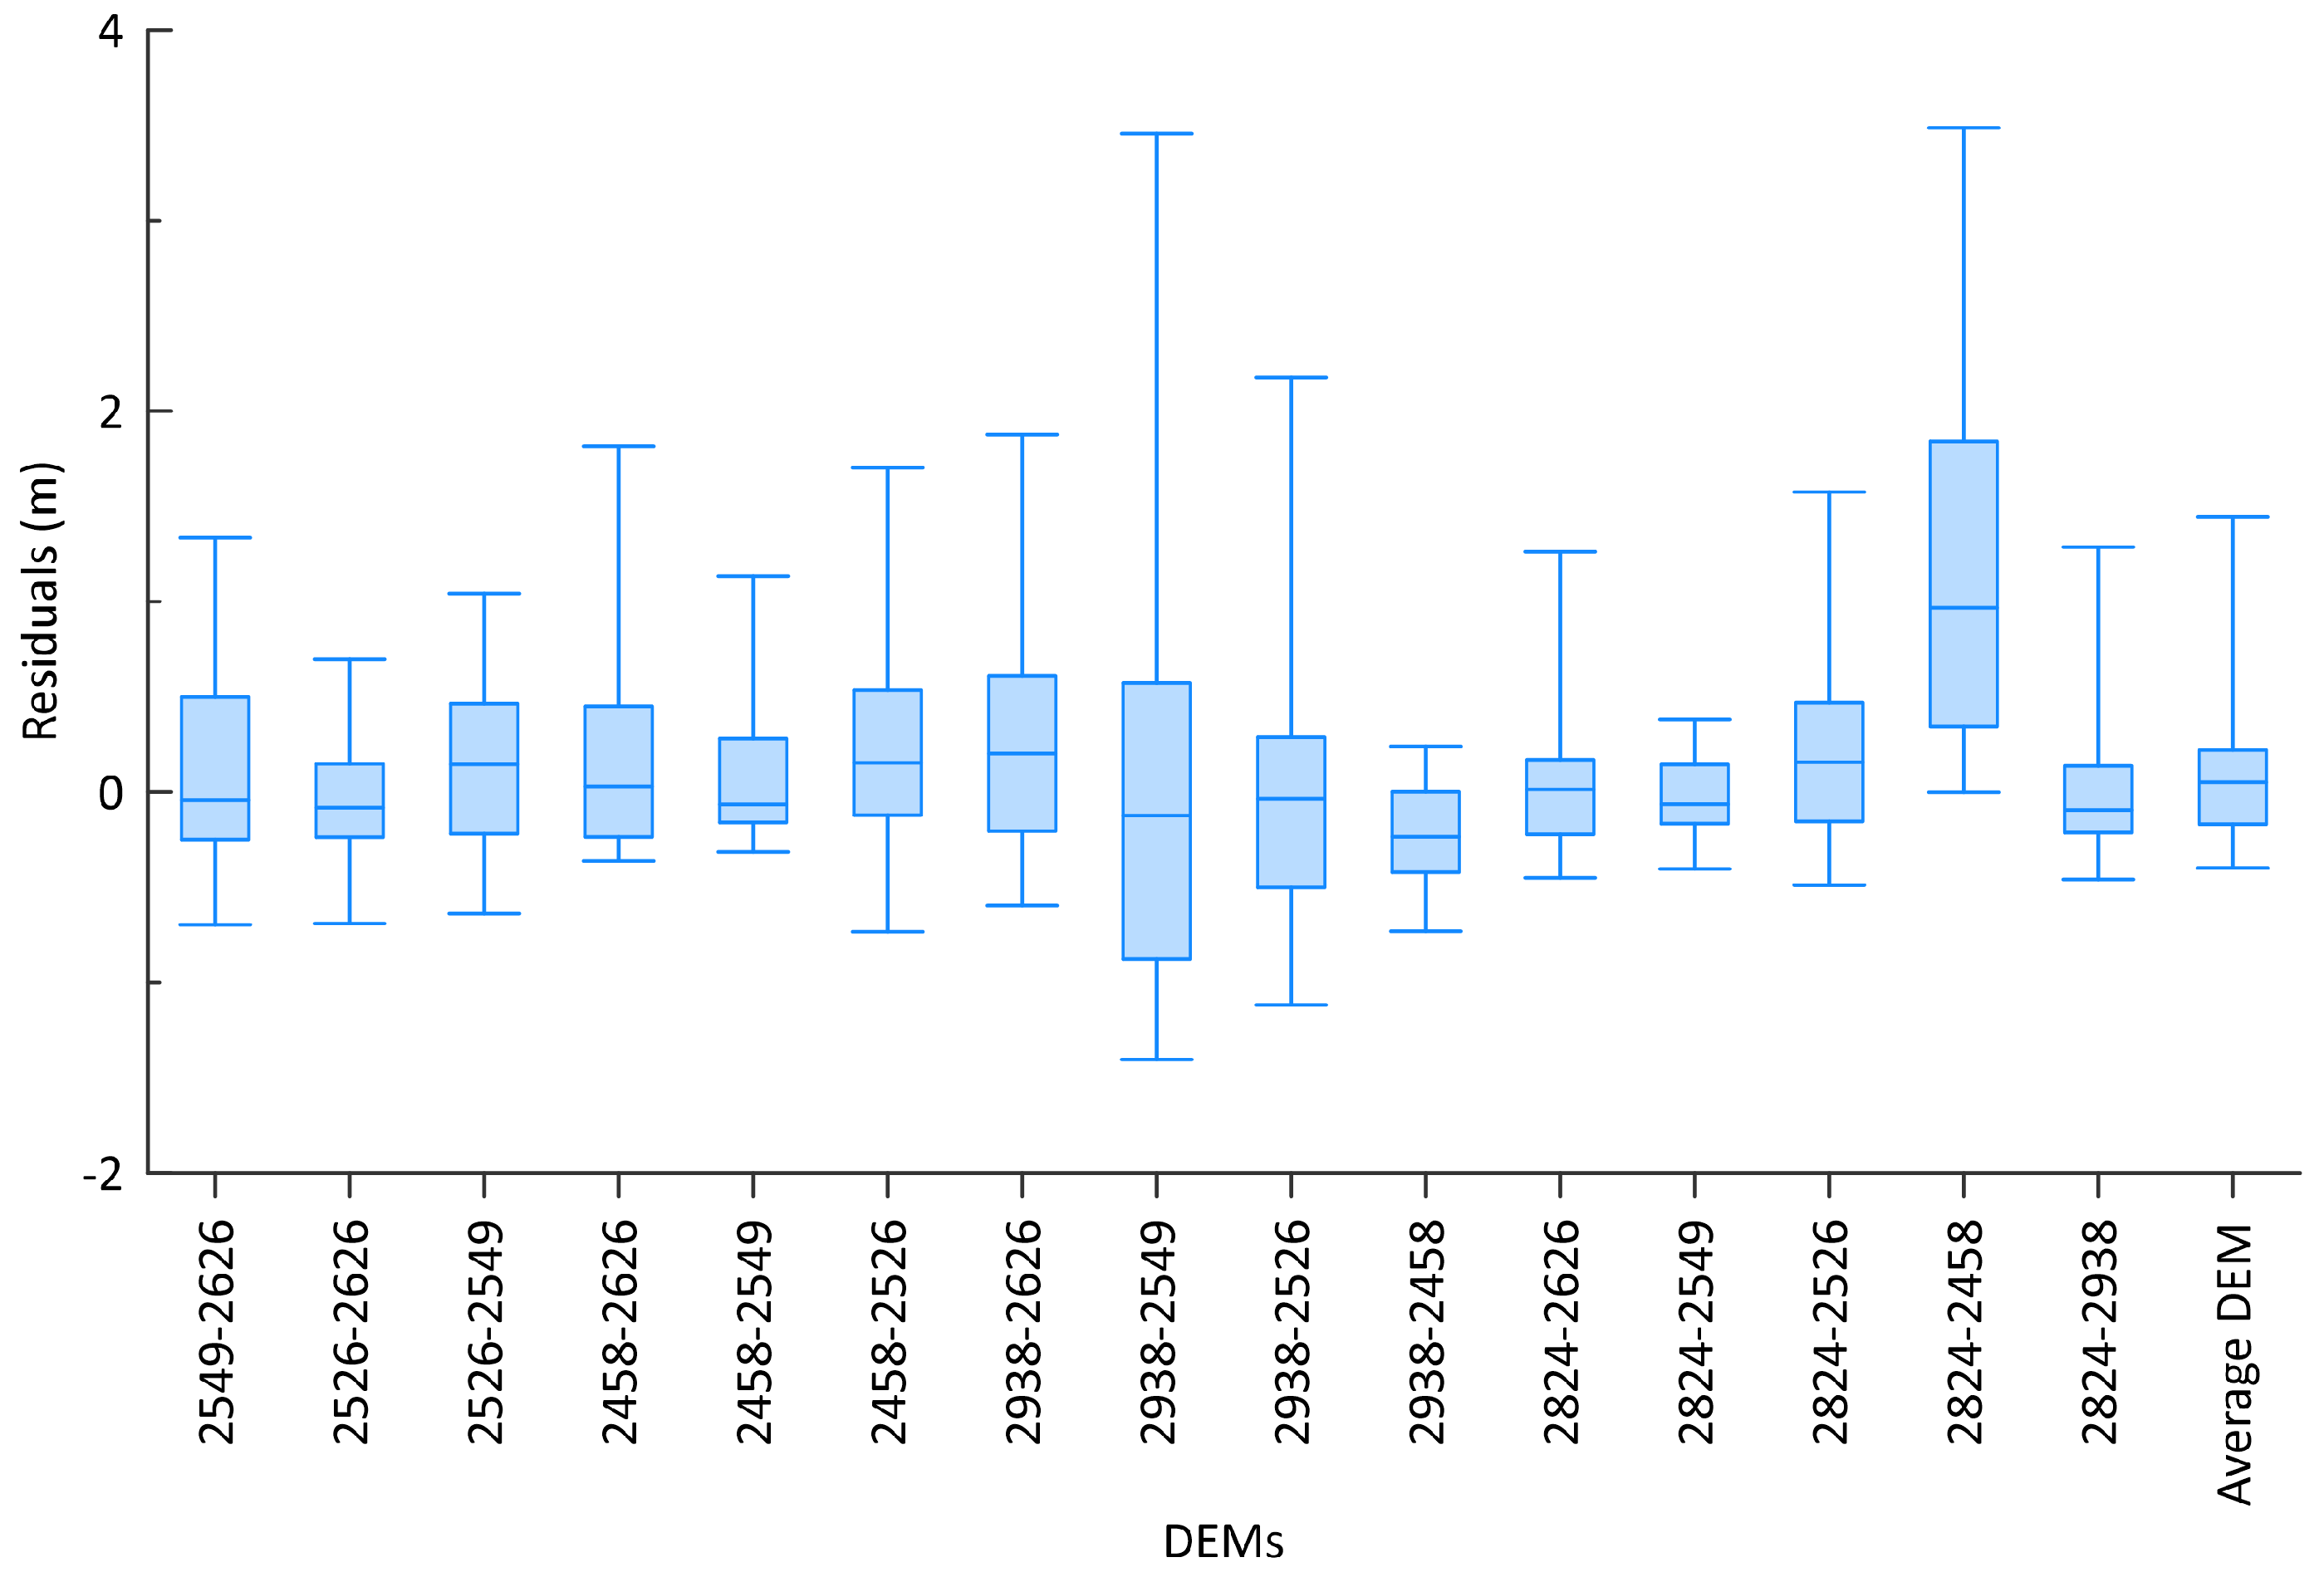
Statistics on check points are shown in
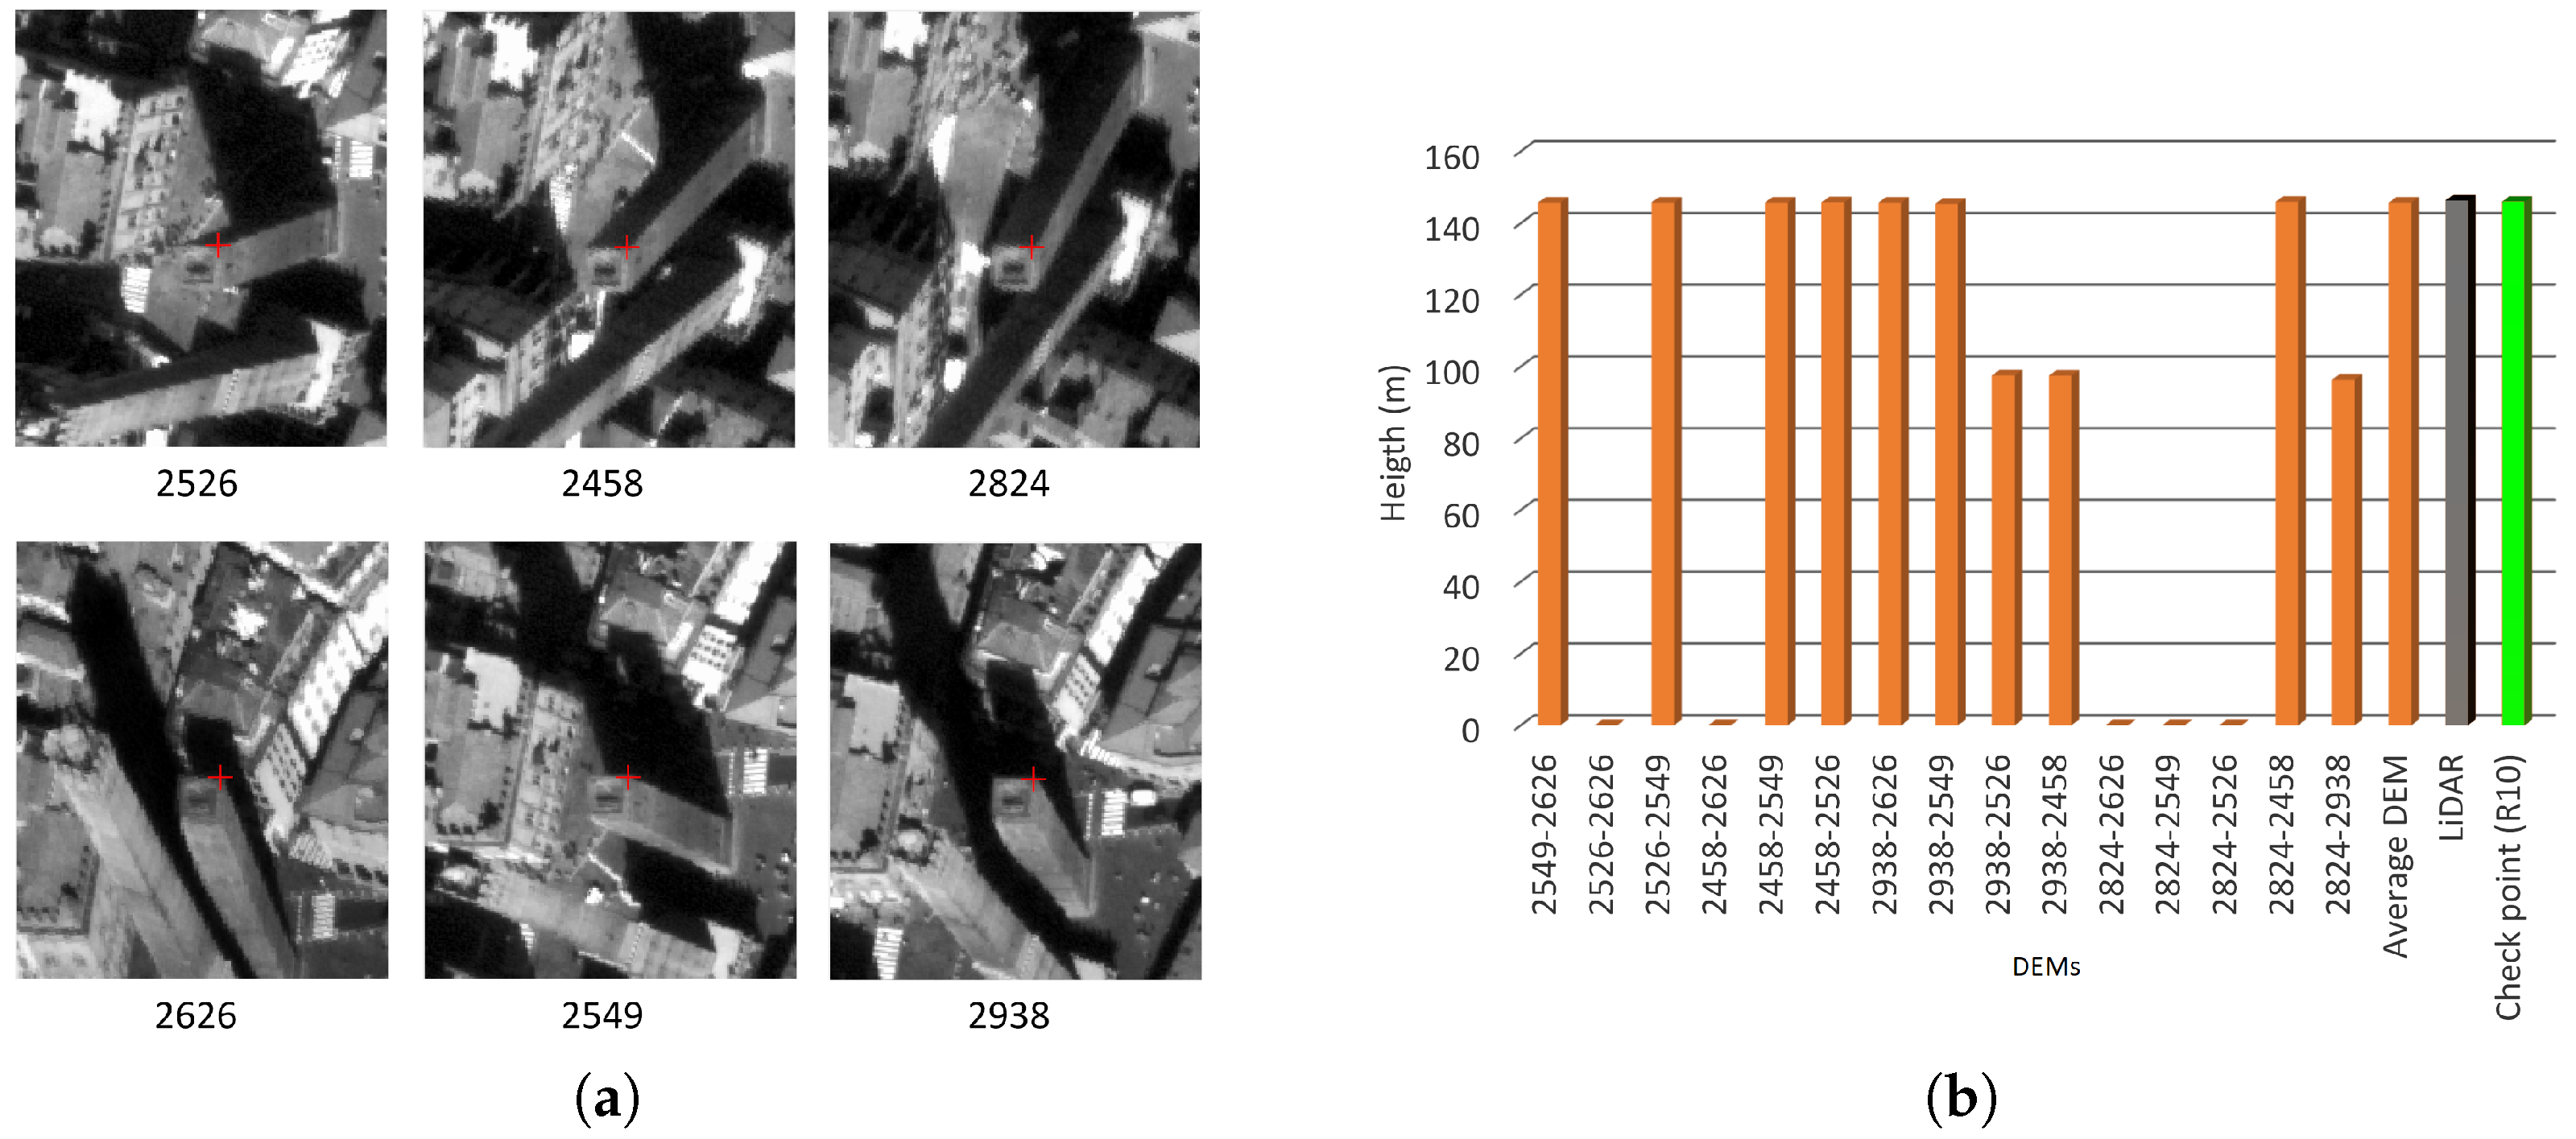
Figure 5. RMSEs on the elevations are in the range of two pixels for most of the extracted DEMs, except for four cases where few outliers rise the variance. These outliers are related to severe matching problems in correspondence of some ancient towers in the historical centre of the city. Towers are structures characterised by a very limited extent in planimetry, but extremely pronounced height. An example of this situation is given in
Figure 6, where the computed elevations of the Garisenda tower are compared with reference data. Looking at the screenshots of the six WV3 images, it appears that the matching algorithms are not able to manage strong differences in the perspective view. For instance, when the pair is made of two images in which different façades of the tower are visible (e.g., 2824–2549), the matching fails completely and the elevation is not computed. On the other hand, when the perspective view of the tower is almost the same (e.g., 2938–2549), the elevation is correctly computed. The worst cases, however, are the intermediate ones (i.e., 2938–2526, 2938–2458, 2824–2938), where strongly biased values are obtained and the score does not highlight the anomaly.
Figure 6 demonstrates also the importance of a rejection criterion in the computation of the Average DEM.
Statistics on M3C2 distances calculated in the three areas between the WV3 Average DEM and the reference data (LiDAR for Centre and Fair, and MIDAS5 for Corticella) are shown in
Table 3. The values are substantially comparable in the three areas, except for the median in Corticella, which is higher, probably because of the more complex shape of the roofs (which are composed of parts with different heights). On the other hand, in this area, the range of M3C2 values is narrower (from −30 to 37 m, instead of −74 to 71 m in the city centre) because there are not particularly problematic structures, such as towers.
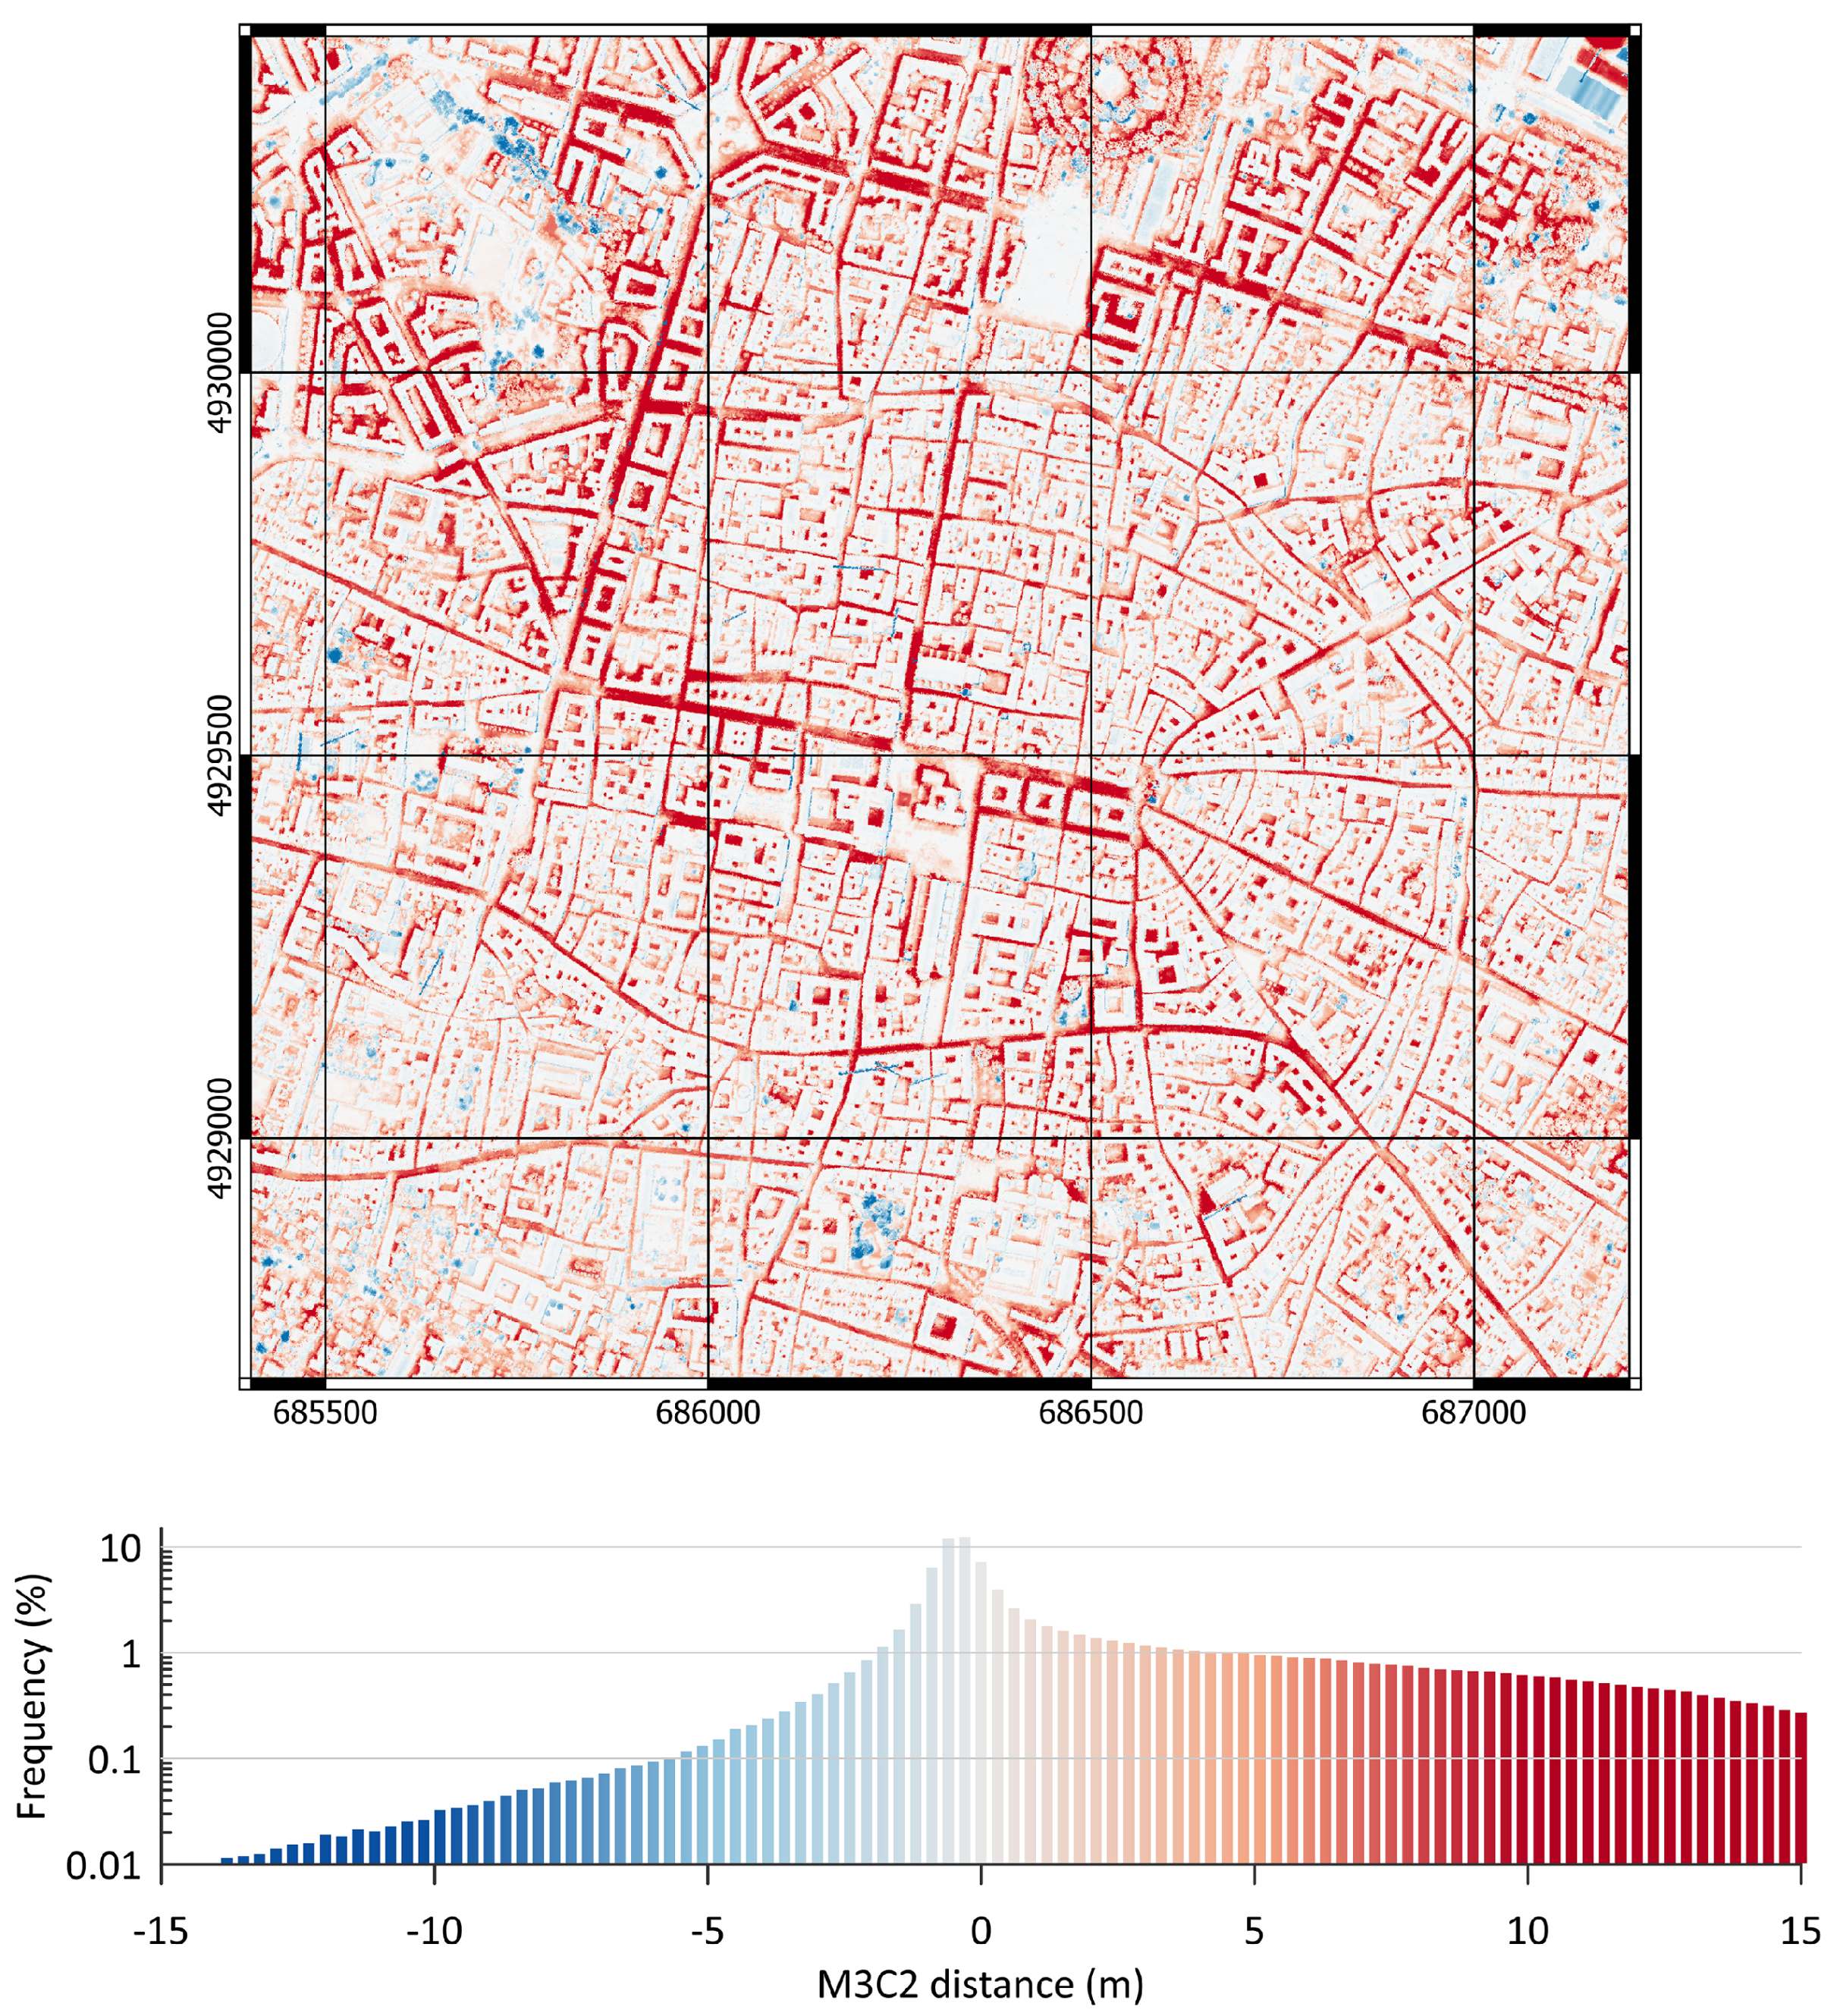
The M3C2 map between the Average DEM and LiDAR for the Centre area is shown in
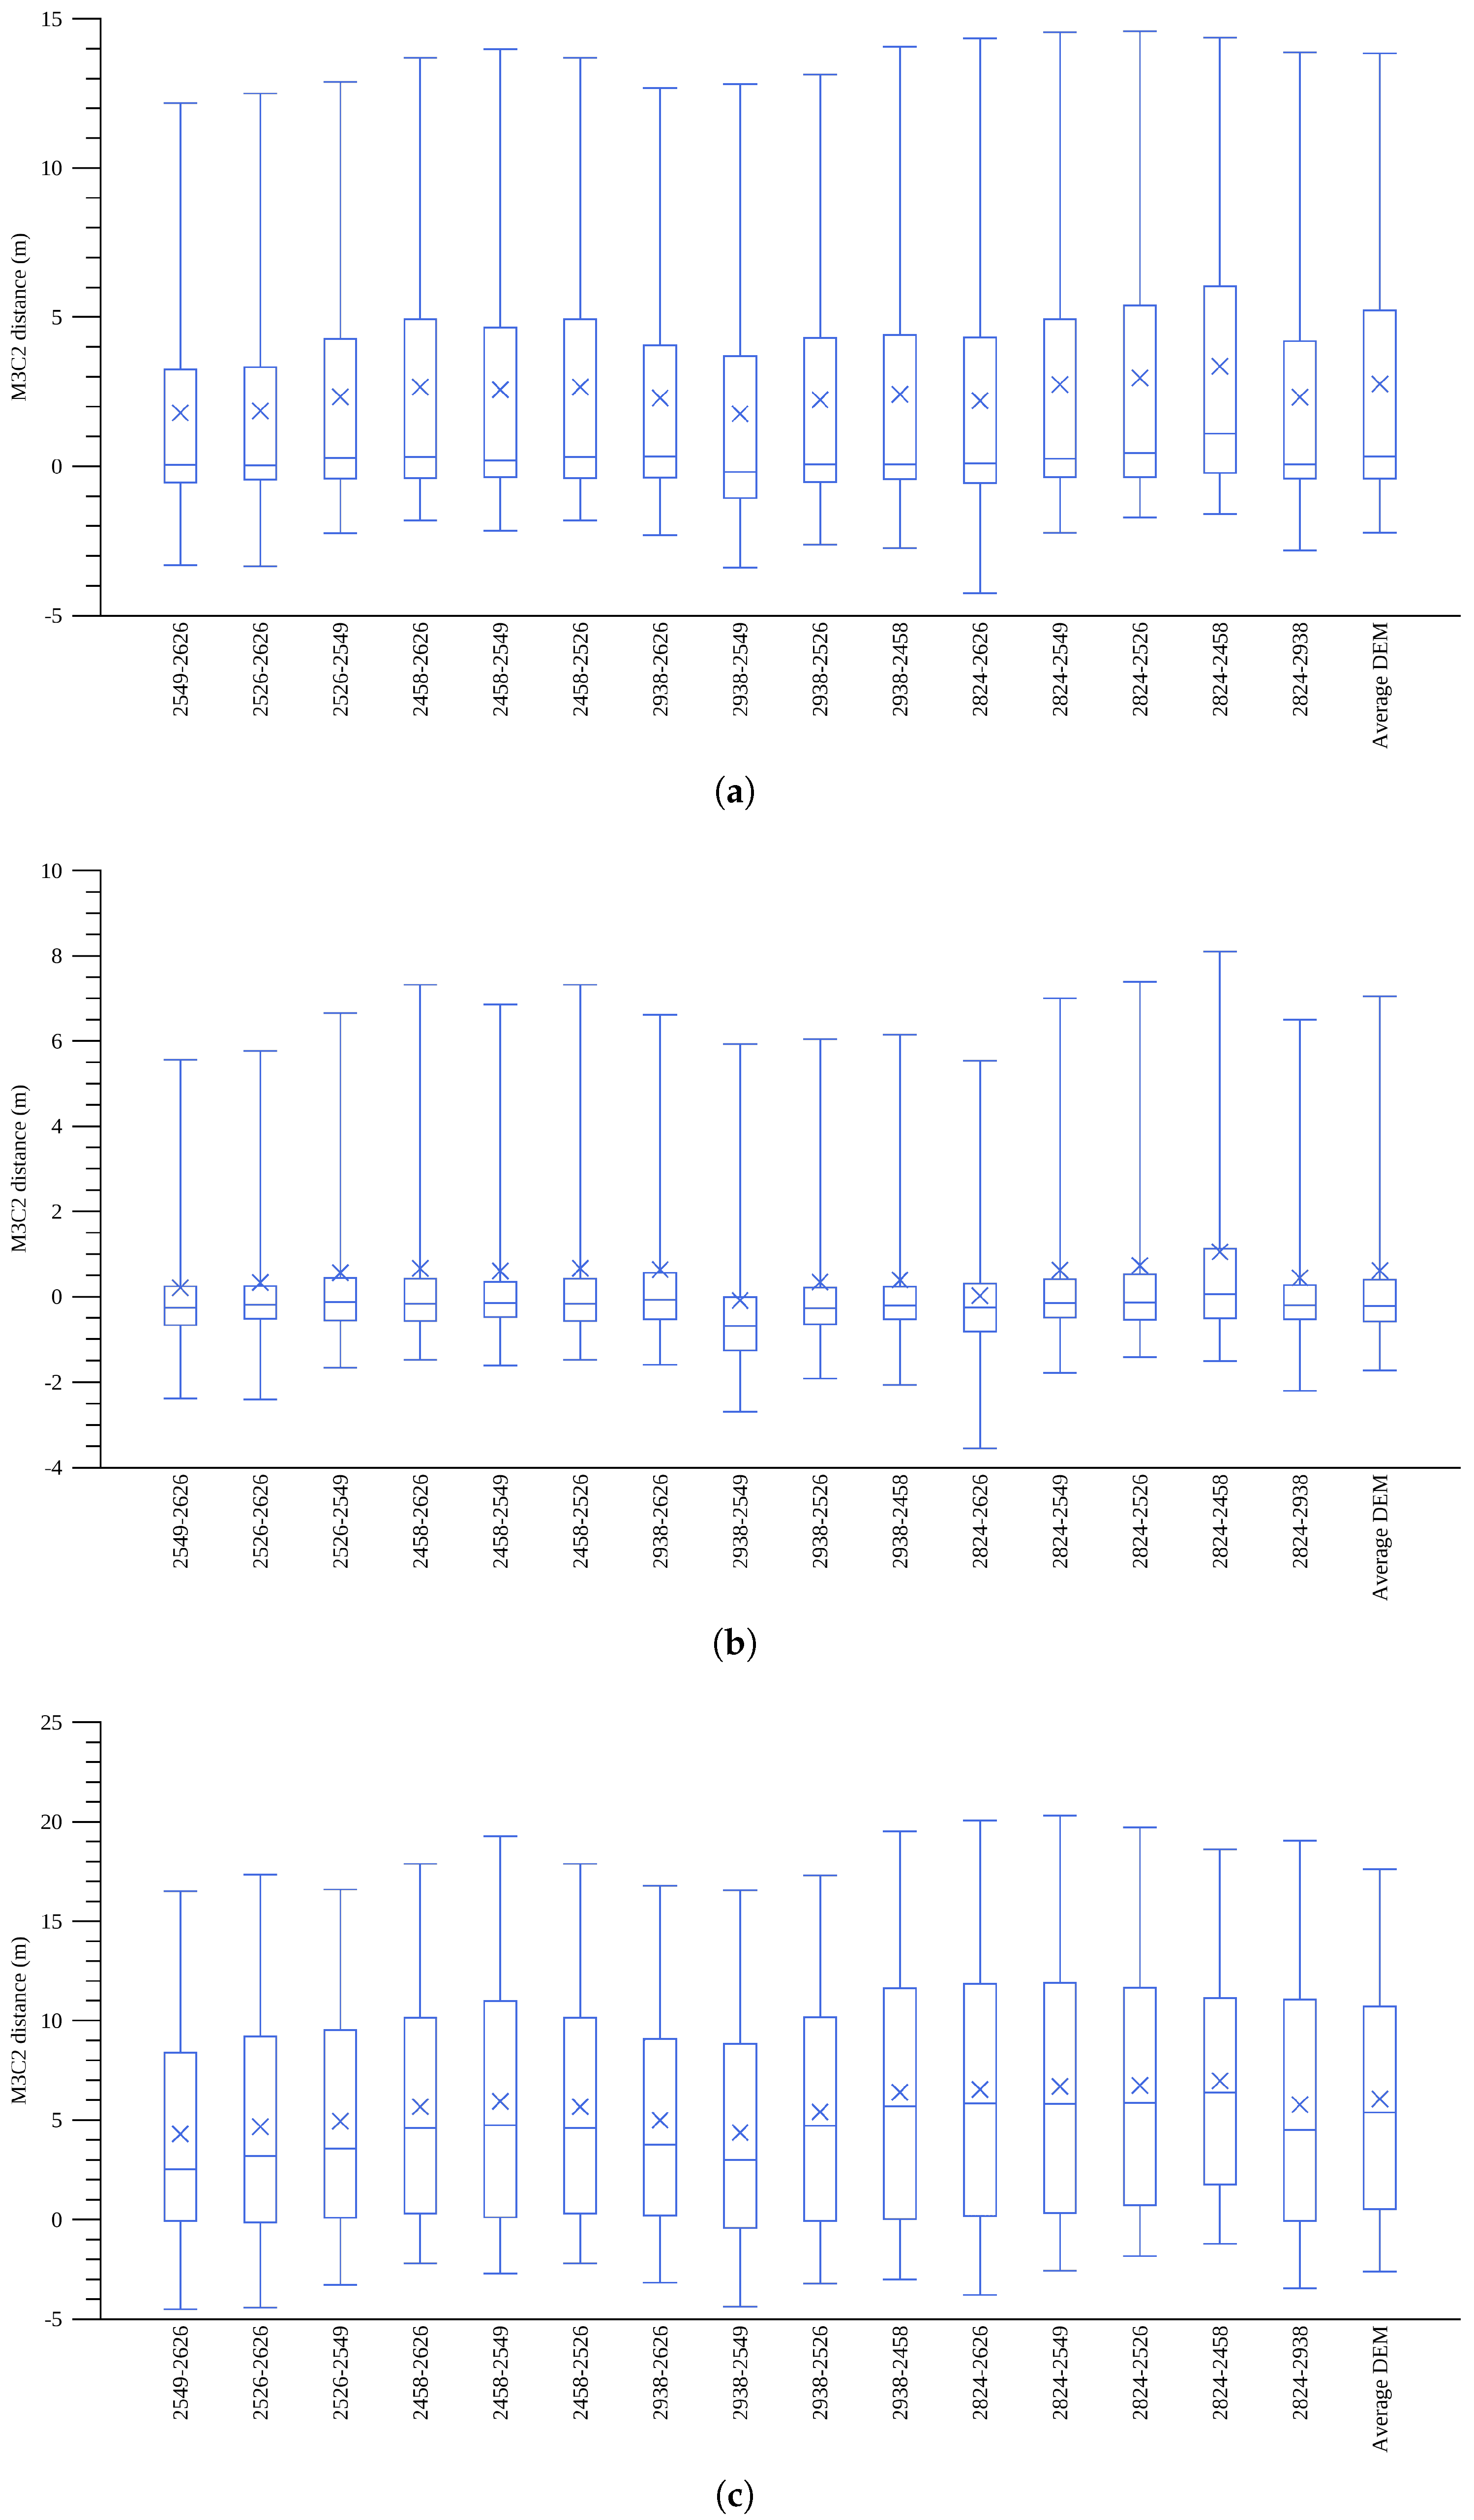
Figure 7. It is evident that the more problematic parts are the streets, where the elevation is always overestimated. This is also the reason for the marked asymmetry of the distributions toward positive values. In order to quantify this phenomenon, separate calculations of M3C2 statistics were computed for building roofs and streets. Results confirm a far better accuracy for roofs (
Figure 8 and
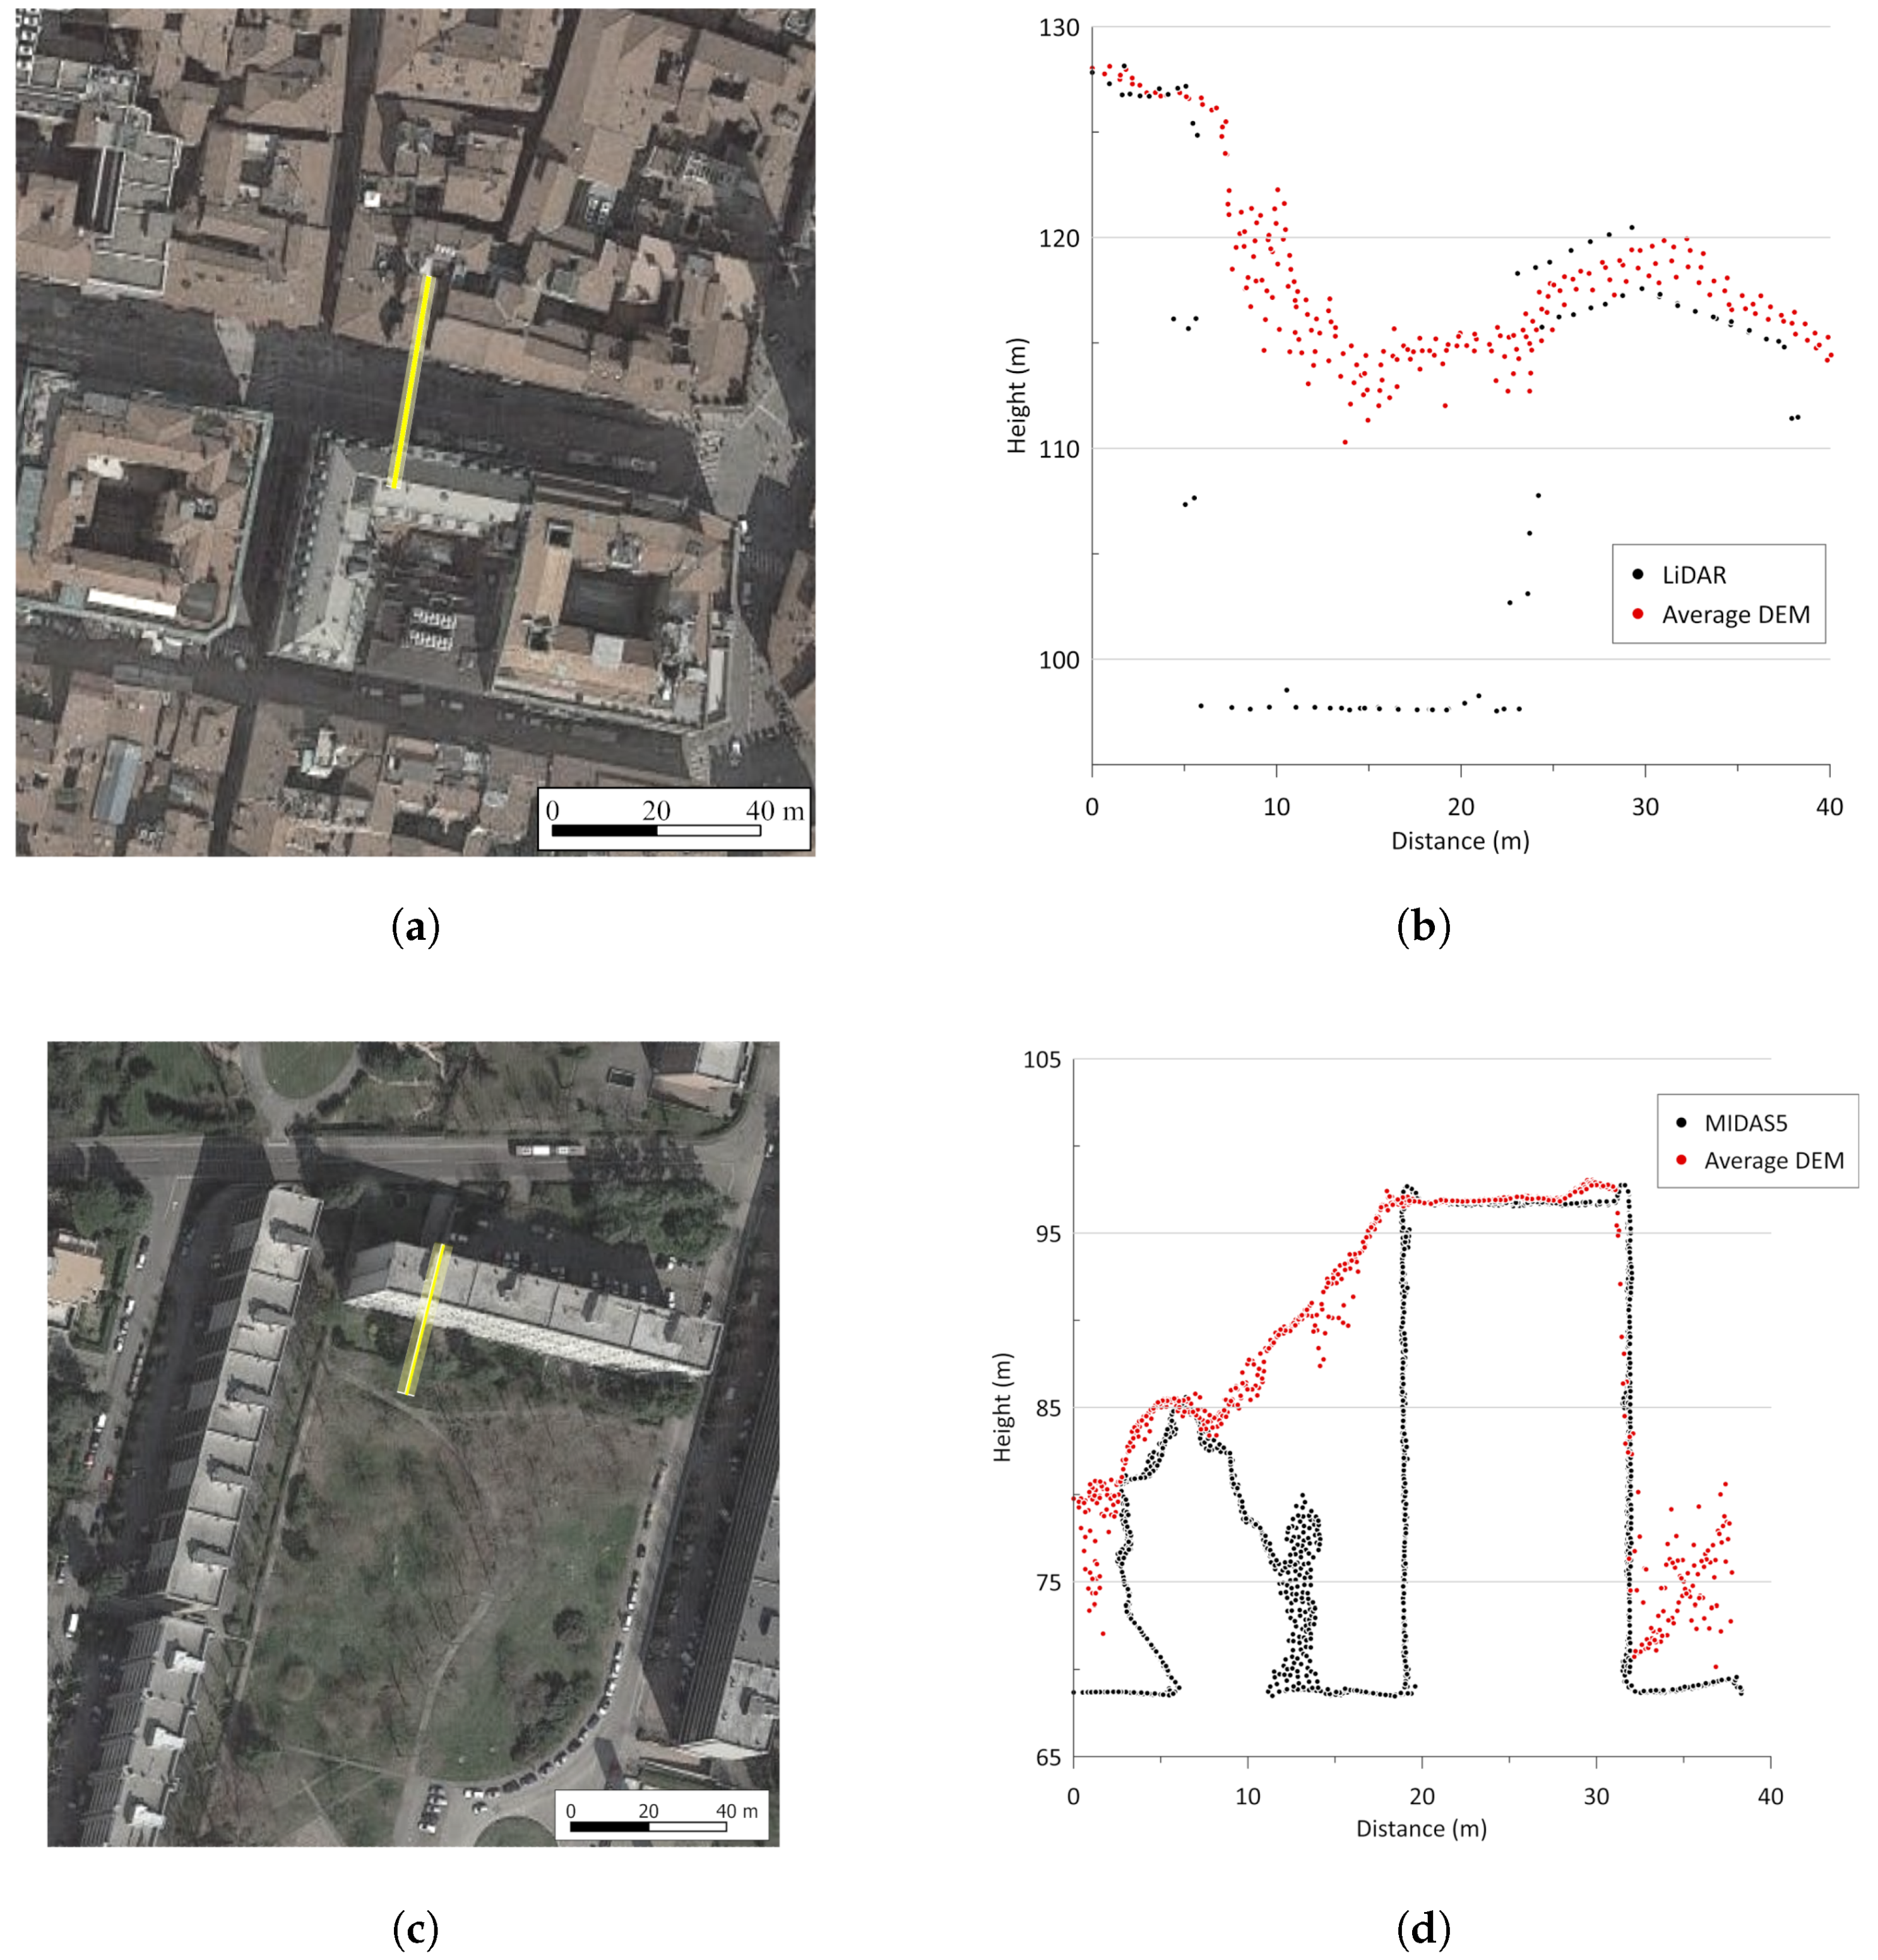
Supplementary Materials), with medians between −0.3 and 0.1 m and interquartile ranges (IQRs) between 0.8 and 1.1 m, compared to roads (medians 2.5–6.4, IQRs 8.4–11.7 m), even though some outliers still influence mean values (maximum M3C2 values for roofs are in the range 33.9–70.9 m, whilst the 95th percentiles are 5.5–8.1 m). A section of the point clouds in correspondence of a street in the city centre is shown in
Figure 9b. The analysis of the profiles makes evident the inability of the generated DEM in describing correctly street shapes and, more generally, vertical façades, resulting in the local overestimation of the ground level. This is particularly apparent in the narrow urban canyon of the city centre and is confirmed also for Fair area, even if less evident, probably because of wider roads and more visible carriageways. In Corticella, this phenomenon is instead not so clear (statistical parameters are similar for roofs and roads) because, on the one hand, buildings are more spaced and the number of exposed façades is higher; on the other hand, frequent height differences between roof parts pose the same reconstruction problems of façades. Here, the biggest differences occur in a buffer zone around buildings because the extracted DEMs are not able to reconstruct the shape of vertical walls (which are instead well defined in the reference model) and tend to connect ground and roof levels with slopes (
Figure 9d). When limiting the analysis to the central portion of the roofs with simpler shapes, the statistics on M3C2 distance tend to conform to the values of the other zones.
The same trends are confirmed in the DEMs generated by the single stereo-pairs, where IQR ranges from 3.8 m to 6.2 m and are again far better for roof surfaces only (
Figure 8). It is to be noticed that some stereo-pairs show slightly better statistics compared to the Average DEM. These particular pairs seem to show an optimal compromise between two opposite needs: framing the objects so that the two images present a good similarity level, which is important for the image-matching algorithm, and a not too short baseline, which influences, as known, the standard deviation of the Z-coordinate for the extracted points. For example, the 2824–2458 pair has a convergence angle of 8.6 degrees and a median on the M3C2 of 1.09 m, while the 2938–2549 pair has a convergence of 10.8 and a median of −0.19. Nevertheless, the IQRs are similar and dominated by errors on roads, which are always present to a certain extent because, as can be seen in
Figure 2, none of the images is well aligned with the most frequent directions of roads in the study area. Overall, significant correlations between medians, IQRs and the angles describing the acquisition scheme were not found (R
2 coefficients are reported in
Table 4). This is in contrast with the findings of other authors who reconstructed areas with different land covers [
25], probably because, in urban environments, statistics are dominated by local matching errors.
The availability of more than one stereo-couple appears important in terms of completeness (which is one of the major concerns in urban areas) and in order to detect outliers in the final products (which remain often undetected in the analysis of the matching score provided by the adopted photogrammetric software).
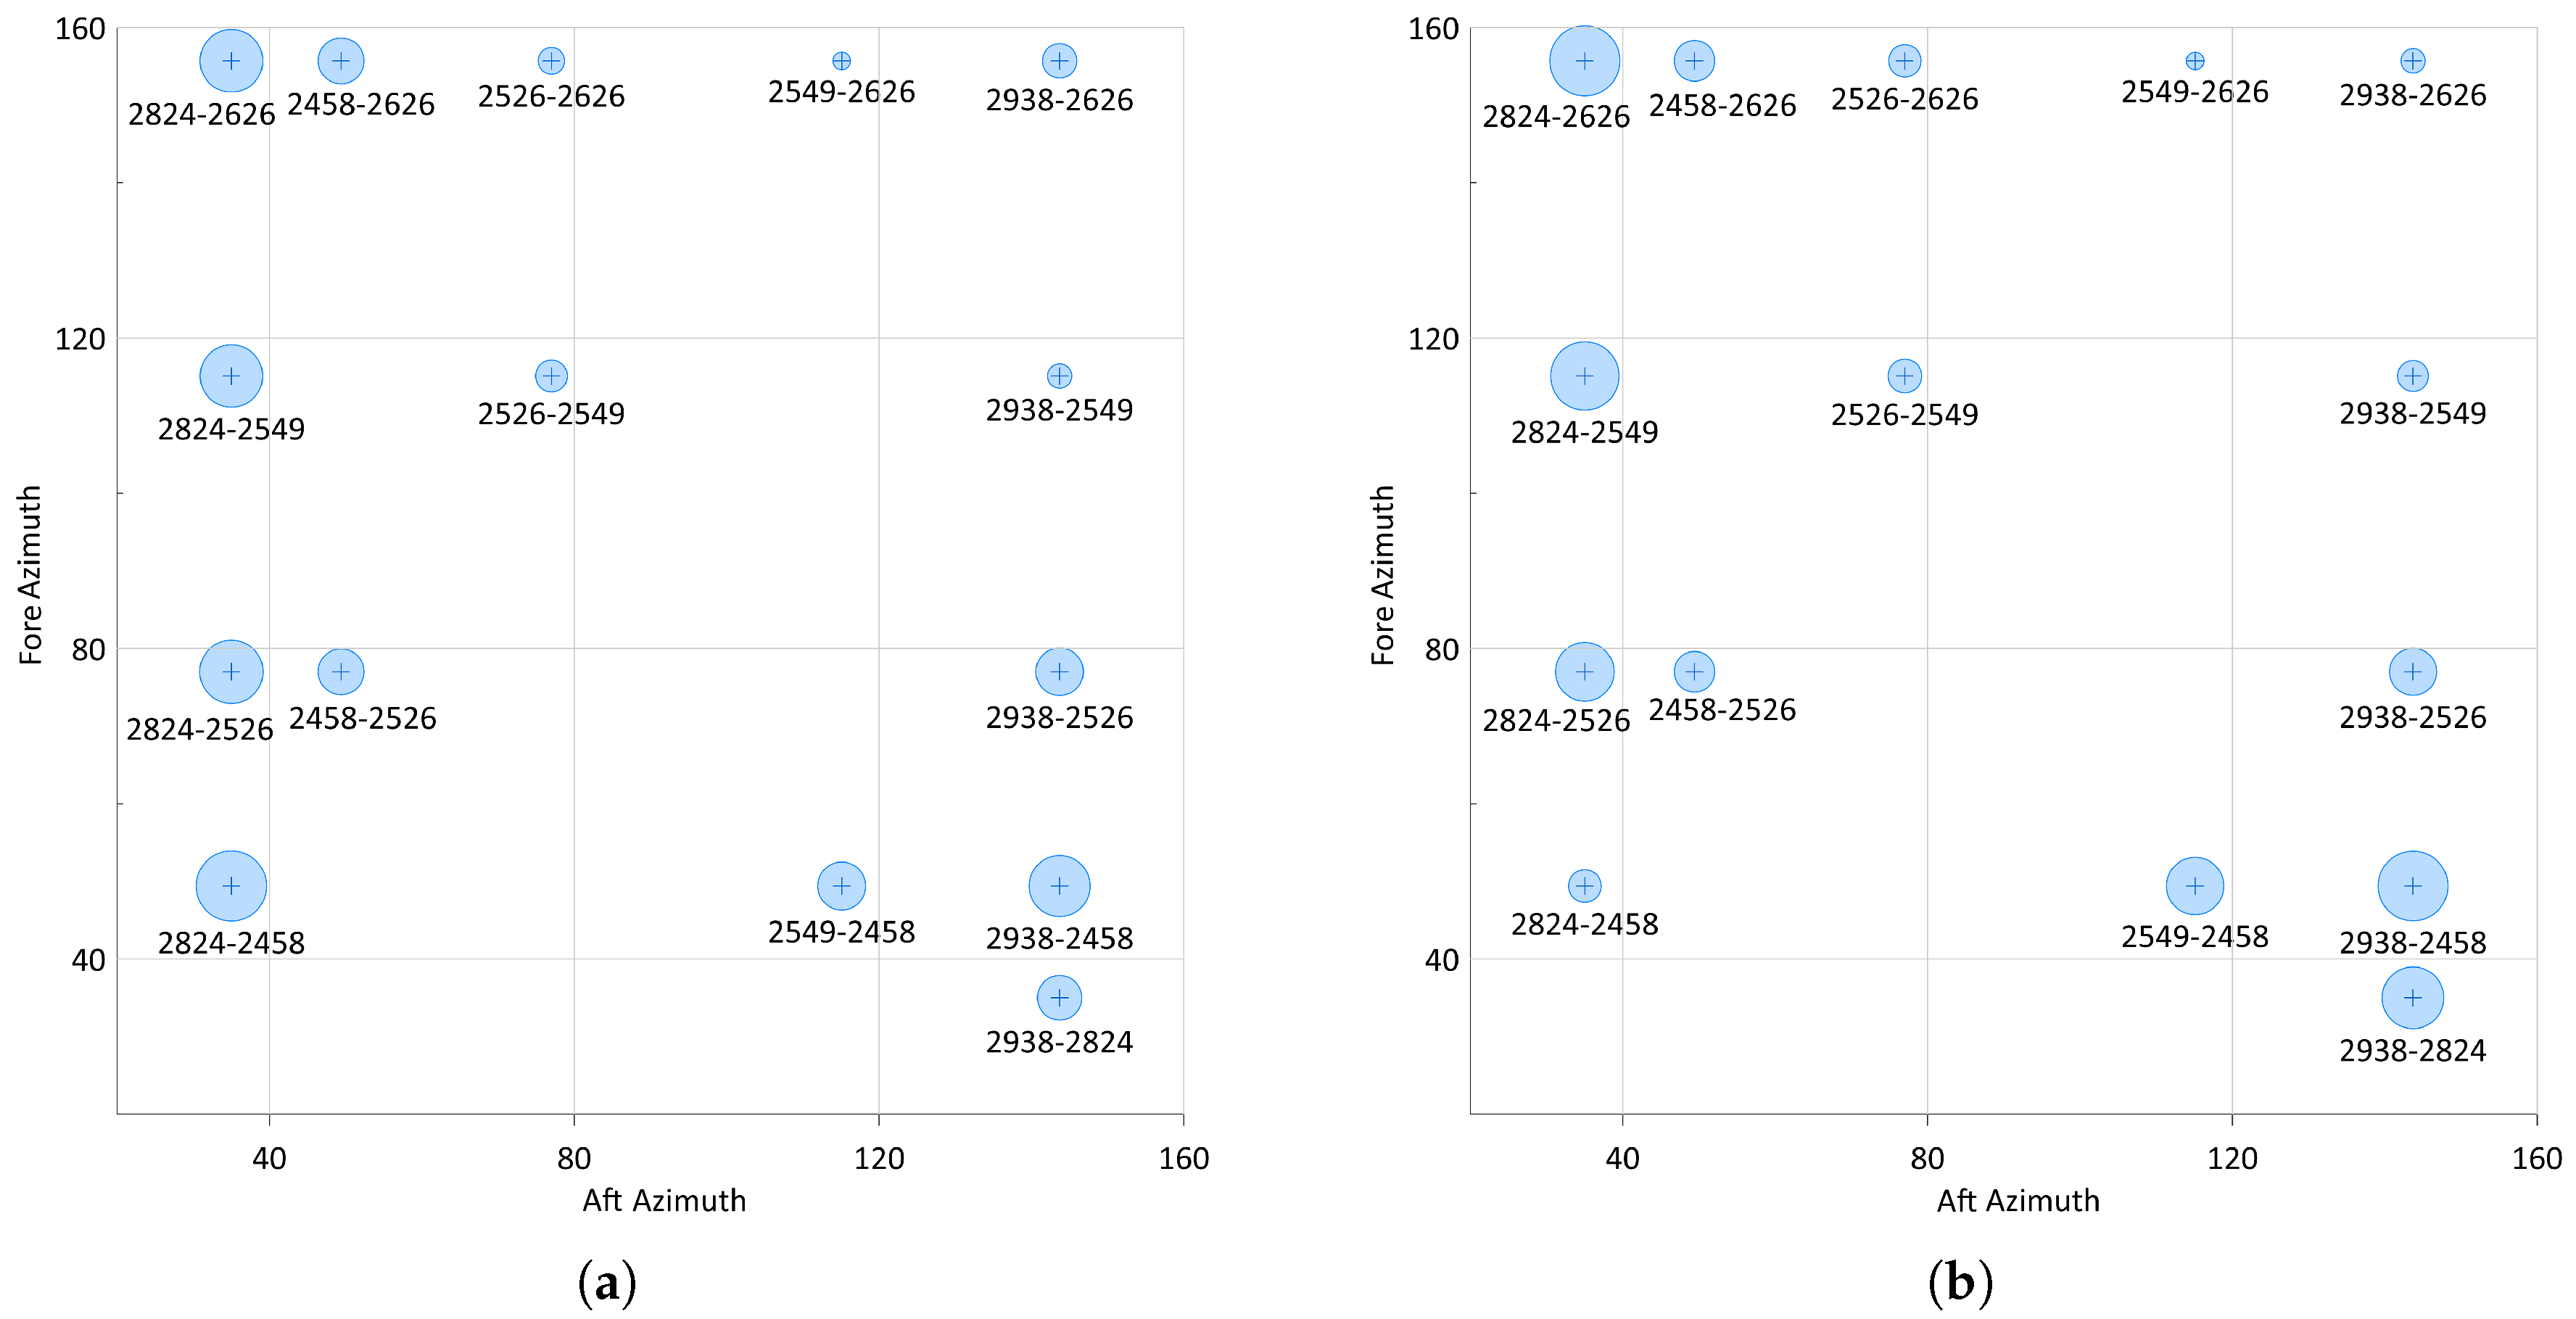
Considering the relationships between accuracy and the satellite azimuth of the acquisitions, it can be noted that the best results (median and IQR of the M3C2 distance,
Figure 10) are obtained with pairs including image 2549 (2549–2626, 2938–2549, 2526–2549), whose azimuth is 115 degrees and is the closest to the most frequent road directions (
Figure 2b). In addition, 2526–2626 presents similar results for M3C2 distance, but the completeness is lower (68% versus 78–89%). Nevertheless, a clear trend cannot be inferred in this case study, probably because a direct comparison of the pairs only in terms of azimuth is not fully explanatory due to the simultaneous variation of all the other acquisition geometry parameters.
All in all, the results of the experimentations suggest that elevation models from WV3 are sufficiently reliable for applications where the overall elevation of urban features is more important than the reconstruction of the exact shape (such as orthorectifying high-resolution multispectral images or enriching the information content of municipal technical cartographies about buildings [
26]). On the other hand, WV3 models do not meet the quality requirements for more detailed 3D modelling of cities (targeted, for example, at the compilation of 3D cadastres or the development of emergency response plans [
27]).
5. Conclusions
The experiments carried out highlighted potentials and limitations of the automatic generation, in an ordinary productive scenario, of digital elevation models in urban areas from WV3 images, which offer nowadays the highest spatial resolution among the commercially available sensors with stereo capabilities.
The weak acquisition geometry is the main limiting factor for an accurate description of the urban texture. With a single stereo-pair, the achievable completeness varies between 50% and 90%. Better results can be obtained using more than one couple (using three images the average completeness doubles, with six images reaches 99%), even though the costs of this imagery can be a constraint. A clear negative correlation (R2 up to 97%) with the convergence angle is observed where building density is high, thus pairs with smaller convergence angles (in the range 8–16 degrees) perform better. This apparent anomaly can be explained considering the nature of the matching process, which can be completely hampered by excessive changes in the perspective view of buildings. For this reason, the acquisition of two single images can sometimes provide better results, compared to the acquisition of a standard stereo-pair product, because this product usually provides higher convergence angles (32–47 degrees in the presented dataset).
The accuracy analyses, separately performed on different components of the urban textures, highlighted an average difference between WV3 models and reference ones of about 0.6 m with a standard deviation of about 3 m on roof surfaces. However, strong biases were observed on roads and adjacent to building façades (mean difference 6.0 m, standard deviation 6.7 m).
As a final consideration, for applications where the overall elevation of urban features is more important than the precise reconstruction of the shape, the quality of the DEMs from WorldView-3 images can be considered adequate. Nevertheless, in urban areas, the accuracy is still not competitive with the one achievable with other techniques, such as LiDAR, especially when considering the capability of reconstructing vertical surfaces. Better results will perhaps be achievable when experimental algorithms proposed in the scientific literature will be implemented in the production workflow.


