Article

A New Integrated Vegetation Index for the Estimation of Winter Wheat Leaf Chlorophyll Content

1
Aerospace Information Research Institute, Chinese Academy of Sciences, Beijing 100094, China
2
University of Chinese Academy of Sciences, Beijing 100049, China
3
Key Laboratory of Earth Observation, Sanya 572029, Hainan Province, China
4
Bureau of Science & Technology for Development, Chinese Academy of Sciences, Beijing 100864, China
5
Beijing Research Center for Information Technology in Agriculture, Beijing Academy of Agriculture and Forestry Sciences, Beijing 100097, China
6
College of Life Information Science and Instrument Engineering, Hangzhou Dianzi University, Hangzhou 310018, China
*
Author to whom correspondence should be addressed.
Remote Sens. 2019, 11(8), 974; https://doi.org/10.3390/rs11080974
Submission received: 28 March 2019 / Revised: 19 April 2019 / Accepted: 20 April 2019 / Published: 23 April 2019
(This article belongs to the Special Issue Remote Sensing for Precision Nitrogen Management)

Abstract

:
Leaf chlorophyll content (LCC) provides valuable information about the nutrition and photosynthesis statuses of crops. Vegetation index-based methods have been widely used in crop management studies for the non-destructive estimation of LCC using remote sensing technology. However, many published vegetation indices are sensitive to crop canopy structure, especially the leaf area index (LAI), when crop canopy spectra are used. Herein, to address this issue, we propose four new spectral indices (The red-edge-chlorophyll absorption index (RECAI), the red-edge-chlorophyll absorption index/optimized soil-adjusted vegetation index (RECAI/OSAVI), the red-edge-chlorophyll absorption index/ the triangular vegetation index (RECAI/TVI), and the red-edge-chlorophyll absorption index/the modified triangular vegetation index(RECAI/MTVI2)) and evaluate their performance for LCC retrieval by comparing their results with those of eight published spectral indices that are commonly used to estimate LCC. A total of 456 winter wheat canopy spectral data corresponding to physiological parameters in a wide range of species, growth stages, stress treatments, and growing seasons were collected. Five regression models (linear, power, exponential, polynomial, and logarithmic) were built to estimate LCC in this study. The results indicated that the newly proposed integrated RECAI/TVI exhibited the highest LCC predictive accuracy among all indices, where R2 values increased by more than 13.09% and RMSE values reduced by more than 6.22%. While this index exhibited the best association with LCC (0.708** ≤ r ≤ 0.819**) among all indices, RECAI/TVI exhibited no significant relationship with LAI (0.029 ≤ r ≤ 0.167), making it largely insensitive to LAI changes. In terms of the effects of different field management measures, the LCC predictive accuracy by RECAI/TVI can be influenced by erective winter wheat varieties, low N fertilizer application density, no water application, and early sowing dates. In general, the newly developed integrated RECAI/TVI was sensitive to winter wheat LCC with a reduction in the influence of LAI. This index has strong potential for monitoring winter wheat nitrogen status and precision nitrogen management. However, further studies are required to test this index with more diverse datasets and different crops.

1. Introduction

As winter wheat is one of the most important food crops in China, the timely and accurate monitoring of the growth and nutrition of this crop contributes to proper field management. The leaf chlorophyll content (LCC), which includes the contents of chlorophyll a and chlorophyll b, can provide crucial information for understanding vegetation stress [1,2], physiological status, and photosynthesis potential [3,4]. In addition, LCC is strongly related to the N content [5,6,7,8] and can be used as a close proxy for the N concentration at the leaf level [9,10]. The traditional measurement approach in the laboratory is relatively time- and labor-consuming, making it difficult to meet the practical demands of precise crop management in large fields. With the development of remote sensing techniques, remotely sensed data have been widely used to accurately and non-destructively monitor crop chlorophyll contents [2,11,12].
Currently, the semi-empirical index-based approach is commonly used to estimate crop chlorophyll content. According to the typical spectral absorption characteristics of chlorophyll pigments, red and near-infrared (NIR) spectral bands are primarily used to build chlorophyll content indices [4]. The red-edge spectrum has received much attention for many years for monitoring chlorophyll content, and the red edge has been identified to be more sensitive to chlorophyll contents than the red part of the spectrum [2,13]. The “red edge” refers to the steep part between the chlorophyll absorption valley in the red band and the high reflection shoulder in the NIR band. The importance of the red-edge spectra for estimating chlorophyll content was demonstrated by extensive studies based on the combined PROSPECT leaf optical properties model and SAIL canopy bidirectional reflectance model (PROSAIL)-simulated spectra or ground-measured spectra. Therefore, some red-edge parameters and chlorophyll indices were developed based on the red-edge band(s). Several scholars have developed red-edge parameters, such as the red-edge position, red-edge amplitude, red-edge width, red-edge kurtosis, minimum amplitude, and red-edge amplitude/minimum amplitude, to predict crop chlorophyll contents. Yao et al. [14] analyzed the relationship between the red-edge spectrum features of the winter wheat canopy and leaf chlorophyll content (SPAD) values in different growing periods and noted that the model-based red-edge kurtosis exhibited the highest SPAD predictive accuracy. Liu et al. [15] calculated seven red-edge parameters as inputs for a back-propagation (BP) neural network estimation model and studied the LCCs of Pinus massoniana. Gitelson and Merzlyak [2] proposed that the sensitivity of the normalized difference vegetation index (NDVI) to chlorophyll content can be improved by replacing the reflectance in the red band with the reflectance in the red-edge band at approximately 690–710 nm. Zillmann et al. [16] concluded that the normalized difference red edge (NDRE) index was strongly linearly related to the winter wheat chlorophyll content at the canopy level based on RapidEye images. Based on the strong absorption characteristics of chlorophyll in the red band, Kim et al. [17] built a new chlorophyll absorption ratio index (CARI) to reduce the effect from non-photosynthetic materials by using the ratio of the reflectances at 700 nm and 550 nm. Daughtry et al. [18] proposed the modified chlorophyll absorption ratio index (MCARI) by introducing the R700/R670 ratio to the CARI index to reduce background effects. However, MCARI was still sensitive to background properties. Then, Haboudane et al. [19] introduced the R700–R550 term to MCARI to further reduce the effects from the background and proposed a new index called the transformed chlorophyll absorption in reflectance index (TCARI). Gitelson et al. [20] found that the reciprocal reflectance in the range from 695–705 nm is closely related to LCC and proposed a new index called CIred-edge that obviously improved the accuracy of chlorophyll content prediction. Many scholars have used the CIred-edge index to estimate the chlorophyll contents of different crop species [8,16,21,22]. Based on the band settings of medium resolution imaging spectrometer (MERIS) data, Dash and Curran [23] proposed the medium resolution imaging spectrometer (MERIS) terrestrial chlorophyll index (MTCI), which is strongly related to the red-edge position and has been used to successfully predict vegetation chlorophyll contents at the canopy level. Maire et al. [24] proposed the new double difference (DD) index to estimate tree chlorophyll contents according to the “peak jump” and the multiple-peak features existing on the first derivative of the spectral reflectance. Jin et al. [25] built two new indices, the double-peak canopy nitrogen index I (DCNI I) and the ratio of the plant pigment ratio to the NDVI (PPR/NDVI), to estimate cotton LCCs with high predictive accuracy.
Most vegetation indices have been developed to estimate chlorophyll content at the canopy level. However, research on the estimation of LCCs using a vegetation index approach with crop canopy spectra is relatively limited and unsatisfactory, mainly because crop canopy spectra are affected by not only leaf biochemical parameters and leaf distribution but also crop canopy structure, soil nutrients, atmosphere, and other factors. In addition, red-edge spectra are influenced by both chlorophyll pigments and the leaf area index (LAI) [26,27]. As a result, the precision of leaf-scale chlorophyll content inversions based on crop canopy spectral data is often low. Therefore, the influence of LAI prevents the use of red-edge information as an LCC estimator. An optical chlorophyll index should be both sensitive to chlorophyll content and insensitive to other interference factors [28]. However, uncoupling the interplay of chlorophyll pigments and LAI on spectral reflectance is a challenging issue for the estimation of crop chlorophyll content at the leaf level by remote sensing. Only a few studies have explored this problem using specific crop types. Daughtry et al. [18] used simulated data to demonstrate that the combination of two groups of vegetation indices that minimize background reflectance contributions and strongly respond to leaf chlorophyll concentrations can be used to estimate the leaf chlorophyll concentration at the leaf level with minimal confounding effects from the LAI and soil background. Haboudane et al. [19] proposed that the transformed chlorophyll absorption in the reflectance index/optimized soil-adjusted vegetation index (TCARI/OSAVI) is both very sensitive to LCCs and very resistant to impacts from LAI and solar zenith angle. He also estimated corn LCCs using TCARI/OSAVI and achieved good results. Kooistra and Clevers [29] used TCARI/OSAVI, TCI/OSAVI (the triangular chlorophyll index/ optimized soil-adjusted vegetation index), and CVI (chlorophyll vegetation index) to estimate the LCC in potato crops using RapidEye images, and the best result was obtained using TCARI/OSAVI. Clevers et al. [30] also found that TCARI/OSAVI provided a good linear estimation of the LCC in potato crops using Sentinel-2 images. Cui et al. [31] also found that TCARI/OSAVI was the best index to predict LCC with strong anti-disturbance ability. Crop type had a clear influence on the predictions of LCCs using these combined vegetation indices. Haboudane et al. [32] found that the predictive accuracy of the wheat LCC was obviously lower than that of the corn LCC.
Therefore, the objective of this study was to develop a new approach for LCC estimation for winter wheat based on crop canopy reflectance with minimum sensitivity to LAI and consistent sensitivity to different crop growth conditions. Given this goal, the spectral response characteristics of the red-edge region of chlorophyll pigments were fully considered for creating the new chlorophyll indices. The sensitivity of the newly proposed indices to LCC and the insensitivity to LAI were analyzed using a large amount of field data. Finally, the consistent performance of the best spectral index on the estimation of LCC under various field management strategies (winter wheat variety, quantity of N fertilizer, quantity of water applied, sowing date) was evaluated.

2. Materials and Methods

2.1. Experimental Site and Experimental Design

The field experiments were performed at the National Experimental Station for Precision Agriculture, Changping District of Beijing, China (40°10.6′N, 116°26.3′E). The site has a temperate climate, with an average annual precipitation of 507.7 mm and a mean annual temperature of 13.8 °C. The field soil is silty clay loam. Winter wheat (Triticum aestivum L.) was planted at this site in the 2001–2002 and 2009–2010 growing seasons. To obtain a wide range of LCCs, various field treatments were implemented for these experiments.
In the 2001–2002 campaign, the study site was divided into 48 small plots, each of which was 32.4 m × 30 m, separated by a 1-m wide isolation strip from adjacent plots. Winter wheat was planted on 26–27 September 2001, and four N fertilization densities (0, 150, 300, and 450 kg ha−1), four water treatment plans (0, 225, 450, and 675 m3 ha−1), and three winter wheat varieties (Zhongyou 9507, Jing 9428, and Jingdong 8) were used in these experiments. Table 1 shows the descriptions of the experimental designs. Zhongyou 9507 and Jing 9428 are horizontal varieties, and Jingdong 8 is an erective variety. For all plots, one-third of the total N fertilization was applied pre-planting, one-third was applied at the tillering stage (Zadoks scale 20, Z20), and the remainder was applied at the stem elongation stage (Z30). Half of the water was applied at the tillering stage (Z20), and the remainder was applied at the elongation stage (Z30). The wheat LAI, LCC, and canopy spectra were measured at tillering (Z25), stem elongation (Z31 and Z34), booting (Z41), head emergence (Z54), and pollination (Z68), and the crop was harvested on 20 June 2002. This procedure produced a total of 288 samples for the 2002 campaign.
In the 2009–2010 campaign, winter wheat was planted in 36 plots (a total area of 5040 m2). This campaign used three winter wheat cultivars (Nongda 195, Jing 9428, and Jingdong 13), four N fertilization densities (56, 82, 109, and 135 kg ha−1), and three sowing dates (25 September and 5 and 15 October). Table 2 shows the descriptions of the experimental design. Nongda 195 and Jing 9418 are horizontal varieties, and Jingdong 13 is an erective variety. The nitrogen fertilizer was applied twice, with the first application on 23 September (56 kg ha−1 for each plot) and the second application on 21 April (0, 26, 53, and 79 kg ha−1) for the sowing treatment on 25 September, and one N fertilizer level (53 kg ha−1) was applied for the sowing treatments on 5 and 15 October. The seeding rates were 152, 217, and 279 kg ha−1 for the sowing dates of 25 September and 5 and 15 October, respectively. The other field management measures were consistent with conventional management by farmers. The wheat LAI, LCC, and canopy reflectance spectra were measured at stem elongation (Z36), booting (Z41), flowering (Z65), and milk (Z73 and Z75). Although winter wheat was planted on different dates, there were no major differences in development stages between the different treatments, especially after the head emergence stage. The winter wheat was harvested on 23 June 2010, and a total of 168 samples were produced for the 2010 campaign.

2.2. Field Measurements

2.2.1. Measurement of the Reflectance Spectrum from the Winter Wheat Canopy

During the 2002 and 2010 growing seasons, a 1-m2 area of winter wheat was selected for canopy reflectance measurements using a portable field spectroradiometer (FieldSpec-FR2500, ASD, USA) with a spectral range from 350 to 2500 nm and spectral resolutions of 3 nm from 350 to 1050 nm and 10 nm from 1050 to 2500 nm. To ensure accurate measurements, the canopy spectral data were acquired under clear, blue skies between 10:00 and 14:00 h (Beijing Local Time) at a height of 1.3 m above the wheat canopy with a field of view of 25° to maintain the same viewing geometry. A total of 20 measurements were collected in each plot, and the average spectrum was retained as the spectrum for the plot. The measured radiance was converted into absolute reflectance using a calibration from a white Spectralon® (Labsphere, Inc., North Sutton, NH, USA) reference panel, as follows:
R target = DN target DN reference × R reference
where Rtarget is the spectral reflectance of the winter wheat canopy, DNtarget and DNreference are the radiances of the winter wheat canopy and the white reference panel, respectively, and Rreference is the reflectance of the white reference panel.

2.2.2. Measurement of Plant Parameters

After acquiring the canopy spectra, all plants in four 1-m long rows per plot (with a row spacing of 25 cm) were harvested on each investigation date, placed in a plastic bag and transported to the laboratory for measurement of LCC and green LAI.
The LCC was measured in the laboratory using standard procedures [33]. First, fresh winter wheat leaf samples from a certain area in each plot were mixed with a given volume of 80% alcohol solution. Each sample was placed in a cuvette and stored in the dark at 25 °C for 48 h. Next, the absorbance of pigments at 663 and 646 nm was measured using an L6 ultraviolet-visible spectrophotometer (INESA, China). The concentrations of chlorophyll a and chlorophyll b were calculated using
Chl a ( mg   L 1 ) = 12.21 × A 663 2.81 × A 646
C h l b ( m g   L 1 ) = 20.13 × A 646 5.03 × A 663
C h l a + b ( m g   L 1 ) = C h l a ( m g   L 1 ) + C h l b ( m g   L 1 )
C h l a + b ( m g   g 1 ) = [ C h l a + b ( m g   L 1 ) × V T ( m l ) ] [ W ( g ) × 1000 ]
where Chla and Chlb are the chlorophyll a and chlorophyll b concentrations (mg L−1), A663 and A646 are the absorbances of the extract solution at 663 and 646 nm, Chla+b is the chlorophyll a + b content per unit leaf weight (mg g−1), VT is the volume in mL of leaf chlorophyll extract solution, and W is the leaf weight (g).
The green LAI was measured using the dried-weight method [34]. In each plot, all green leaves from the samples were separated from the stems. Thirty leaves were randomly selected from all the green leaves to ensure that all ages and sizes of leaves were included. Then, a leaf segment of approximately 1 cm2 was cut from the middle parts of the thirty leaves, and these leaf segments served as reference leaves. All green leaves, including the reference leaves, were oven dried at 70 °C to a constant weight. The reference leaves and the remaining leaves were weighed. The relationship between fresh leaf area and leaf dry weight for the reference leaves was used to convert the dry weight of all green leaves into fresh leaf area. The green LAI was calculated using
LAI = S r W t S l W r
where Sr (m2) is the area of the fresh reference leaves, Wt (g) is the total dry weight of all green leaves, Sl (m2) is the sampled land area, and Wr (g) is the dry weight of the reference leaves.
The statistical analyses of the measured winter wheat LCC and LAI for the 2001–2002 and 2009–2010 datasets are shown in Table 3. For the 2002 dataset, the mean values of LCC and LAI are 3.102 and 2.311, respectively, and both LCC and LAI have moderate levels of variation. For the 2010 dataset, the mean values of LCC and LAI are 2.913 and 2.069, respectively, and both LCC and LAI also have moderate levels of variation.

2.3. Spectral Indices

2.3.1. New Spectral Index

The spectral characteristics of green vegetation at the canopy level with different LCCs, which were simulated by the combined PROSPECT + SAIL model (teledetection.ipgp.jussieu.fr/prosail/) via MATLAB R2015a software (MathWorks, Inc., Natick, MA, USA), are shown in Figure 1. To investigate the effect of chlorophyll content on canopy spectral reflectance, LCC was set to change from 10 to 70 μg cm−2 with a step of 10 μg cm−2, LAI was fixed to a value of 3, carotenoid content was 8, cbrown content was 0, equivalent water thickness (Cw) was 0.0015 cm, dry matter content (Cm) was 0.0035 g cm−2, and the leaf structure parameter (N) was 1.41. These input parameters were fixed with reasonable values based on field measurements and previous studies [35,36]. As shown in Figure 1, chlorophyll pigments mainly affect the visible spectral range; when LCC increases, the reflectance in the green, red, and red-edge bands decreases gradually. The reflectance in the NIR bands approaches an approximately constant value. Based on this phenomenon, we tried to construct a new spectral index that is thought of as a ratio of the difference between the reflectance in the NIR band and that in the red-edge band to the reflectance in the green band (chlorophyll absorption minimum). This ratio form can effectively enhance the spectral difference between different LCC levels. The higher the LCC is, the larger the value of the new index.
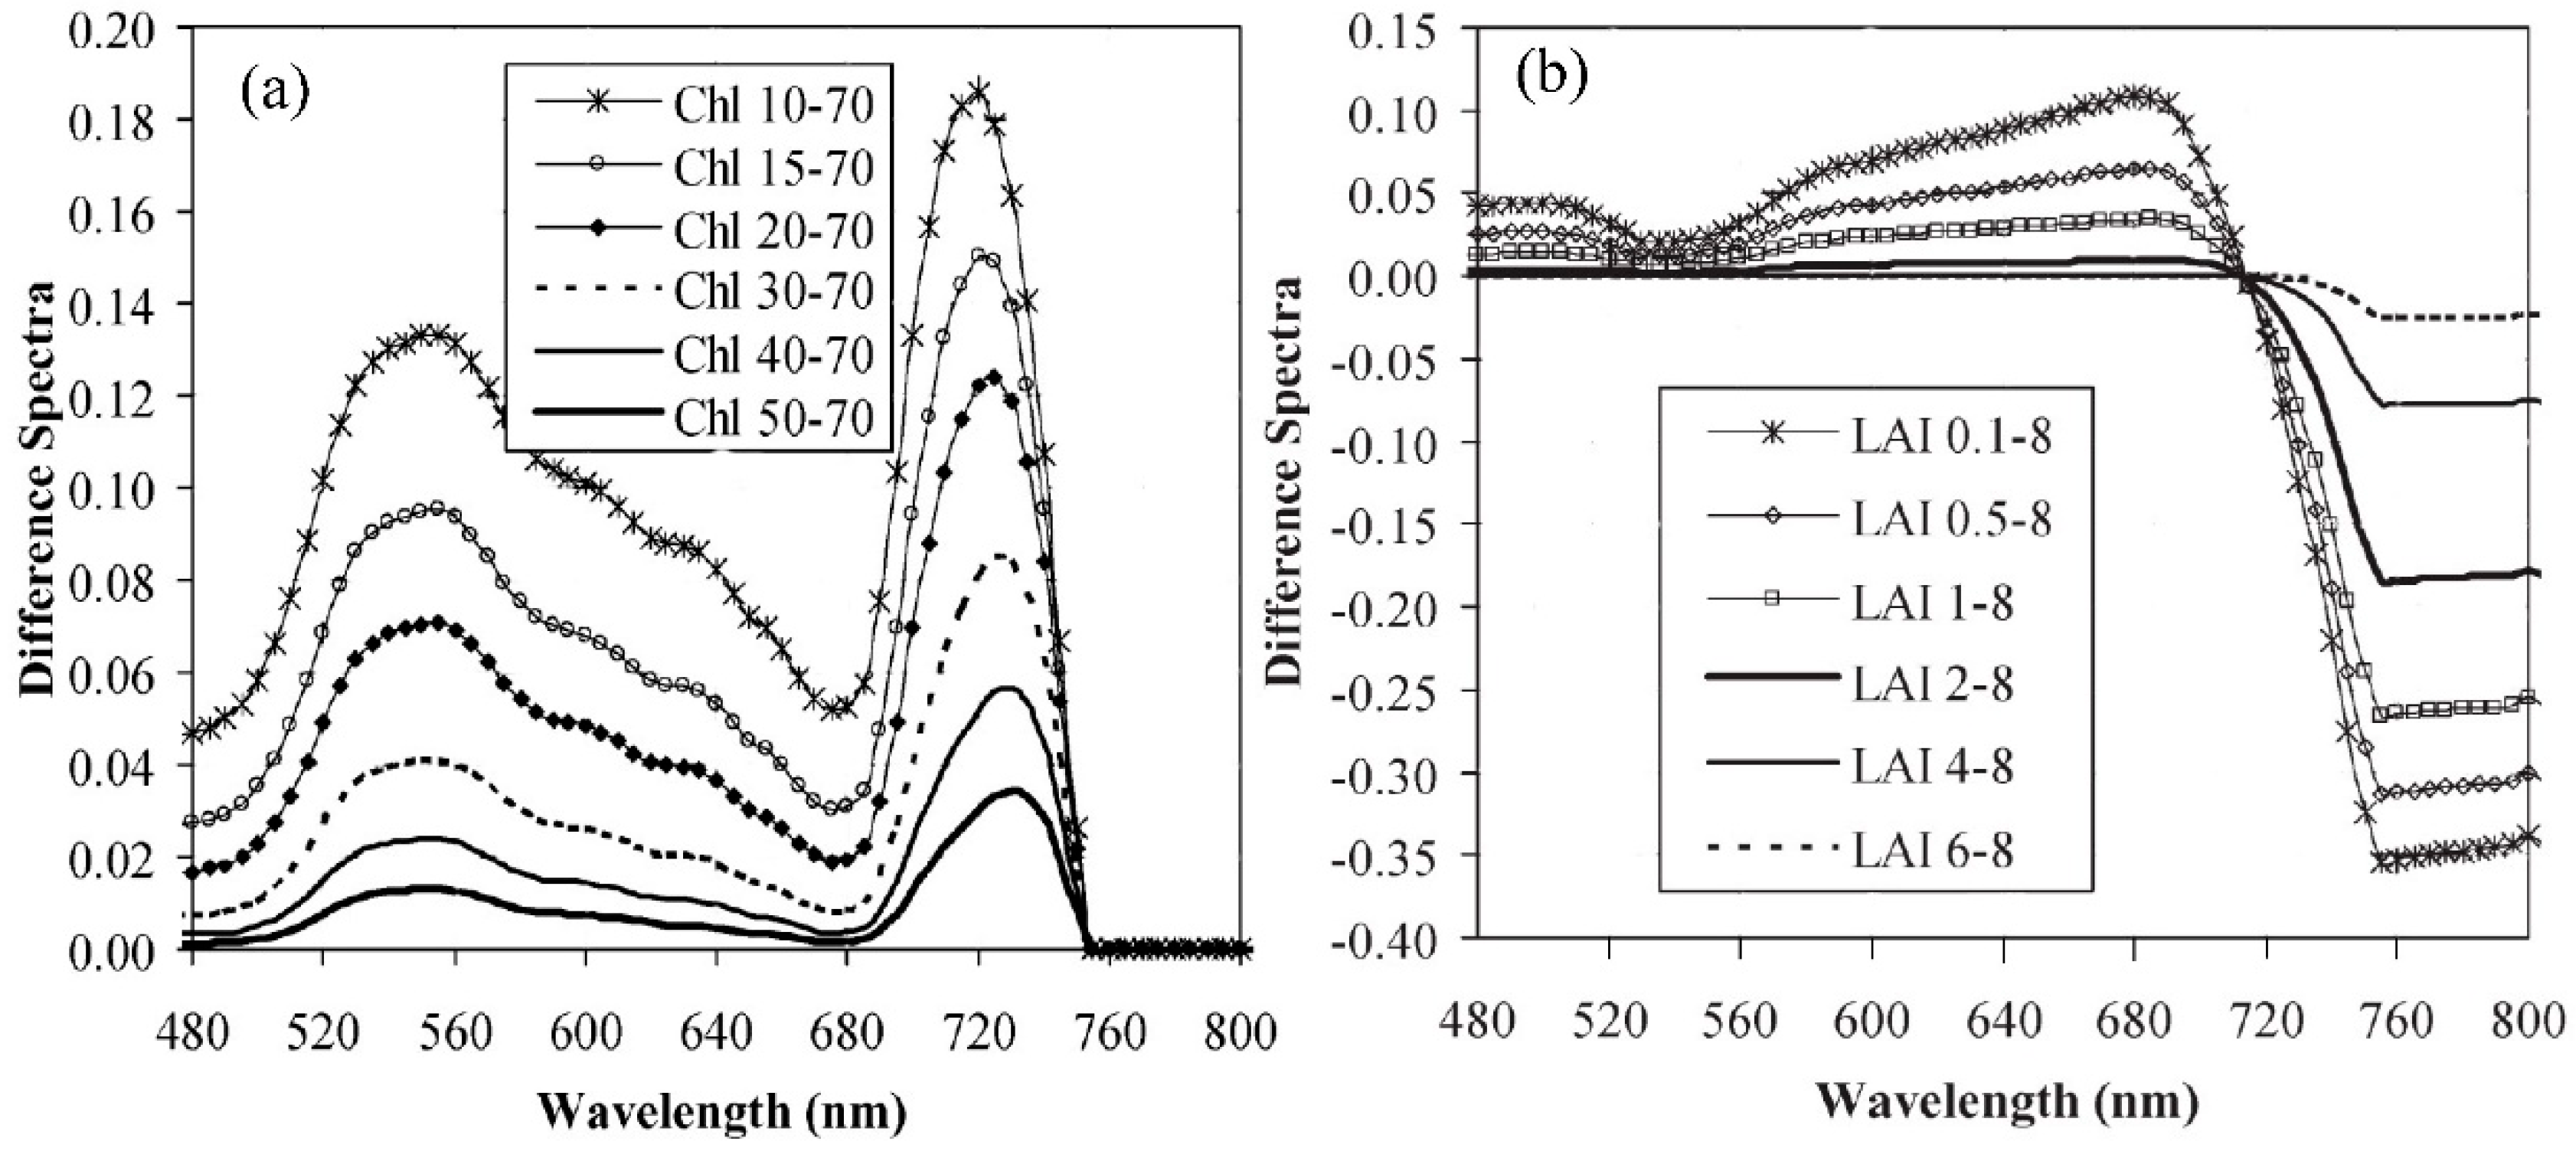
Previous studies also demonstrated that the combined effects of chlorophyll concentration and LAI variation strongly influence the abrupt changes affecting the vegetation reflectance in the red-edge region, as shown in Figure 2, which uses spectra simulated by the SAIL radiative transfer model [32]. According to Figure 2, the wavelength regions that are most sensitive to leaf chlorophyll variability are centered at 550 nm in the green peak and 720 nm in the red edge. In contrast, the LAI generates weak variations in the reflectance spectrum at 550 and 720 nm. The reflectance in the NIR region does not vary with LCC. Therefore, we selected the bands at 550 nm (green band), 720 nm (red-edge band), and 800 nm (NIR band) to build the new spectral index. Moreover, Kim [17] showed that the ratio of reflectance at 700 nm and 550 nm (the bands corresponding to the minimum absorption of the photosynthetic pigments) is closely influenced by non-photosynthetic materials in the canopy. Therefore, this ratio was introduced to the new spectral index to reduce the effects of non-photosynthetic materials in the remote estimates of LCC. Finally, a new spectral index called the red-edge-chlorophyll absorption index (RECAI) is defined as follows:
( R 800 R 720 ) / R 550 × ( R 700 / R 550 )
Due to the effect of LAI on LCC estimates, we developed three other integrated indices in this study: RECAI/OSAVI, RECAI/TVI, and RECAI/MTVI2 (see Table 4). These indices are based on previously published methods that take the ratio of two VIs: one is sensitive to the canopy chlorophyll content, and the other is sensitive to LAI [18,19,29,30,32]. The optimized soil-adjusted vegetation index (OSAVI) [37], the triangular vegetation index (TVI) [38], and the modified TVI (MTVI2) [39] are confirmed to be sensitive to LAI and were used to build integrated indices with chlorophyll-related indices effective for estimating LCC. Such ratios can minimize the influence of LAI and maximize the sensitivity to LCC. Because the value of RECAI/TVI is very small, it is scaled up by two orders of magnitude in practical calculations. OSAVI, TVI, and MTVI2 are calculated as follows:
OSAVI   =   1.16 ( R 800     R 670 ) / ( R 800   +   R 670   +   0.16 )
TVI   =   0.5 [ 120 ( R 750     R 550 )     200 ( R 670     R 550 ) ]
MTVI 2   =   1.5 [ 1.2 ( R 800     R 550 )     2.5 ( R 670     R 550 ) ] ( 2 R 800   +   1 ) 2     ( 6 R 800     5 R 670 )     0.5

2.3.2. Spectral Indices in this Study

For the present study, we selected eight spectral indices from the literature to evaluate their capacity and consistency in estimating chlorophyll content. The details of these indices are provided in Table 4. The eight published chlorophyll-related VIs based on discrete red-edge and green bands (chlorophyll absorption minimum) and/or the red band (chlorophyll absorption maximum) have been confirmed to be closely related to LCC [24,40,41,42,43,44].

2.4. Analysis Method and Software

For this work, the measured dataset was used to estimate LCC through a semi-empirical vegetation index approach. The dataset was divided randomly into two subsets: 80% as the training dataset (365 samples) and 20% as the validation dataset (91 samples). Five regression models (linear, power, exponential, polynomial, and logarithmic) were used to model the relationships between LCC and different spectral indices. The coefficient of determination (R2) and the root mean square error (RMSE) were selected as the accuracy indicators of the statistical models. The details of the R2 and RMSE indicators are available in Richter [45]. The conventional statistical analysis of various parameters was performed using SPSS 18.0 software (SPSS Inc., Chicago, IL). The regression models were established, and the validation procedures were performed using MATLAB R2015a software (The Math Works, Inc., Natick, MA, USA).

3. Results

3.1. Prediction LCC by VIs

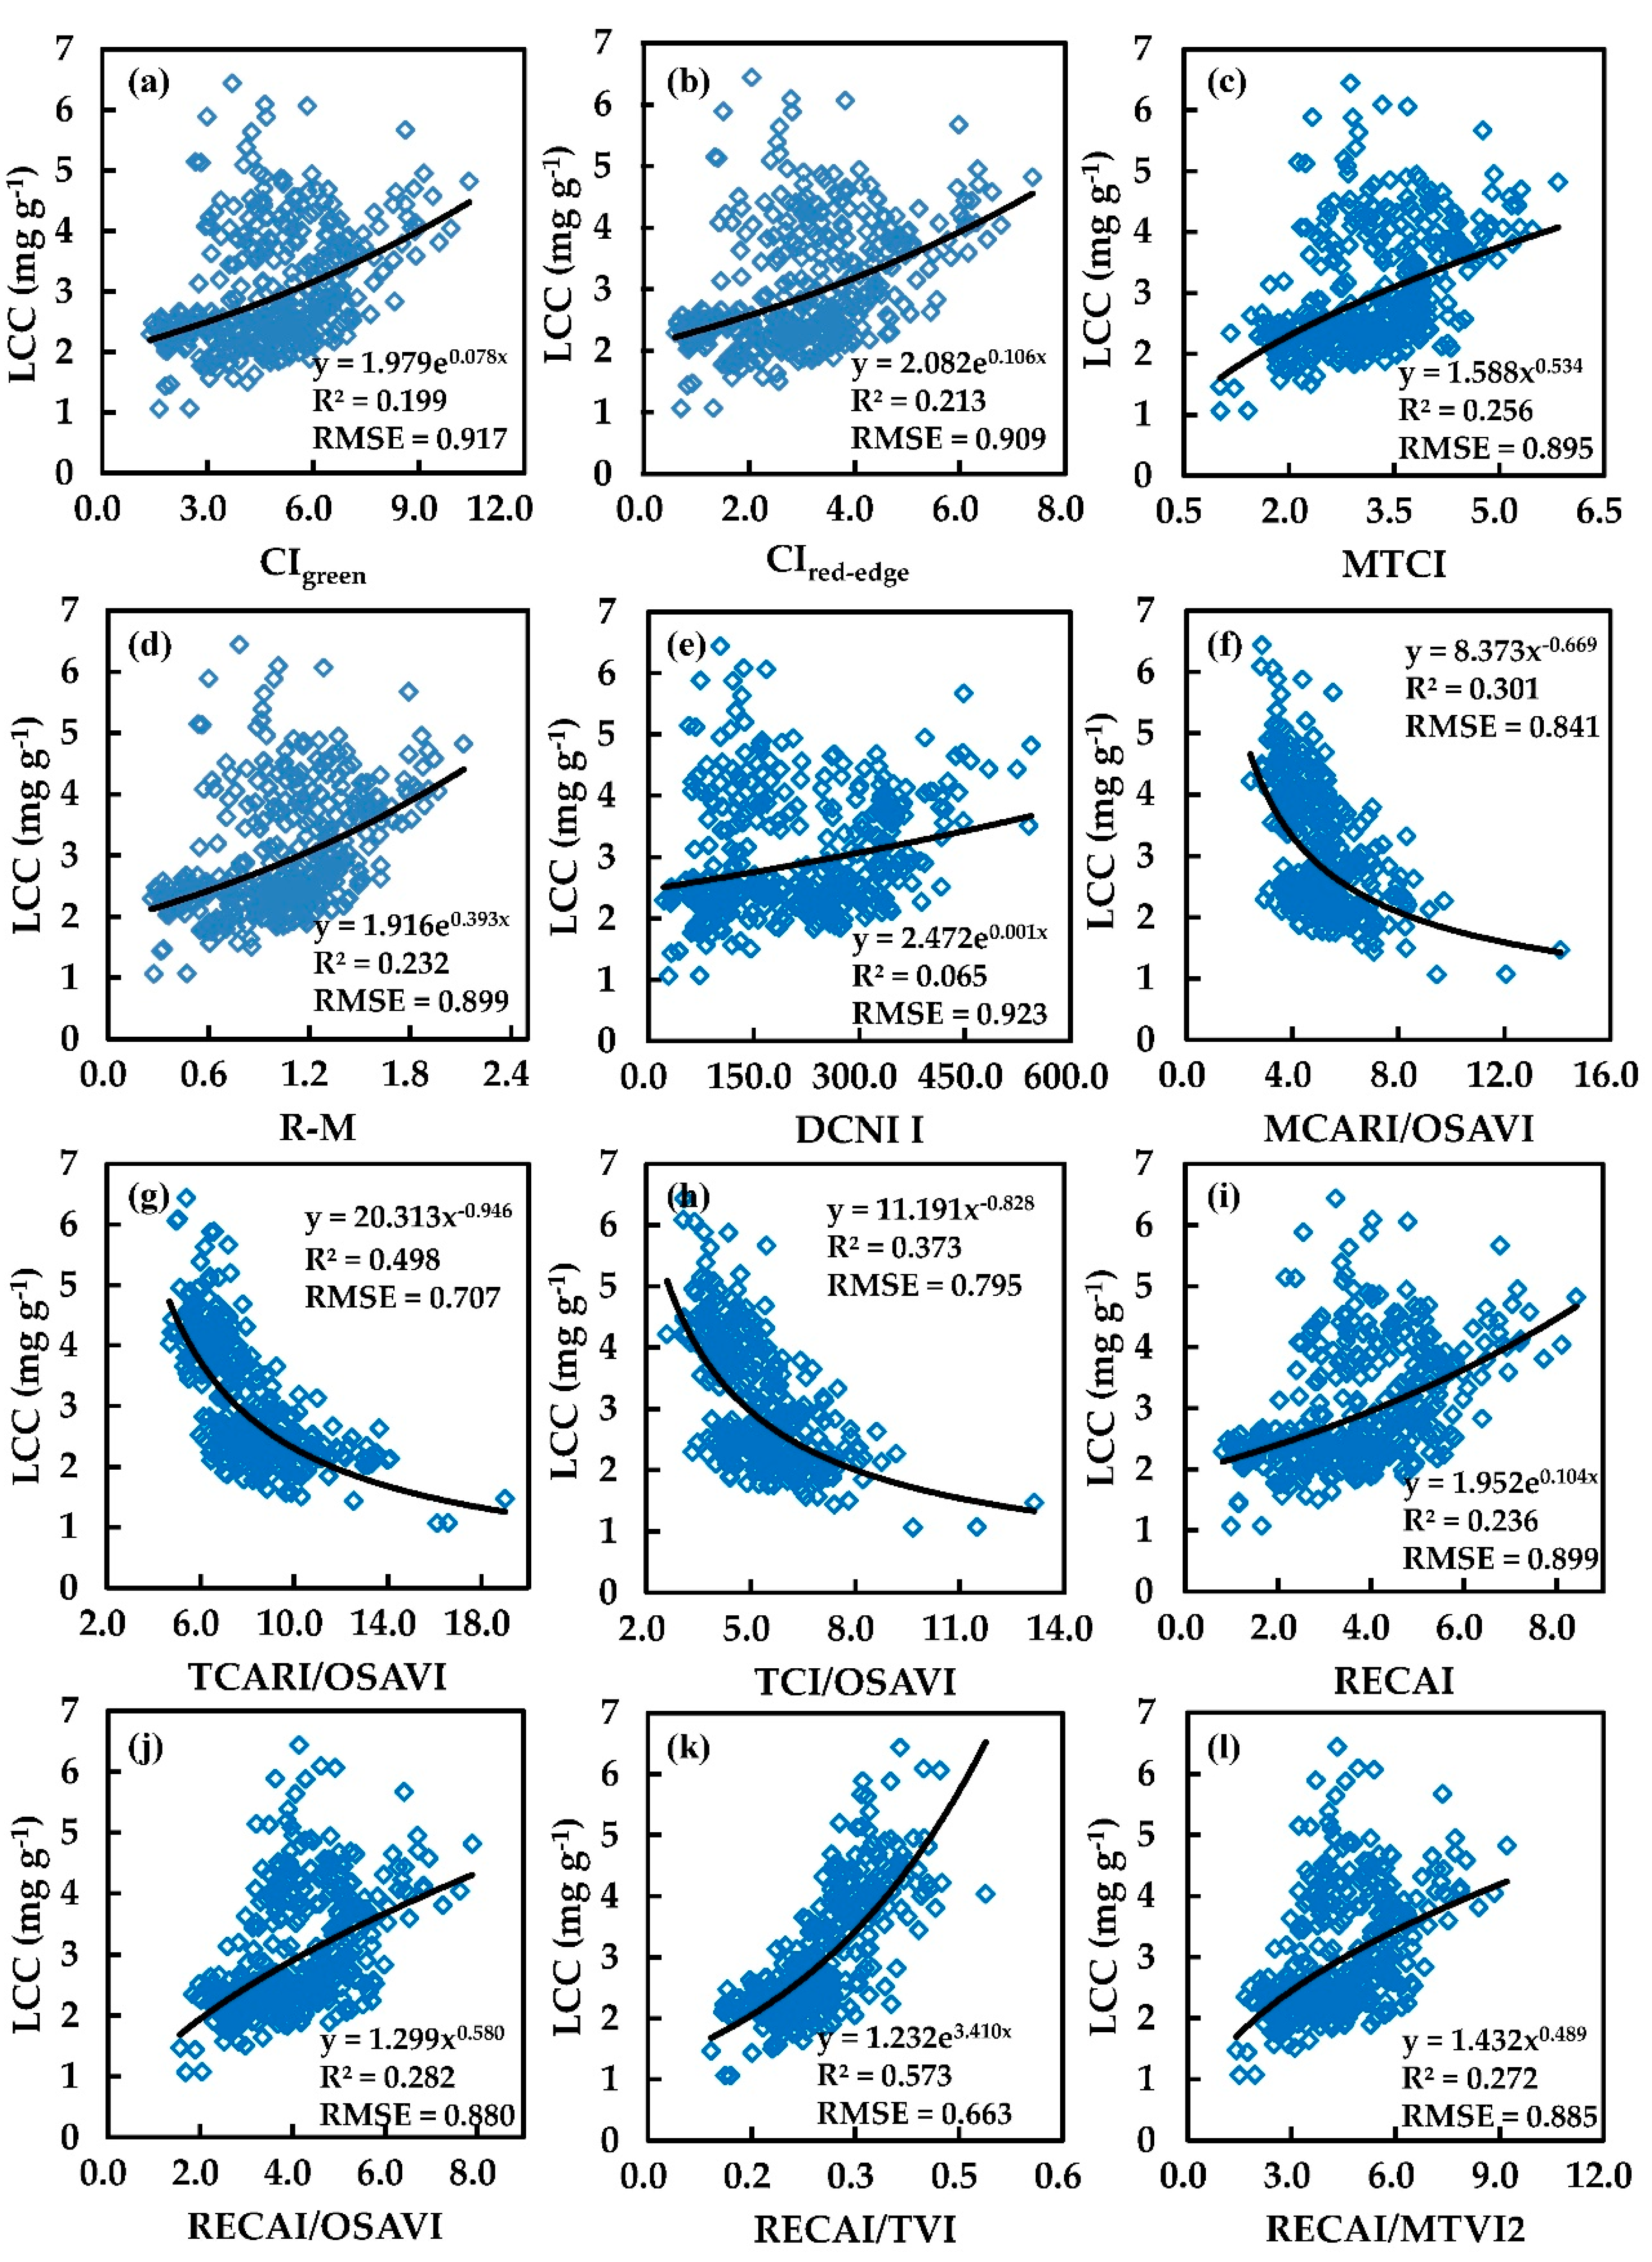
The LCC was predicted based on the published and newly proposed spectral indices using a ground-measured dataset. Approximately 365 samples from this dataset were used to build empirical regression models between LCC and VIs (linear, power, exponential, polynomial, and logarithmic). The scatterplots and estimation results are shown in Figure 3. As shown in this figure, RECAI/TVI exhibited the highest R2 value (0.573) and the lowest RMSE value (0.663 mg g−1), followed by TCARI/OSAVI (R2 = 0.498 and RMSE = 0.707 mg g−1), TCI/OSAVI (R2 = 0.373 and RMSE = 0.795 mg g−1), MCARI/OSAVI (R2 = 0.301 and RMSE = 0.841 mg g−1), and then the other indices. Unexpectedly, CIgreen and CIred-edge did not exhibit good performance in this study. As determined by the fit lines, the prediction models of CIgreen, CIred-edge, R-M, DCNI I, RECAI, and RECAI/TVI were exponential models, while the other vegetation indices were power models. The scatterplots between LCC and RECAI/TVI, TCARI/OSAVI, TCI/OSAVI, and MCARI/OSAVI were regular, while the others were diverse. There was a near-linear relationship between RECAI/TVI and LCC, which was more linear than the relationships between LCC and TCARI/OSAVI, TCI/OSAVI, and MCARI/OSAVI.
The predicted performances of the integrated vegetation indices (MCARI/OSAVI, TCARI/OSAVI, TCI/OSAVI, RECAI/TVI, RECAI/OSAVI, and RECAI/MTVI2 with 0.272 ≤ R2 ≤ 0.573) were superior to those of the single vegetation indices (CIgreen, CIred-edge, MTCI, R-M, and DCNI I with 0.065 ≤ R2 ≤ 0.256), which again proved that the ratio method was helpful for improving the estimation accuracy when using crop canopy spectral data.

3.2. Comparing the LCC Estimation Performances of the Indices

The predicted LCC values were plotted against field LCC measurements using the remaining samples (91 samples). The R2 and RMSE values were selected to assess the confidence of the relationship (Figure 4). Figure 4 (RECAI/TVI) shows that there was very good agreement between the estimated LCC values and the field-measured LCC values, with the highest R2 values (0.518) and the lowest RMSE values (0.658 mg g−1), followed by TCARI/OSAVI (R2 = 0.473 and RMSE = 0.680 mg g−1), TCI/OSAVI (R2 = 0.296 and RMSE = 0.787 mg g−1), MCARI/OSAVI (R2 = 0.217 and RMSE = 0.832 mg g−1), R-M (R2 = 0.204 and RMSE = 0.840 mg g−1), and RECAI/OSAVI (R2 = 0.201 and RMSE = 0.843 mg g−1). The order of the validation accuracies of these models was similar to the order of the prediction accuracies. From Figure 4, the slope of the validation linear fit for RECAI/TVI was closer to unity than that for the other indices. The LCCs were overestimated for low values and underestimated for high values by RECAI/TVI, TCARI/OSAVI, and TCI/OSAVI, especially TCARI/OSAVI and TCI/OSAVI. The LCC prediction results evidently showed that RECAI/TVI had the greatest potential for estimating winter wheat LCC. The DCNI І provided the worst predictions in this study with the measured datasets, which was inconsistent with the results obtained by [25]. This discrepancy can be justified by the fact that DCNI I was initially proposed for LCC estimation in cotton, which has a completely different canopy structure than winter wheat.

3.3. Effect of LAI on the Assessment of LCC

To analyze the influence of LAI on the LCC estimation, the relationships between the spectral indices and LCC and LAI were analyzed under five LAI levels (0 < LAI < 1, 1 ≤ LAI < 2, 2 ≤ LAI < 3, 3 ≤ LAI < 4, LAI ≥ 4). The results are shown in Table 5.
For 0 < LAI < 1, all indices except DCNI I were strongly sensitive to LCC at the 0.01 confidence level. MTCI, MCARI/OSAVI, TCARI/OSAVI, TCI/OSAVI, RECAI/OSAVI, RECAI/TVI, and RECAI/MTVI2 were not correlated with LAI, but the other indices were sensitive to LAI. The RECAI/TVI exhibited the highest correlation with LCC (r = 0.777**, significant at the 0.01 level) and no correlation with LAI (r = 0.029) among the indices. For 1 ≤ LAI < 2, all indices except DCNI I were significantly correlated with LCC (0.432 ≤ r ≤ 0.819). Only MCARI/OSAVI, TCI/OSAVI, and RECAI/TVI showed no correlation with LAI, whereas the other indices showed a strong correlation with LAI. The RECAI/TVI also showed the highest correlation coefficient with LCC (r = 0.819**) and no relationship with LAI (r = 0.109). For 2 ≤ LAI < 3, all indices were correlated with LCC (0.177 ≤ r ≤ 0.708). The RECAI/TVI exhibited the best correlation with LCC (r = 0.708**), followed by TCARI/OSAVI (r = 0.669**). Most indices were sensitive to LAI (0.293 ≤ r ≤ 0.388) except for MCARI/OSAVI (r = 0.146), TCARI/OSAVI (r = 0.040), TCI/OSAVI (r = 0.133), and RECAI/TVI (r = 0.053). For 3 ≤ LAI < 4, all indices were significantly related to LCC at the 0.01 level, and RECAI/TVI still showed a very strong correlation with LCC (r = 0.722 at the 0.01 level). Most of the vegetation indices showed no correlation with LAI, except for MCARI/OSAVI, TCARI/OSAVI, and TCI/OSAVI. For LAI ≥ 4, the relationships between vegetation indices and LCC were weakened for most indices, but RECAI, RECAI/OSAVI, RECAI/TVI, and RECAI/MTVI2 still showed strong correlations with LCC at the 0.01 level. No indices were related to LAI. In general, at both low and high LAI levels, RECAI/TVI was the most closely related to LCC at the 0.01 confidence level. This index was poorly related to LAI, indicating that it may be considered the best index for estimating LCC.

4. Discussion

4.1. Building a New Vegetation Index for Retrieving Winter Wheat Leaf Chlorophyll Content

The change in LCC contributes to the variation in reflectance in the visible spectral region, especially in the green, red, and red-edge bands. In this study, we adhered to the following three principles to select the optimal bands for the new spectral index RECAI. (1) To minimize the effect of LAI, the reflectance of the selected bands should be more sensitive to LCC and less sensitive to LAI. According to Figure 2, wavelength regions centered on 550 nm in the green peak and 720 nm in the red edge are most sensitive to leaf chlorophyll variability and least sensitive to LAI variability [32]. (2) To mitigate the potential saturation problem, we selected the green (550 nm) and red-edge (700 nm and 720 nm) bands instead of the red band (the maximum absorption of chlorophyll is near 670 nm). Some researchers found that even low chlorophyll content saturates the absorption in the red spectral region, whereas the reflectance in a wide range from 530 to 630 nm and near 700 nm remains sensitive to high chlorophyll contents [2,20,46]. (3) To reduce the effects of non-photosynthetic materials, we selected the ratio of reflectance at 550 and 700 nm, which corresponds to the minimum absorption of chlorophyll. This selection was based on the finding that the ratio of R700 and R550 is considered constant at the leaf level, despite the variability in chlorophyll content [17,19,35,47].
However, Table 5 indicates that RECAI was still strongly correlated with LAI, indicating that RECAI did not effectively minimize the effect of LAI variations on LCC estimation. To overcome this drawback, we utilized the method in this study by taking a ratio of two VIs: one that is sensitive to the canopy chlorophyll content and another that is sensitive to LAI effects [18,19,30,31,32]. Thus, TVI, MTVI2, and OSAVI were introduced to reduce the effect on RECAI on the LAI variation. According to the results from the ground-measured datasets (Figure 3 and Table 5), all three spectral indices (RECAI/TVI, RECAI/OSAVI, and RECAI/MTVI2) improved the LCC predictive accuracy and reduced the sensitivity to LAI compared with RECAI. The RECAI/TVI exhibited very good performance in terms of LCC estimation; RECAI/MTVI2 and RECAI/OSAVI did not perform as well as RECAI/TVI, which may be explained by the relationship between (i) TVI, MTVI2, OSAVI and (ii) LCC, LAI. As shown in Table 6, TVI, OSAVI, and MTVI2 were strongly correlated with LAI and weakly correlated (or even uncorrelated) with LCC, which met the demands of the abovementioned method for developing a ratio index to reduce the effect of LAI. The TVI was more sensitive to LAI and less sensitive to LCC than OSAVI and MTVI2, which was why RECAI/TVI performed better for LCC estimation than RECAI/OSAVI and RECAI/MTVI2.

4.2. Effect of Field Management Measures on the RECAI/TVI Index

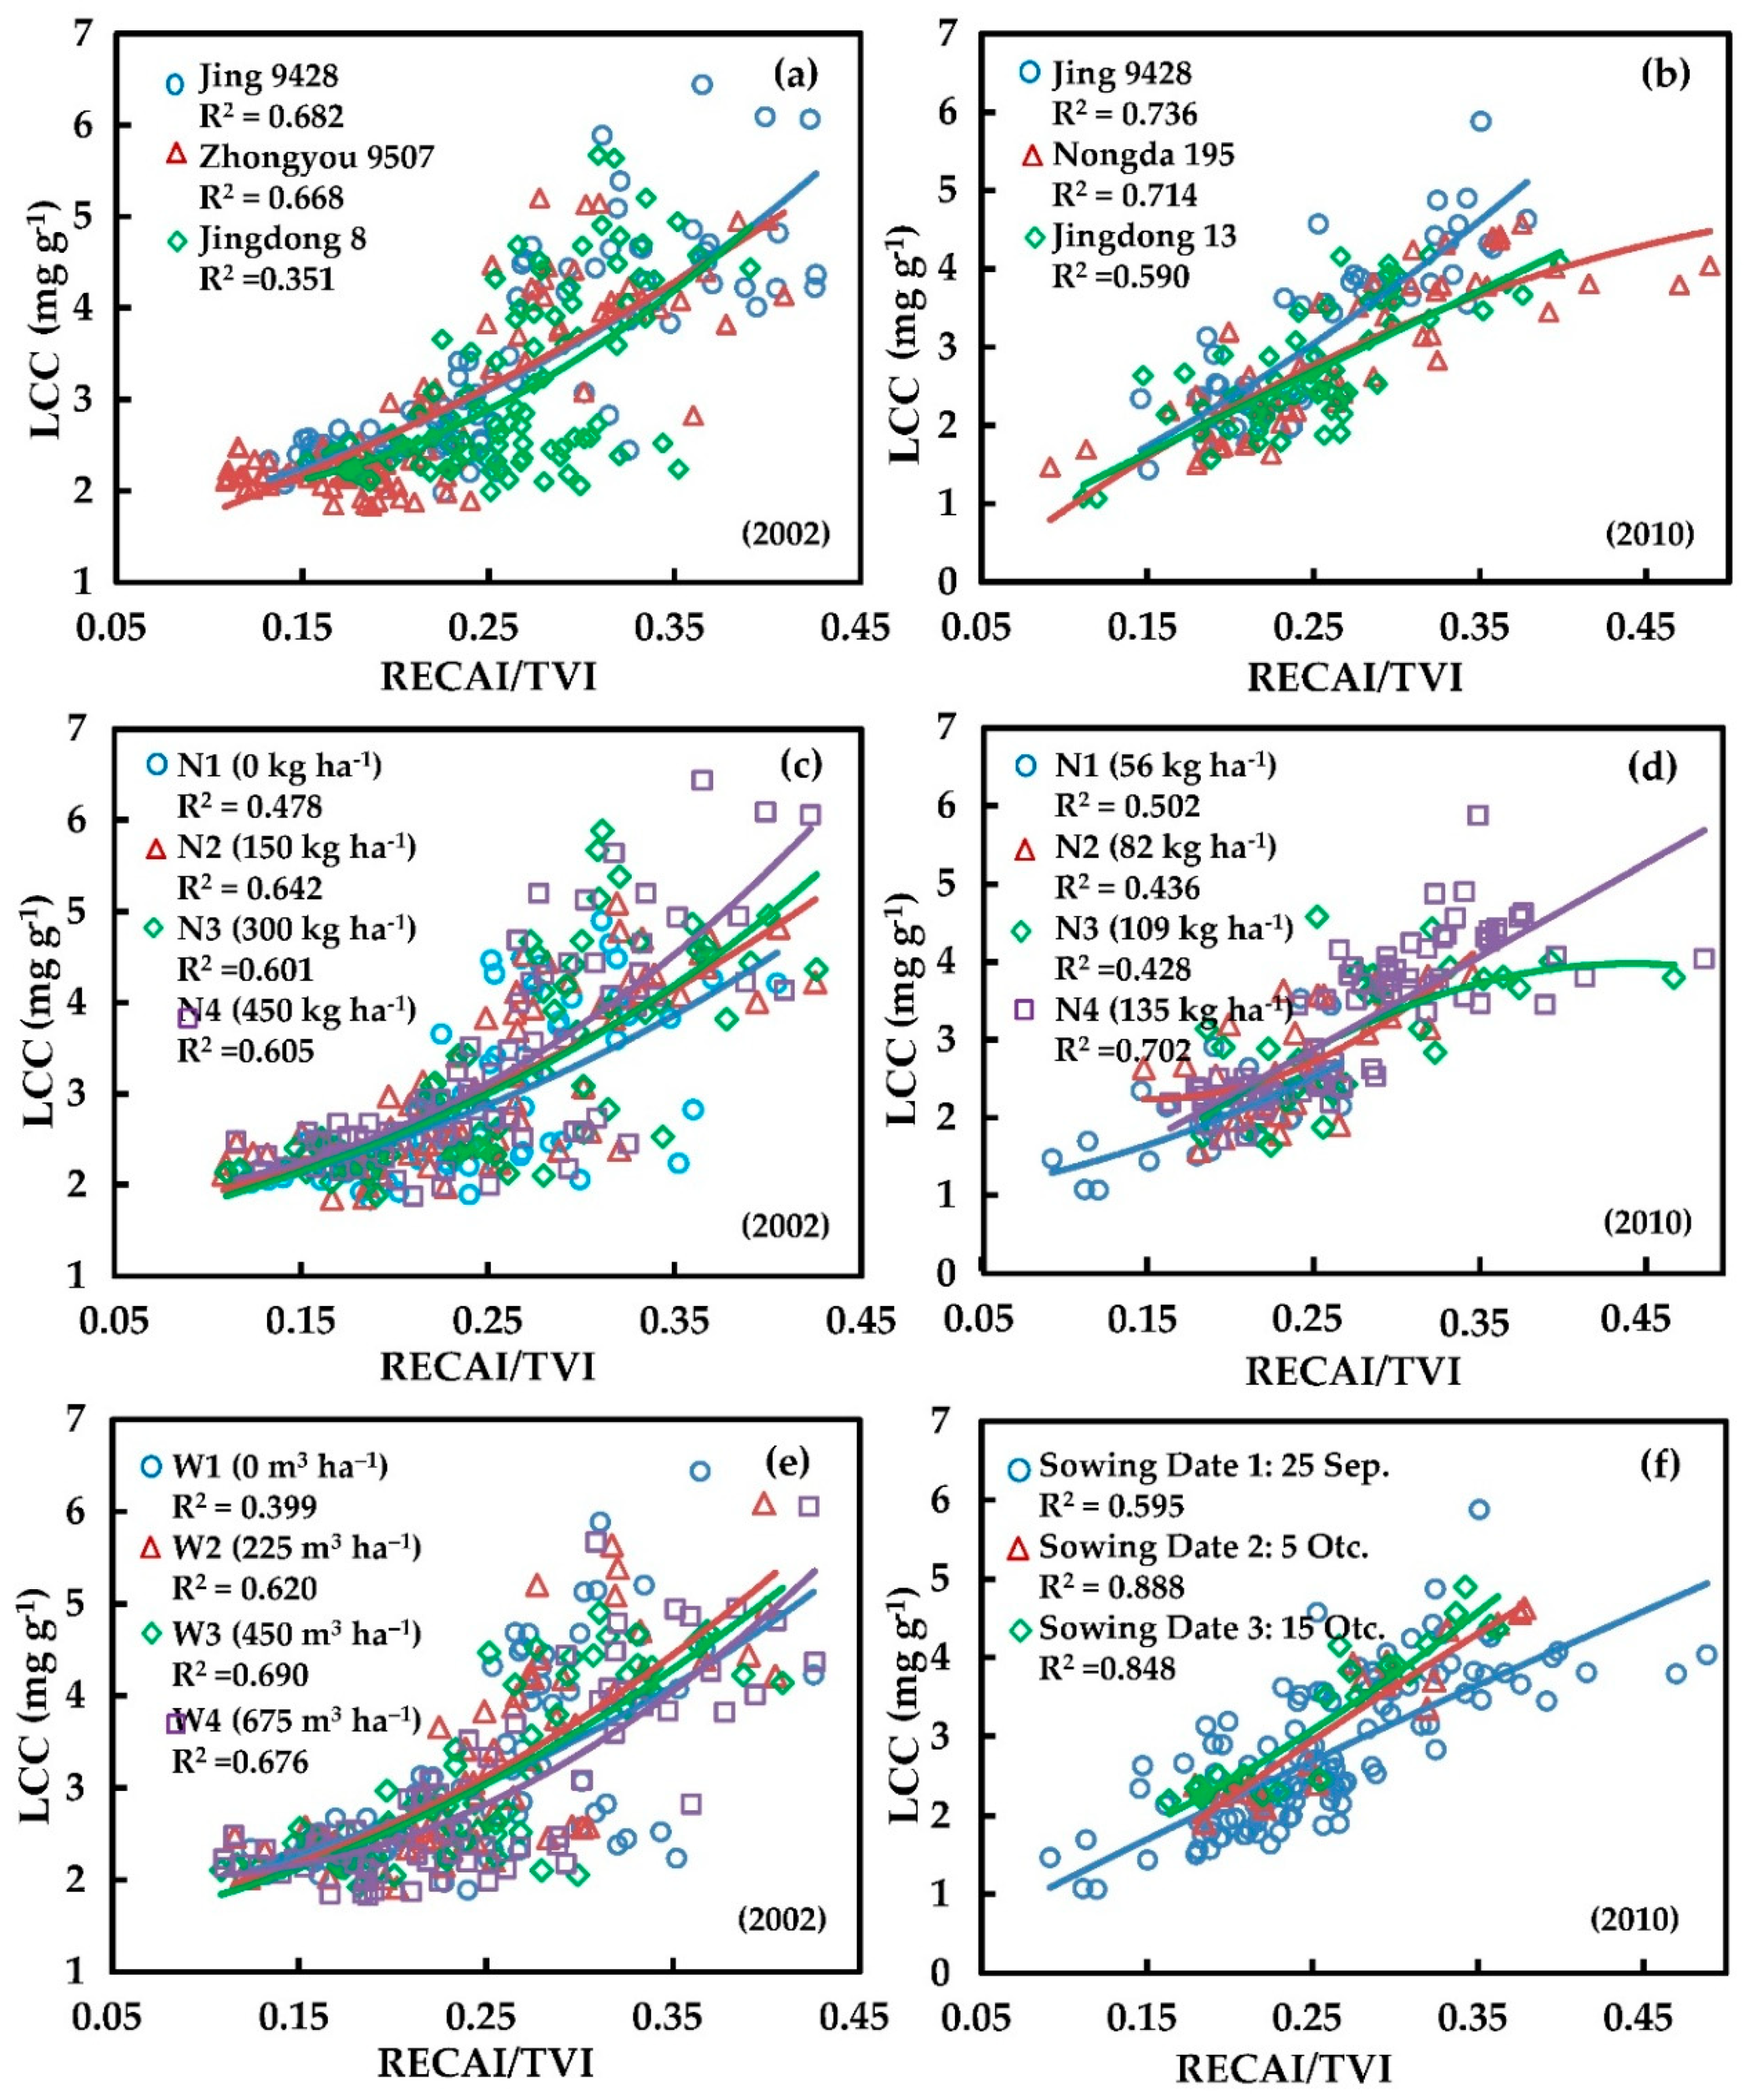
Field management measures strongly impact crop growth and lead to variations in LCC. In this study, we analyzed how winter wheat varieties, N fertilizer, irrigation volume, and sowing dates affect the newly proposed RECAI/TVI (Figure 5).
For different winter wheat varieties, Jing 9428, Zhongyou 9507 and Nongda 195 are horizontal winter wheat varieties, whereas Jingdong 8 and Jingdong 13 are erective varieties. From Figure 5a,b, RECAI/TVI performed better for the horizontal varieties than for the erective varieties on both the 2002 and 2010 datasets. In 2002, the R2 values of the horizontal varieties (Jing 9428 and Zhongyou 9507) were 0.682 and 0.688, respectively, whereas the R2 of the erective variety (Jingdong 8) was only 0.351. In 2010, the R2 values of the horizontal varieties (Jing 9428 and Nongda 195) were 0.736 and 0.714, respectively, whereas the R2 of the erective variety (Jingdong 13) was 0.590. For a given LAI, horizontal winter wheat can effectively increase the vegetation fraction and reduce the influence of soil compared with the erective variety. That is, the RECAI/TVI of horizontal varieties can obtain a more accurate estimate of LCC.
For different N fertilizer contents, for both the 2002 and 2010 datasets, high N fertilizer density can improve the accuracy of LCC estimates when using RECAI/TVI (Figure 5c,d). For example, low N application densities (0, 56, 82, and 109 kg ha−1) provided LCC estimates with low accuracy by RECAI/TVI (0.428 ≤ R2 ≤ 0.502). A high N application density (135, 150, 300, and 450 kg ha−1) provides highly accurate LCC estimates by RECAI/TVI (0.601 ≤ R2 ≤ 0.702). Another phenomenon is that overfertilization with nitrogen can reduce the accuracy of LCC estimates.
For different water treatments on the 2002 dataset, no water treatment (W1) led to the worst prediction accuracy of LCC with RECAI/TVI (R2 = 0.399), whereas the other water treatments led to better prediction accuracy of LCC with RECAI/TVI (R2 ≥ 0.620) (see Figure 5e). No irrigation treatment (W1) had a strong impact on seed germination and seedlings, which led to worse growth and large soil background influence by the RECAI/TVI method. Due to natural precipitation, the different water treatments (W2, W3, and W4) had little effect on crop growth. Therefore, there were no obvious differences in the effect of soil background on LCC estimated by RECAI/TVI.
The different sowing dates in the 2010 dataset affected the LCC predictive performance of RECAI/TVI (see Figure 5f). For sowing date 1 (25 September), the R2 between RECAI/TVI and LCC was 0.595, whereas for sowing dates 2 (5 October) and 3 (15 October), the R2 values were 0.888 and 0.848, respectively. This result may be attributed to the tiller number for winter wheat in the different sowing date treatments. Because sowing late may lead to the capacity reduction in tillering, especially before winter, a larger seeding rate was applied in the field on sowing dates 2 (217 kg ha−1) and 3 (279 kg ha−1) than that applied on sowing date 1 (152 kg ha−1) to obtain a sufficiently high tiller number. However, during the stem elongation stage, which is the end of the tillering period, the number of stems for sowing dates 2 (626 m−2) and 3 (468 m−2) was obviously lower than that for sowing date 1 (857 m−2). This result indicated that an excessive tiller number may reduce the performance of RECAI/TVI on LCC estimation.

4.3. Comparison of the Performances of Different VIs

In this study, we found that LCC exhibited different relationships with different spectral indices. In general, the ratio vegetation indices, which comprise VIs for estimating canopy chlorophyll contents and VIs for estimating LAI, exhibited good predictive performance for LCC. For example, RECAI/TVI, TCARI/OSAVI, MCARI/OSAVI, TCI/OSAVI, RECAI/OSAVI, and RECAI/MTVI2 showed better predictive accuracies with large RMSE values between 0.658 mg g−1 and 0.847 mg g−1, whereas CIgreen, CIred-edge, MTCI, R-M, DCNI I, and RECAI showed large RMSE values between 0.840 mg g−1 and 0.923 mg g−1. This result is in agreement with the results of previous studies on LCC estimation [29]. The TCARI/OSAVI has been widely used to estimate LCC in published research. In this study, TCARI/OSAVI showed better performance for LCC retrieval, which is consistent with the results of other studies [28,29,30]. However, this index did not estimate the LCC of winter wheat as well as other crop species (corn, potato) as indicated by other published reports, and this index performed slightly worse than RECAI/TVI in this study. This result can be interpreted by the viewpoint that TCARI/OSAVI is still sensitive to the soil background and LAI variations, especially when LAI < 3 [32,48]. The chlorophyll indices (CIgreen and CIred-edge) did not perform well in LCC estimations in our study, which is in accordance with the results of a previous study [30] that proved that the chlorophyll indices were more suitable for the estimation of canopy chlorophyll content.
Overall, the newly proposed RECAI/TVI greatly improved the predictive accuracy, effectively overcame the saturation problem and reduced the effect of LAI when used to estimate winter wheat LCC. Thus, RECAI/TVI is considered the best spectral index for estimating LCC. However, some problems still need to be addressed in future work. Remote estimates of LCC always depend strongly on the growth stage because changes in vegetation fraction, plant type, and other factors may lead to variations in the canopy spectral reflectance. Furthermore, the performance of RECAI/TVI at a given growth stage remains to be addressed to help precision field management. Additionally, the performance of the index in estimating the LCC of other crops, such as rice or corn, should be examined. In future research, we will put much more effort into confirming the capacity of RECAI/TVI to estimate LCC given different crop growth stages, different types of crops, different spatial scales, and different spectral data.

5. Conclusions

Chlorophyll is a vital pigment for photosynthesis and directly or indirectly reflects crop nutritional status, growth, vigor, etc. This study focused on testing a remote sensing method to accurately estimate the LCC of winter wheat over crop canopies with minimum effects from LAI. Based on the measured datasets (n = 456), we evaluated the performance of eight published and four newly proposed spectral indices for LCC retrieval. The results showed that the newly proposed RECAI/TVI performed excellently for LCC estimation, with R2 values that increased by more than 13.09% and RMSE values that decreased by more than 6.22%. In addition, whether at low LAI or at high LAI, RECAI/TVI showed a significant relationship with LCC (0.708** ≤ r ≤ 0.819**) and revealed no relationship with LAI variation (0.029 ≤ r ≤ 0.167), indicating that it clearly reduced the influence of LAI. These results also indicate that RECAI/TVI may be considered the optimal index for estimating winter wheat LCC. The LCC predictive accuracy of RECAI/TVI can be influenced by erective winter wheat varieties, a low density of N fertilizer, no water application, and early sowing (excessive tiller number). Therefore, due to the complexity of crop growth conditions, the capability of RECAI/TVI to accurately estimate the LCC of winter wheat should be further verified by applying this index to a more varied range of field-measured data.

Author Contributions

W.H. and X.S. conceived and designed the experiments. B.C. analyzed the experimental data and drafted the manuscript. X.Z. provided guidance on data processing. Q.Z., W.H., X.S. and H.Y. checked the results and revised the manuscript. All authors read and approved the final version of the manuscript.

Funding

This study was supported by the National Key R&D Program of China (2016YFD0300601), the National Natural Science Foundation of China (41501468, 41601466), the Youth Innovation Promotion Association CAS (2017085), the Hainan Provincial Key R&D Program of China (ZDYF2018073), the Agricultural Science and Technology Innovation of Sanya (2015KJ04), the National special support program for high-level personnel recruitment (Wenjiang Huang), and the ten-thousand Talents Program (Wenjiang Huang).

Conflicts of Interest

The authors declare no conflicts of interest.

References

  1. Carter, G.A. Ratios of leaf reflectances in narrow wavebands as indicators of plant stress. Int. J. Remote Sens. 1994, 15, 697–704. [Google Scholar] [CrossRef]
  2. Gitelson, A.A.; Merzlyak, M.N. Remote estimation of chlorophyll content in higher plant leaves. Int. J. Remote Sens. 1997, 18, 2691–2697. [Google Scholar] [CrossRef]
  3. Osborne, B.A.; Raven, J.A. Light absorption by plants and its implications for photosynthesis. Biol. Rev. 1986, 61, 1–60. [Google Scholar] [CrossRef]
  4. Curran, P.J.; Dungan, J.L.; Gholz, H.L. Exploring the relationship between reflectance red edge and chlorophyll content in slash pine. Tree Physiol. 1990, 7, 33–48. [Google Scholar] [CrossRef] [PubMed]
  5. Sage, R.F.; Robert, W.P.; Seemann, J.R. The Nitrogen Use Efficiency of C3 and C4 Plants. Plant Physiol. 1987, 85, 355–359. [Google Scholar] [CrossRef]
  6. Miao, Y.; Mulla, D.J.; Randall, G.W.; Vetsch, J.A.; Vintila, R. Combining chlorophyll meter readings and high spatial resolution remote sensing images for in-season site-specific nitrogen management of corn. Precis. Agric. 2008, 10, 45–62. [Google Scholar] [CrossRef]
  7. Clevers, J.G.P.W.; Kooistra, L. Using Hyperspectral Remote Sensing Data for Retrieving Canopy Chlorophyll and Nitrogen Content. IEEE J. Sel. Top. Appl. Earth Obs. Remote Sens. 2012, 5, 574–583. [Google Scholar] [CrossRef]
  8. Schlemmer, M.; Gitelson, A.; Schepers, J.; Ferguson, R.; Peng, Y.; Shanahan, J.; Rundquist, D. Remote estimation of nitrogen and chlorophyll contents in maize at leaf and canopy levels. Int. J. Appl. Earth Obs. Geoinf. 2013, 25, 47–54. [Google Scholar] [CrossRef]
  9. Baret, F.; Houles, V.; Guerif, M. Quantification of plant stress using remote sensing observations and crop models: The case of nitrogen management. J. Exp. Bot. 2007, 58, 869–880. [Google Scholar] [CrossRef]
  10. Gitelson, A.A.; Peng, Y.; Arkebauer, T.J.; Schepers, J. Relationships between gross primary production, green LAI, and canopy chlorophyll content in maize: Implications for remote sensing of primary production. Remote Sens. Environ. 2014, 144, 65–72. [Google Scholar] [CrossRef]
  11. Gitelson, A.A.; Viña, A.; Ciganda, V.; Rundquist, D.C.; Arkebauer, T.J. Remote estimation of canopy chlorophyll content in crops. Geophys. Res. Lett. 2005, 32. [Google Scholar] [CrossRef]
  12. Ustin, S.L.; Gitelson, A.A.; Jacquemoud, S.; Schaepman, M.; Asner, G.P.; Gamon, J.A.; Zarco-Tejada, P. Retrieval of foliar information about plant pigment systems from high resolution spectroscopy. Remote Sens. Environ. 2009, 113, S67–S77. [Google Scholar] [CrossRef]
  13. Li, F.; Miao, Y.X.; Feng, G.H.; Yuan, F.; Yue, S.; Gao, X.; Liu, Y.; Liu, B.; Ustin, S.L.; Chen, X. Improving estimation of summer maize nitrogen status with red edge-based spectral vegetation indices. Field Crops Res. 2014, 157, 111–123. [Google Scholar] [CrossRef]
  14. Yao, F.Q.; Cai, H.J.; Li, Y.L.; Luo, W.B. Monitoring Winter Wheat SPAD Based on Red Edge Parameter Derived from Hyperspectral Reflectance. China Rural Water Hydropower 2015, 3, 84–87. [Google Scholar]
  15. Liu, W.Y.; Pan, J. A hyperspectral assessment model for leaf chlorophyll content of Pinus massoniana based on neural network. Chin. J. Appl. Ecol. 2017, 28, 1128–1136. [Google Scholar]
  16. Zillmann, E.; Schönert, M.; Lilienthal, H.; Siegmann, B.; Jarmer, T.; Rosso, P.; Weichelt, H. Crop Ground Cover Fraction and Canopy Chlorophyll Content Mapping using RapidEye imagery. ISPRS Int. Arch. Photogramm. Remote Sens. Spat. Inf. Sci. 2015, 40, 149–155. [Google Scholar] [CrossRef]
  17. Kim, M.; Daughtry, C.; Chappelle, E.; McMurtrey, J., III; Walthall, C. The use of high spectral resolution bands for estimating absorbed photosynthetically active radiation (Apar). In Proceedings of the 6th Symposium on Physical Measurements and Signatures in Remote Sensing, Val D’Isere, France, 17–21 January 1994; pp. 299–306. [Google Scholar]
  18. Daughtry, C.S.T.; Walthall, C.L.; Kim, M.S.; Colstoun, E.B.D.; Mcmurtrey, J.E.I. Estimating Corn Leaf Chlorophyll Concentration from Leaf and Canopy Reflectance. Remote Sens. Environ. 2000, 74, 229–239. [Google Scholar] [CrossRef]
  19. Haboudane, D.; Millera, J.R.; Tremblay, N.; Zarco-Tejadad, P.J.; Dextraze, L. Integrated narrow-band vegetation indices for prediction of crop chlorophyll content for application to precision agriculture. Remote Sens. Environ. 2002, 81, 416–426. [Google Scholar] [CrossRef]
  20. Gitelson, A.A.; Gritz, Y.; Merzlyak, M.N. Relationships between leaf chlorophyll content and spectral reflectance and algorithms for non-destructive chlorophyll assessment in higher plant leaves. J. Plant Physiol. 2003, 160, 271–282. [Google Scholar] [CrossRef] [PubMed]
  21. Gitelson, A.A.; Keydan, G.P.; Merzlyak, M.N. Three-band model for noninvasive estimation of chlorophyll, carotenoids, and anthocyanin contents in higher plant leaves. Geophys. Res. Lett. 2016, 33, L11402. [Google Scholar] [CrossRef]
  22. Ciganda, V.; Gitelson, A.; Schepers, J. Non-destructive determination of maize leaf and canopy chlorophyll content. J. Plant Physiol. 2009, 166, 157–167. [Google Scholar] [CrossRef]
  23. Dash, J.; Curran, P.J. The MERIS terrestrial chlorophyll index. Int. J. Remote Sens. 2004, 25, 5403–5413. [Google Scholar] [CrossRef]
  24. Maire, L.G.; François, C.; Dufrêne, E. Towards universal broad leaf chlorophyll indices using PROSPECT simulated database and hyperspectral reflectance measurements. Remote Sens. Environ. 2004, 89, 1–28. [Google Scholar] [CrossRef]
  25. Jin, X.; Li, Z.; Feng, H.; Xu, X.; Yang, G. Newly Combined Spectral Indices to Improve Estimation of Total Leaf Chlorophyll Content in Cotton. IEEE J. Sel. Top. Appl. Earth Obs. Remote Sens. 2014, 7, 4589–4600. [Google Scholar] [CrossRef]
  26. Lamb, D.W.; Steyn-Ross, M.; Schaare, P.; Hanna, M.M.; Silvester, W.; Steyn-Ross, A. Estimating leaf nitrogen concentration in ryegrass (Lolium spp.) pasture using the chlorophyll red-edge: Theoretical modelling and experimental observations. Int. J. Remote Sens. 2002, 23, 3619–3648. [Google Scholar] [CrossRef]
  27. Liu, J.; Pattey, E.; Jégo, G. Assessment of vegetation indices for regional crop green LAI estimation from Landsat images over multiple growing seasons. Remote Sens. Environ. 2012, 123, 347–358. [Google Scholar] [CrossRef]
  28. Liang, L.; Di, L.; Zhang, L.; Deng, M.; Qin, Z.; Zhao, S.; Lin, H. Estimation of crop LAI using hyperspectral vegetation indices and a hybrid inversion method. Remote Sens. Environ. 2015, 165, 123–134. [Google Scholar] [CrossRef]
  29. Kooistra, L.; Clevers, J.G.P.W. Estimating potato leaf chlorophyll content using ratio vegetation indices. Remote Sens. Lett. 2016, 7, 611–620. [Google Scholar] [CrossRef]
  30. Clevers, J.; Kooistra, L.; Marnix, V.D.B. Using Sentinel-2 Data for Retrieving LAI and Leaf and Canopy Chlorophyll Content of a Potato Crop. Remote Sens. 2017, 9, 405. [Google Scholar] [CrossRef]
  31. Cui, S.; Zhou, K. A comparison of the predictive potential of various vegetation indices for leaf chlorophyll content. Earth Sci. Inf. 2017, 10, 169–181. [Google Scholar] [CrossRef]
  32. Haboudane, D.; Tremblay, N.; Miller, J.R.; Vigneault, P. Remote Estimation of Crop Chlorophyll Content Using Spectral Indices Derived From Hyperspectral Data. IEEE Trans. Geosci. Remote Sens. 2008, 46, 423–437. [Google Scholar] [CrossRef]
  33. Porra, R.J. The chequered history of the development and use of simultaneous equations for the accurate determination of chlorophylls a and b. Photosynth. Res. 2002, 73, 149–156. [Google Scholar] [CrossRef]
  34. Wang, Z.; Wang, J.; Liu, L.; Huang, W.; Zhao, C.; Lu, Y. Estimation of Nitrogen Status in Middle and Bottom Layers of Winter Wheat Canopy by Using Ground-Measured Canopy Reflectance. Commun. Soil Sci. Plant Anal. 2005, 36, 2289–2302. [Google Scholar] [CrossRef]
  35. Wu, C.; Niu, Z.; Tang, Q.; Huang, W. Estimating chlorophyll content from hyperspectral vegetation indices: Modeling and validation. Agric. For. Meteorol. 2008, 148, 1230–1241. [Google Scholar] [CrossRef]
  36. Zhou, X.; Huang, W.; Kong, W.; Ye, H.; Dong, Y.; Casa, R. Assessment of leaf carotenoids content with a new carotenoid index: Development and validation on experimental and model data. Int. J. Appl. Earth Obs. Geoinf. 2017, 57, 24–35. [Google Scholar] [CrossRef]
  37. Rondeaux, G.; Steven, M.; Baret, F. Optimization of soil-adjusted vegetation indices. Remote Sens. Environ. 1996, 55, 95–107. [Google Scholar] [CrossRef]
  38. Broge, N.H.; Leblanc, E. Comparing prediction power and stability of broadband and hyperspectral vegetation indices for estimation of green leaf area index and canopy chlorophyll density. Remote Sens. Environ. 2000, 76, 156–172. [Google Scholar] [CrossRef]
  39. Haboudane, D. Hyperspectral vegetation indices and novel algorithms for predicting green LAI of crop canopies: Modeling and validation in the context of precision agriculture. Remote Sens. Environ. 2004, 90, 337–352. [Google Scholar] [CrossRef]
  40. Gates, D.M.; Keegan, H.J.; Schleter, J.C.; Weidner, V.R. Spectral Properties of Plants. Appl. Opt. 1965, 4, 11–20. [Google Scholar] [CrossRef]
  41. Horler, D.N.H.; Dockray, M.; Barber, J. The red edge of plant leaf reflectance. Int. J. Remote Sens. 1983, 4, 273–288. [Google Scholar] [CrossRef]
  42. Datt, B.A. New Reflectance Index for Remote Sensing of Chlorophyll Content in Higher Plants: Tests using Eucalyptus Leaves. J. Plant Physiol. 1999, 154, 30–36. [Google Scholar] [CrossRef]
  43. Blackburn, G.A. Hyperspectral remote sensing of plant pigments. J. Exp. Bot. 2007, 58, 855–867. [Google Scholar] [CrossRef] [PubMed]
  44. Hatfield, J.L.; Gitelson, A.A.; Schepers, J.S.; Walthall, C.L. Application of Spectral Remote Sensing for Agronomic Decisions. Agron. J. 2008, 100, S117–S131. [Google Scholar] [CrossRef]
  45. Richter, K.; Atzberger, C.; Hank, T.B.; Mauser, W. Derivation of biophysical variables from Earth observation data: Validation and statistical measures. J. Appl. Remote Sens. 2012, 6, 063557. [Google Scholar] [CrossRef]
  46. Croft, H.; Chen, J.; Zhang, Y. The applicability of empirical vegetation indices for determining leaf chlorophyll content over different leaf and canopy structures. Ecol. Complex. 2014, 17, 119–130. [Google Scholar] [CrossRef]
  47. Brogea, N.; Mortensen, J. Deriving green crop area index and canopy chlorophyll density of winter wheat from spectral reflectance data. Remote Sens. Environ. 2002, 81, 45–57. [Google Scholar] [CrossRef]
  48. Zarco-Tejada, P.J.; Berjón, A.; López-Lozano, R.; Miller, J.R.; Martín, P.; Cachorro, V.; González, M.R.; de Frutos, A. Assessing vineyard condition with hyperspectral indices: leaf and canopy reflectance simulation in a row-structured discontinuous canopy. Remote Sens. Environ. 2005, 99, 271–287. [Google Scholar] [CrossRef]
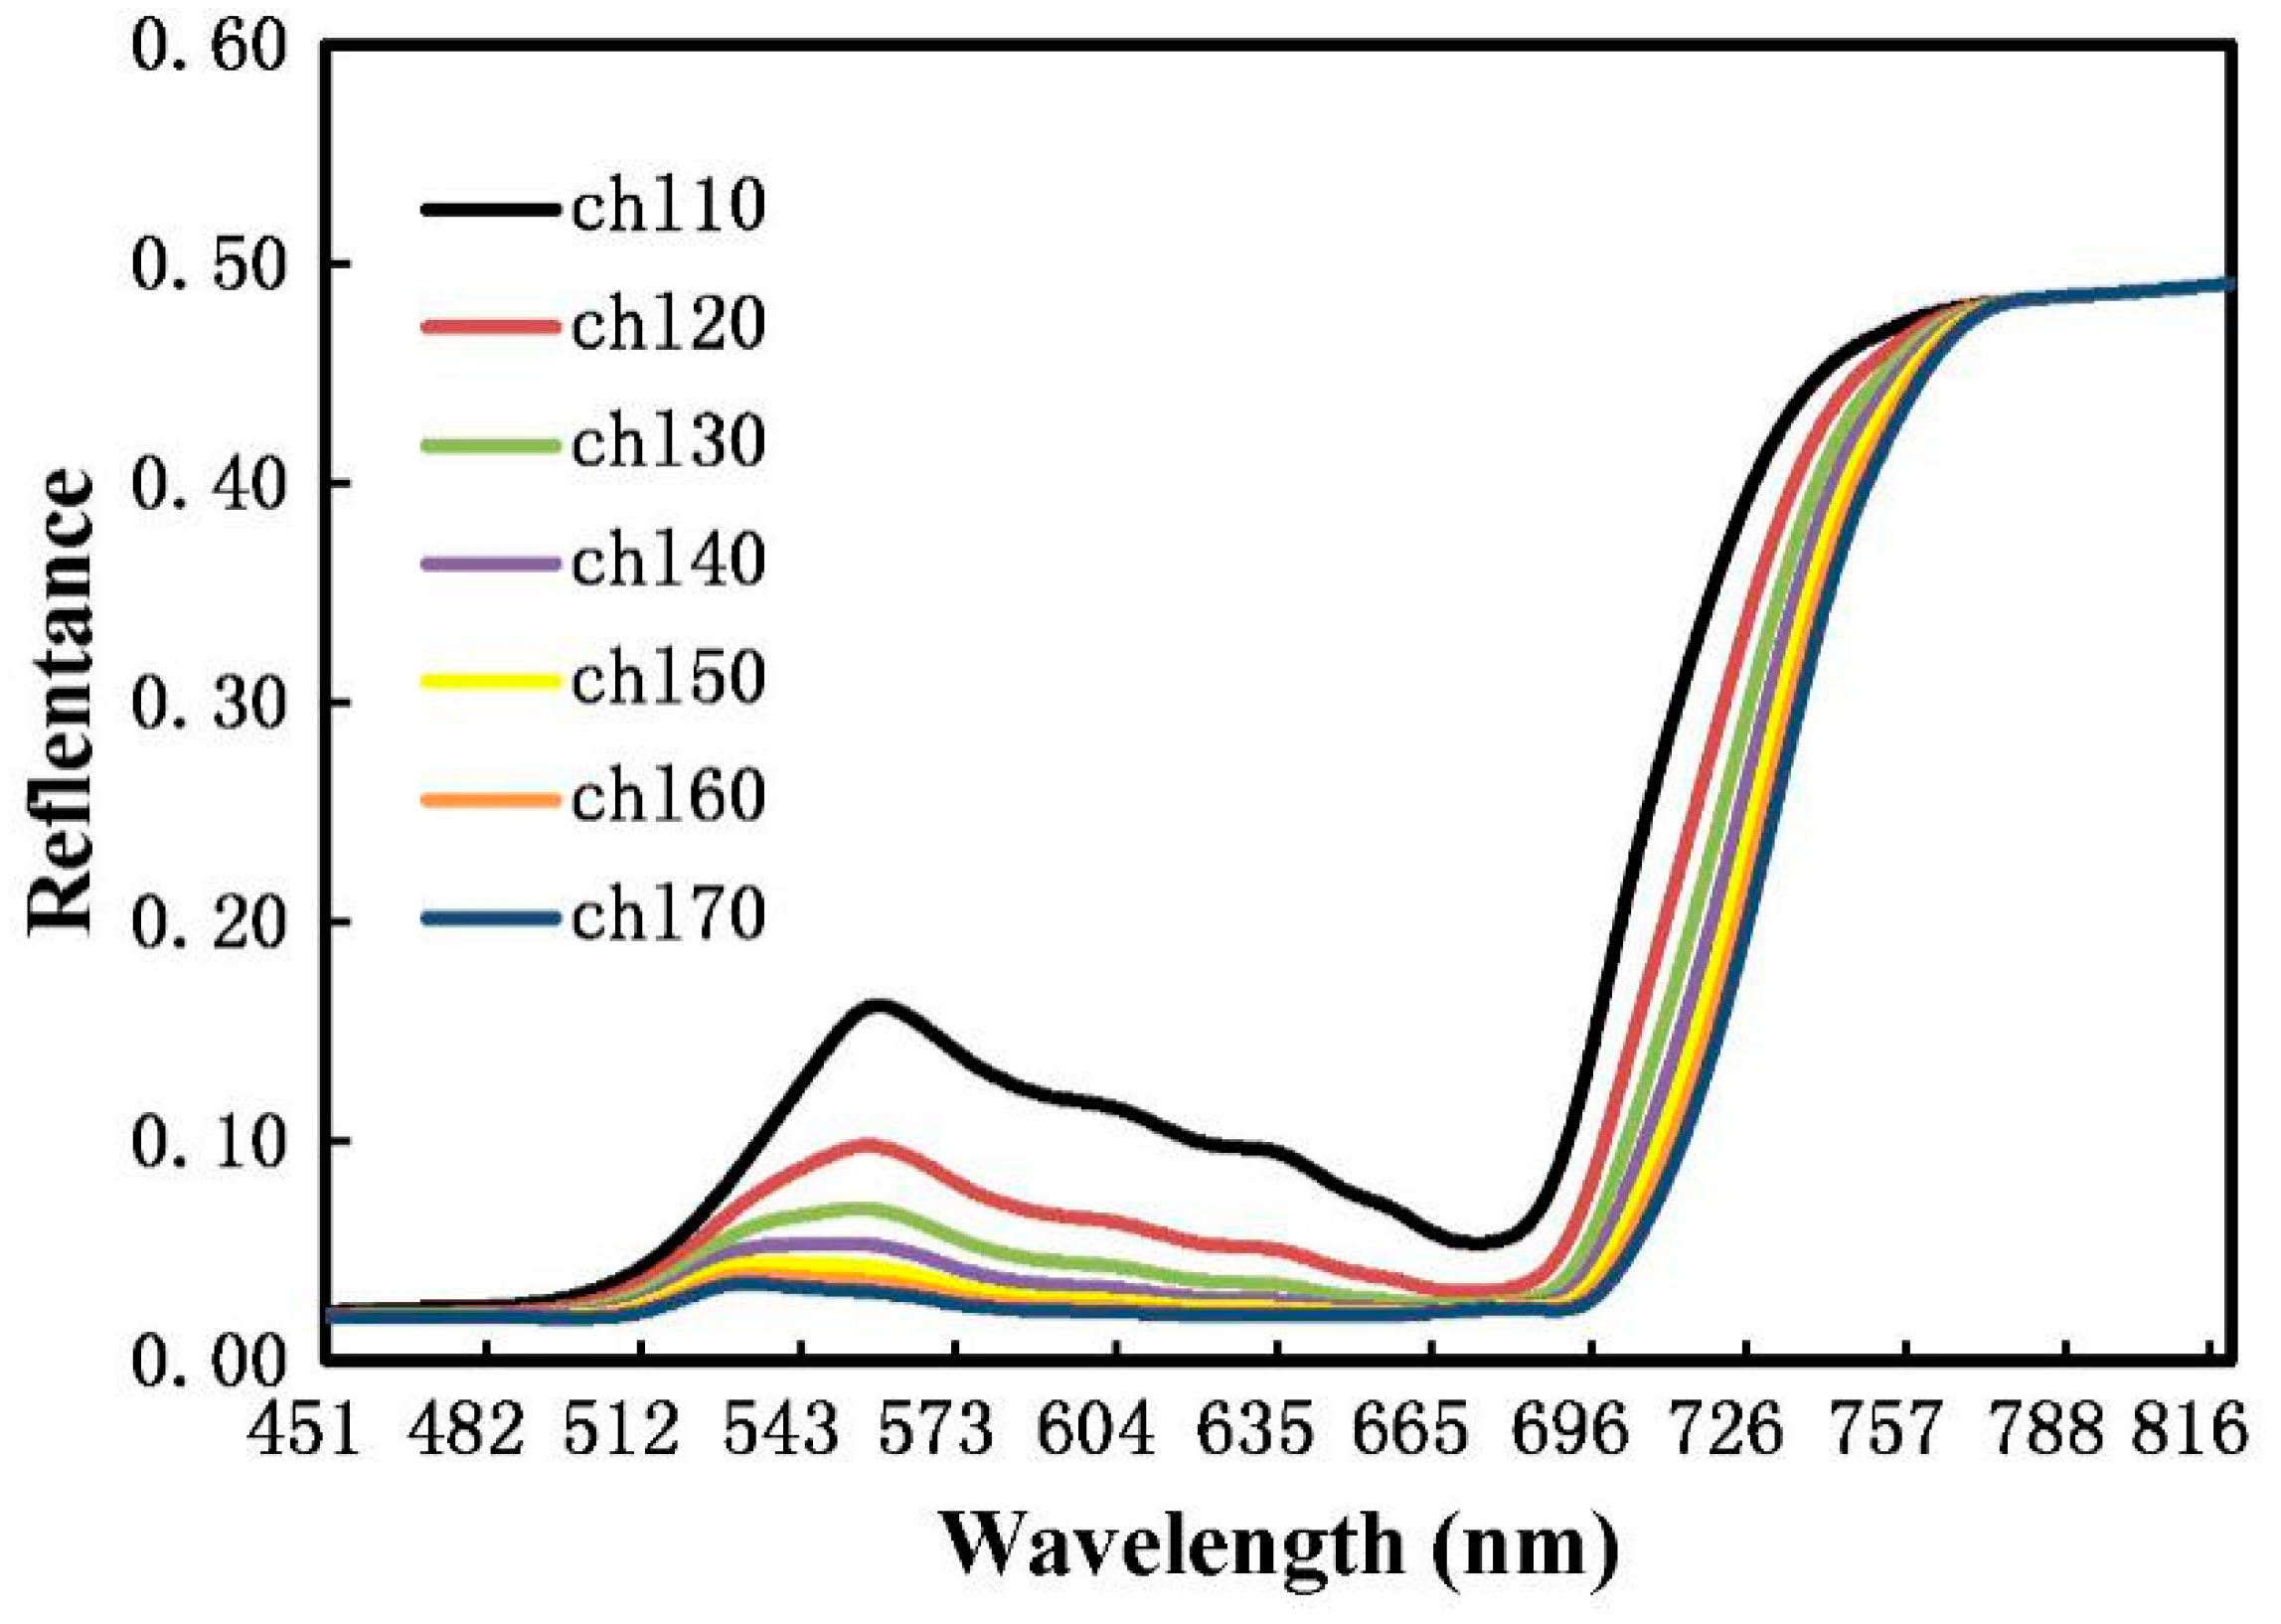
Figure 1. Crop canopy spectral reflectance with various LCCs, as simulated by the combined PROSPECT leaf optical properties model and SAIL canopy bidirectional reflectance model (PROSAIL) model.
Remotesensing 11 00974 g001
Figure 2. Relative difference in canopy reflectance [32]. (a) Difference between reflectance spectra corresponding to various chlorophyll contents and reflectance spectra corresponding to LCC = 70 μg cm2. In the legend, Chl 30–70 is the difference between the reflectance spectra corresponding to LCC = 30 and 70 μg cm2. (b) Difference between reflectance spectra representing various LAI values and the spectrum corresponding to LAI = 8. The legend follows the same format as in the left panel.
Remotesensing 11 00974 g002
Figure 3. (al) The scatterplots between measured LCC versus CIgreen, CIred-edge, MTCI, R-M, DCNI I, MCARI/OSAVI, TCARI/OSAVI, TCI/OSAVI, RECAI, RECAI/OSAVI, RECAI/TVI, and RECAI/MTVI2 for the 2002 + 2010 combined calibration dataset (n = 365), respectively.
Remotesensing 11 00974 g003
Figure 4. (al) The validation scatterplots between measured and predicted LCC by CIgreen, CIred-edge, MTCI, R-M, DCNI I, MCARI/OSAVI, TCARI/OSAVI, TCI/OSAVI, RECAI, RECAI/OSAVI, RECAI/TVI, and RECAI/MTVI2 for the dataset (n = 91), respectively.
Remotesensing 11 00974 g004
Figure 5. Influence of different field management measures on RECAI/TVI. (a), (b), (c), (d), (e), (f) stand for the scatter plots between RECAI/TVI and LCC under different crop varieties (2002), crop varieties (2010), nitrogen fertilization densities (2002), nitrogen fertilization densities (2010), water treatments, and bowing date treatments, respectively.
Remotesensing 11 00974 g005
Table 1. Descriptions of the winter wheat experimental design in 2001–2002.
WaterW1
(0 m3 ha−1)
W2
(225 m3 ha−1)
W3
(450 m3 ha−1)
W4
(675 m3 ha−1)
Variety
N fertilizer
N1
(0 kg ha−1)
12133637Zhongyou 9507
11143538Jing 9428
10153439Jingdong 8
N2
(150 kg ha−1)
9163340Zhongyou 9507
8173241Jing 9428
7183142Jingdong 8
N3
(300 kg ha−1)
6193043Zhongyou 9507
5202944Jing 9428
4212845Jingdong 8
N4
(450 kg ha−1)
3222746Zhongyou 9507
2232647Jing 9428
11242548Jingdong 8
1 The numbers represent the sequence numbers of different plots.
Table 2. Descriptions of the winter wheat experimental design in 2009–2010.
Sowing Date Variety
25 September5 October15 October
N fertilizer56 kg ha−121 1/ 2///Nongda 195
109////Jing 9428
1817////Jingdong 13
82 kg ha−143////Nongda 195
1211////Jing 9428
2019////Jingdong 13
109 kg ha−16526253231Nongda 195
141328273433Jing 9428
222130293635Jingdong 13
135 kg ha−187////Nongda 195
1615////Jing 9428
2423////Jingdong 13
1 The numbers stand for the sequence numbers of different plots. 2 / stands for no plot.
Table 3. Results of the statistical analysis of the measured winter wheat LCC (mg g−1) and LAI.
DatasetsParameterMeanMin Max SD CV (%)n
2002LCC3.102 1.832 6.439 1.01432.688 288
LAI2.311 0.4344.859 1.017 43.995288
2010LCC2.9131.066 5.879 0.92531.741 168
LAI2.069 0.394 5.374 0.869 42.030168
LCC = leaf chlorophyll content; LAI = leaf area index; Min = the minimum value; Max = the maximum value; SD = the standard deviation; CV = the coefficient of variation; n = the number of samples.
Table 4. Spectral indices used in this study.
IndexFormulaReference
Green chlorophyll index (CIgreen)R783/R550 − 1[11,20]
Red-edge chlorophyll index (CIred-edge)R783/R705 − 1[11,20]
Moderate-resolution imaging spectrometer terrestrial chlorophyll index (MTCI)(R750 − R710)/(R710 − R680)[23]
Red-edge model index (R-M)(R750/R720) − 1[11]
Double-peak canopy nitrogen index I (DCNI I)[(R750 − R670+0.09)(R750 − R700)]/(R700 − R670)[25]
The modified chlorophyll absorption ratio index/optimized soil-adjusted vegetation index (MCARI/OSAVI)[(R700 − R670) − 0.2(R700 − R550)](R700/R670)/[1.16(R800-R670)/(R800+R670+0.16)][32]
The transformed chlorophyll absorption in the reflectance index/optimized soil-adjusted vegetation index (TCARI/OSAVI)3[(R700 − R670) − 0.2(R700 − R550)(R700/R670)]/[1.16(R800 − R670)/(R800+R670+0.16)][19]
The triangular chlorophyll index/optimized soil-adjusted vegetation index (TCI/OSAVI) [ 1.2 ( R 700 R 550 ) 1.5 ( R 670 R 550 ) ( R 700 / R 670 ) ] /[1.16(R800 − R670)/(R800+R670+0.16)][32]
The red-edge-chlorophyll absorption index (RECAI)(R800 − R720)/R550*(R700/R550)This study
The red-edge-chlorophyll absorption index/ optimized soil-adjusted vegetation index (RECAI/OSAVI)RECAI/OSAVIThis study
The red-edge-chlorophyll absorption index/ the triangular vegetation index (RECAI/TVI)100RECAI/TVIThis study
The red-edge-chlorophyll absorption index/ the modified triangular vegetation index (RECAI/MTVI2)RECAI/MTVI2This study
Table 5. Pearson correlation coefficients (r values) between spectral indices and winter wheat LCC and LAI.
0 < LAI < 1
(n1 = 52)
1 ≤ LAI < 2
(n = 143)
2 ≤ LAI < 3
(n = 154)
3 ≤ LAI < 4
(n = 94)
LAI ≥ 4
(n = 13)
LCCLAILCCLAILCCLAILCCLAILCCLAI
CIgreen0.665 **0.422 **0.468 **0.469 **0.426 **0.366 **0.692 **0.0140.613 *0.116
CIred-edge0.661 **0.422 **0.465 **0.481 **0.464 **0.346 **0.725 **−0.0040.581 *0.182
MTCI0.526 **0.2330.432 **0.453 **0.454 **0.293 **0.758 **−0.1110.673 *−0.043
R-M0.664 **0.426 **0.486 **0.497 **0.485 **0.347 **0.746 **−0.0240.630 *0.085
DCNI I0.1020.333 *0.0220.508 **0.177 *0.388 **0.533 **0.0780.3590.049
MCARI/OSAVI−0.570 **0.185−0.526 **−0.150−0.524 **0.146−0.519 **0.364 **−0.5230.249
TCARI/OSAVI−0.668 **0.054−0.652 **−0.246 **−0.669 **0.040−0.676 **0.264 *−0.568 *0.017
TCI/OSAVI−0.608 **0.155−0.588 **-0.148−0.585 **0.133−0.568 **0.338 **−0.5510.186
RECAI0.688 **0.398 **0.542 **0.427 **0.454 **0.357 **0.698 **−0.0090.730 **−0.103
RECAI/OSAVI0.621 **0.2550.545 **0.341 **0.450 **0.335 **0.693 **−0.0410.750 **−0.207
RECAI/TVI0.777 **0.0290.819 **0.1090.708 **0.0530.722 **−0.1670.730 **−0.106
RECAI/MTVI20.615 **0.2380.535 **0.353 **0.445 **0.342 **0.694 **−0.0350.742 **−0.177
** and * indicate significance at the 0.01 and 0.05 levels, respectively. 1 n is the number of samples. CIgreen = green chlorophyll index, CIred-edge = red-edge chlorophyll index, MTCI = moderate-resolution imaging spectrometer terrestrial chlorophyll index, R-M = red-edge model index, DCNI I = double-peak canopy nitrogen index I; MCARI/OSAVI = the modified chlorophyll absorption ratio index/optimized soil-adjusted vegetation index, TCARI/OSAVI = the transformed chlorophyll absorption in the reflectance index/optimized soil-adjusted vegetation index, TCI/OSAVI = the triangular chlorophyll index/ optimized soil-adjusted vegetation index, RECAI = the red-edge-chlorophyll absorption index, RECAI/OSAVI = the red-edge-chlorophyll absorption index/ optimized soil-adjusted vegetation index, RECAI/TVI = the red-edge-chlorophyll absorption index/ the triangular vegetation index, and RECAI/MTVI2 = the red-edge-chlorophyll absorption index/ the modified triangular vegetation index.
Table 6. Correlation coefficients (r) between (i) TVI, OSAVI, MTVI2 and (ii) LCC, LAI for the 2002, 2010, and 2002+2010 datasets.
LCCLAI
TVI−0.193 **0.167 *−0.0370.800 **0.735 **0.779 **
OSAVI0.308 **0.220 **0.326 **0.799 **0.643 **0.764 **
MTVI20.307 **0.370 **0.269 **0.761 **0.720 **0.690 **
** Indicates significance at the 0.01 level; * indicates significance at the 0.05 level. N = 288, 168, and 456 for the 2002, 2010, and 2002+2010 datasets, respectively.