An Assessment of Global Precipitation and Evapotranspiration Products for Regional Applications


Abstract
:1. Introduction
2. Study Area and Methods
2.1. The Murray Darling Basin
2.2. Data and Processing
2.2.1. Reference Data on P and ET
2.2.2. Global P and ET Data Products
2.2.3. Data Processing
2.3. Methods
2.3.1. Temporal Disparities at Basin Scale
2.3.2. Spatio-Temporal Disparities across the Catchments
2.3.3. Impacts of Catchment Characteristics
3. Results
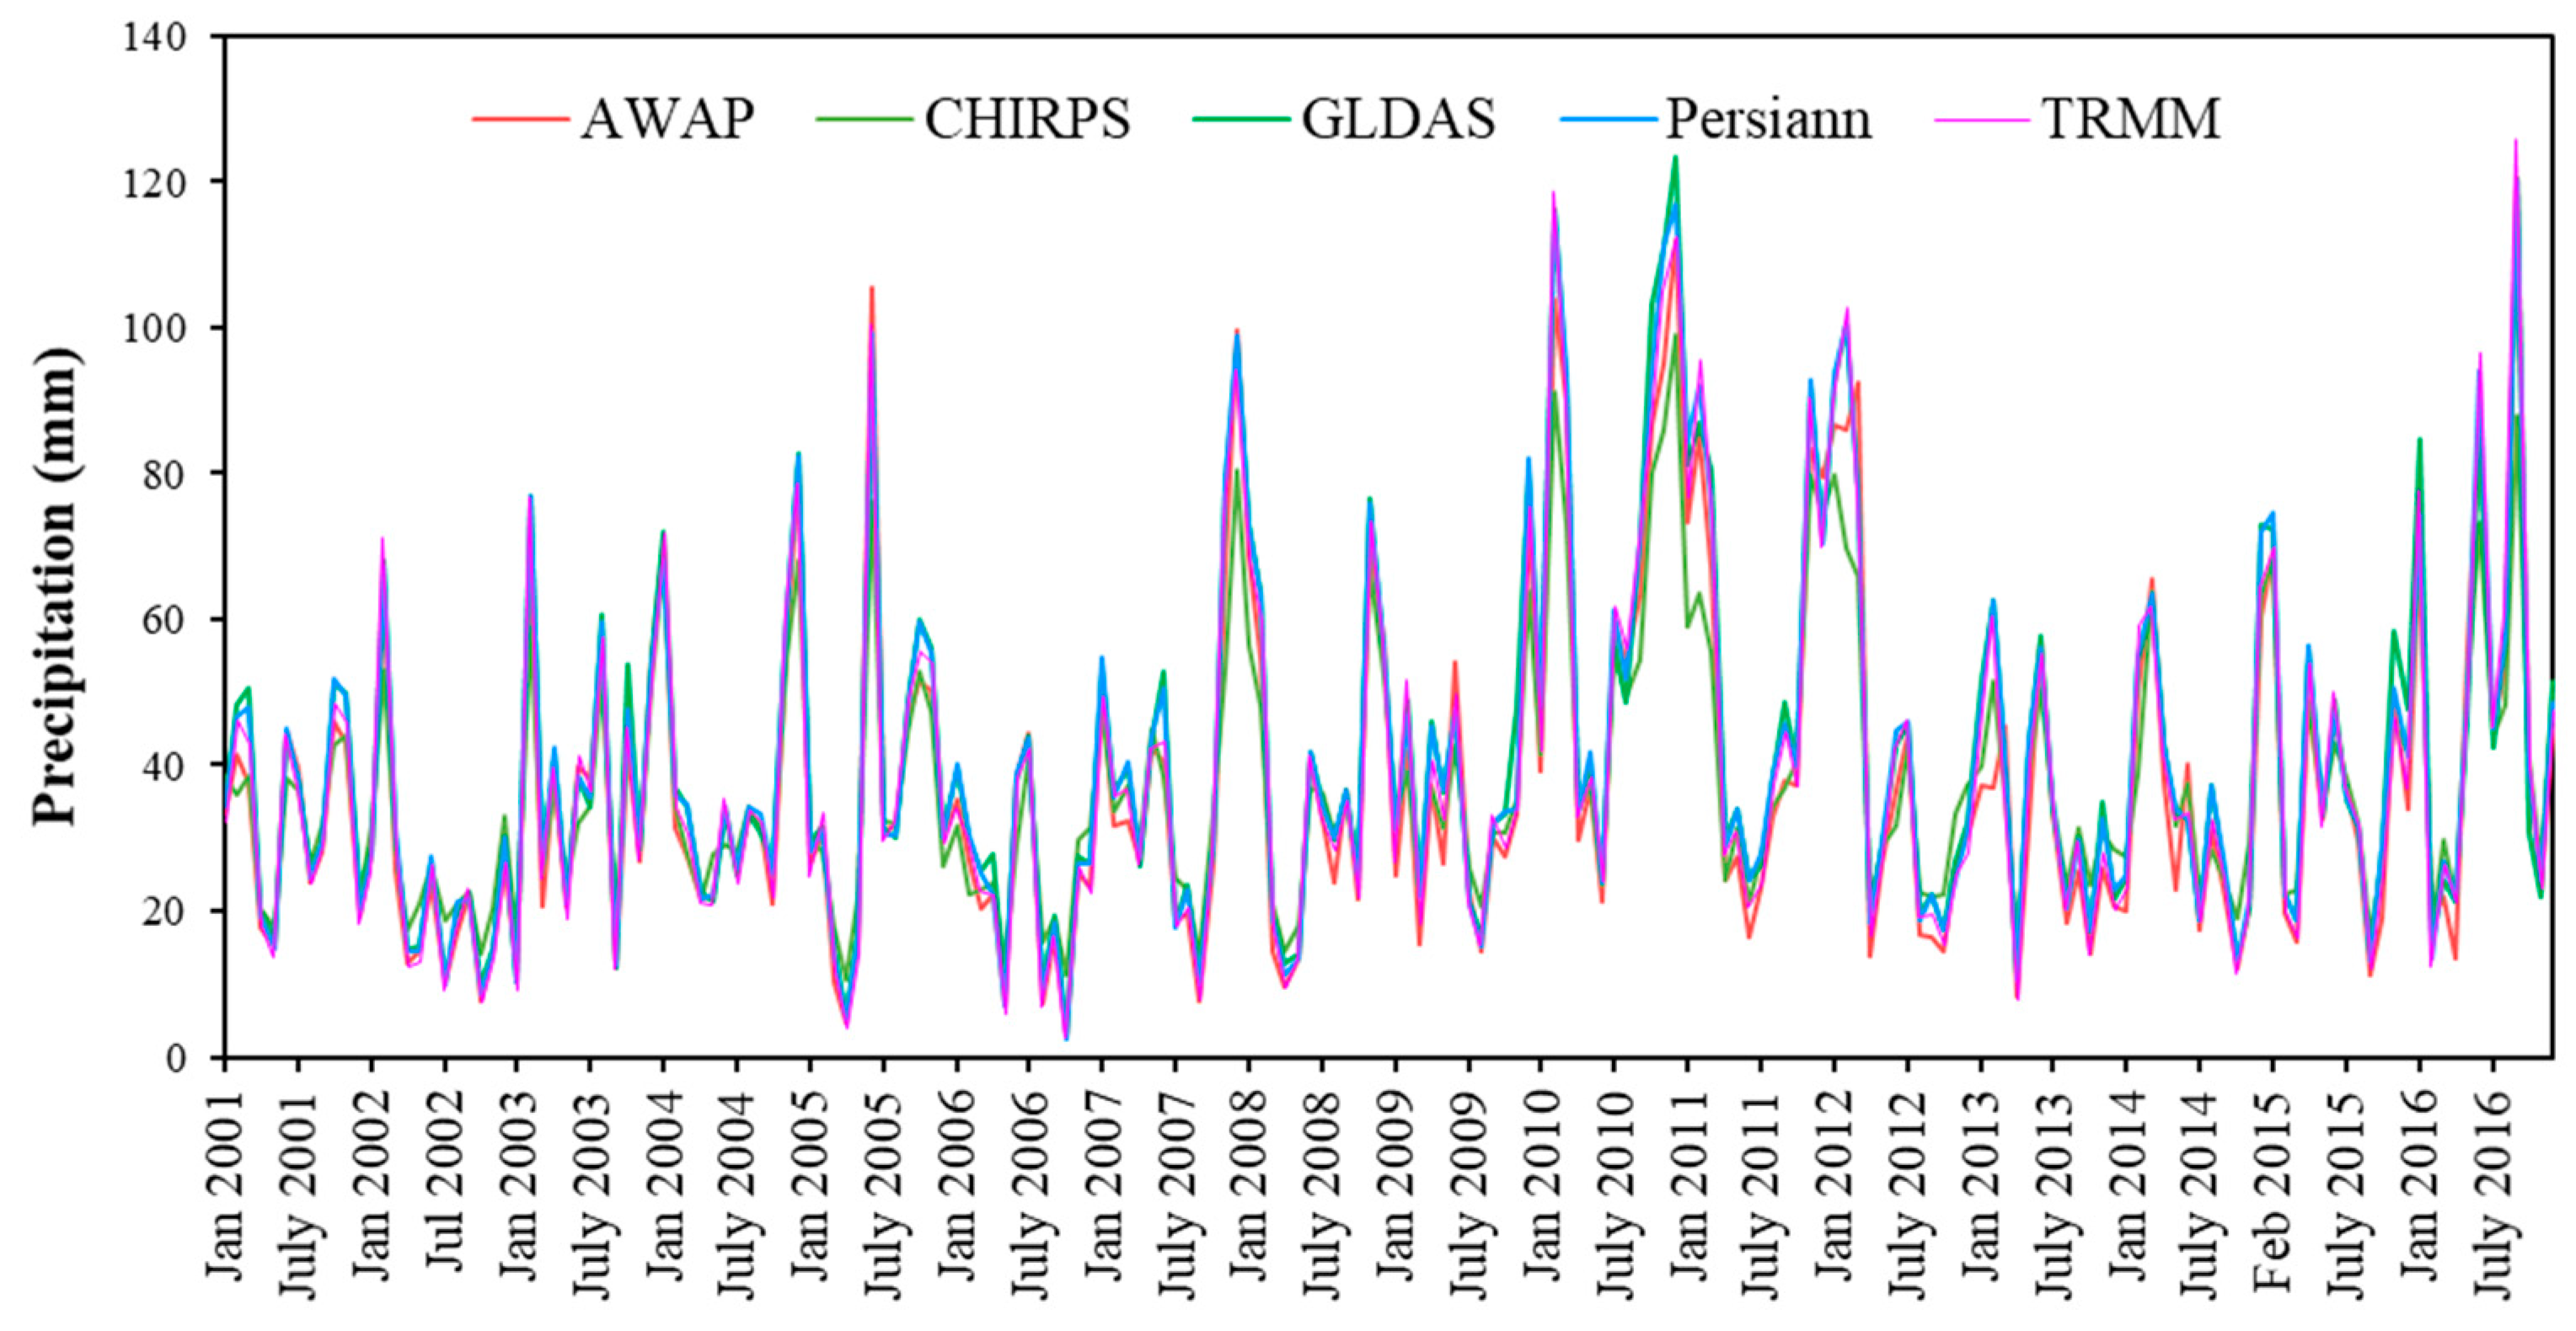
3.1. Temporal Disparities at Basin Scale
3.1.1. Precipitations
3.1.2. Evapotranspiration
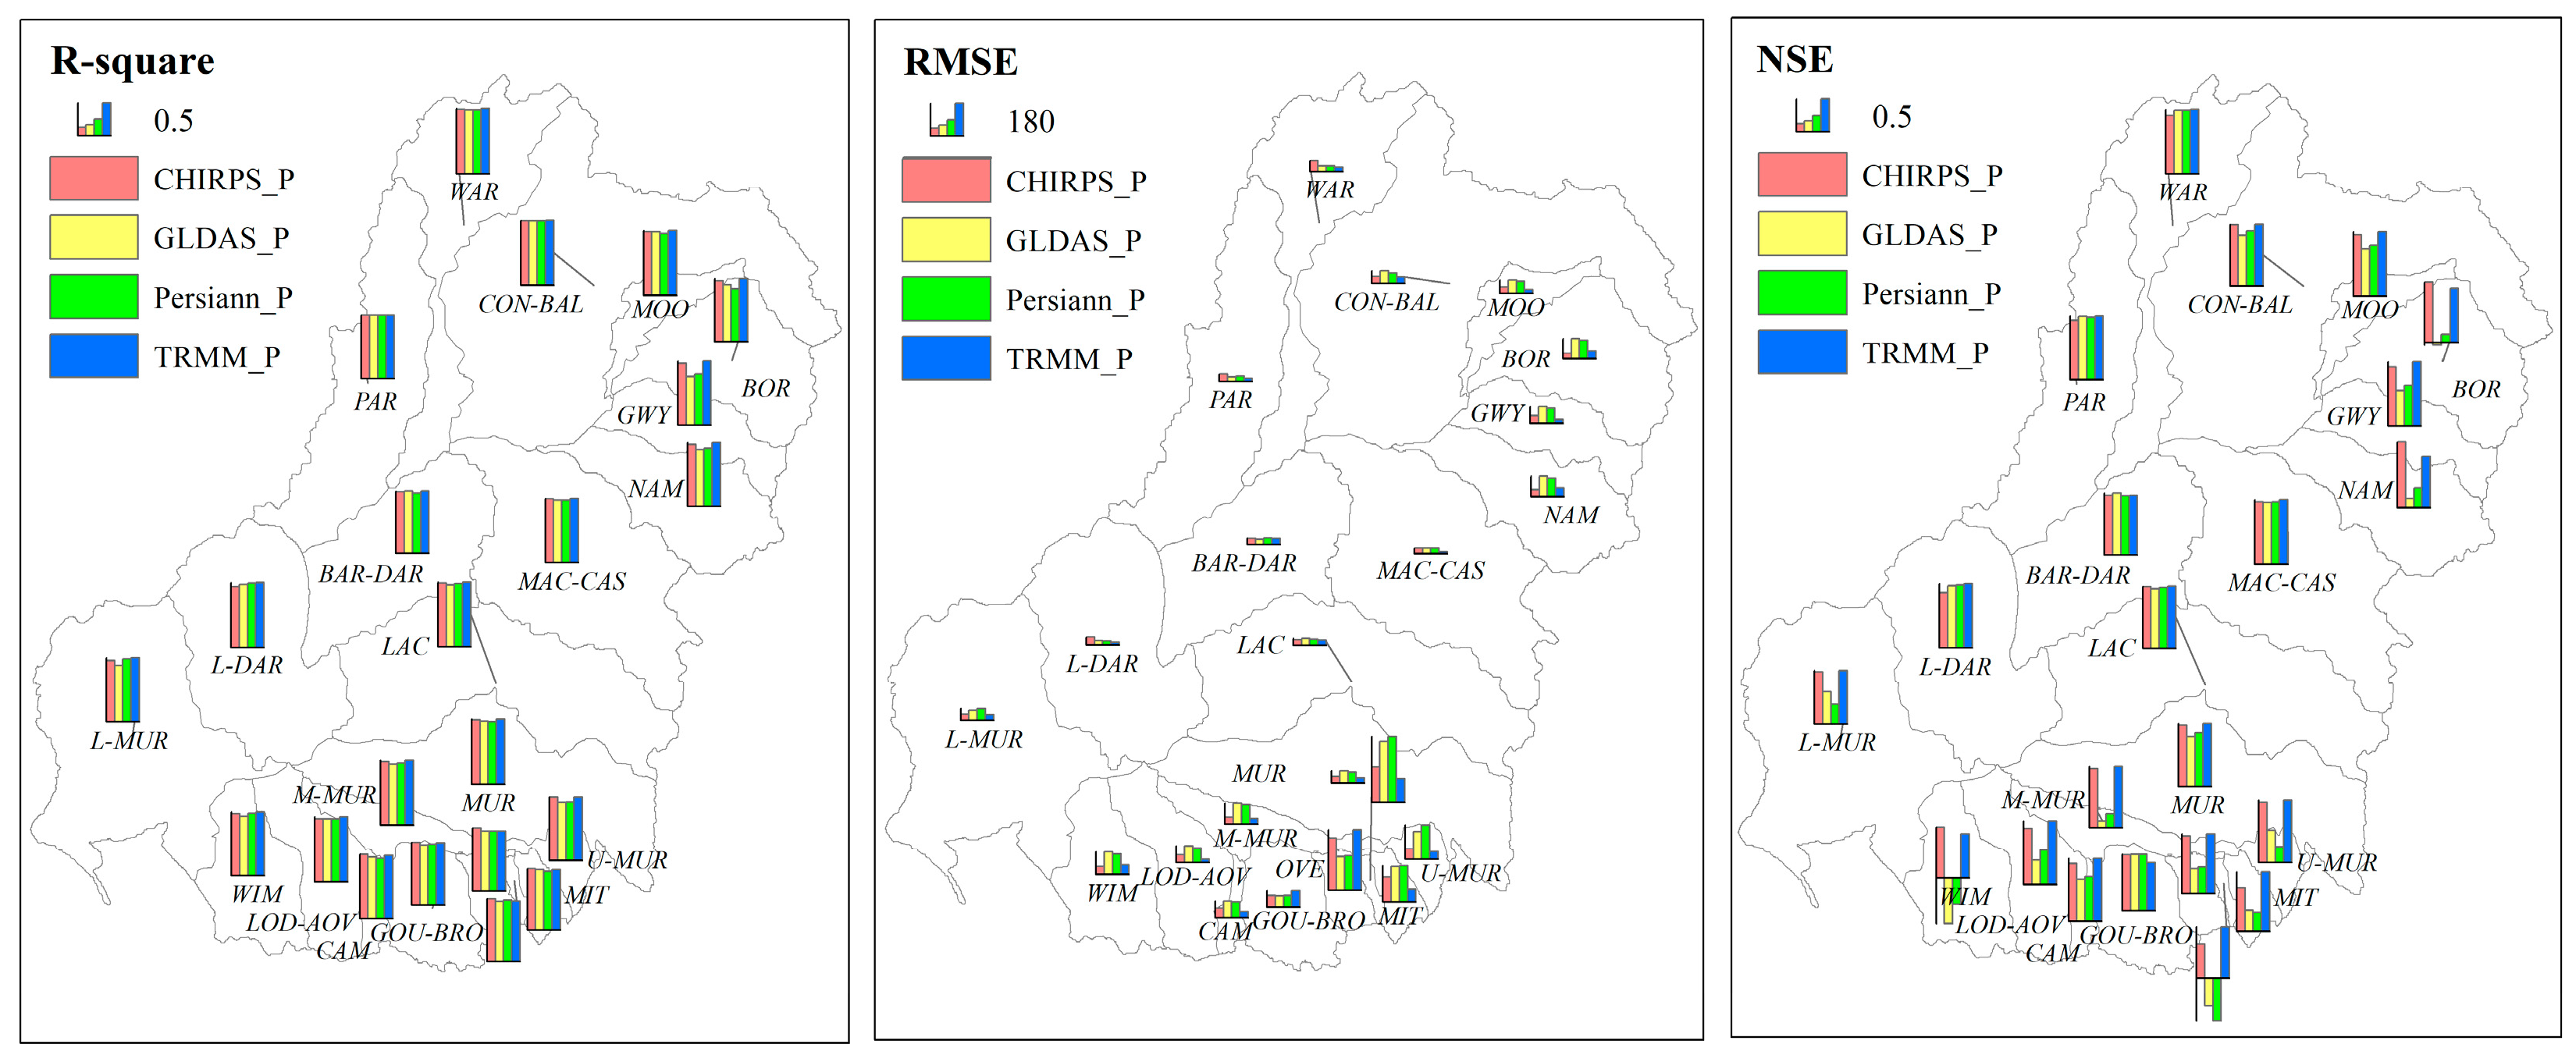
3.2. Spatio-Temporal Disparities Across the Catchments
3.2.1. Precipitations
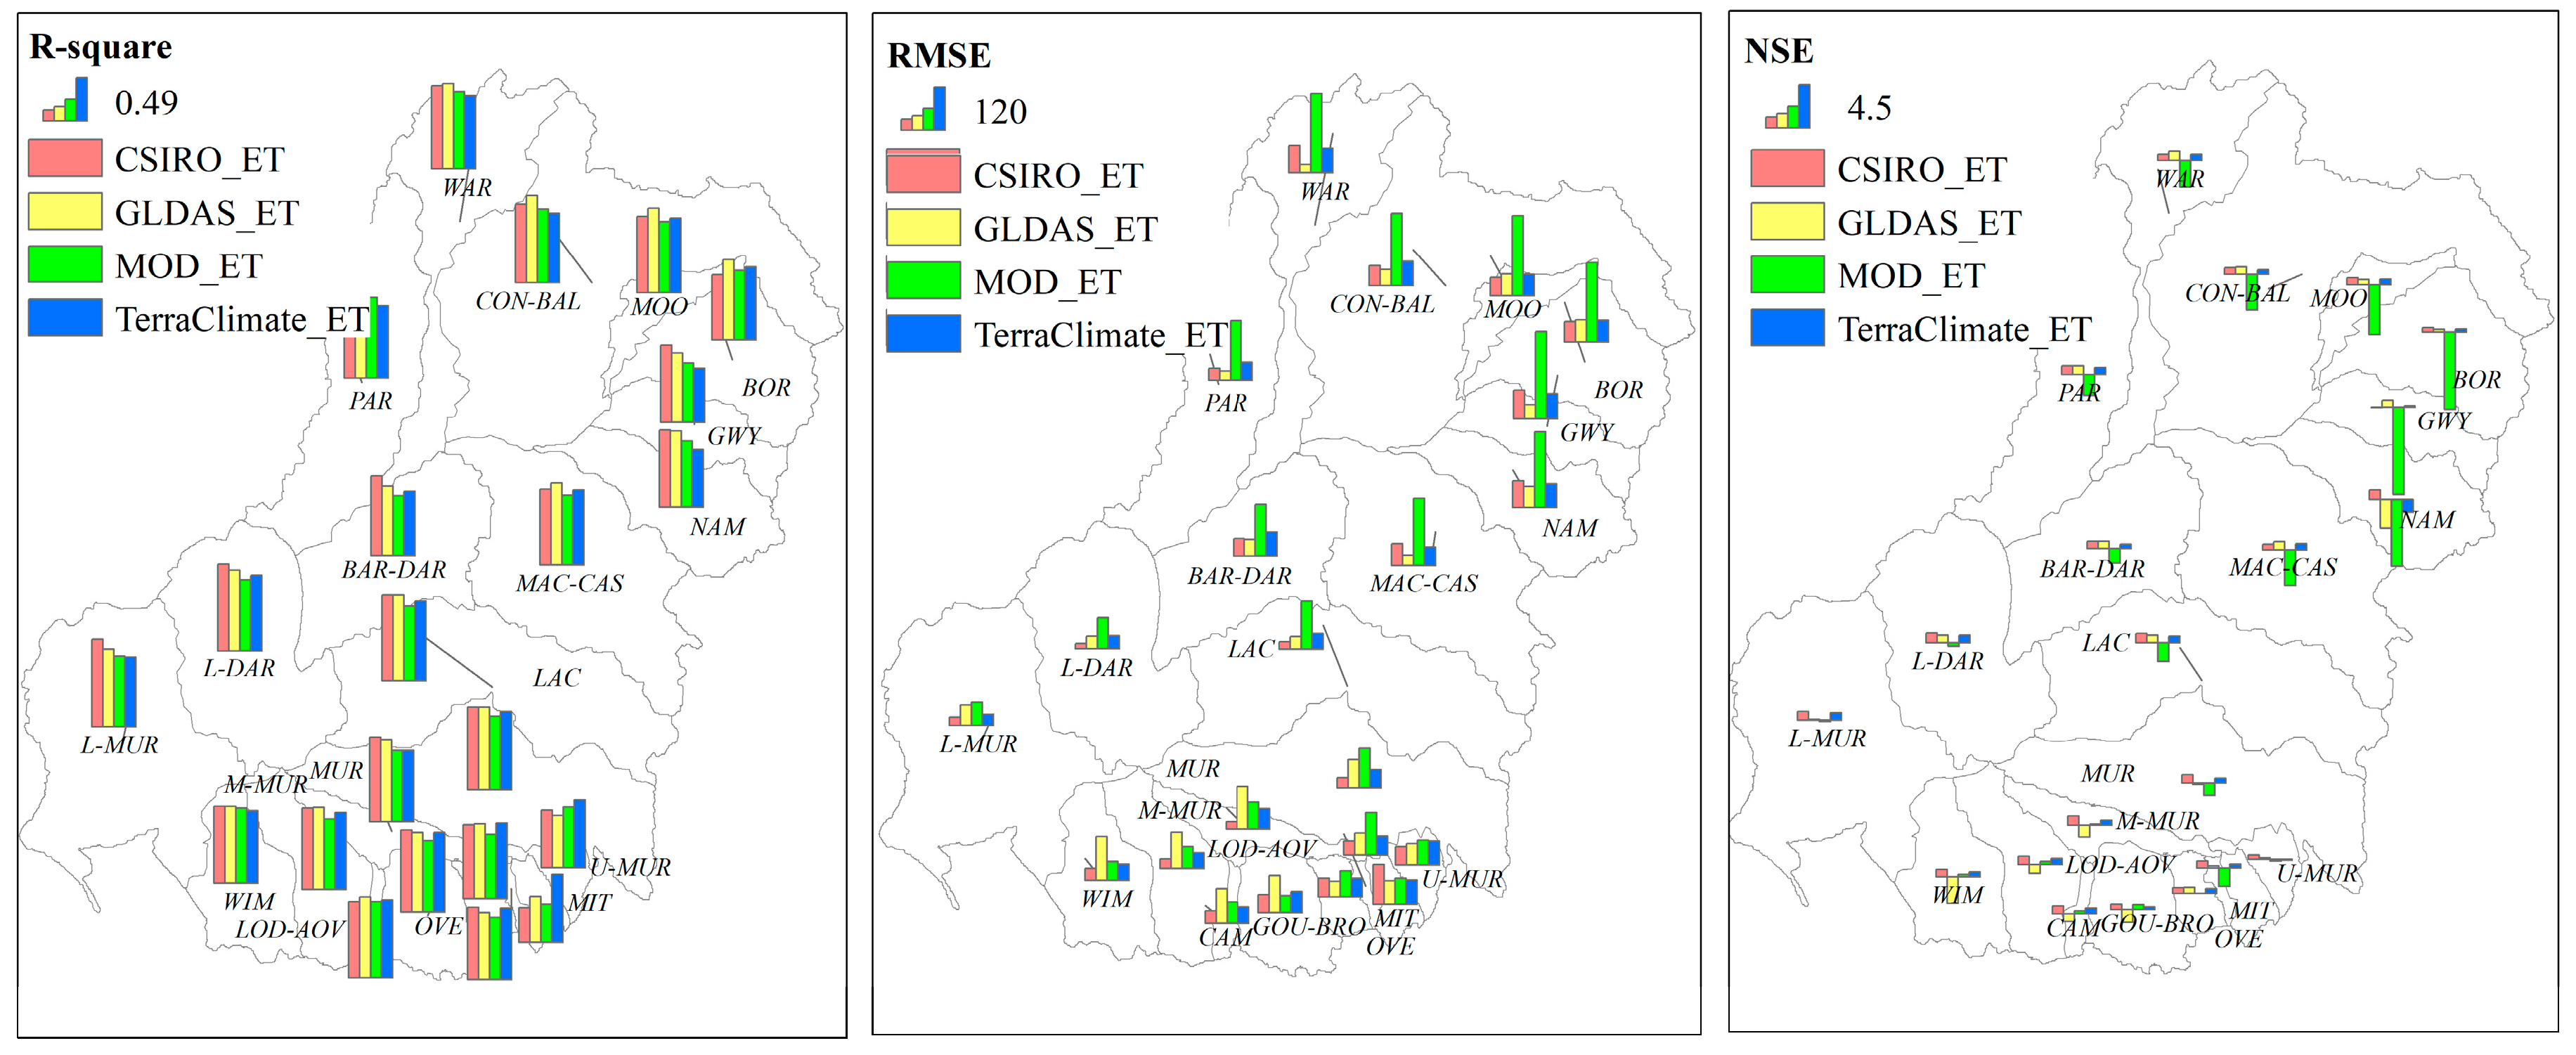
3.2.2. Evapotranspiration
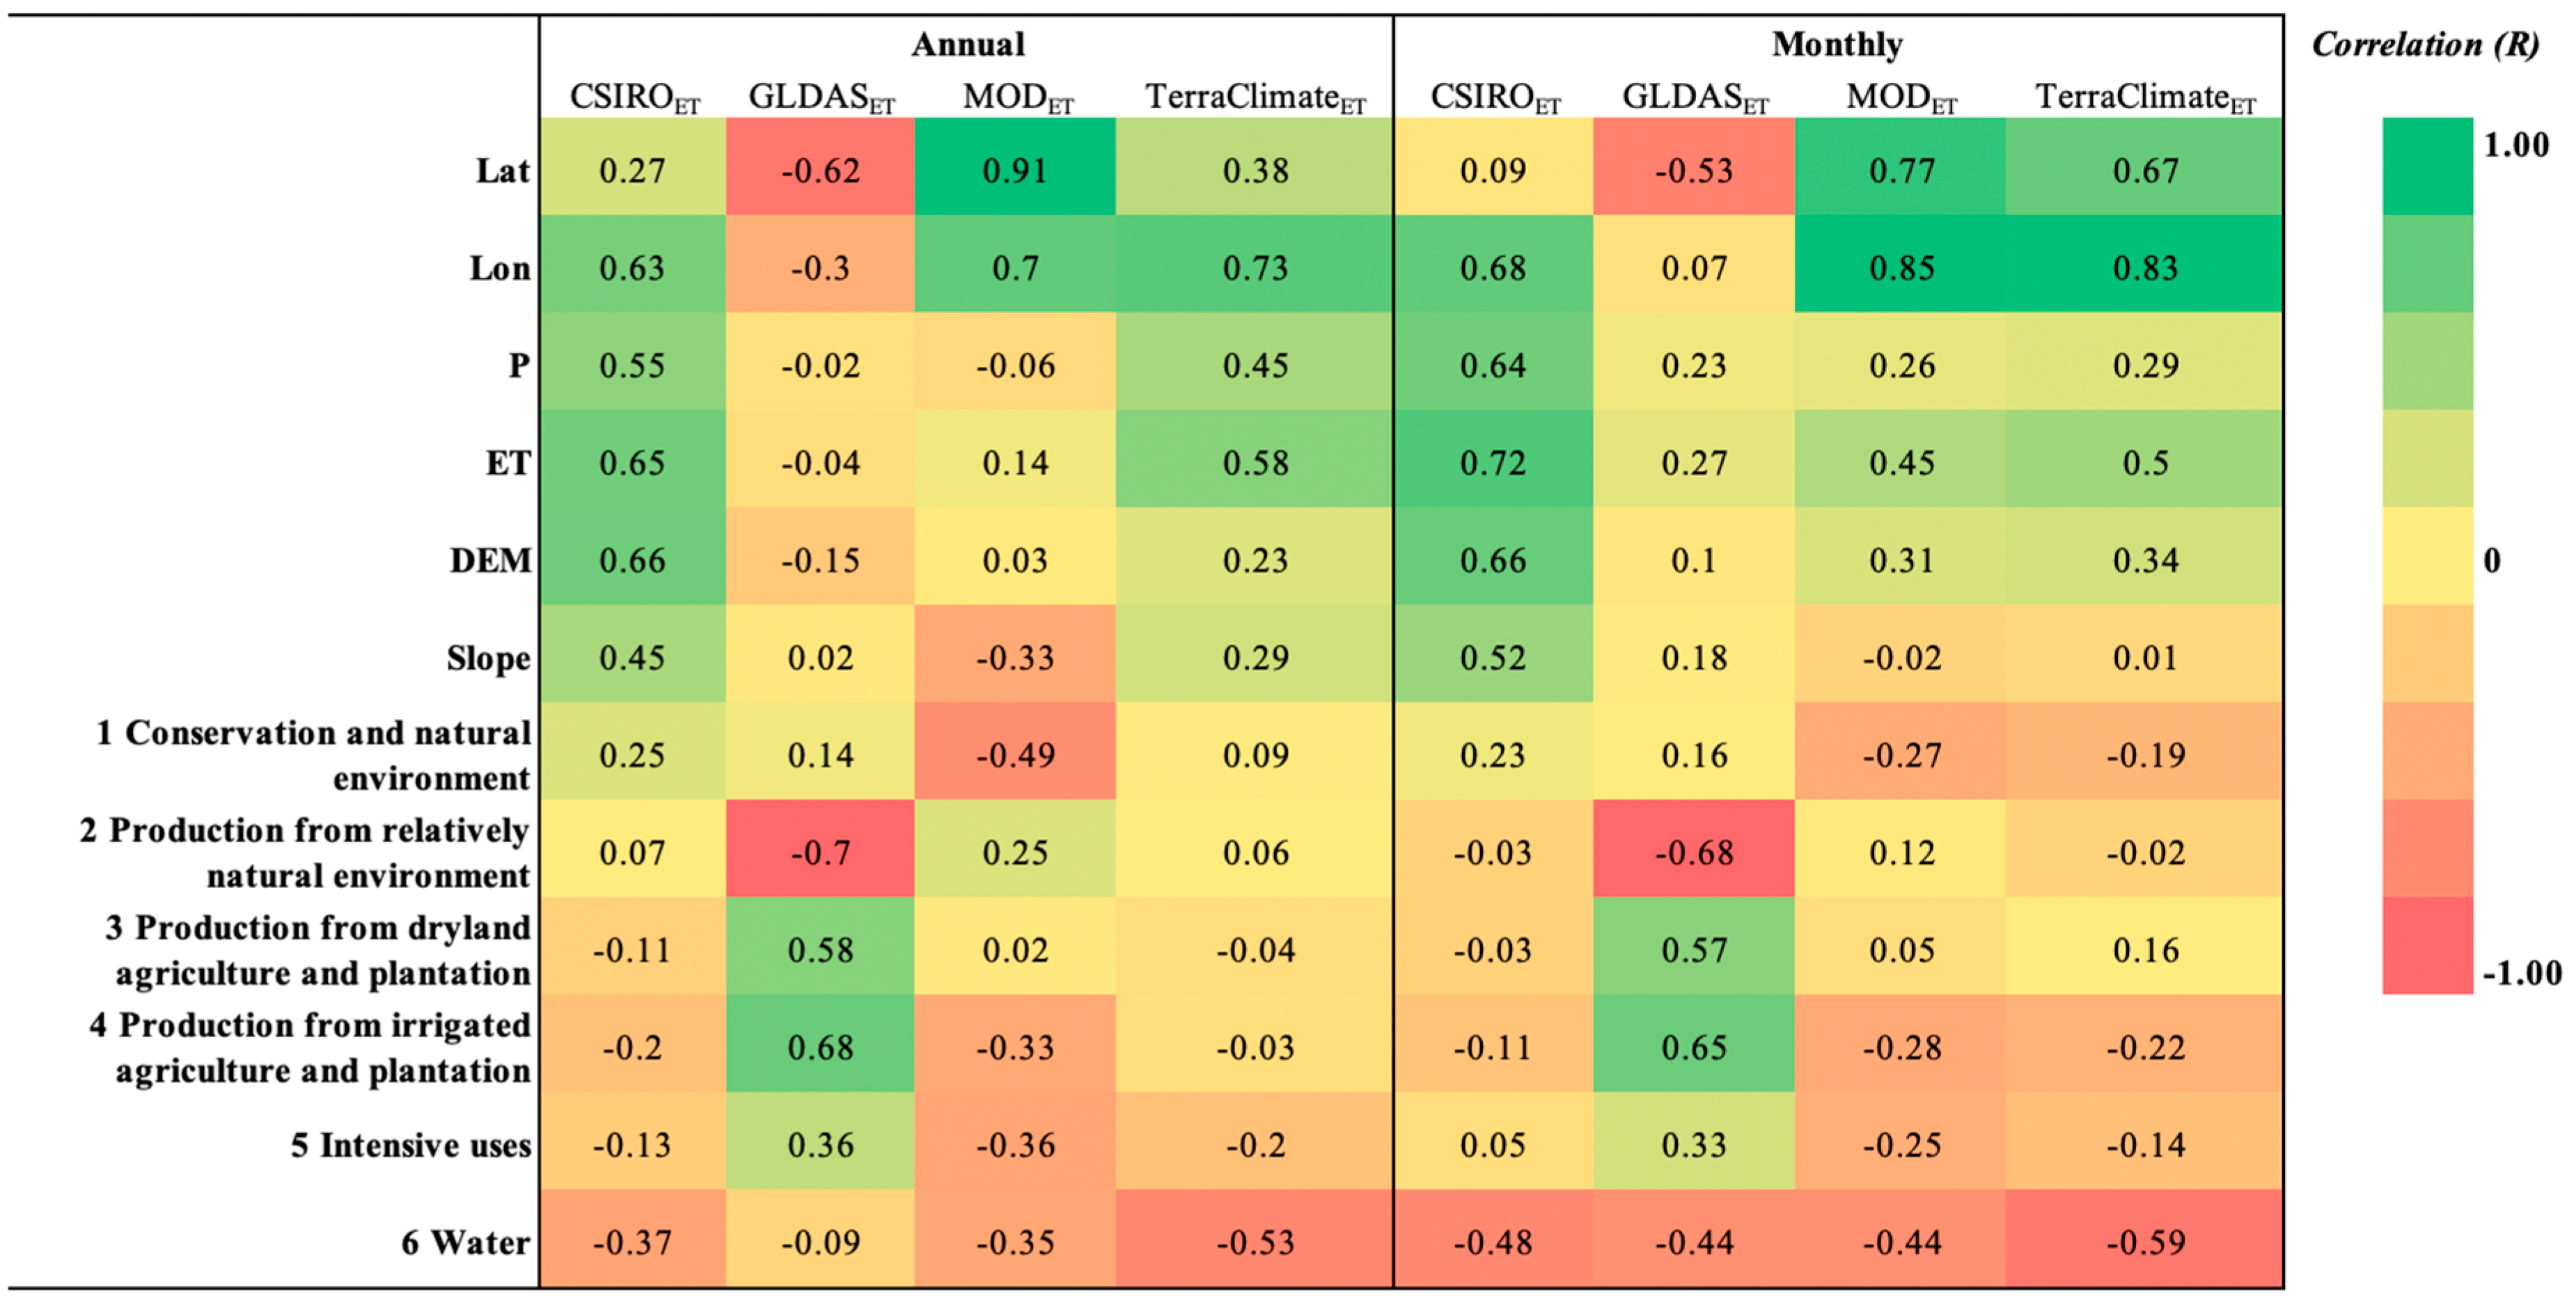
3.3. Impacts of Catchment Characteristics
4. Discussion
4.1. Evaluation of Global P Products
4.2. Evaluation of ET Products
4.3. Implications
5. Conclusions
Supplementary Materials
Author Contributions
Funding
Conflicts of Interest
References
- Fisher, J.B.; Melton, F.; Middleton, E.; Hain, C.; Anderson, M.; Allen, R.; McCabe, M.F.; Hook, S.; Baldocchi, D.; Townsend, P.A.; et al. The future of evapotranspiration: Global requirements for ecosystem functioning, carbon and climate feedbacks, agricultural management, and water resources. Water Resour. Res. 2017, 53, 2618–2626. [Google Scholar] [CrossRef] [Green Version]
- Hou, A.Y.; Kakar, R.K.; Neeck, S.; Azarbarzin, A.A.; Kummerow, C.D.; Kojima, M.; Oki, R.; Nakamura, K.; Iguchi, T. The Global Precipitation Measurement Mission. Bull. Am. Meteorol. Soc. 2013, 95, 701–722. [Google Scholar] [CrossRef]
- Wang, K.; Liang, S. An Improved Method for Estimating Global Evapotranspiration Based on Satellite Determination of Surface Net Radiation, Vegetation Index, Temperature, and Soil Moisture. J. Hydrometeorol. 2008, 9, 712–727. [Google Scholar] [CrossRef]
- Franchito, S.H.; Rao, V.B.; Vasques, A.C.; Santo, C.M.E.; Conforte, J.C. Validation of TRMM precipitation radar monthly rainfall estimates over Brazil. J. Geophys. Res. Atmos. 2009, 114. [Google Scholar] [CrossRef] [Green Version]
- Thiemig, V.; Rojas, R.; Zambrano-Bigiarini, M.; De Roo, A. Hydrological evaluation of satellite-based rainfall estimates over the Volta and Baro-Akobo Basin. J. Hydrol. 2013, 499, 324–338. [Google Scholar] [CrossRef]
- Tan, M.L.; Santo, H. Comparison of GPM IMERG, TMPA 3B42 and PERSIANN-CDR satellite precipitation products over Malaysia. Atmos. Res. 2018, 202, 63–76. [Google Scholar] [CrossRef]
- Dinku, T.; Connor, S.J.; Ceccato, P.; Ropelewski, C.F. Comparison of global gridded precipitation products over a mountainous region of Africa. Int. J. Climatol. 2008, 28, 1627–1638. [Google Scholar] [CrossRef] [Green Version]
- Mu, Q.; Zhao, M.; Running, S.W. Improvements to a MODIS global terrestrial evapotranspiration algorithm. Remote Sens. Environ. 2011, 115, 1781–1800. [Google Scholar] [CrossRef]
- Zhang, Y.; Peña-Arancibia, J.L.; McVicar, T.R.; Chiew, F.H.S.; Vaze, J.; Liu, C.; Lu, X.; Zheng, H.; Wang, Y.; Liu, Y.Y.; et al. Multi-decadal trends in global terrestrial evapotranspiration and its components. Sci. Rep. 2016, 6, 19124. Available online: https://www.nature.com/articles/srep19124#supplementary-information (accessed on 3 May 2019). [CrossRef] [Green Version]
- Merlin, O.; Chirouze, J.; Olioso, A.; Jarlan, L.; Chehbouni, G.; Boulet, G. An image-based four-source surface energy balance model to estimate crop evapotranspiration from solar reflectance/thermal emission data (SEB-4S). Agric. For. Meteorol. 2014, 184, 188–203. [Google Scholar] [CrossRef] [Green Version]
- Mu, Q.; Heinsch, F.A.; Zhao, M.; Running, S.W. Development of a global evapotranspiration algorithm based on MODIS and global meteorology data. Remote Sens. Environ. 2007, 111, 519–536. [Google Scholar] [CrossRef]
- Wan, Z.; Zhang, K.; Xue, X.; Hong, Z.; Hong, Y.; Gourley, J.J. Water balance-based actual evapotranspiration reconstruction from ground and satellite observations over the conterminous United States. Water Resour. Res. 2015, 51, 6485–6499. [Google Scholar] [CrossRef] [Green Version]
- Abatzoglou, J.T.; Dobrowski, S.Z.; Parks, S.A.; Hegewisch, K.C. TerraClimate, a high-resolution global dataset of monthly climate and climatic water balance from 1958–2015. Sci. Data 2018, 5, 170191. Available online: https://www.nature.com/articles/sdata2017191#supplementary-information (accessed on 3 May 2019). [CrossRef]
- King, E.A.; Paget, M.J.; Niel, T.G.V.; Bastiaanssen, W.G.M.; Briggs, P.R.; Guerschman, J.; Haverd, V.; Li, L.T.; McVicar, T.R.; Miltenburg, I.; et al. Actual Evapotranspiration Datasets for Inter-Comparison and Evaluation; Bureau of Meteorology: Melbourne, Australia, 2011.
- Shen, Y.; Xiong, A.; Wang, Y.; Xie, P. Performance of high-resolution satellite precipitation products over China. J. Geophys. Res. Atmos. 2010, 115. [Google Scholar] [CrossRef] [Green Version]
- Rana, S.; McGregor, J.; Renwick, J. Precipitation Seasonality over the Indian Subcontinent: An Evaluation of Gauge, Reanalyses, and Satellite Retrievals. J. Hydrometeorol. 2015, 16, 631–651. [Google Scholar] [CrossRef]
- Zhao, T.; Yatagai, A. Evaluation of TRMM 3B42 product using a new gauge-based analysis of daily precipitation over China. Int. J. Climatol. 2014, 34, 2749–2762. [Google Scholar] [CrossRef]
- Abiodun, O.O.; Guan, H.; Post, V.E.A.; Batelaan, O. Comparison of MODIS and SWAT evapotranspiration over a complex terrain at different spatial scales. Hydrol. Earth Syst. Sci. 2018, 22, 2775–2794. [Google Scholar] [CrossRef] [Green Version]
- Jia, Z.; Liu, S.; Xu, Z.; Chen, Y.; Zhu, M. Validation of remotely sensed evapotranspiration over the Hai River Basin, China. J. Geophys. Res. Atmos. 2012, 117. [Google Scholar] [CrossRef] [Green Version]
- Raupach, M.R.; Briggs, P.R.; Haverd, V.; King, E.A.; Paget, M.; Trudinger, C.M. Australian Water Availability Project (AWAP): CSIRO Marine and Atmospheric Research Component: Final Report for Phase 3; CSIRO Marine and Atmospheric Research: Canberra, Australia, 2009. [Google Scholar]
- Jones, D.A.; Wang, W.; Fawcett, R. High-quality spatial climate data-sets for Australia. Aust. Meteorol. Oceanogr. J. 2009, 58, 232–248. [Google Scholar] [CrossRef]
- Tozer, C.R.; Kiem, A.S.; Verdon-Kidd, D.C. On the uncertainties associated with using gridded rainfall data as a proxy for observed. Hydrol. Earth Syst. Sci. 2012, 16, 1481–1499. [Google Scholar] [CrossRef] [Green Version]
- King, A.D.; Alexander, L.V.; Donat, M.G. The efficacy of using gridded data to examine extreme rainfall characteristics: A case study for Australia. Int. J. Climatol. 2013, 33, 2376–2387. [Google Scholar] [CrossRef]
- Funk, C.; Peterson, P.; Landsfeld, M.; Pedreros, D.; Verdin, J.; Shukla, S.; Husak, G.; Rowland, J.; Harrison, L.; Hoell, A.; et al. The climate hazards infrared precipitation with stations—A new environmental record for monitoring extremes. Sci. Data 2015, 2, 150066. [Google Scholar] [CrossRef] [PubMed]
- Rodell, M.; Houser, P.R.; Jambor, U.; Gottschalck, J.; Mitchell, K.; Meng, C.J.; Arsenault, K.; Cosgrove, B.; Radakovich, J.; Bosilovich, M.; et al. The Global Land Data Assimilation System. Bull. Am. Meteorol. Soc. 2004, 85, 381–394. [Google Scholar] [CrossRef] [Green Version]
- Huffman, G.J.; Bolvin, D.T.; Nelkin, E.J.; Wolff, D.B.; Adler, R.F.; Gu, G.; Hong, Y.; Bowman, K.P.; Stocker, E.F. The TRMM Multisatellite Precipitation Analysis (TMPA): Quasi-Global, Multiyear, Combined-Sensor Precipitation Estimates at Fine Scales. J. Hydrometeorol. 2007, 8, 38–55. [Google Scholar] [CrossRef]
- Adler, R.F.; Huffman, G.J.; Chang, A.; Ferraro, R.; Xie, P.-P.; Janowiak, J.; Rudolf, B.; Schneider, U.; Curtis, S.; Bolvin, D.; et al. The Version-2 Global Precipitation Climatology Project (GPCP) Monthly Precipitation Analysis (1979–Present). J. Hydrometeorol. 2003, 4, 1147–1167. [Google Scholar] [CrossRef] [Green Version]
- Ashouri, H.; Hsu, K.-L.; Sorooshian, S.; Braithwaite, D.K.; Knapp, K.R.; Cecil, L.D.; Nelson, B.R.; Prat, O.P. PERSIANN-CDR: Daily Precipitation Climate Data Record from Multisatellite Observations for Hydrological and Climate Studies. Bull. Am. Meteorol. Soc. 2014, 96, 69–83. [Google Scholar] [CrossRef]
- Wang-Erlandsson, L.; Bastiaanssen, W.G.M.; Gao, H.; Jagermeyr, J.; Senay, G.B.; van Dijk, A.I.J.M.; Guerschman, J.P.; Keys, P.W.; Gordon, L.J.; Savenije, H.H.G. Global root zone storage capacity from satellite-based evaporation. Hydrol. Earth Syst. Sci. 2016, 20, 1459–1481. [Google Scholar] [CrossRef]
- Richter, K.; Hank, T.B.; Atzberger, C.; Mauser, W. Goodness-of-fit measures: What do they tell about vegetation variable retrieval performance from Earth observation data. Proc. SPIE 2011. [Google Scholar] [CrossRef]
- Miller, S.W.; Arkin, P.A.; Joyce, R. A combined microwave/infrared rain rate algorithm. Int. J. Remote Sens. 2001, 22, 3285–3307. [Google Scholar] [CrossRef]
- Islam, M.A. Statistical comparison of satellite-retrieved precipitation products with rain gauge observations over Bangladesh. Int. J. Remote Sens. 2018, 39, 2906–2936. [Google Scholar] [CrossRef]


| Catchment | Code | Lat | Lon | P (mm/year) | ET (mm/year) | DEM (m) | Slope | Conservation & Natural Environments | Production from Relatively Natural Environments | Production from Dryland Agriculture and Plantations | Production from Irrigated Agriculture and Plantations | Intensive Uses | Water |
|---|---|---|---|---|---|---|---|---|---|---|---|---|---|
| Moonie | MOO | −28.0 | 149.5 | 522 | 493 | 243 | 0.9 | 9.35% | 11.04% | 79.27% | 0.22% | 0.09% | 0.03% |
| Border Rivers | BOR | −28.8 | 150.7 | 612 | 579 | 403 | 2.3 | 9.42% | 26.98% | 60.99% | 1.87% | 0.57% | 0.17% |
| Warrego | WAR | −26.8 | 146.2 | 462 | 428 | 339 | 1.0 | 8.86% | 63.81% | 26.67% | 0.12% | 0.05% | 0.50% |
| Namoi | NAM | −30.8 | 149.9 | 621 | 588 | 401 | 3.2 | 13.26% | 28.36% | 55.06% | 2.15% | 0.79% | 0.38% |
| Paroo | PAR | −29.1 | 144.6 | 303 | 287 | 157 | 0.7 | 6.25% | 87.75% | 3.34% | 0.02% | 0.01% | 2.65% |
| Condamine-Balonne | CON-BAL | −27.7 | 148.4 | 484 | 456 | 281 | 1.0 | 5.68% | 42.52% | 50.41% | 0.76% | 0.24% | 0.39% |
| Lower Darling | L-DAR | −32.9 | 142.7 | 263 | 238 | 93 | 0.8 | 6.57% | 85.82% | 2.91% | 0.08% | 0.04% | 4.59% |
| Lachlan | LAC | −33.5 | 146.8 | 446 | 418 | 277 | 1.8 | 10.10% | 30.58% | 57.70% | 0.48% | 0.26% | 0.88% |
| Lower Murray | L-MUR | −34.2 | 140.4 | 277 | 262 | 119 | 1.2 | 24.67% | 37.84% | 34.40% | 1.04% | 0.44% | 1.61% |
| Murrumbidgee | MUR | −35.0 | 146.9 | 515 | 459 | 337 | 2.8 | 12.45% | 12.18% | 71.20% | 2.16% | 1.22% | 0.78% |
| Upper Murray | U-MUR | −36.1 | 147.9 | 928 | 691 | 750 | 10.4 | 43.67% | 18.62% | 36.88% | 0.12% | 0.57% | 0.13% |
| Ovens | OVE | −36.6 | 146.6 | 908 | 658 | 456 | 9.2 | 22.60% | 29.03% | 43.69% | 1.17% | 3.14% | 0.37% |
| Mitta Mitta | MIT | −36.6 | 147.6 | 987 | 700 | 780 | 12.4 | 32.62% | 42.10% | 22.28% | 0.11% | 0.87% | 2.02% |
| Wimmera | WIM | −36.2 | 142.4 | 352 | 334 | 136 | 1.2 | 16.64% | 2.76% | 77.97% | 0.10% | 1.09% | 1.44% |
| Lodon-Avoca | LON | −36.1 | 143.6 | 379 | 353 | 147 | 1.2 | 10.63% | 5.51% | 73.02% | 5.27% | 4.22% | 1.34% |
| Goulburn-Broken | GOU-BRO | −36.8 | 145.6 | 651 | 531 | 321 | 5.2 | 14.59% | 19.08% | 53.87% | 6.95% | 4.14% | 1.38% |
| Mid Murray | M-MUR | −35.6 | 145.0 | 390 | 370 | 101 | 0.7 | 9.38% | 4.23% | 78.36% | 6.87% | 0.44% | 0.72% |
| Gwydir | GWY | −29.8 | 150.1 | 640 | 599 | 404 | 2.5 | 8.02% | 27.08% | 61.75% | 2.26% | 0.42% | 0.47% |
| Macquarie-Castlereagh | MAC-CAS | −31.8 | 148.2 | 525 | 500 | 330 | 2.1 | 6.94% | 25.55% | 65.82% | 0.50% | 0.72% | 0.47% |
| Campaspe | CAM | −36.8 | 144.6 | 514 | 454 | 287 | 2.3 | 8.68% | 4.40% | 67.84% | 4.28% | 13.99% | 0.82% |
| Barwon-Darling | BAR-DAR | −31.6 | 145.1 | 333 | 321 | 157 | 0.9 | 8.29% | 87.30% | 3.81% | 0.08% | 0.03% | 0.49% |
| Kiewa | KIE | −36.5 | 147.1 | 1085 | 704 | 617 | 10.8 | 20.85% | 29.64% | 35.99% | 0.60% | 9.74% | 3.17% |
| Product | Coverage | Data Availability | Descriptions |
|---|---|---|---|
| Precipitation data products | |||
| CHIRPSP | 0.05 degrees Quasi global | Daily from 1981. Available at GEE. | CHIRPSP incorporates remotely sensed P from five satellite products and more than 20,000 station records to calibrate global Cold Cloud Duration rainfall estimates [24]. |
| GLDASP | 0.25 degrees globally | Every 3-hours from 2000. Available at GEE. | GLDASP assimilates satellite based observations from AGRMET and in-situ meteorological observations from GDAS and CMAP to produce the refined P [25]. |
| TRMMP | 0.25 degrees globally | Monthly from 1998. Available at GEE. | TRMMP merges microwave data from multiple sensors. The multi-satellite data are averaged to the monthly scale and adjusted to the large-area mean of the monthly surface P gauge analysis by GPCC using an inverse estimated-random-error variance weighting method [26,27]. |
| PersiannP | 0.25 degrees Quasi global | Daily from 1983. Available at GEE. | PersiannP uses an Artificial Neural Network function and applied to the GridSat-B1 (Gridded Satellite infrared data), along with the GPCP version 2.2 data [28]. |
| Evapotranspiration data products | |||
| CSIROET | 0.5 degrees globally | Monthly from 1981–2012. Available at https://data.csiro.au/ | CSIROET uses an observation-driven Penman-Monteith-Leuning (PML) model, supported with meteorological forcing including daily P, air temperature, vapor pressure, short- and long-wave downward radiation and wind speed, along with satellite derived vegetation forcing data, land cover data, emissivity and albedo. The dataset is validated across 643 unregulated catchments using flux tower measurements and other surface flux [9]. |
| GLDASET | 0.25 degrees globally | Every 3-hours from 2000. Available at GEE | GLDASET is a land surface model simulation in which the estimation is primarily based on empirical upscaling of space- and ground-based observations. Inputs in driving GLDAS including P, air temperate, downward shortwave and longwave radiation, humidity, surface pressure and wind speed [25]. |
| MODET | 500 m globally | Every 8-days from 2001. Available at GEE. | MODET is the terrestrial ET using a remote sensing-based Penman-Monteith algorithm [8,11]. Inputs include the MODIS derived land cover, LAI, fPAR and albedo products, as well as the meteorological reanalysis dataset from the Global Modelling and Assimilation Office of NASA (GMAO). |
| TerraClimateET | 2.5 minutes globally | Monthly from 1958. Available at GEE. | TerraClimateET is estimated using a one-dimensional modified Thornthwaite-Mather climatic water-balance model [13]. Inputs for the water balance calculation include precipitation and reference ET, as well as the plant extractable soil water capacity derived from satellite observations [29]. |
| Annual | Monthly | |||||||
|---|---|---|---|---|---|---|---|---|
| Mean | NSE | R2 | RMSE | Mean | NSE | R2 | RMSE | |
| AWAPP | 449.40 | - | - | - | 37.45 | - | - | - |
| CHIRPSP | 448.88 | 0.94 | 0.98 | 29.20 | 37.41 | 0.90 | 0.95 | 7.26 |
| GLDASP | 490.68 | 0.87 | 0.98 | 45.22 | 40.89 | 0.93 | 0.96 | 6.19 |
| PersiannP | 487.17 | 0.89 | 0.99 | 41.58 | 40.60 | 0.94 | 0.97 | 5.52 |
| TRMMP | 468.28 | 0.96 | 1.00 | 23.30 | 39.02 | 0.96 | 0.97 | 4.55 |
| Annual | Monthly | |||||||
|---|---|---|---|---|---|---|---|---|
| Mean | NSE | R2 | RMSE | Mean | NSE | R2 | RMSE | |
| AWAPET | 417.04 | - | - | - | 34.99 | - | - | - |
| CSIROET | 404.05 | 0.83 | 0.91 | 33.17 | 33.97 | 0.78 | 0.80 | 7.06 |
| GLDASET | 451.62 | 0.73 | 0.97 | 37.79 | 37.90 | 0.77 | 0.83 | 6.83 |
| MODET | 278.52 | −2.75 | 0.87 | 141.63 | 23.32 | −0.31 | 0.38 | 16.15 |
| TerraClimateET | 410.57 | 0.68 | 0.84 | 41.25 | 34.53 | 0.35 | 0.62 | 11.38 |
© 2019 by the authors. Licensee MDPI, Basel, Switzerland. This article is an open access article distributed under the terms and conditions of the Creative Commons Attribution (CC BY) license (http://creativecommons.org/licenses/by/4.0/).
Share and Cite
Zhao, Y.; Lu, Z.; Wei, Y. An Assessment of Global Precipitation and Evapotranspiration Products for Regional Applications. Remote Sens. 2019, 11, 1077. https://doi.org/10.3390/rs11091077
Zhao Y, Lu Z, Wei Y. An Assessment of Global Precipitation and Evapotranspiration Products for Regional Applications. Remote Sensing. 2019; 11(9):1077. https://doi.org/10.3390/rs11091077
Chicago/Turabian StyleZhao, Yan, Zhixiang Lu, and Yongping Wei. 2019. "An Assessment of Global Precipitation and Evapotranspiration Products for Regional Applications" Remote Sensing 11, no. 9: 1077. https://doi.org/10.3390/rs11091077