Abstract
Fire can induce long-lived changes to land-surface albedo, an important aspect of the Earth’s energy budget, but the temporal evolution of these anomalies is poorly understood. Due to the widespread presence of fire in Africa, this represents uncertainty in the continental energy budget, which has important implications for regional climate and hydrologic cycling. In this study, we present the first object-based accounting of albedo anomalies induced by larger (>1 km2) individual wildfires in sub-Saharan Africa. We group spatially contiguous wildfire pixels into fire objects and track the albedo anomaly for five years after the burn. We find that albedo anomalies all have the same general temporal signature: An immediate, brief period of darkening followed by persistent brightening. The strongest brightening is found in the Kalahari region while more intense and long-lived initial darkening is found in the Sahel region. The average southern hemisphere albedo anomaly is +1.50 × 10⁻³ in the year following wildfire, representing a statistically significant negative surface energy balance forcing on a continental scale. This study challenges an existing paradigm surrounding the physical effects of fire on the landscape. Our results suggest that models of albedo that assume a darkening and recovery to baseline are overly simplistic in almost all circumstances. Furthermore, the presumption that immediate darkening is the only meaningful effect on albedo is incorrect for the majority of the African continent.
1. Introduction
Albedo is a critical attribute of the Earth’s land surface and plays an important role in shaping the Earth’s energy budget. Changes to albedo can modify local atmospheric conditions and instigate land-atmosphere feedbacks with potential continental repercussions. A canonical example of an albedo-atmosphere feedback is the classic hypothesis of Charney [1] invoked to explain multi-decadal drought in the Sahel. Albedo-rainfall interactions may also operate on seasonal timescales [2,3]. Changes in albedo are also associated with major effects of deforestation on climate and vegetation-precipitation feedbacks, e.g., [4,5,6]. More recently, observational and mechanistic evidence has linked fire-induced albedo changes to observed reductions in precipitation in the following wet season [7,8,9]. This concept of fire-induced rainfall suppression hinges on the presence of widespread positive anomalies in albedo (i.e., brightening) following extensive wildfire. The basic premise is that in fire-prone regions dominated by convective rainfall systems, such as tropical Africa, reduced energy available for boundary layer growth under brighter-than-normal albedo conditions decreases the likelihood that the top of the atmospheric boundary layer will cross the lifting condensation level, a necessary condition for the formation of convective rainfall. Given the strong linkage between humans and fire [10], this could represent a plausible way in which humans modify regional hydrologic cycling. Understanding the scope and magnitude of brightening is critical to assessing the viability of this mechanism on a continental scale and, more generally, to understand how wildfire affects the surface energy balance.
Fire is common in Africa, contributing to 70% of the global burned area [10]. However, currently, there are inconsistent findings with regard to how albedo anomalies develop after a fire and recover over time in Africa, both in term of the sign and magnitude of the anomalies. Ground-based measurements of albedo change during and after a fire are lacking in Africa. Therefore, previous researchers have turned to long-term satellite reflectance datasets, such as those derived from the Moderate Resolution Imaging Spectroradiometer (MODIS), to investigate fire-induced land surface changes. Previous studies have reported instantaneous decreases in albedo after fire by up to 50%. Gatebe et al. [11] reported significant darkening in Northern Hemisphere sub-Saharan Africa that consistently lasted up to two years after fire for a majority of fire-affected pixels in the MODIS dataset. There was limited evidence of brightening in some cropland regions during the year following fire, as well as in most regions when fires occurred outside of the typical fire season, but the number of pixels reporting brightening was statistically dominated by instances of extended darkening. Recently, Dintwe et al. [12] measured widespread, immediate darkening after fires over all of Africa using a single pixel-based measurement approach. This approach used albedo anomalies derived from albedo baselines at the same location as the burn, but sampled in the years directly preceding and succeeding the year of the burn.
On the other hand, Saha et al. [8] found evidence of strong brightening in burn scars (up to ~7% above baseline albedo) in the Kalahari region of Southern Hemisphere Africa in the months following dry season fire [8]. The measured effect was more pronounced in more arid environments. Wetter regions showed slight darkening over the same timescale. Elsewhere on the globe there are reports of the immediate halving of albedo following intense fires in Australia [13] and significant brightening in the years following intense wildfires in Greece [14]. Notably, all of these studies relied on MODIS reflectance data, which suggests that data source is not the driving factor between seemingly contradictory observations of fire-induced albedo change.
The extent geographic or methodological differences affected the outcomes of these studies is unclear. Each of the aforementioned studies computed changes in albedo, due to fire differently. Perhaps the main issue is in determining a reference, the baseline value for albedo so that an anomaly can be calculated after a fire occurs. For example, if the anomaly were purely temporal (i.e., comparing the albedo in a burn scar to the albedo in that same region before or well after it burned) then it is possible that the computed anomaly would capture factors like a drought that temporarily modifies both the albedo and the likelihood of fire. On the other hand, if only a spatial reference were used (i.e., comparing albedo of a burn scar to a different, unburned region at the same time), this would not ensure that the surrounding pixels actually had a similar long-term baseline albedo. Indeed, the reason why some areas burn while others do not burn can be related to differences in vegetation composition, which could result in differences in baseline albedo.
Part of this difficulty stems from the fact there is no standard way to calculate albedo anomalies using a spatial or temporal reference. Given the natural spatial covariance of a spreading process like fire, there is some difficulty in establishing a nearby, representative reference pixel because of many potential reference pixels have also burned. Indeed, Gatebe et al. [11] used a spatial window ranging from 2.5 km to 30 km in their reference pixel matching scheme to associate pixels that experienced fire with similar reference pixels. There is a question of how truly representative a reference 500 m pixel that is as much as ~30 km away from the burned pixel actually is. Dintwe et al. [12] point out another potential issue with spatial references. The fact that a potential reference region in proximity to a burn scar did not burn could be indicative of underlying dissimilarity of vegetation between the two pixels, thereby making it an unsuitable reference to measure albedo anomalies. Without correcting for underlying biases between the two pixels, this comparison would be invalid.
On the other hand, there are also potential issues with temporally-derived baselines. Regions with an active fire regime show a strong fuel buildup and burn cycle. Multiple studies have demonstrated how climatic correlates, such as previous wet season rainfall modify fire in the following dry season [7,15]. Therefore, albedo anomalies calculated with only a temporal baseline might be influenced by initial land surface conditions that are uniquely predisposed to subsequent burning. Dintwe et al. [12] use an albedo anomaly calculated relative to average from the year before the fire and the year after the fire. Using a baseline that is, in part, derived from the year following fire, assumes that full albedo recovery has occurred within a year. However, there is ample evidence of fire-induced land surface effects that last for multiple years, e.g., References [11,14].
Despite recognition of issues with both spatial- and temporal-only anomaly definitions, to date no study has attempted to account for both kinds of pitfalls on a continental scale. We aim to fill this gap with an improved methodology. The specific temporal lags and apparent disparity in albedo anomalies previously found in Africa clearly warrant further investigation. Despite the common occurrence of fire in Africa and potential impact on the continental radiation budget, a holistic continental analysis that investigates the long-term evolution of fire-induced albedo changes using a unified framework has not yet been undertaken. This is the aim of the current study.
2. Materials and Methods
2.1. Fire Data
The MODIS burned area product (MCD45A1, collection 6) gives global estimates of whether or not a given 500 m resolution pixel burned and, if so, estimates the time at which that pixel burned [16]. We tracked fires from this dataset during the period April 2006 through March 2011 (5 years of data). April was chosen as the start of the fire year, due to a continental minimum of fire during the month of April. We reserved the period before this (April 2001–March 2006) for use in the calculation of the baseline albedo. We stopped tracking new fires in 2011 to ensure that the anomalies could be calculated for a full five years after the fire occurred.
2.2. Fire Object Characterization
We defined fires using an object oriented, rather than a single pixel-based approach. Our object-oriented analysis groups individual burned pixels into discrete fire events based on their spatio-temporal connectivity [17,18]. We used a Moore (8-neighbor) spatial connectivity and five days of temporal connectivity. After defining all individual objects, further analyses were then done on the aggregated values of the member pixels. Instead of comparing a single pixel where a fire was sensed to other nearby pixels potentially affected by the same fire, we defined a reference buffer—pixels surrounding a fire—to compare with albedo values within a fire. Similar to our fire objects, the reference buffer is a contiguous group of pixels from which we extract the aggregate values of albedo. To define the reference buffer, we first built a throwaway one-pixel buffer around each fire, which was excluded to reduce the potential of edge effects of partially burned pixels in our fire-reference comparison (Figure 1). After that, we initialized the reference buffer as a one-pixel buffer outside the excluded edge pixels. Following initialization, we iteratively built up each reference buffer by incrementally adding a one-pixel outer buffer to the external border until the number of pixels in the reference buffer contained at least the number of pixels in the fire object. In this way, we were comparing the fire object to a similar number of nearby pixels (Figure 1).
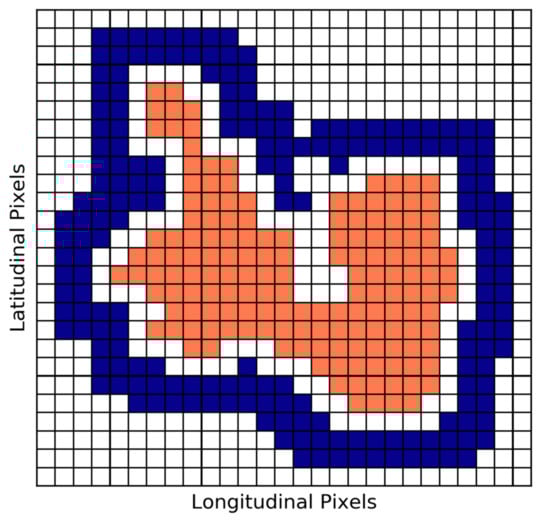
Figure 1.
Schematic illustrating the outcome of the reference buffer procedure. Each square represents a single 500 m2 MODIS pixel. Orange pixels indicate the location of a continuous fire object. Blue pixels indicate the reference buffer. A 1-pixel buffer is omitted to reduce edge effects. The width of the blue buffer is chosen such that the number of buffer pixels is approximately equal to the number of pixels in the fire object.
The linkage between fire and anthropogenic land use has the potential to affect our results. For example, if fire was used to clear forest that is then maintained as pasture, we may falsely associate the extended change in albedo with fire, even though the extended change in albedo is unrelated to natural ecosystem recovery from fire. For this reason, we focus on fires that do not overlap with human activities. We address this potential issue by omitting any pixels classified as either urban, cropland or cropland mosaic by the MODIS IGBP land cover dataset [19]. While most fires are started by humans, using this land surface dataset allows us to focus on those fires that propagate and recover with minimal anthropogenic effects [10]. Validation for the land cover dataset is presented in Reference [10]. Typically, the most frequent errors in land cover classification occur when classifying similar land cover types. For example, cropland is most frequently misclassified as cropland mosaic and vice versa [10]. In this case those errors would not affect the current study, due to the exclusion of both of those land cover types.
We performed additional quality assurance steps to ensure a strong albedo signal. Most notably, we excluded fires with an area < 1 km2 (i.e., consisting of 4 or less 500 m2 MODIS pixels). This was to eliminate cases in which a fire comprised a very small area. In these cases, tracking the albedo over the larger pixel that is not substantially burned would result in a scale mismatch that could lead to reduced statistical power and conservative lower anomaly estimate.
2.3. Albedo Anomaly Calculation
We used the MODIS black sky albedo product (MCD43A3, Collection 5). This provides eight-day estimates of the albedo for 500 m2 pixels in the same reference grid as the fire dataset. Daily albedo values were achieved for each fire object by taking the mean of contained pixel values in the fire and reference region for each available day of data. The albedo data are made available at eight-day intervals and each time-point may represent an integration over eight days of satellite reflectance data.
For each fire object, we tracked the spatial average albedo of the fires and reference buffers for five years after the fire. For each point in time (specifically each eight-day period for which MODIS albedo data is available at) we calculated the spatiotemporal albedo anomaly as
where the subscript t denotes the albedo at a given time after fire, subscript h denotes the historical albedo at the same time of year averaged over the period April 2001 through March 2006. The subscripts f and r denote the average albedo within the fire object and the surrounding reference buffer, respectively. Thus, by using both a spatial and a temporal reference for albedo anomaly computation we reduce the spurious effects of using a single method as discussed in the Introduction. This allows us to achieve higher quality estimates of fire performance that consider both underlying differences in the spatial and changes in the fire that represents an improvement upon previous studies.
Δαt = [αt,f − αh,f] − [αt,r − αh,r],
3. Results and Discussion
We identified 1.54 million fires, amounting to 11.2 million km2 of the burned area over the five-year period, or approximately 11% of the continental area of Africa. Due to our strict quality requirements for fire objects classification, these fire objects represent 88% of fire pixels in the MODIS dataset over our period of record. For this reason, the total impact of fire shown in results is likely to be an underestimate. Smaller fires dominated our dataset. Of the fires we identified, 1.37 × 10⁶ were less than 10 km2 in size. Fires larger than 10 km2 and 100 km2 occurred 1.72 × 10⁵ and 9796 times, respectively. However, larger fires represented a higher proportion of the cumulative burned area. Fires larger than 10 km2 and 100 km2 comprised 65.4% and 31.0% of the total burned area observed. The average albedo anomaly in the year following fire was +6.51 × 10⁻⁴ (95% confidence interval: +6.43 × 10⁻⁴ to +6.58 × 10⁻⁴) for all of sub-Saharan Africa. The five-year continental average was +2.71 × 10⁻⁴ (+2.68 × 10⁻⁴ to +2.75 × 10⁻⁴) Overall, the return to baseline albedo generally occurred within the first two years after fire (Figure 2, black lines).
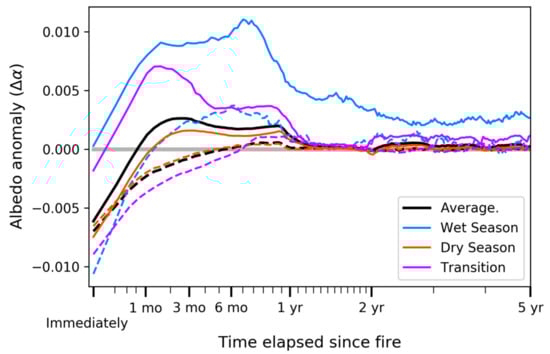
Figure 2.
Evolution of albedo anomalies after African fires for the Northern (dotted line) and Southern (solid line) Hemisphere. Different colors represent different times of the year for fire occurrence. The wet season months are JJAS for the Northern Hemisphere and DJFM for the Southern Hemisphere. October, November, April and May are considered transition months for both hemispheres. Each line is the average of all fires that occurred within the given time of year weighted by the area of each fire. The whole year average (black) closely tracks the dry season (orange) average because most fires occur during the dry season. Note that the x-axis (time axis) is plotted on a logarithmic scale.
We identified a general temporal pattern of albedo anomaly development. The lowest observed albedo anomaly was observed immediately. In most cases this initial anomaly was negative (i.e., immediate darkening) and recovered within three months. After that there was less intense, but still significant, brightening up to about one year after fire. Depending on the region, there is some variability in this signature. For example, fires that occur in the Southern Hemisphere during the wet season show an immediate brightening signal that lasts throughout the five-year lifetime of this analysis, with a peak of substantial brightening around six months after fire. Our findings of dominant darkening in the Northern Hemisphere and dominant brightening in the southern Hemisphere reconcile seemingly conflicting reports of hemispheric differences in the physical effect of fire on the land surface [8,11].
The amount of brightening is dependent on when and where the fire occurs. Wet season fires result in substantially more brightening than fires during other times of the year within each hemisphere (Figure 2, blue lines). This is especially the case in the northern hemisphere. Gatebe et al. [11] report similar findings after Northern Hemisphere fires, but suggested a possible statistical anomaly, due to low sample size. We believe that the observed effect is real and must be considered in future studies. We hypothesize that the severity of rarer wet season fires, when they do occur, tends to be greater, as they would occur only during extremely dry times, such as intense drought. Additionally, during the wet season, the vegetated unburnt reference region may be substantially less reflective than the underlying soil, leading to an intensified brightening. Further research efforts should aim to decouple these two signals of darkening char deposition and potential brightening to gain a more complete understanding of fire-induced surface changes. Vegetation cover and species could play a large role in determining the magnitude of immediate darkening, due to char.
The Kalahari region exhibits a strong brightening that lasts for over a year, on average. We hypothesize that the soil color is important in explaining the brightening, as there is a significant contrast between the brightening observed over the Kalahari sands (arenosols) with the lack of brightening immediately to the east of this region, which is characterized by darker luvisols [20] (Figure 3). The brightening is subdued in the northern half of the Kalahari sands. This could be an effect of spatial trends in soil moisture. The negative relationship between soil moisture and albedo across soil types is well described [21]. It is likely that the revelation of wetter, darker soils has less of an effect on albedo anomalies. This is supported by the fact that the highest average albedo anomalies following wet season fires (1.11 × 10⁻² and 3.72 × 10⁻³ for the NH and SH, respectively) occur about six months after the burn (i.e., during the dry season).
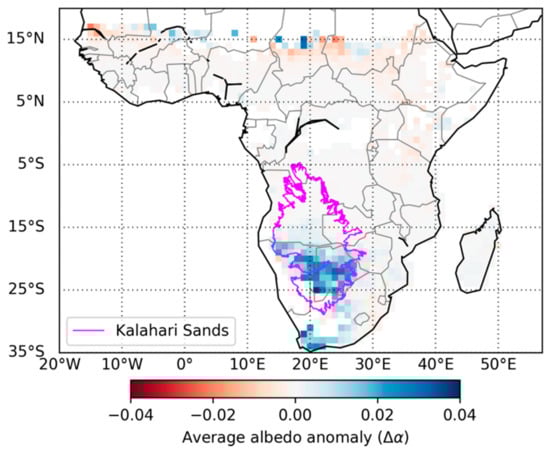
Figure 3.
Average albedo anomaly in the year following fire. Individual albedo time series are binned into 1° latitude and longitude bins and averaged by weighting each fire by area before averaging. Bins with less than 10 fires in the analysis period are shown in white. An outline of the Kalahari Sands is shown in fuchsia.
To the south of the Kalahari, in the South African ‘veld’, there is also brightening in the year after fire. However, the relatively low frequency of fire in this region precludes us from drawing definitive conclusions about fire-induced albedo changes. The timing of brightening also shows differences from surrounding areas. The fastest brightening also occurs in the Kalahari sands, on average in 31 days after fire (Figure 4). In the northern hemisphere brightening occurs after 107 days on average, compared to 60 days for the southern hemisphere.
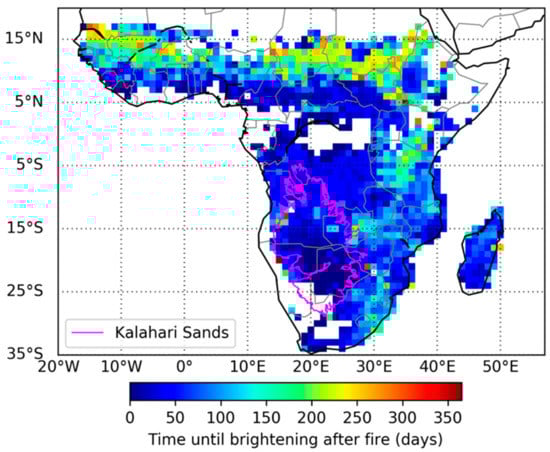
Figure 4.
Timing of first brightening following fire. Individual albedo time series are binned as in Figure 3 using a weighted average. The timing for the first observed brightening for these binned averages is depicted here. An outline of the Kalahari Sands is shown in fuchsia.
5. Conclusions
Our methodology represents an advance over previous research for three reasons. First, this methodology addresses concerns raised about both temporal-only and spatial-only comparisons. We account for both underlying differences between the burned pixels and reference pixels that might bias a purely spatial calculation and temporal factors, such as drought, that might affect a purely temporal calculation. Second, we do not assume the sign of the albedo anomaly will be either positive or negative. Previous research has typically assumed that darkening will occur, and as such, some detection algorithms are modeled around finding the minimum albedo after fire [11,12]. Finally, we do not assume any set duration of time for the recovery of albedo after fire. Previous studies have focused on the immediate darkening that occurs after fire, and then measured the recovery to a baseline or assumed implicitly that meaningful albedo changes do not last longer than one year. Because of that, previous studies do not capture the extended brightening of which we have found convincing evidence in major regions of Africa.
Understanding the effect of fire on the overlying atmosphere through physical modeling is an area of active research [7,9,22,23,24]. The parameterization of fire in coupled climate models is key to describing how burn scars modify regional climate and how this relationship may change under future fire regimes. Land surface models must therefore represent both the immediate and long-term effect of wildfire on albedo. We expect our findings to be useful for these parameterizations in future studies.
Author Contributions
Conceptualization, M.S., P.D. and T.S.; methodology, M.S.; analysis, M.S; writing M.S., P.D. and T.S.
Funding
This research was supported by NASA under grant award number NNX 11AQ23G. M. V. Saha received partial support from the National Science Foundation Graduate Research Fellowship Program and the Virginia Space Grant Consortium Graduate STEM Research Fellowship Program.
Acknowledgments
We would like to thank two anonymous reviewers whose suggestions greatly improved this study.
Conflicts of Interest
The authors declare no conflict of interest.
References
- Charney, J.G. Dynamics of deserts and drought in the Sahel. Q. J. Meteorol. Soc. 1975, 101, 193–202. [Google Scholar] [CrossRef]
- Meng, X.H.; Evans, P.; McCabe, M.F. The influence of inter-annually varying albedo on regional climate and drought. Clim. Dynam. 2014, 42, 787–803. [Google Scholar] [CrossRef]
- Vamborg, F.S.E.; Brovkin, V.; Claussen, M. Background albedo dynamics improve simulated precipitation variability in the Sahel region. Earth Dyn. 2014, 5, 89–101. [Google Scholar] [CrossRef]
- Renssen, H.; Goosse, H.; Fichefet, T. On the non-linear response of the ocean thermohaline circulation to global deforestation. Geophys. Lett. 2003, 30. [Google Scholar] [CrossRef]
- Bonan, G. Ecological Climatology; Cambridge University Press: Cambridge, UK, 2008. [Google Scholar]
- Bonan, G.B. Forests and Climate Change: Forcings, Feedbacks, and the Climate Benefits of Forests. Science 2008, 320, 1444–1449. [Google Scholar] [CrossRef]
- Saha, M.V.; Scanlon, T.M.; D’Odorico, P. Suppression of fire by rainfall in African drylands. Geophys. Res. Lett. 2016, 43, 8527–8533. [Google Scholar] [CrossRef]
- Saha, M.V.; D’Odorico, P.; Scanlon, T.M. Albedo changes after fire as an explanation of fire-induced rainfall suppression. Geophys. Lett. 2017, 44, 3916–3923. [Google Scholar] [CrossRef]
- De Sales, F.; Okin, G.S.; Xue, Y.; Dintwe, K. On the effects of wildfires on precipitation in Southern Africa. Clim. Dyn. 2018, 52, 951–967. [Google Scholar] [CrossRef]
- Andela, N.; Van Der Werf, G.R. Recent trends in African fires driven by cropland expansion and El Niño to La Niña transition. Nat. Clim. Change 2014, 4, 791–795. [Google Scholar]
- Gatebe, C.K.; Ichoku, C.M.; Poudyal, R.; Román, M.O.; Wilcox, E. Surface albedo darkening from wildfires in northern sub-Saharan Africa, Environ. Res. Lett. 2014, 9, 065003. [Google Scholar] [CrossRef]
- Dintwe, K.; Okin, G.S.; Xue, Y. Fire-induced albedo change and surface radiative forcing in sub-Saharan Africa savanna ecosystems: Implications for the energy balance. J. Geophys. Res. Atmos. 2017, 122, 6186–6201. [Google Scholar] [CrossRef]
- Beringer, J.; Hutley, L.B.; Tapper, N.J.; Coutts, A.; Kerley, A.; O’Grady, A.P.; Hutley, L. Fire impacts on surface heat, moisture and carbon fluxes from a tropical savanna in northern Australia. Int. J. Wildland Fire 2003, 12, 333–340. [Google Scholar] [CrossRef]
- Veraverbeke, S.; Verstraeten, W.W.; Lhermitte, S.; Van De Kerchove, R.; Goossens, R. Assessment of post-fire changes in land surface temperature and surface albedo, and their relation with fire - burn severity using multitemporal MODIS imagery. Int. J. Wildland Fire 2012, 21, 243–256. [Google Scholar] [CrossRef]
- Mondal, N.; Sukumar, R. Fires in Seasonally Dry Tropical Forest: Testing the Varying Constraints Hypothesis across a Regional Rainfall Gradient. PLoS ONE 2016, 11, 0159691. [Google Scholar] [CrossRef]
- Roy, D.; Boschetti, L.; Justice, C.; Ju, J. The collection 5 MODIS burned area product—Global evaluation by comparison with the MODIS active fire product. Remote. Sens. Environ. 2008, 112, 3690–3707. [Google Scholar] [CrossRef]
- Archibald, S.; Roy, D.P. Identifying individual fires from satellite-derived burned area data. In Proceedings of the International Geoscience and Remote Sensing Symposium, Cape Town, South Africa, 12–17 July 2009. [Google Scholar]
- Nogueira, J.; Ruffault, J.; Chuvieco, E.; Mouillot, F. Can we go beyond burned area in the assessment of global remote sensing products with fire patch metrics? Remote Sens. 2017, 9, 7. [Google Scholar] [CrossRef]
- Friedl, M.A.; Sulla-Menashe, D.; Tan, B.; Schneider, A.; Ramankutty, N.; Sibley, A.; Huang, X. MODIS Collection 5 global land cover: Algorithm refinements and characterization of new datasets. Remote. Sens. Environ. 2010, 114, 168–182. [Google Scholar] [CrossRef]
- Dewitte, O.; Jones, A.; Spaargaren, O.; Breuning-Madsen, H.; Dampha, A.; Deckers, J.; Gallali, T.; Hallett, S.; Jones, R.; Kilasara, M.; et al. Harmonisation of the soil map of Africa at the continental scale. Geoderma 2013, 211, 138–153. [Google Scholar] [CrossRef]
- Lobell, D.B.; Asner, G.P. Moisture Effects on Soil Reflectance. Soil Sci. Soc. J. 2002, 66, 722. [Google Scholar] [CrossRef]
- De Sales, F.; Xue, Y.; Okin, G.S. Impact of burned areas on the northern African seasonal climate from the perspective of regional modeling. Clim. Dyn. 2015, 47, 3393–3413. [Google Scholar] [CrossRef]
- Hernandez, C.; Drobinski, P.; Turquety, S. Impact of wildfire-induced land cover modification on local meteorology: A sensitivity study of the 2003 wildfires in Portugal. Atmos. Res. 2015, 164, 49–64. [Google Scholar] [CrossRef]
- Nicholson, S.E. Evolution and current state of our understanding of the role played in the climate system by land surface processes in semi-arid regions. Planet. Chang. 2015, 133, 201–222. [Google Scholar] [CrossRef]


© 2019 by the authors. Licensee MDPI, Basel, Switzerland. This article is an open access article distributed under the terms and conditions of the Creative Commons Attribution (CC BY) license (http://creativecommons.org/licenses/by/4.0/).