1. Introduction
Soil erosion is a complex four-stage dynamic process involving soil detachment, breakdown, transport, and subsequent deposition of sediments [
1]. Erosion is a naturally occurring process that affects all landforms by wearing away a field’s topsoil by the physical forces of water and wind or through forces associated with farming activities such as tillage. Soil erosion can be either a gradual process, continuing relatively unnoticed, or it may occur at an alarming rate, causing serious loss of topsoil, which is high in organic matter [
2]. Soil erosion removes organic matter and important nutrients and prevents vegetation growth, which negatively affects overall biodiversity. The specific phenomenon is denoted as the biggest threat to soil fertility and productivity. It changes the physical, chemical, and biological characteristics of soil, leads to a drop in potential agricultural productivity, and gives rise to concerns about food security, especially in the context of a growing world population [
3]. Soil erosion may pose a threat to food security if we consider that about nine billion people should be fed by 2050 [
4]. Therefore, global agriculture production has to be intensified, presumably on a reduced proportion of land as soil erosion, soil sealing, and salinization increasingly take their toll on the landscape [
4]. Nevertheless, the effects of soil erosion go beyond the loss of fertile land, since it can also lead to increased pollution and sedimentation in streams and rivers, closing the waterways and causing declines in fish and other marine species. Degraded lands have also reduced capacity to hold onto water, sometimes causing intensification of flooding.
Mediterranean Europe is a world hotspot extremely prone to erosion, as it suffers from long dry periods followed by heavy erosive rainfall on steep slopes with fragile soils, resulting in considerable amounts of erosion [
5]. It is a fact that several Mediterranean spots have already reached a stage of irreversibility in terms of soil erosion, while in some places, there is little soil left [
6]. Greece is one of the most erosive areas of the Mediterranean countries [
4], and therefore, it is necessary to estimate soil erodibility and identify areas of high or low soil erosion risk. Specifically in Crete (Greece), research studies have already monitored and estimated the soil erosion process in several basins [
6]. The study in [
7] quantified the soil loss amount in Chania, Crete, and depicted the watersheds that are exposed to greater soil erosion risk in the study area. [
8] investigated soil erosion in southern central Crete, Greece, in the Asterousia range, where soil erosion is already widespread [
9], and the region appears desertified.
Different approaches have been employed in the relevant scientific literature regarding the soil erosion research. Either integrated or individual employment of innovative techniques such as satellite remote sensing, geostatistics, geomorphology, field spectroscopy, machine learning, and combined in situ and laboratory soil reflectance measurements are considered to be promising approaches to estimate various soil properties [
10]. Geostatistics, including interpolation and spatial linear regression methods, have been used by several researchers in order to monitor soil organic matter (SOM), CaCO
3, and soil erodibility (K-factor) [
11,
12,
13]. Laboratory analysis is sometimes proven inadequate when trying to investigate the soil erosion regime, especially in wider areas. In such cases, a big number of well spatially distributed samples should be collected for further analysis, which usually turns out to be an expensive and time consuming process. Therefore, the combination of laboratory analysis with geostatistics and remote sensing may be ideal to enable the environmental change monitoring in terms of cost and time. Earth observation (EO) satellites in particular have proven very beneficial in upscaling local field studies to relatively large areas [
14,
15,
16,
17]. Satellite remote sensing is virtually the only data source that permits a repeated monitoring of land degradation dynamics [
18]. In this context, both [
10] and [
13] applied integrated use of geostatistics, geoinformatics, and field spectroscopy to study the correlation between soil erosion and various soil parameters such as SOM, CaCO
3, and K-factor.
Initially, the most common field scale model for the estimation of soil erodibility risk was the Universal Soil Loss Equation (USLE) [
19], which was later revised to the Revised Universal Soil Loss Equation (RUSLE) [
20]. Both USLE and RUSLE equations are empirical models whose parameters contain uncertainty [
21]. Reference [
22] noted that nowadays, the RUSLE model is a widely used method in the Mediterranean for the estimation of soil erodibility risk and the assessment of soil erosion effects. Furthermore, numerous scientists have already employed the integrated use of satellite remote sensing data, the GIS approach, and the RUSLE methodology in monitoring and estimating soil erosion rates [
23,
24,
25,
26]. Following that, machine learning approaches such as artificial neural networks (ANN) have been successfully used in the recent past to simulate soil erosion processes [
27,
28,
29]. In those cases, ANNs have been utilized to describe the nonlinear relationships between eroded soils and relevant soil parameters such as SOM and CaCO
3. Continuously, the accurate spatial identification of SOM and CaCO
3 permits the subsequent identification of K-factor. K-factor is an estimate of the ability of soils to resist erosion based on the physical characteristics of each soil.
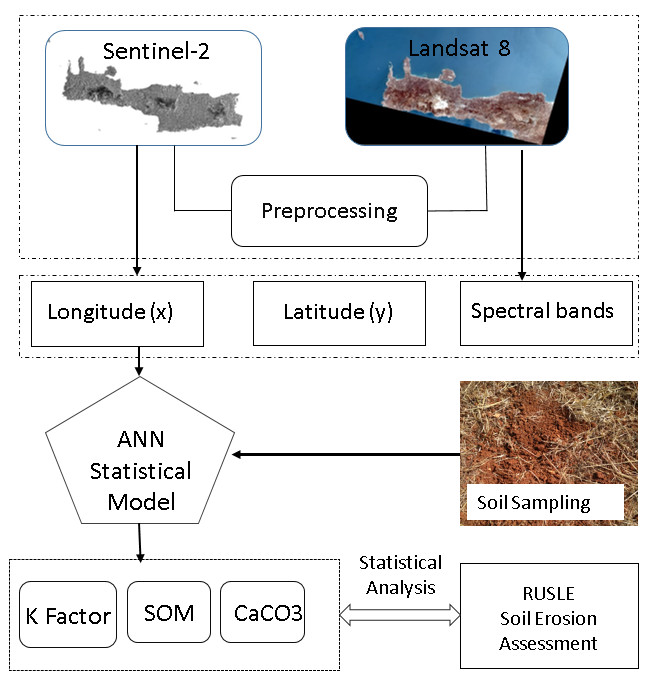
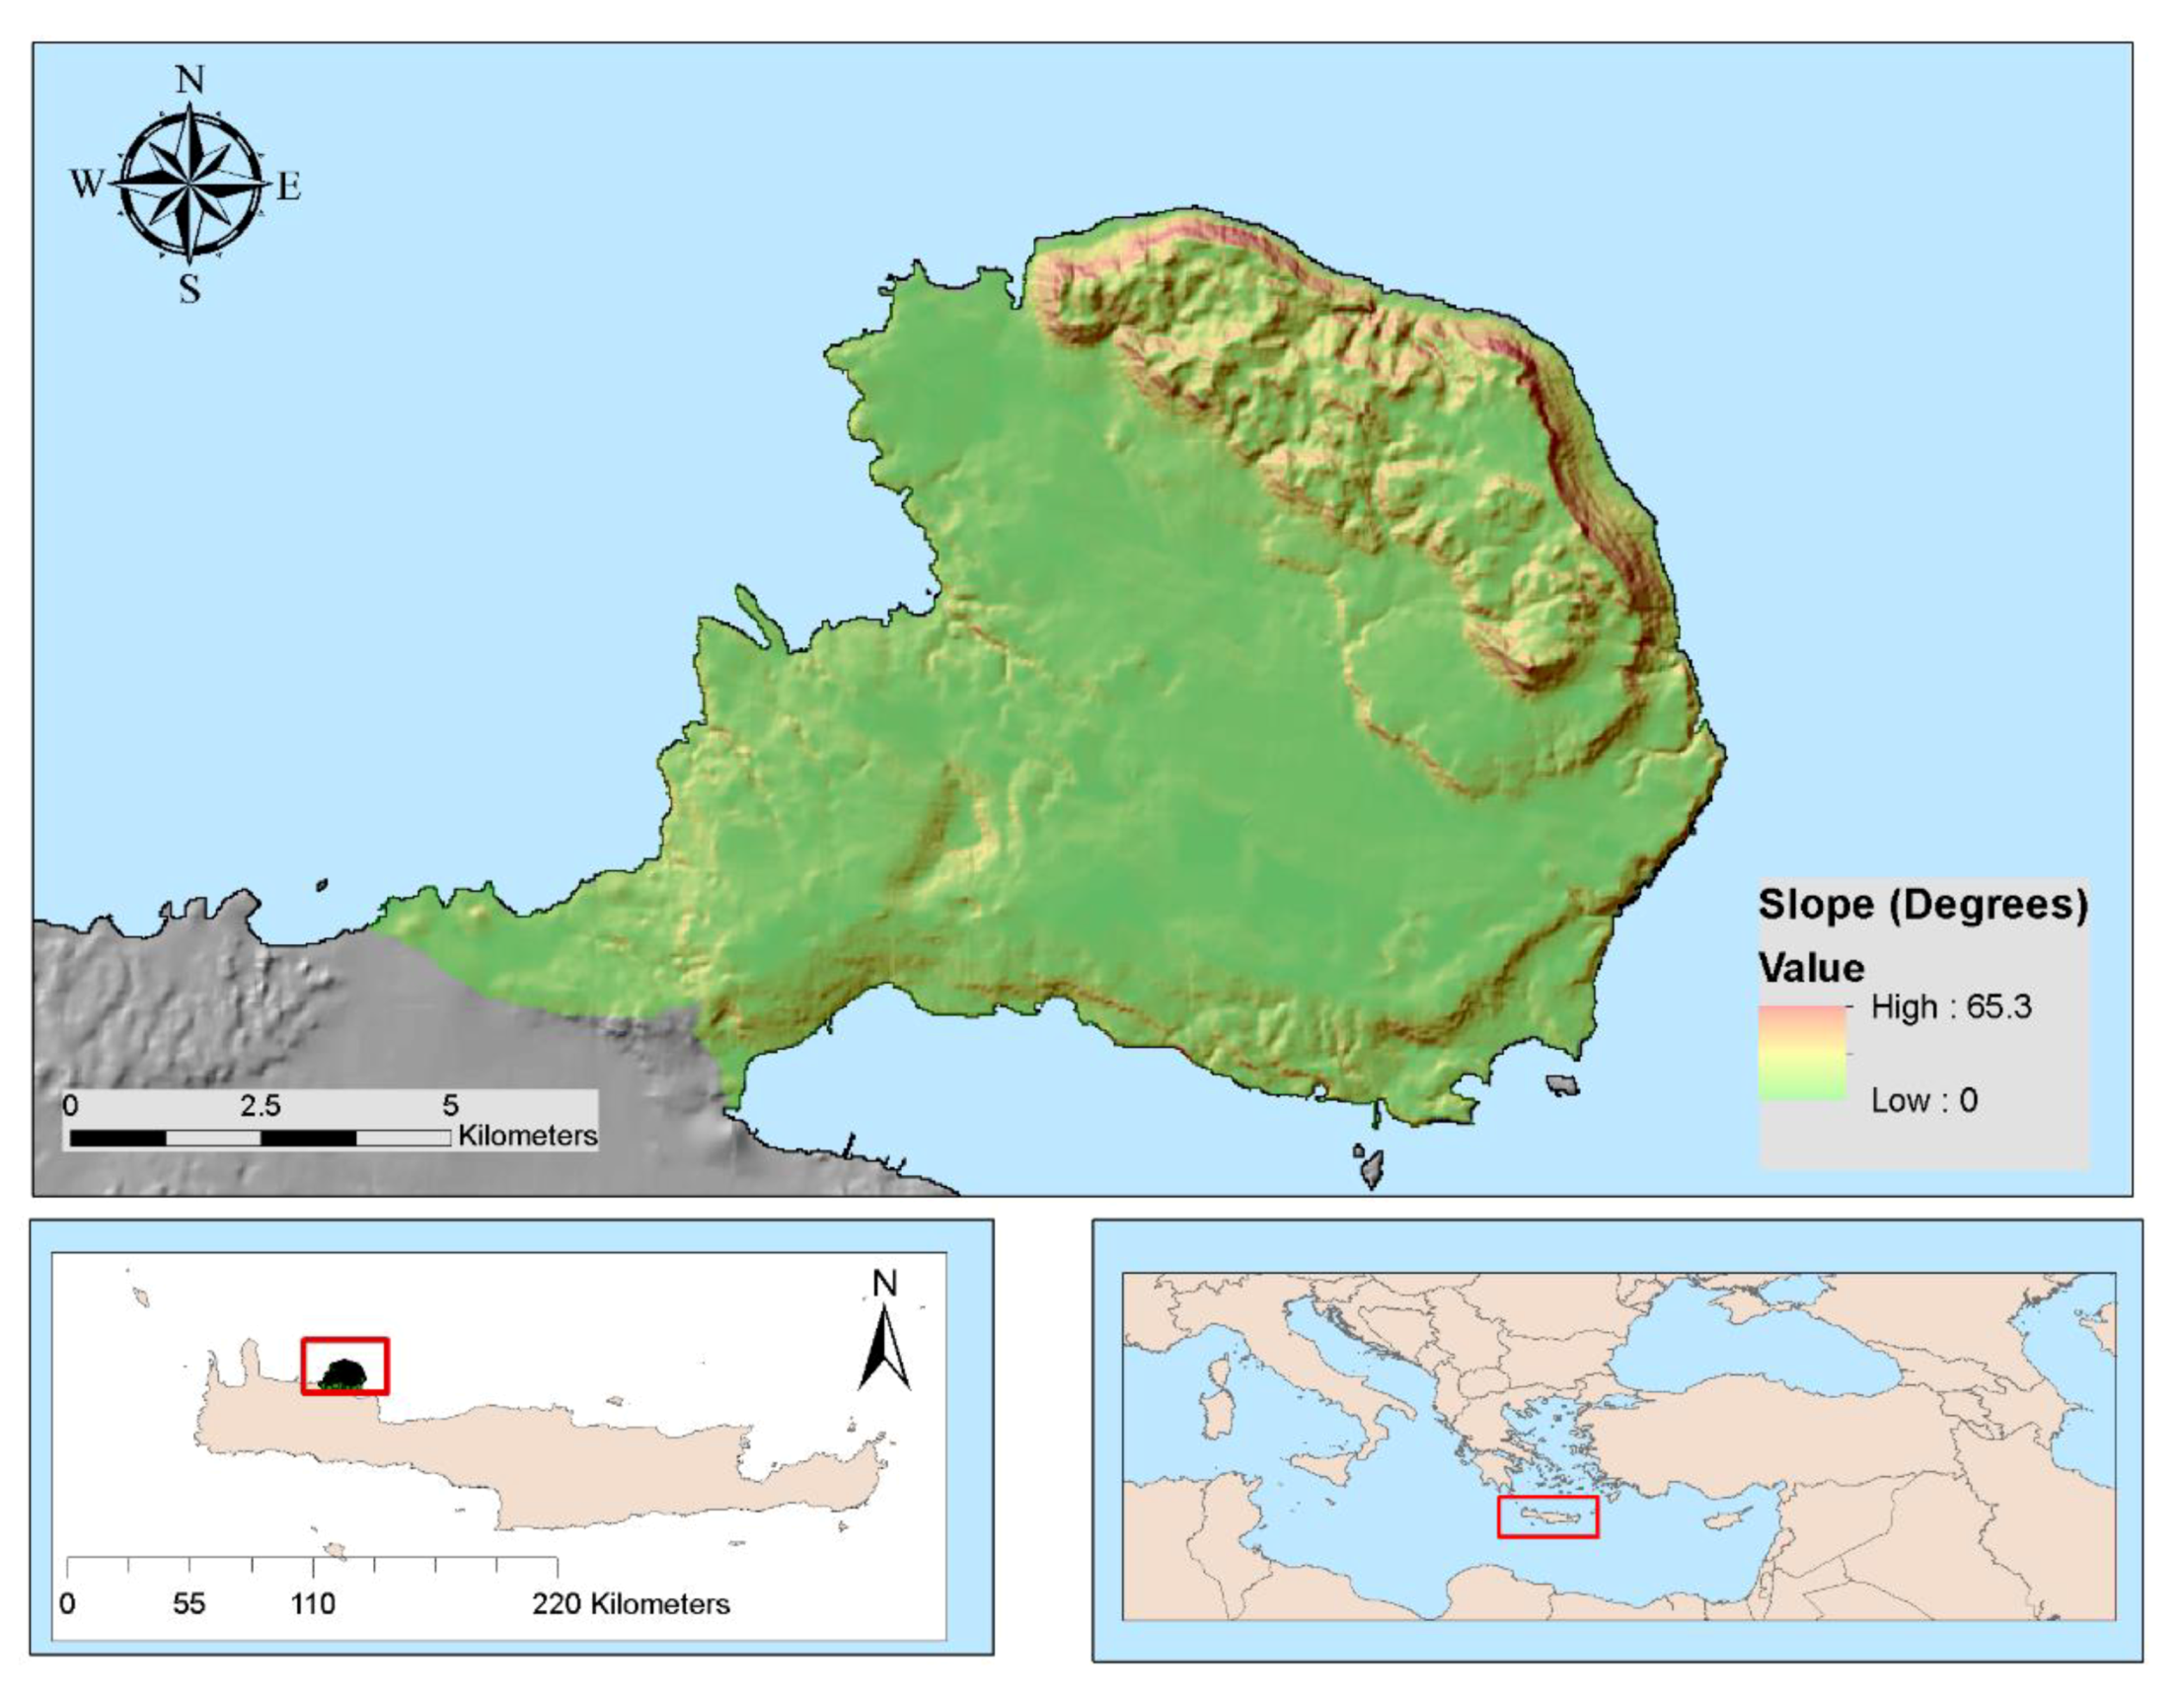
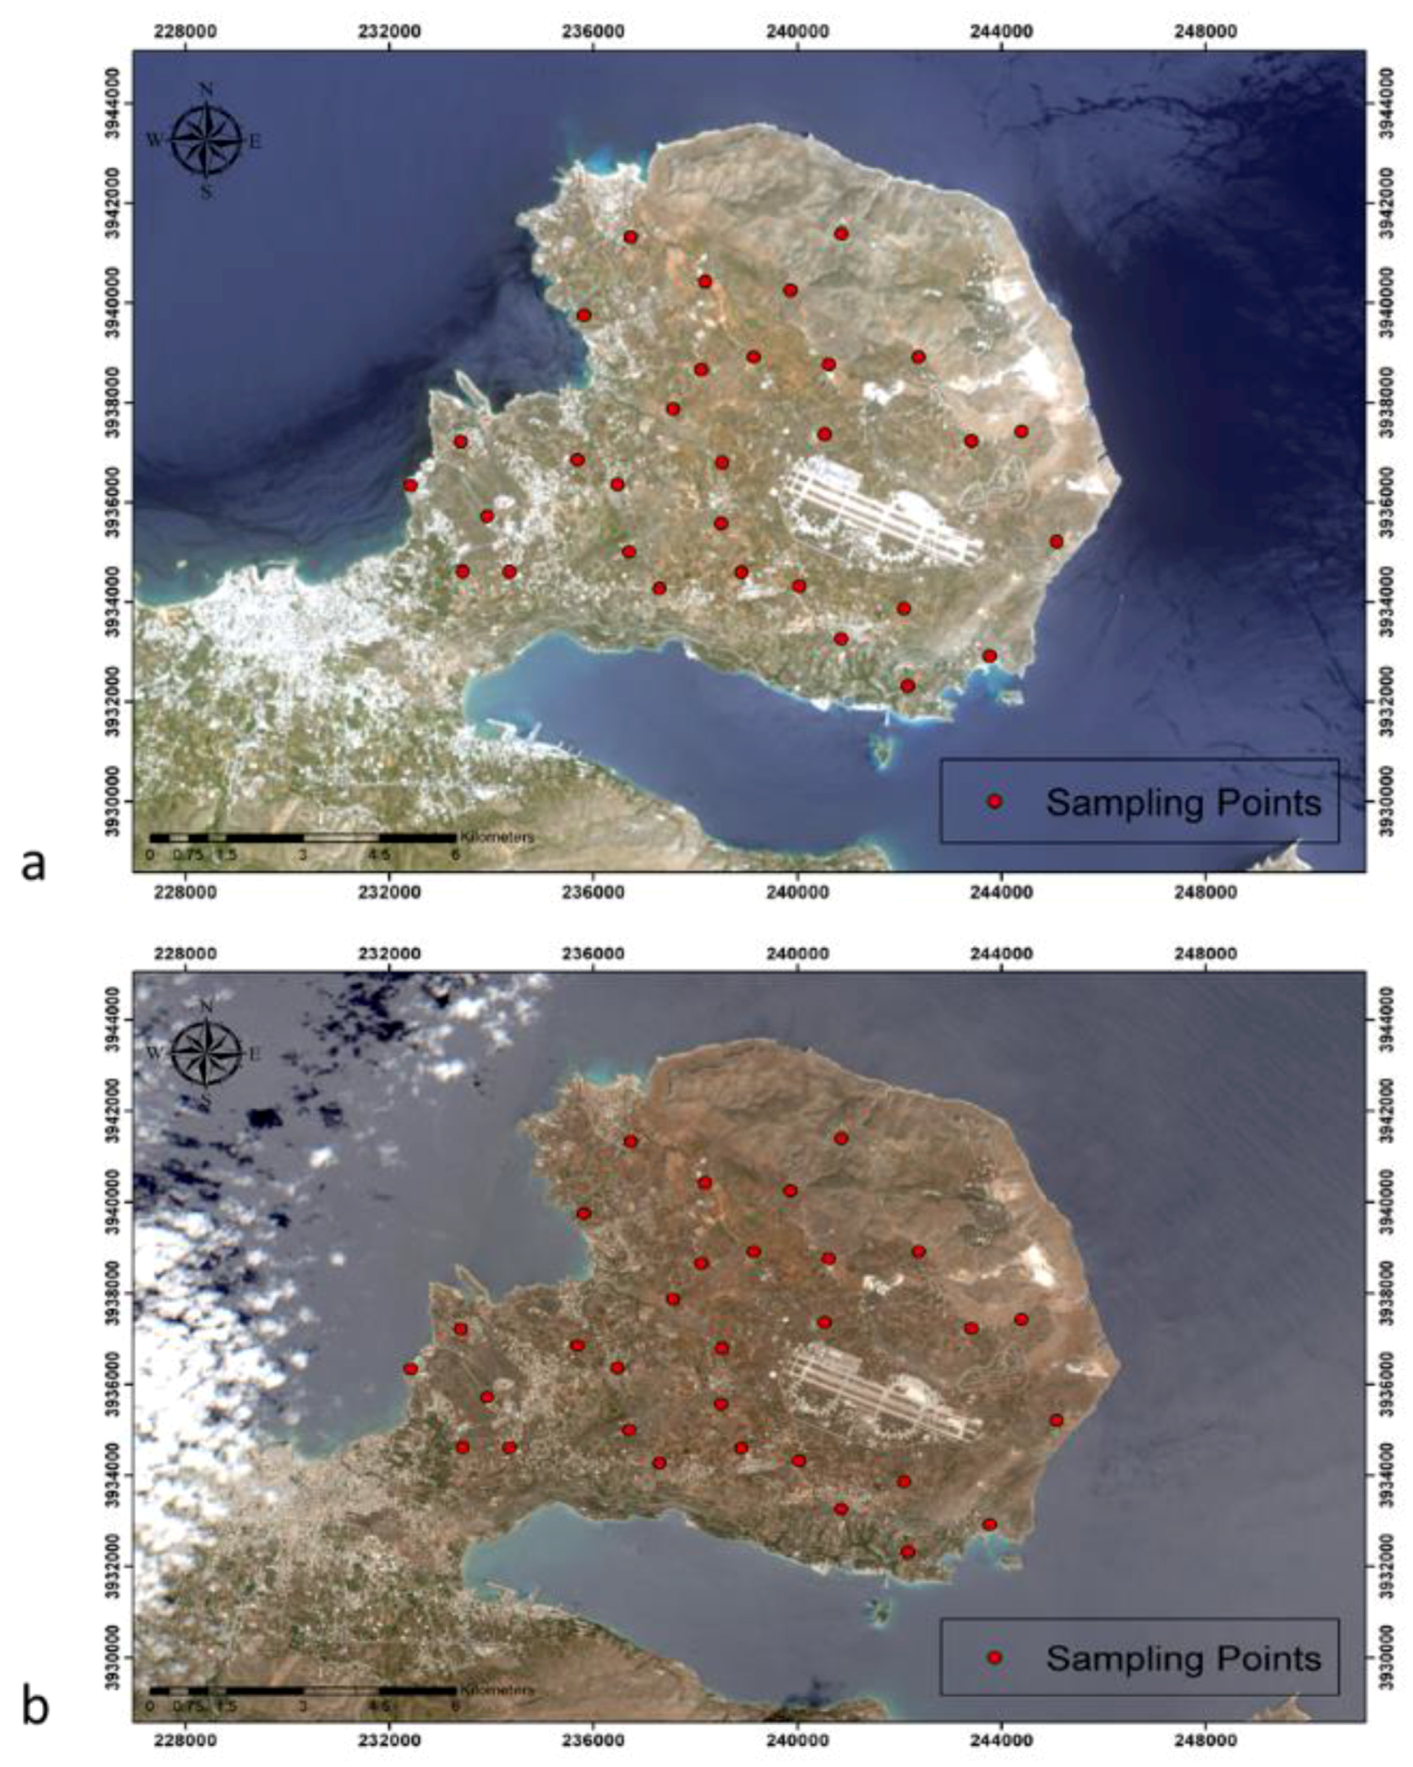
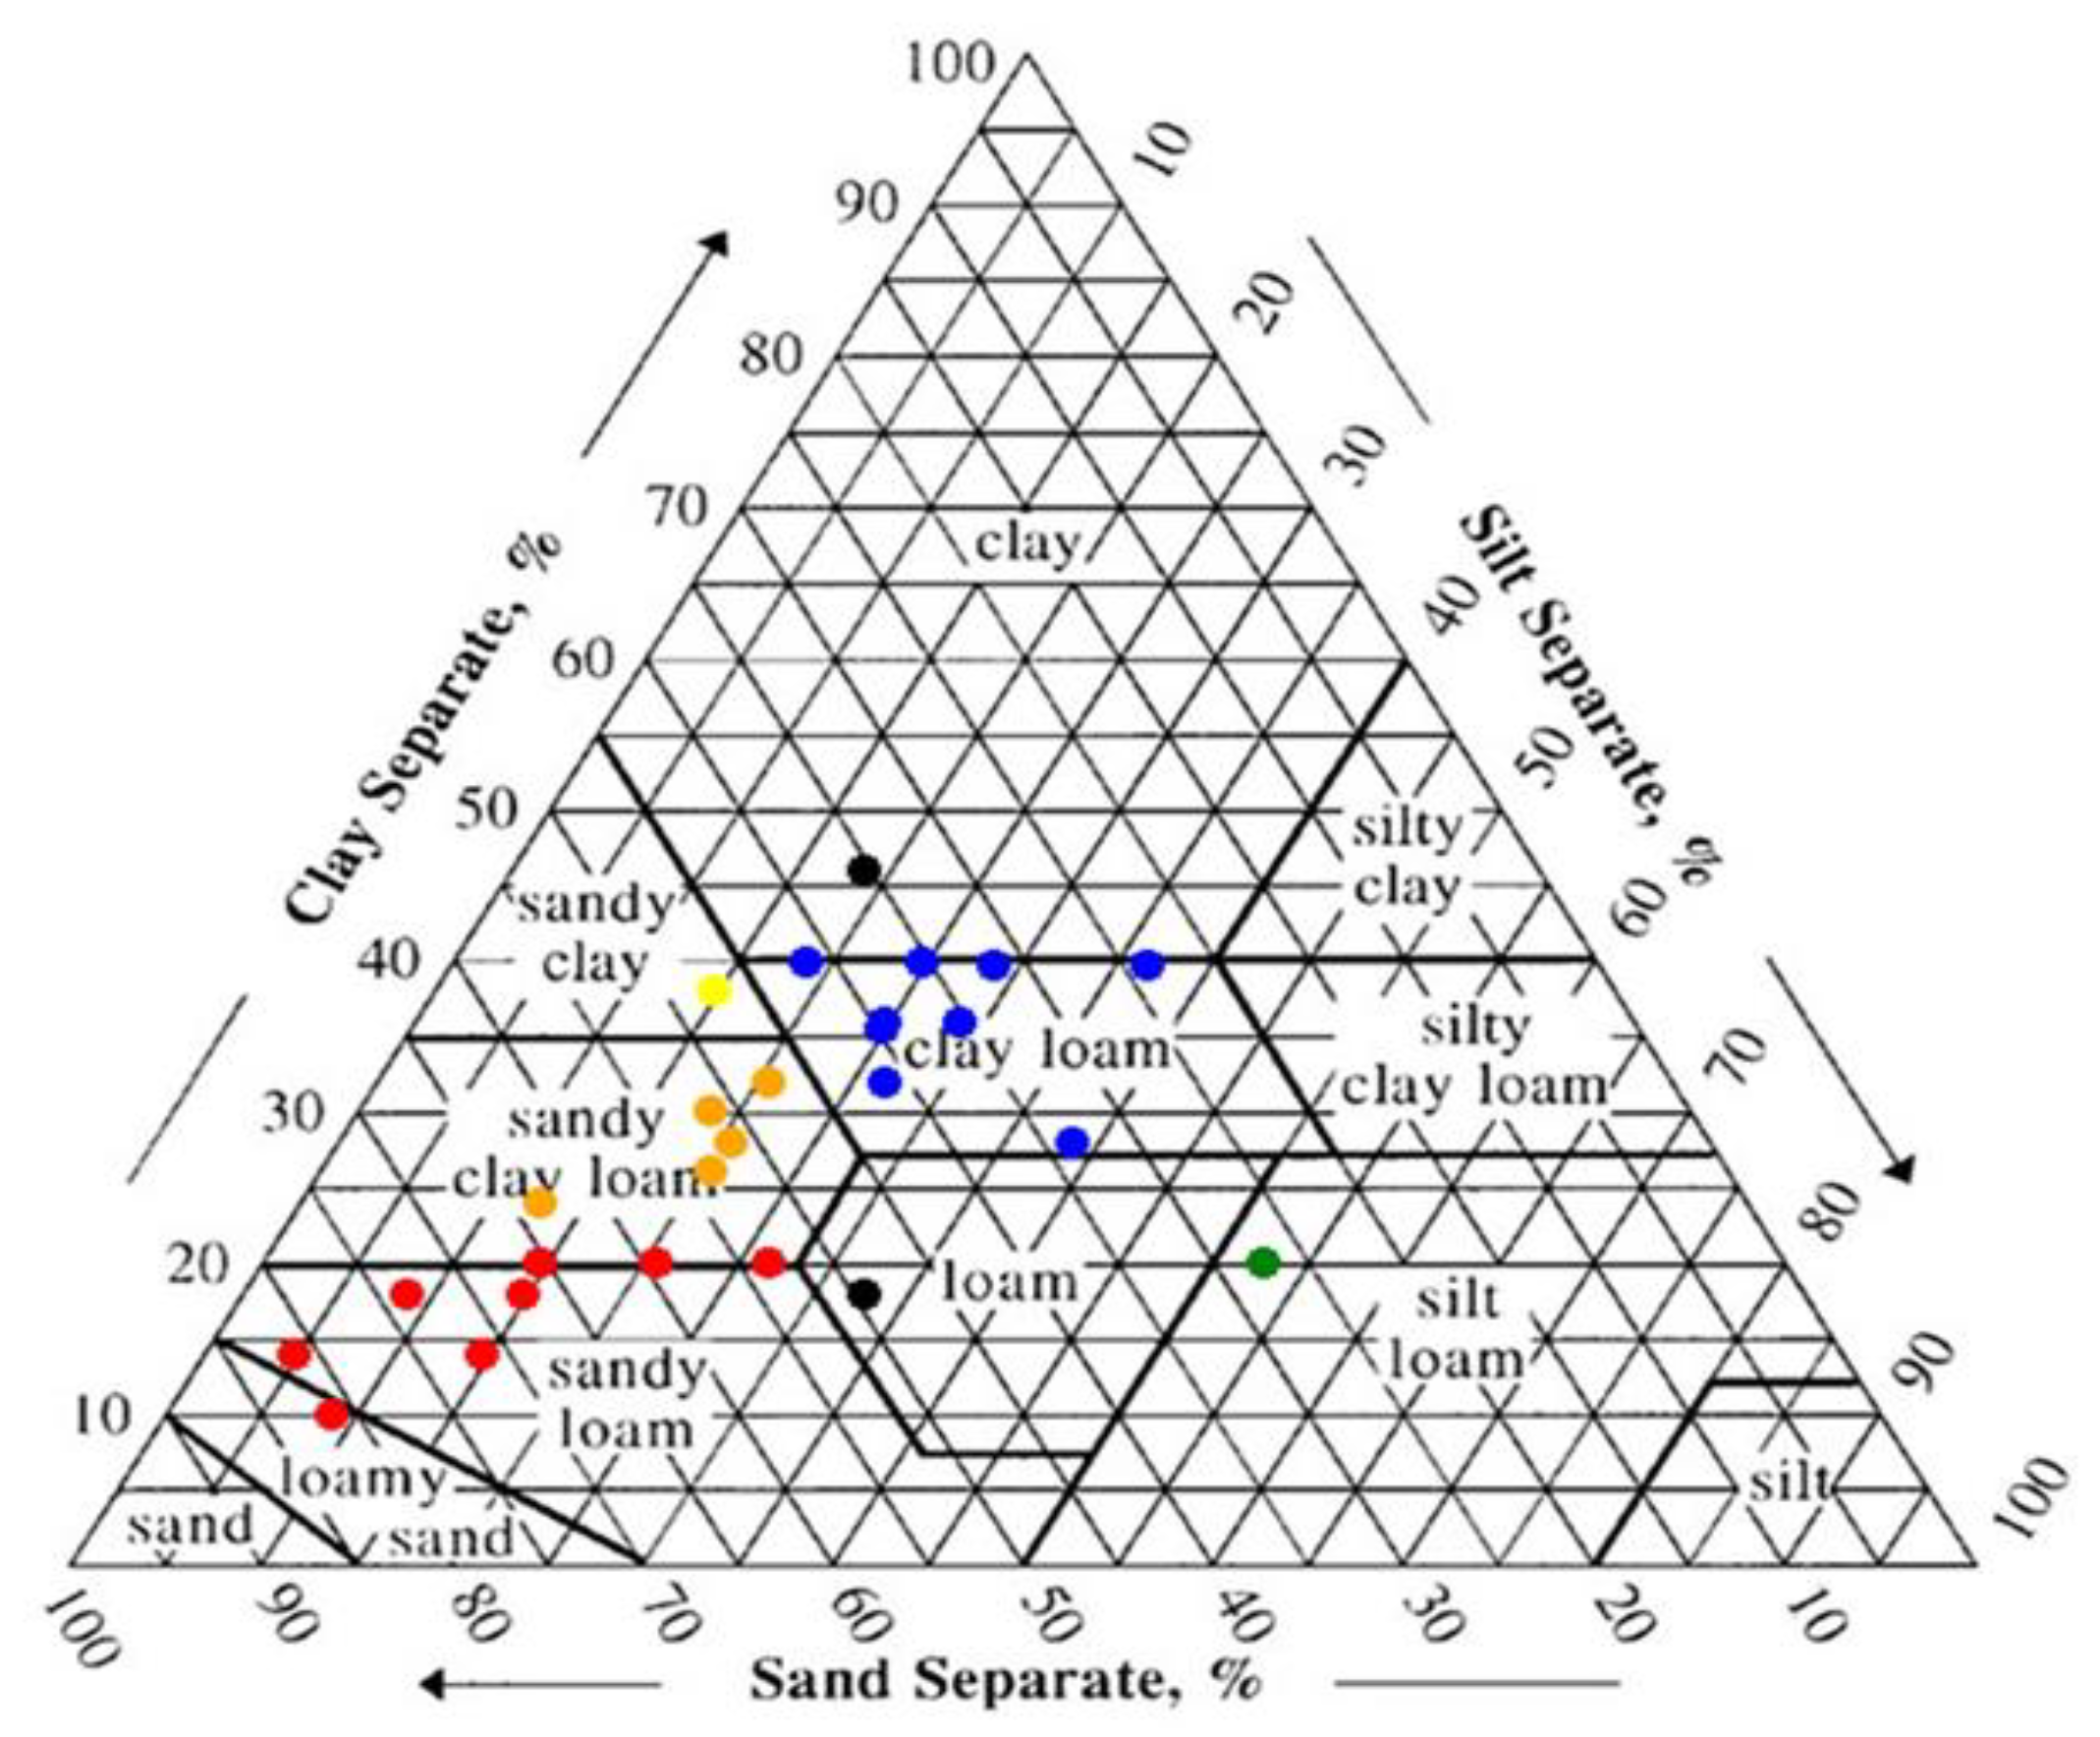
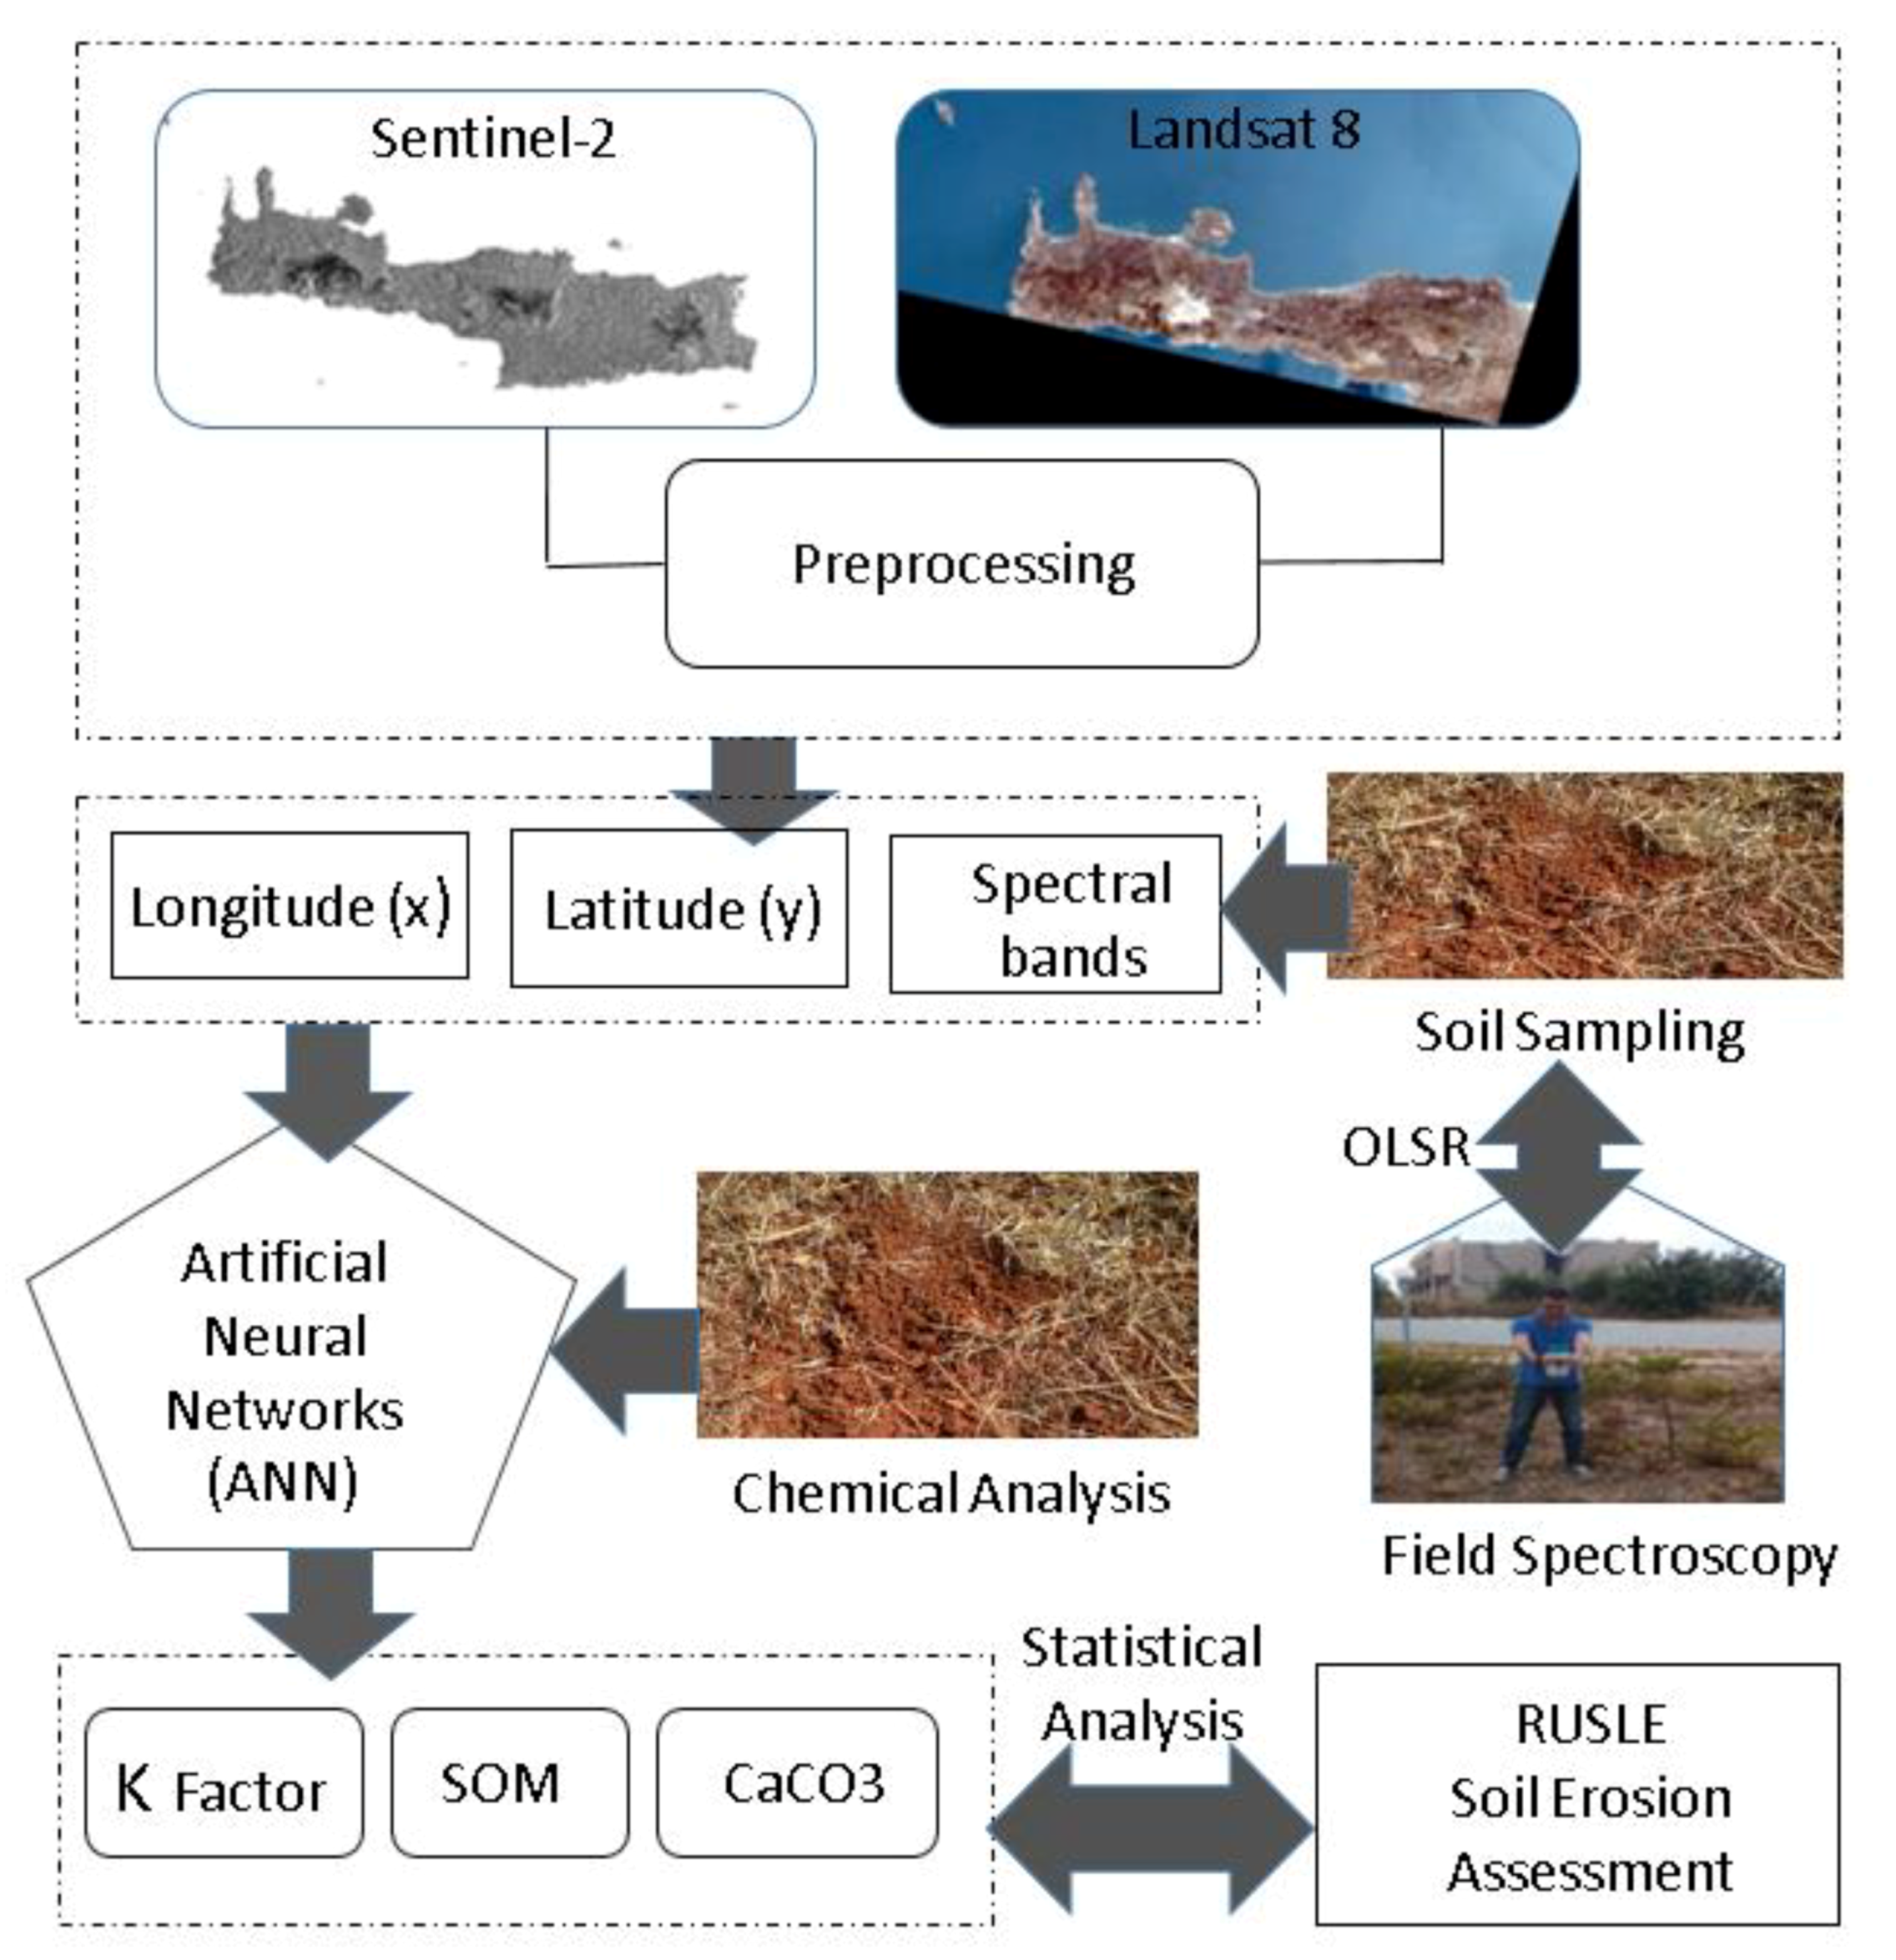
In this study, the soil erosion phenomenon is extensively investigated in the Akrotiri cape in Chania, Crete. At first, laboratory analysis of 30 soil samples in terms of texture and chemical composition collected from corresponding study spots was conducted. Continuously, EO data (Sentinel-2, Landsat 8) combined with machine learning approaches (ANNs) derived SOM and CaCO
3 maps of the study area in the GIS environment. The aforementioned maps were used for the estimation of K-factor, which expresses the susceptibility of soil to erode [
30]. The results of the machine learning developed maps were compared with respective maps developed from geostatistics (spline method) analysis in terms of accuracy. In addition, the RUSLE model was also applied in the study area, and the soil loss outputs were cross-compared with the already estimated soil parameters (SOM, CaCO
3). Finally, soil samples spectral data as derived from field spectroscopy campaigns were used in order to assess and correlate soil properties with specific spectral bands.
4. Results
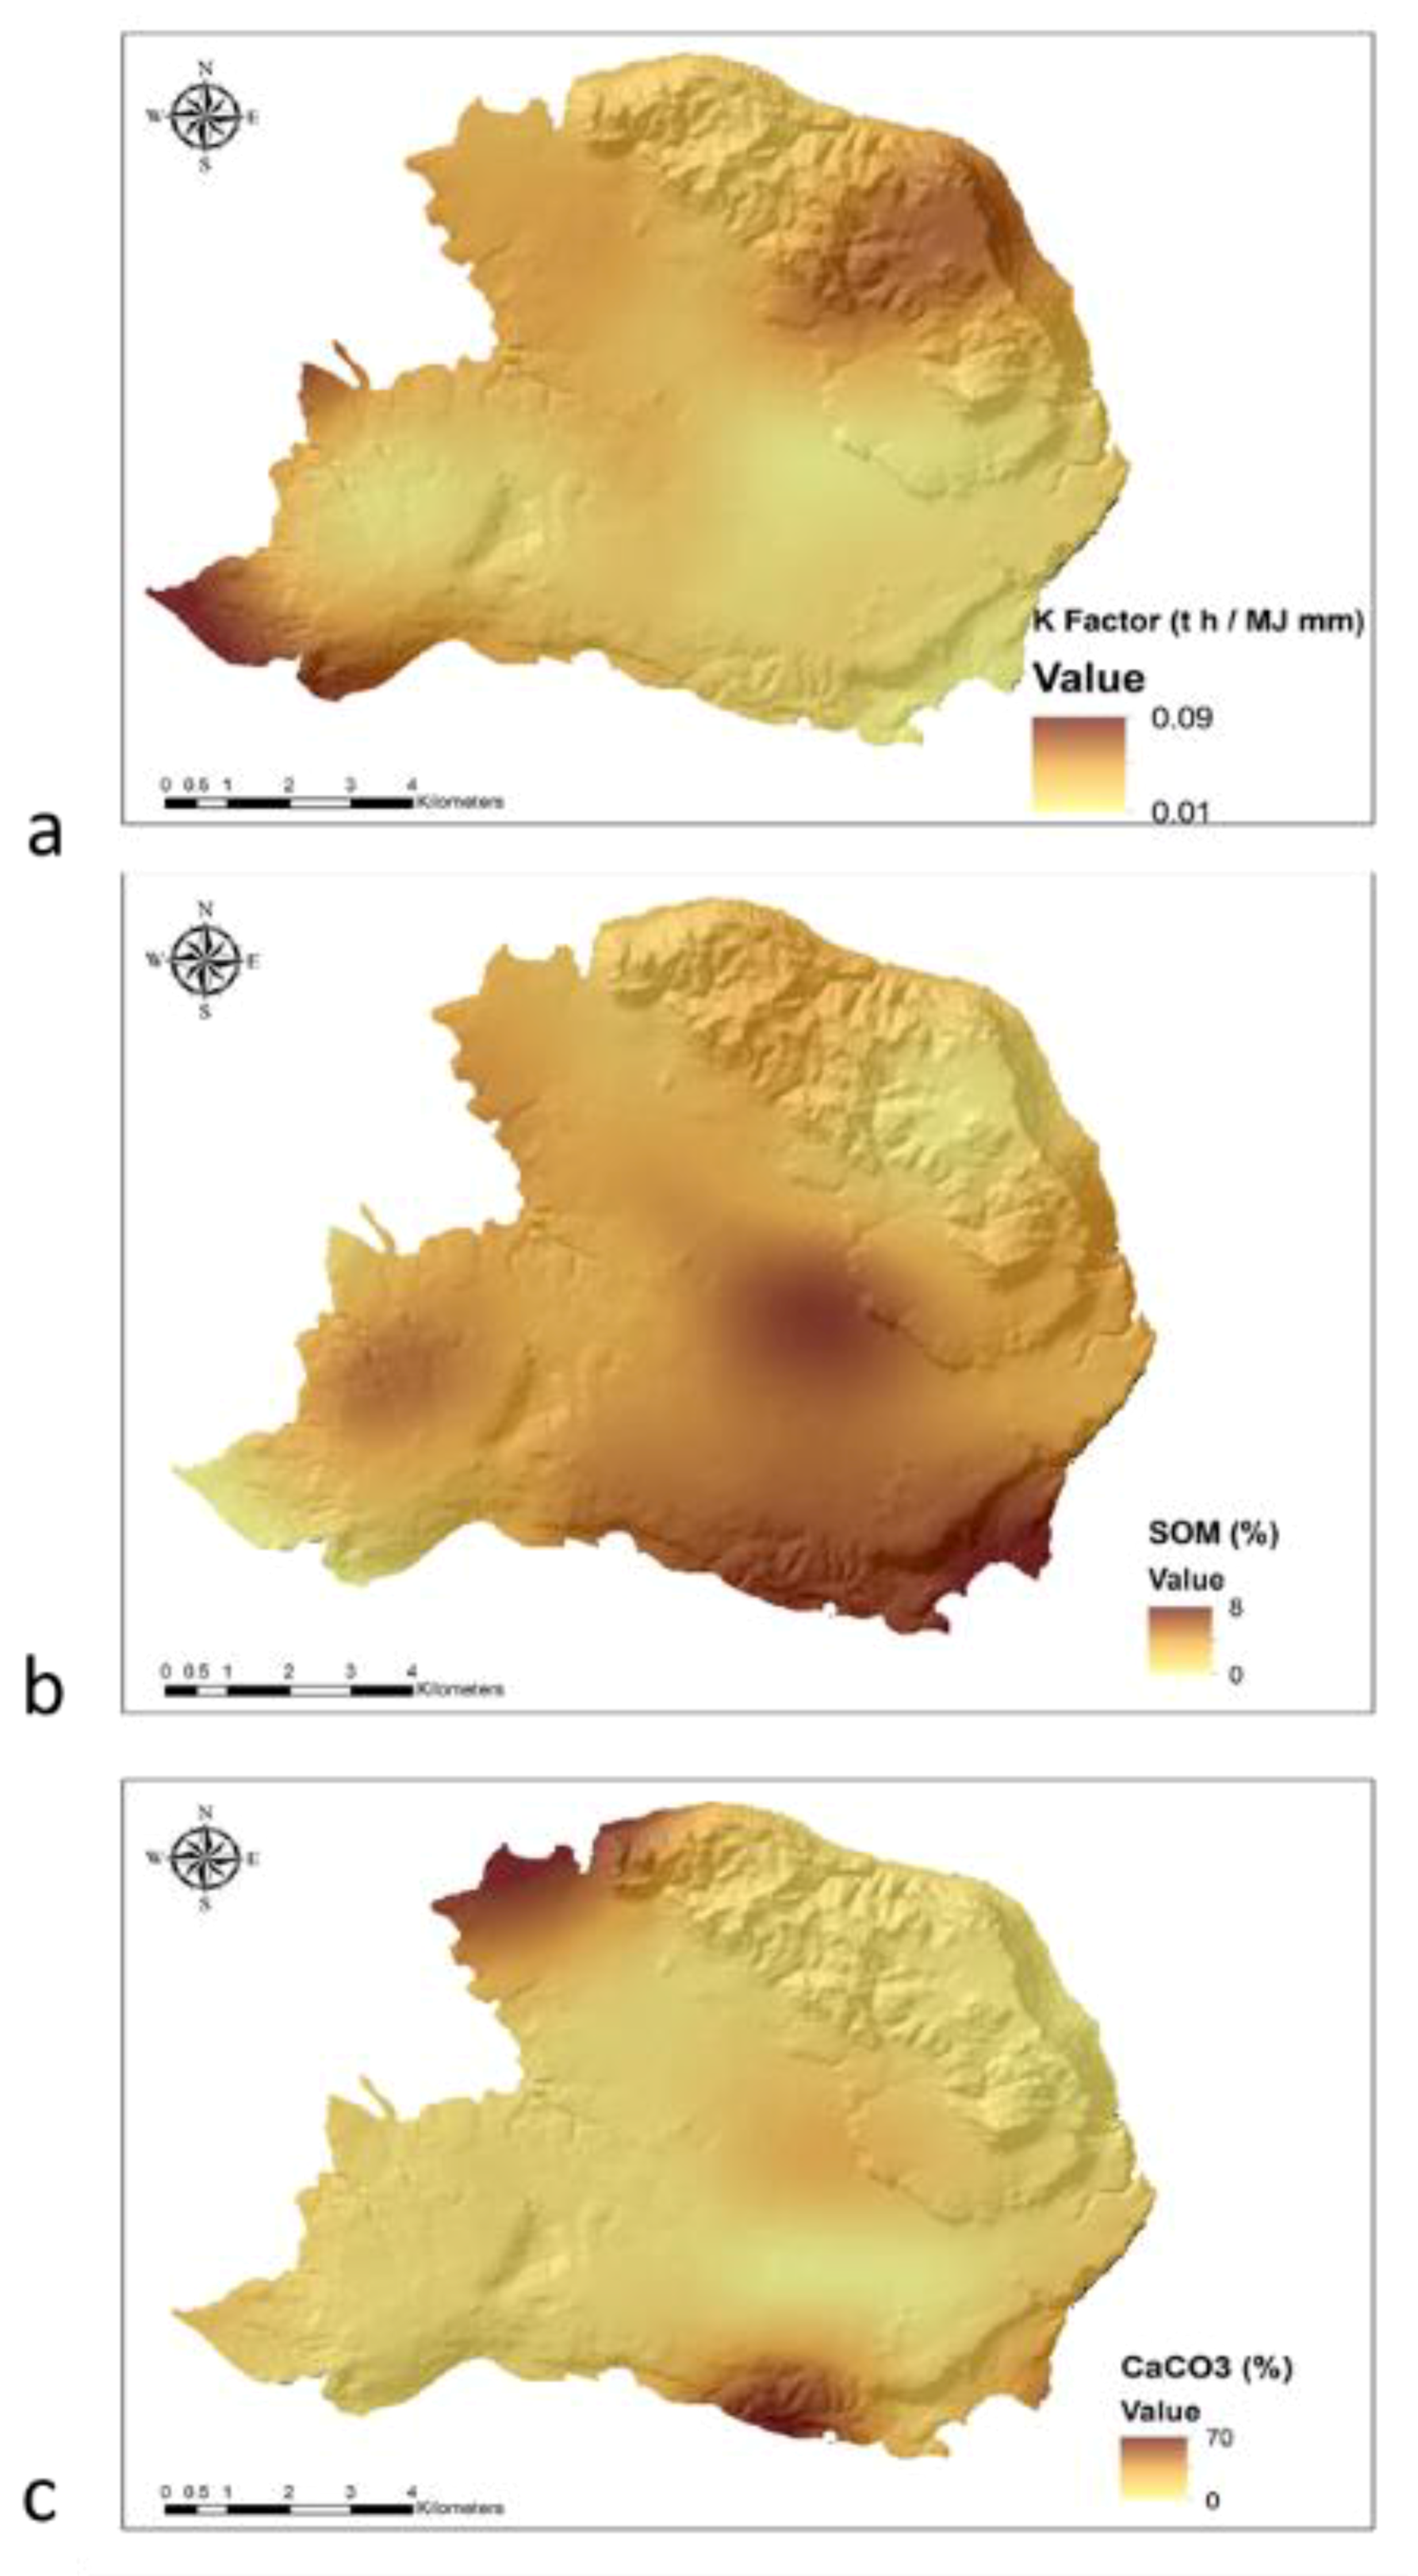
Initially, after the estimation of SOM and CaCO
3 parameters, through laboratory soil samples analysis, K-factor was calculated using Equation (1) in the GIS environment. The maps denote a conceptual uncertainty in the values distribution of all three parameters (
Figure 6a–c). This uncertainty was also depicted in the statistical results in terms of spline methodology accuracy. Specifically, 20 random point measurements were selected for applying the interpolation method and 10 points for validating the results. The extremely low
R2 values, as estimated for correlating training and validating measurements and concerning all the estimated parameters (SOM, CaCO
3, and K-factor), highlighted the need for developing a new coherent methodology for explicitly mapping soil parameters with the use of EO data. These results are merely in accordance with similar studies [
49] that applied the Ordinary kriging method to estimate SOM.
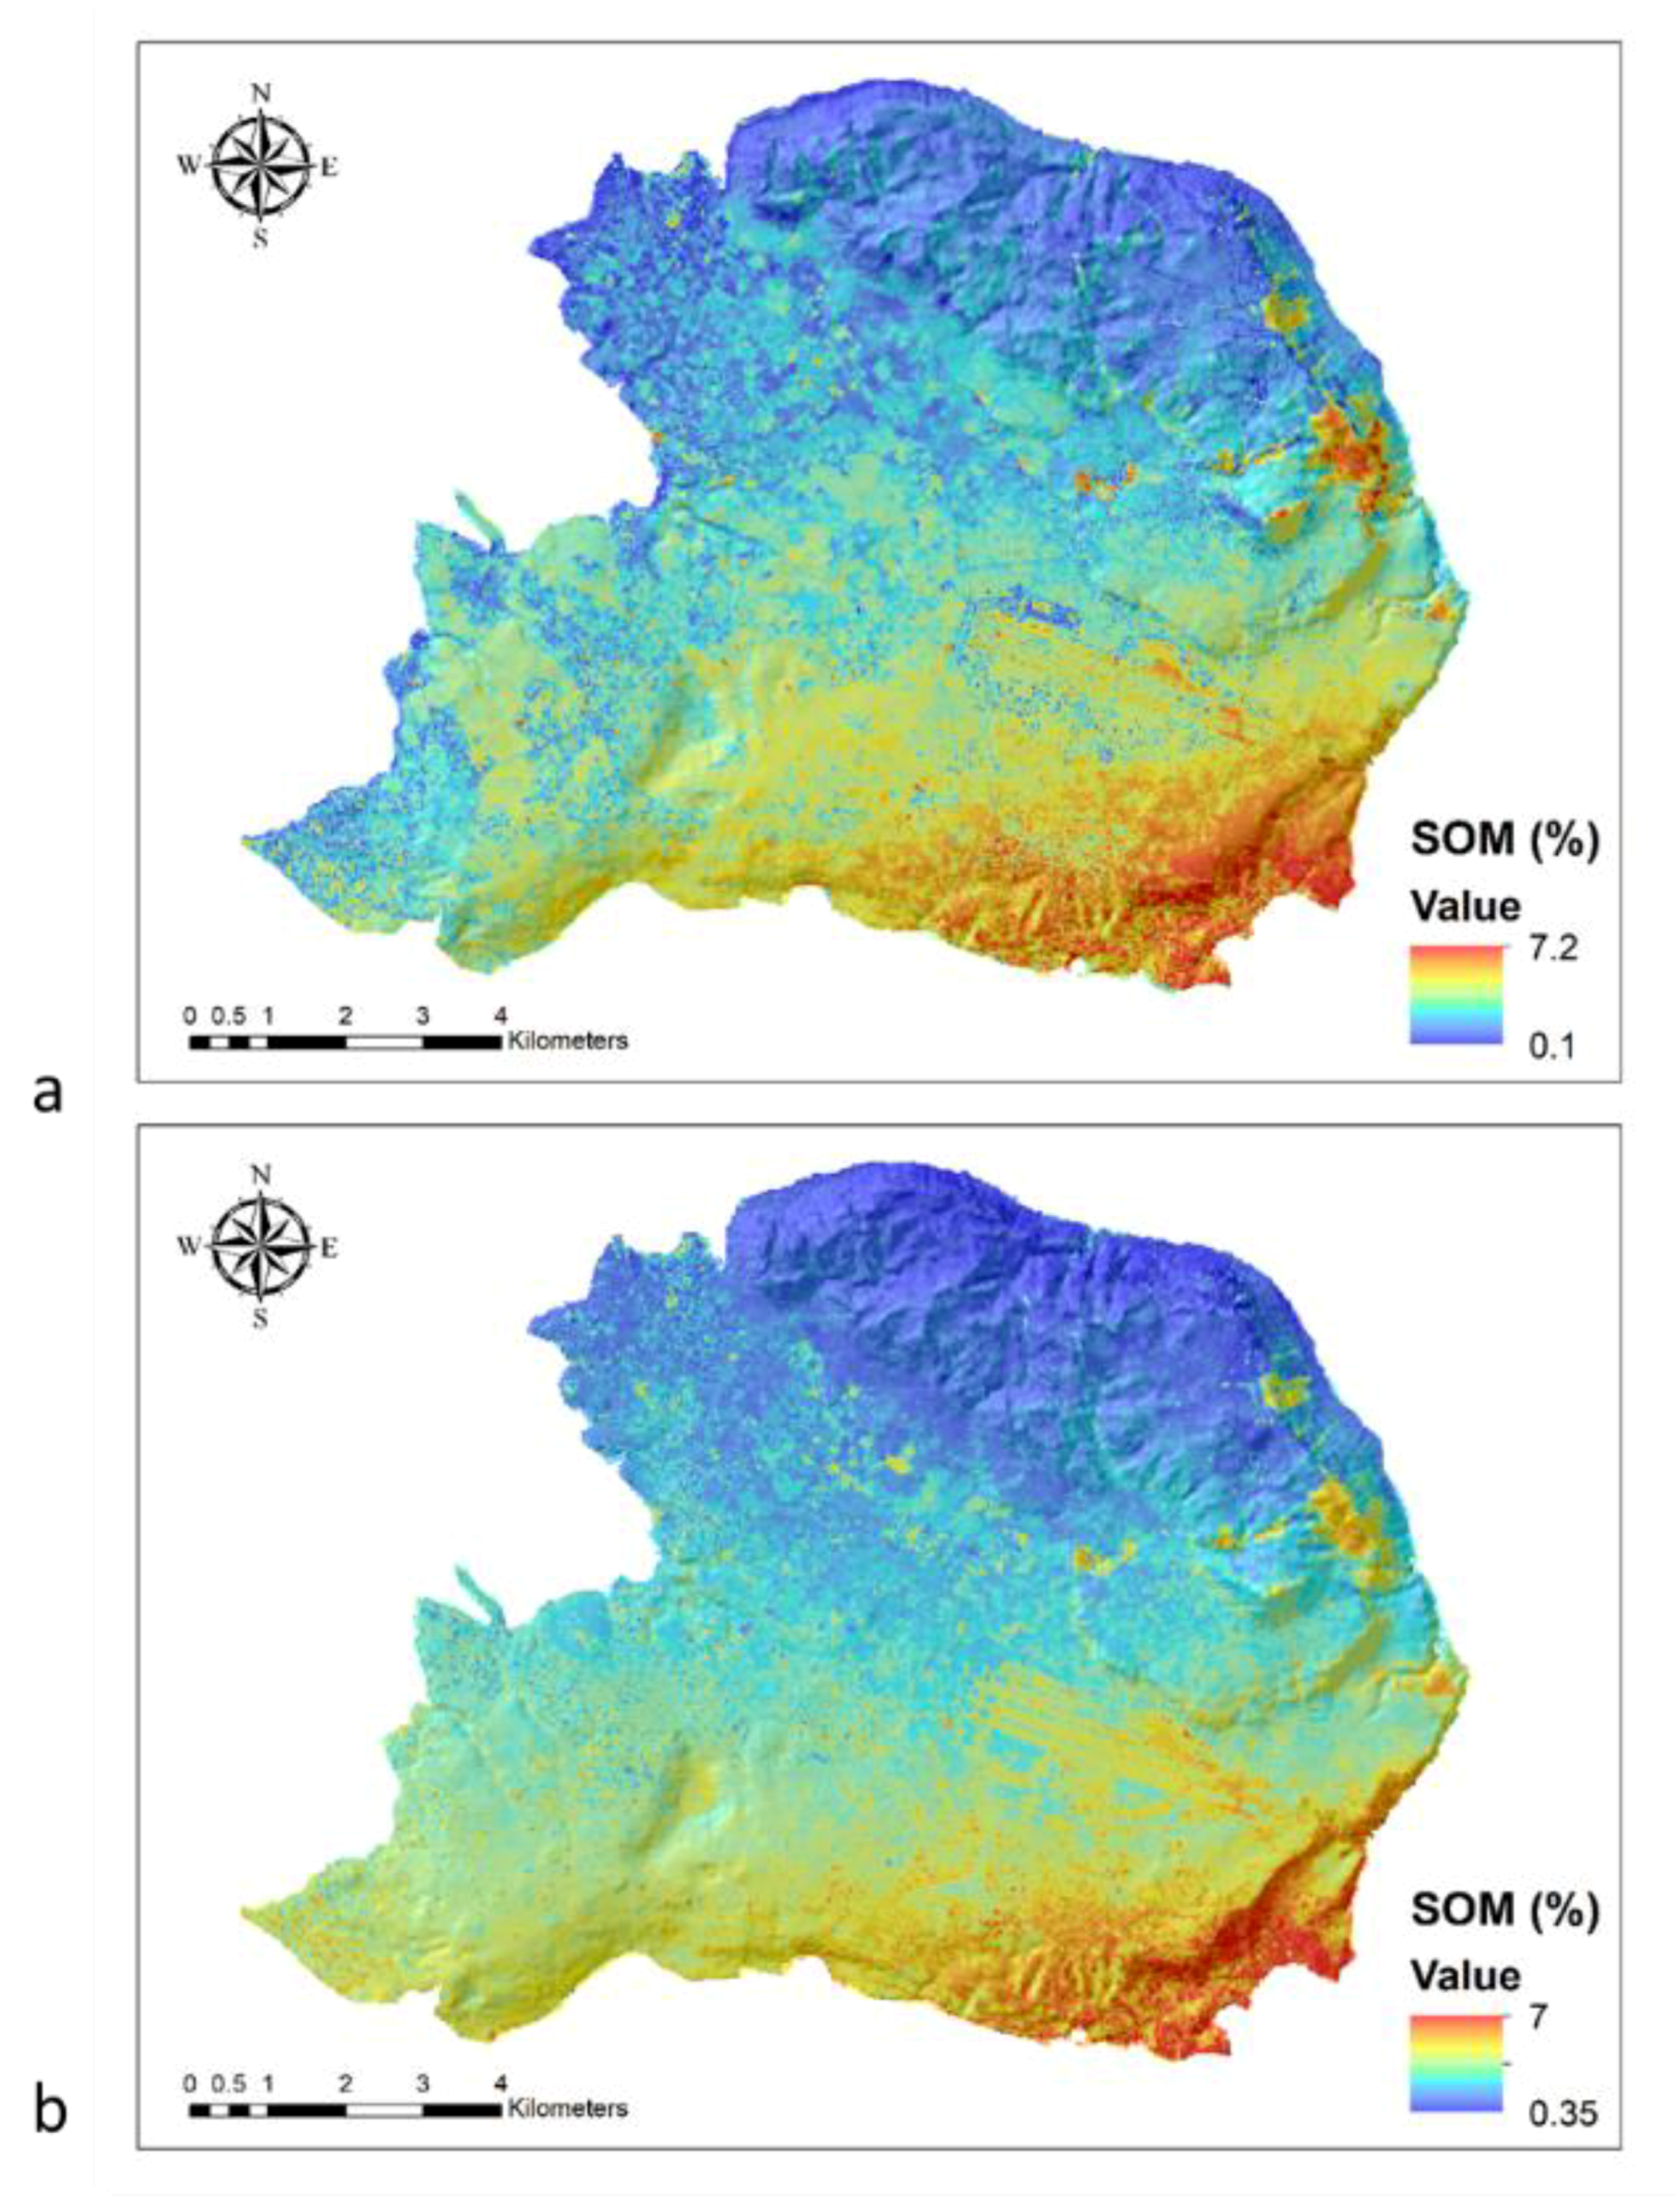
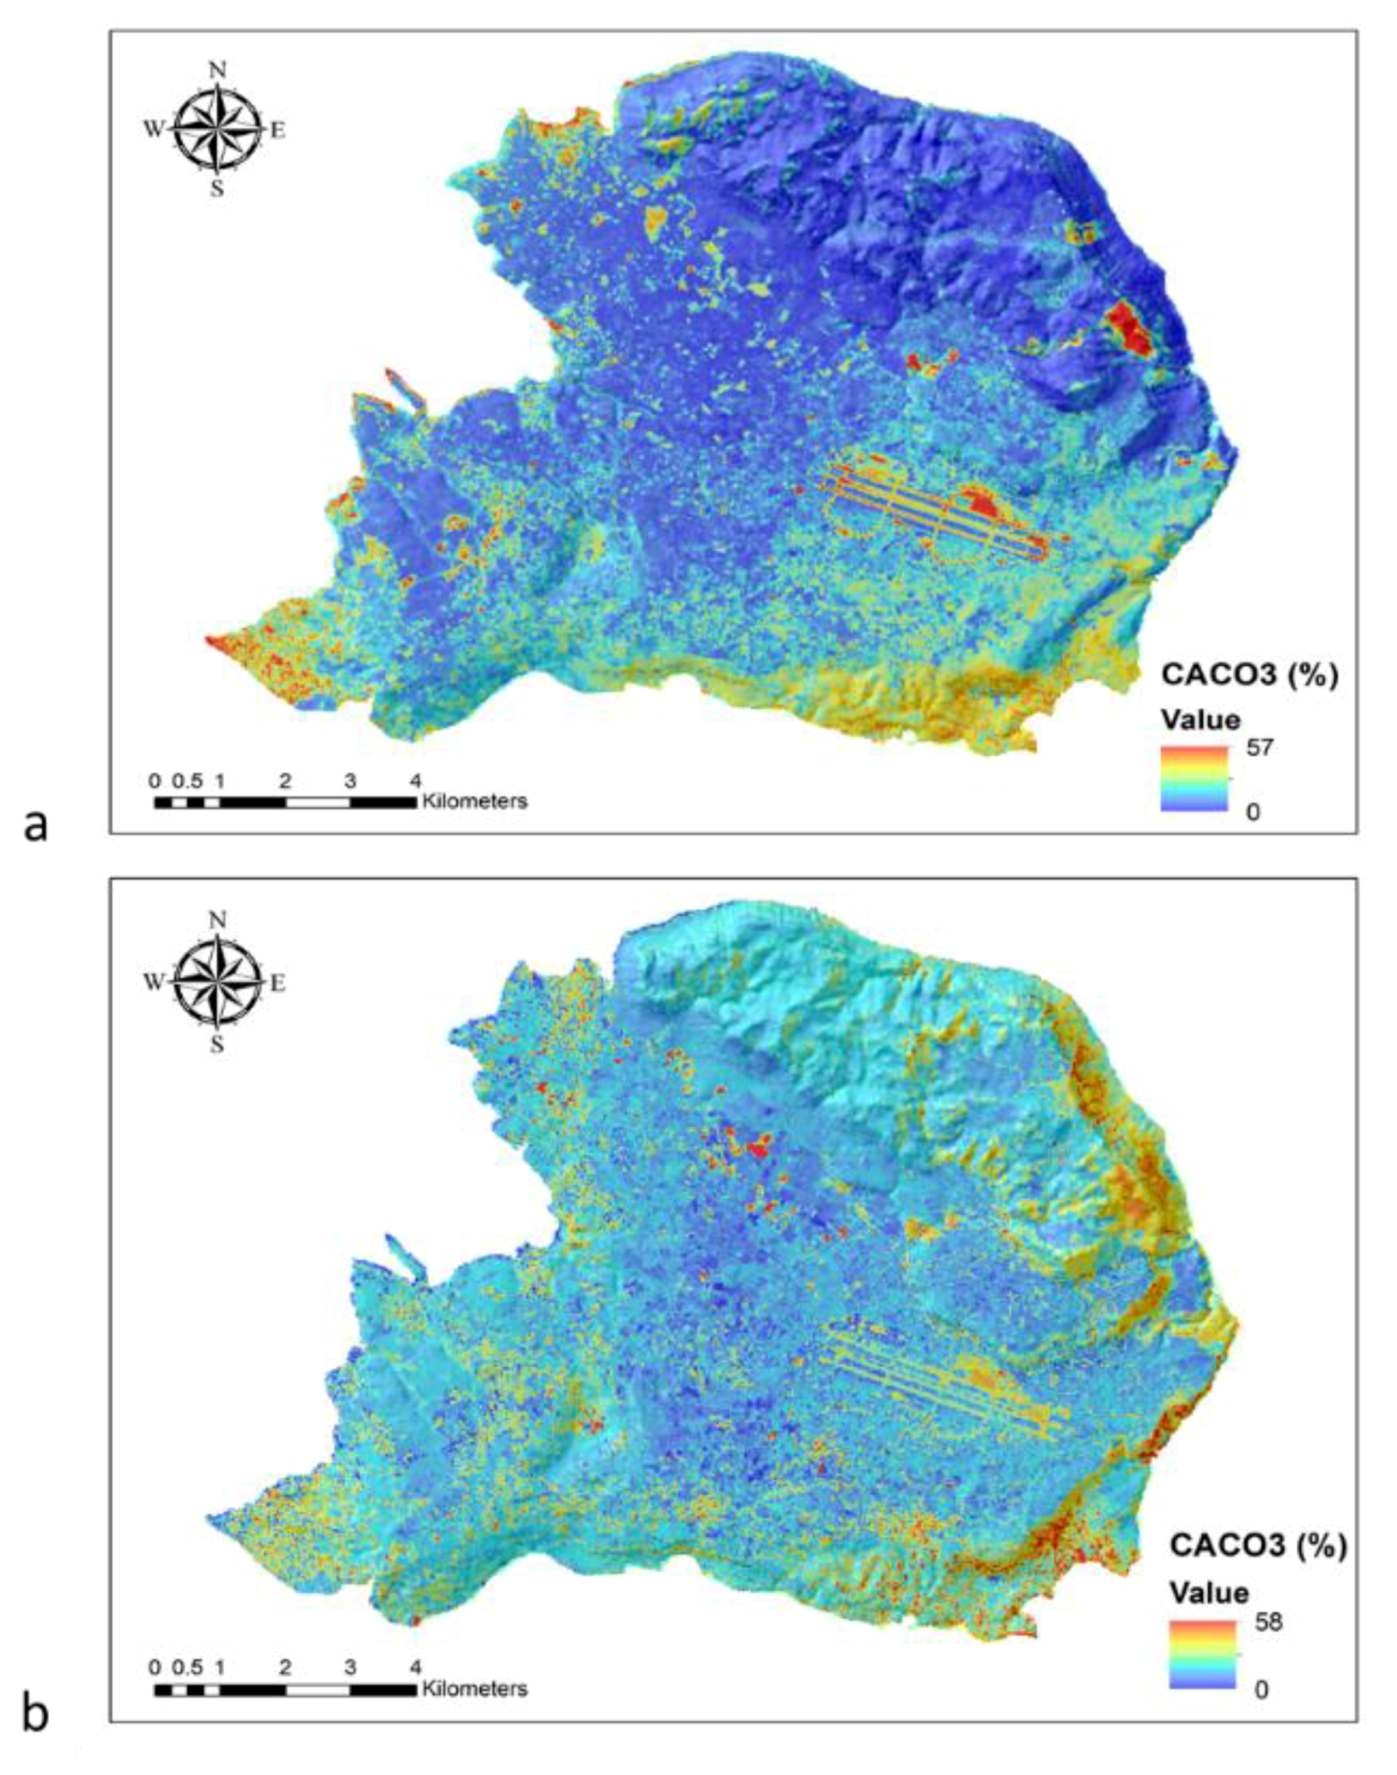
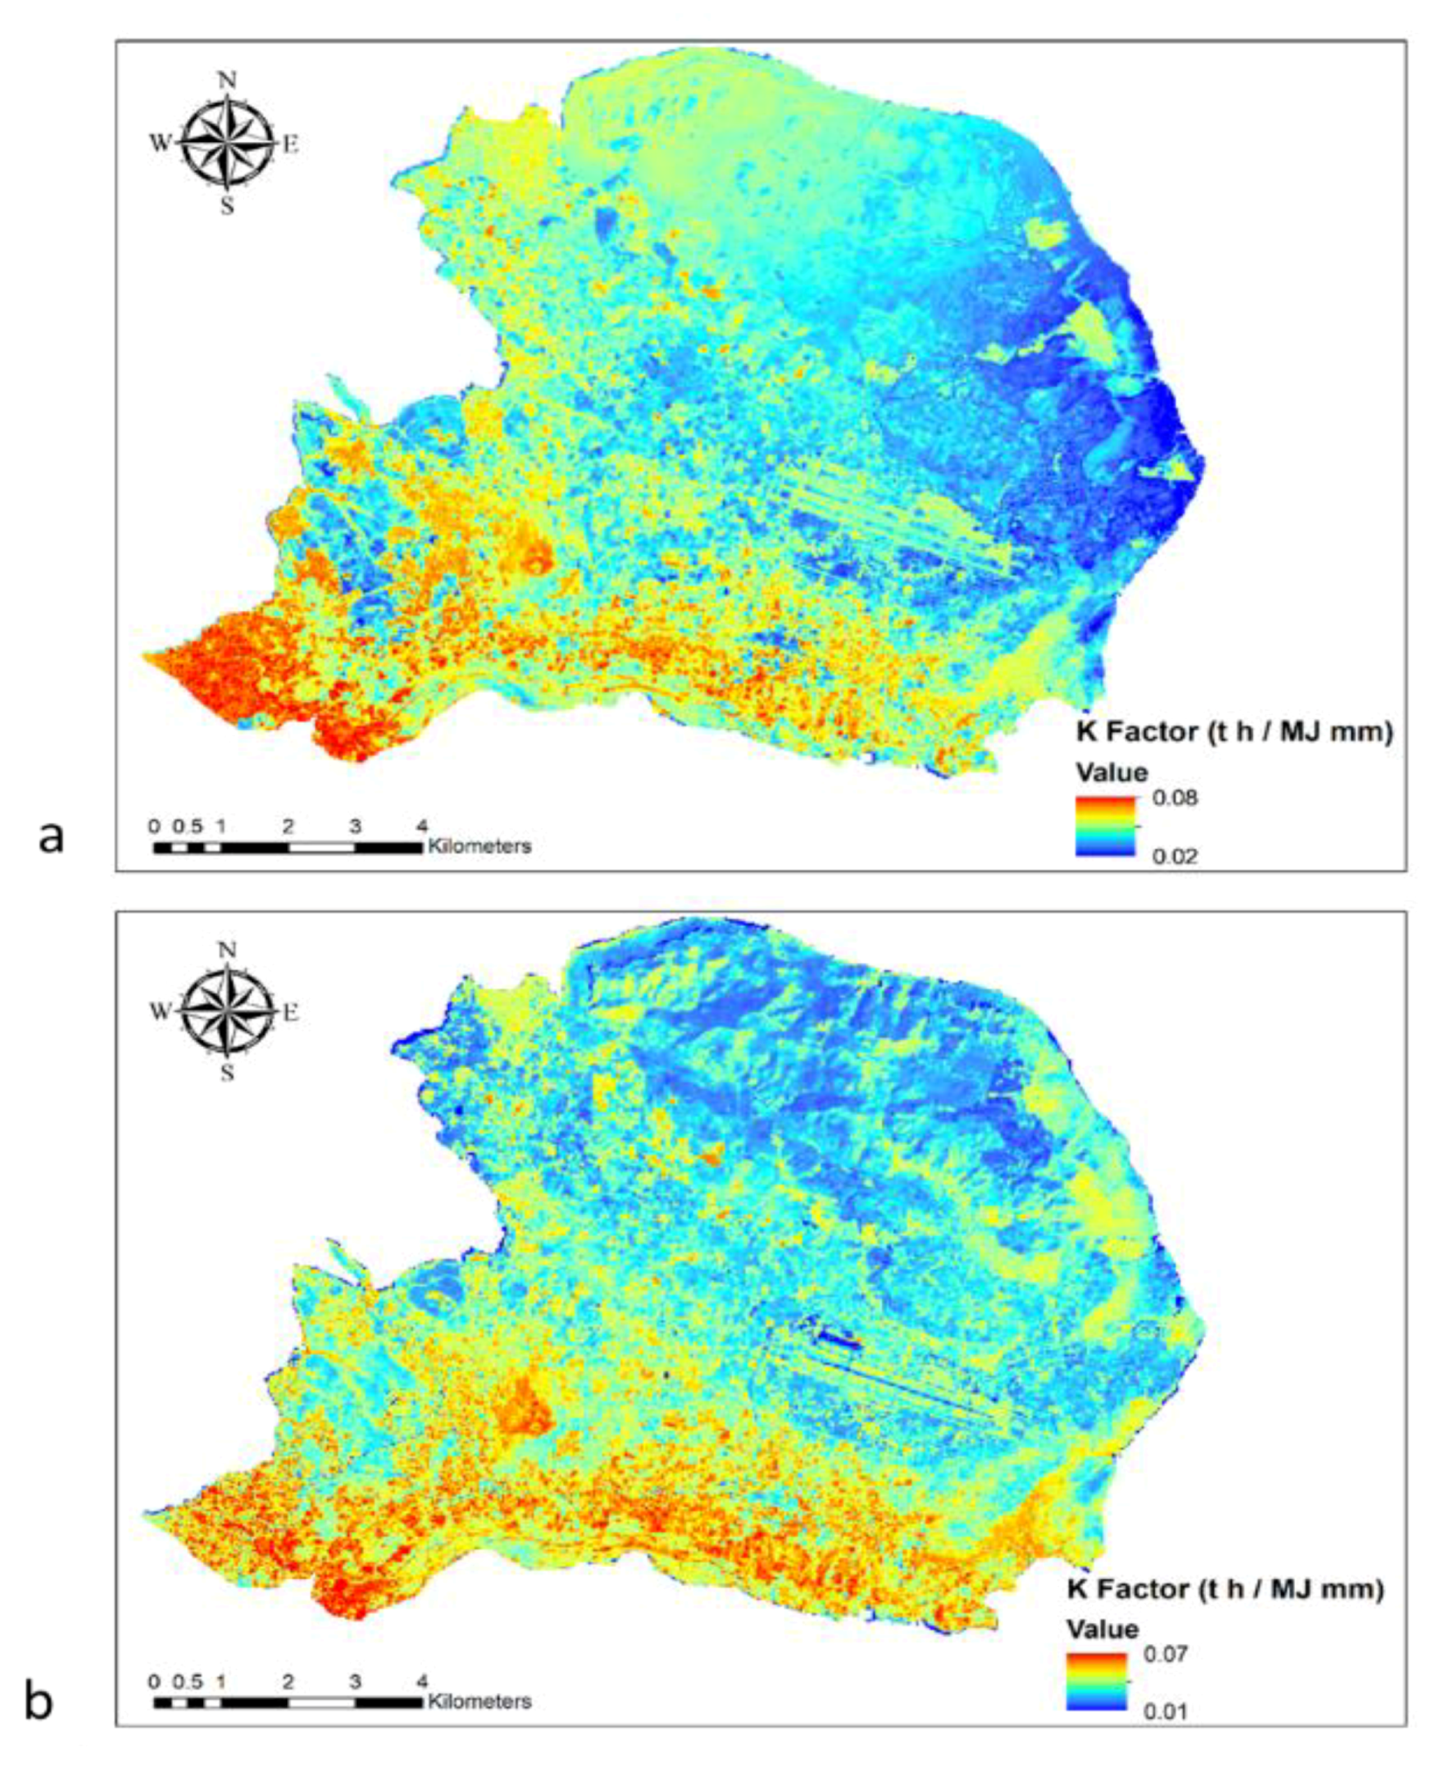
Following this, three individual maps were constructed from the synergistic use of ANN, satellite data, and laboratory analysis, modeling the SOM, the CaCO
3, and the K-factor, respectively. Specifically, the integration of the different approaches contributed to the development of six different maps concerning both satellite sensors, Sentinel-2 and Landsat 8 (
Figure 7a,b,
Figure 8a,b, and
Figure 9a,b). Furthermore, the ANN MLP simulation results produced good agreement with those measured in the field data in terms of R
2 and root-mean-square error (RMSE) (
Table 3 and
Table 4) for both Landsat 8 and Sentinel-2 satellite imageries.
In most cases, the results were within an acceptable range considering the complexity of the case study and the limited data availability. For both datasets, the SOM parameter was better simulated by the ANNs, which was expected since the dataset used was more diverse and its statistical characteristics were well distributed. In addition, these results in terms of R
2 were in accordance with the results of [
50], who estimated SOM with the use of ANN and remote sensing data. For the calculation of the K-factor, both SOM and CaCO
3 data were used (see Equation (1)), thus the uncertainty derived by both datasets was accumulated to the K-factor dataset, resulting in the worst simulation results amongst the three parameters simulated. However, because the study system was quite complex, the simulation was considered successful.
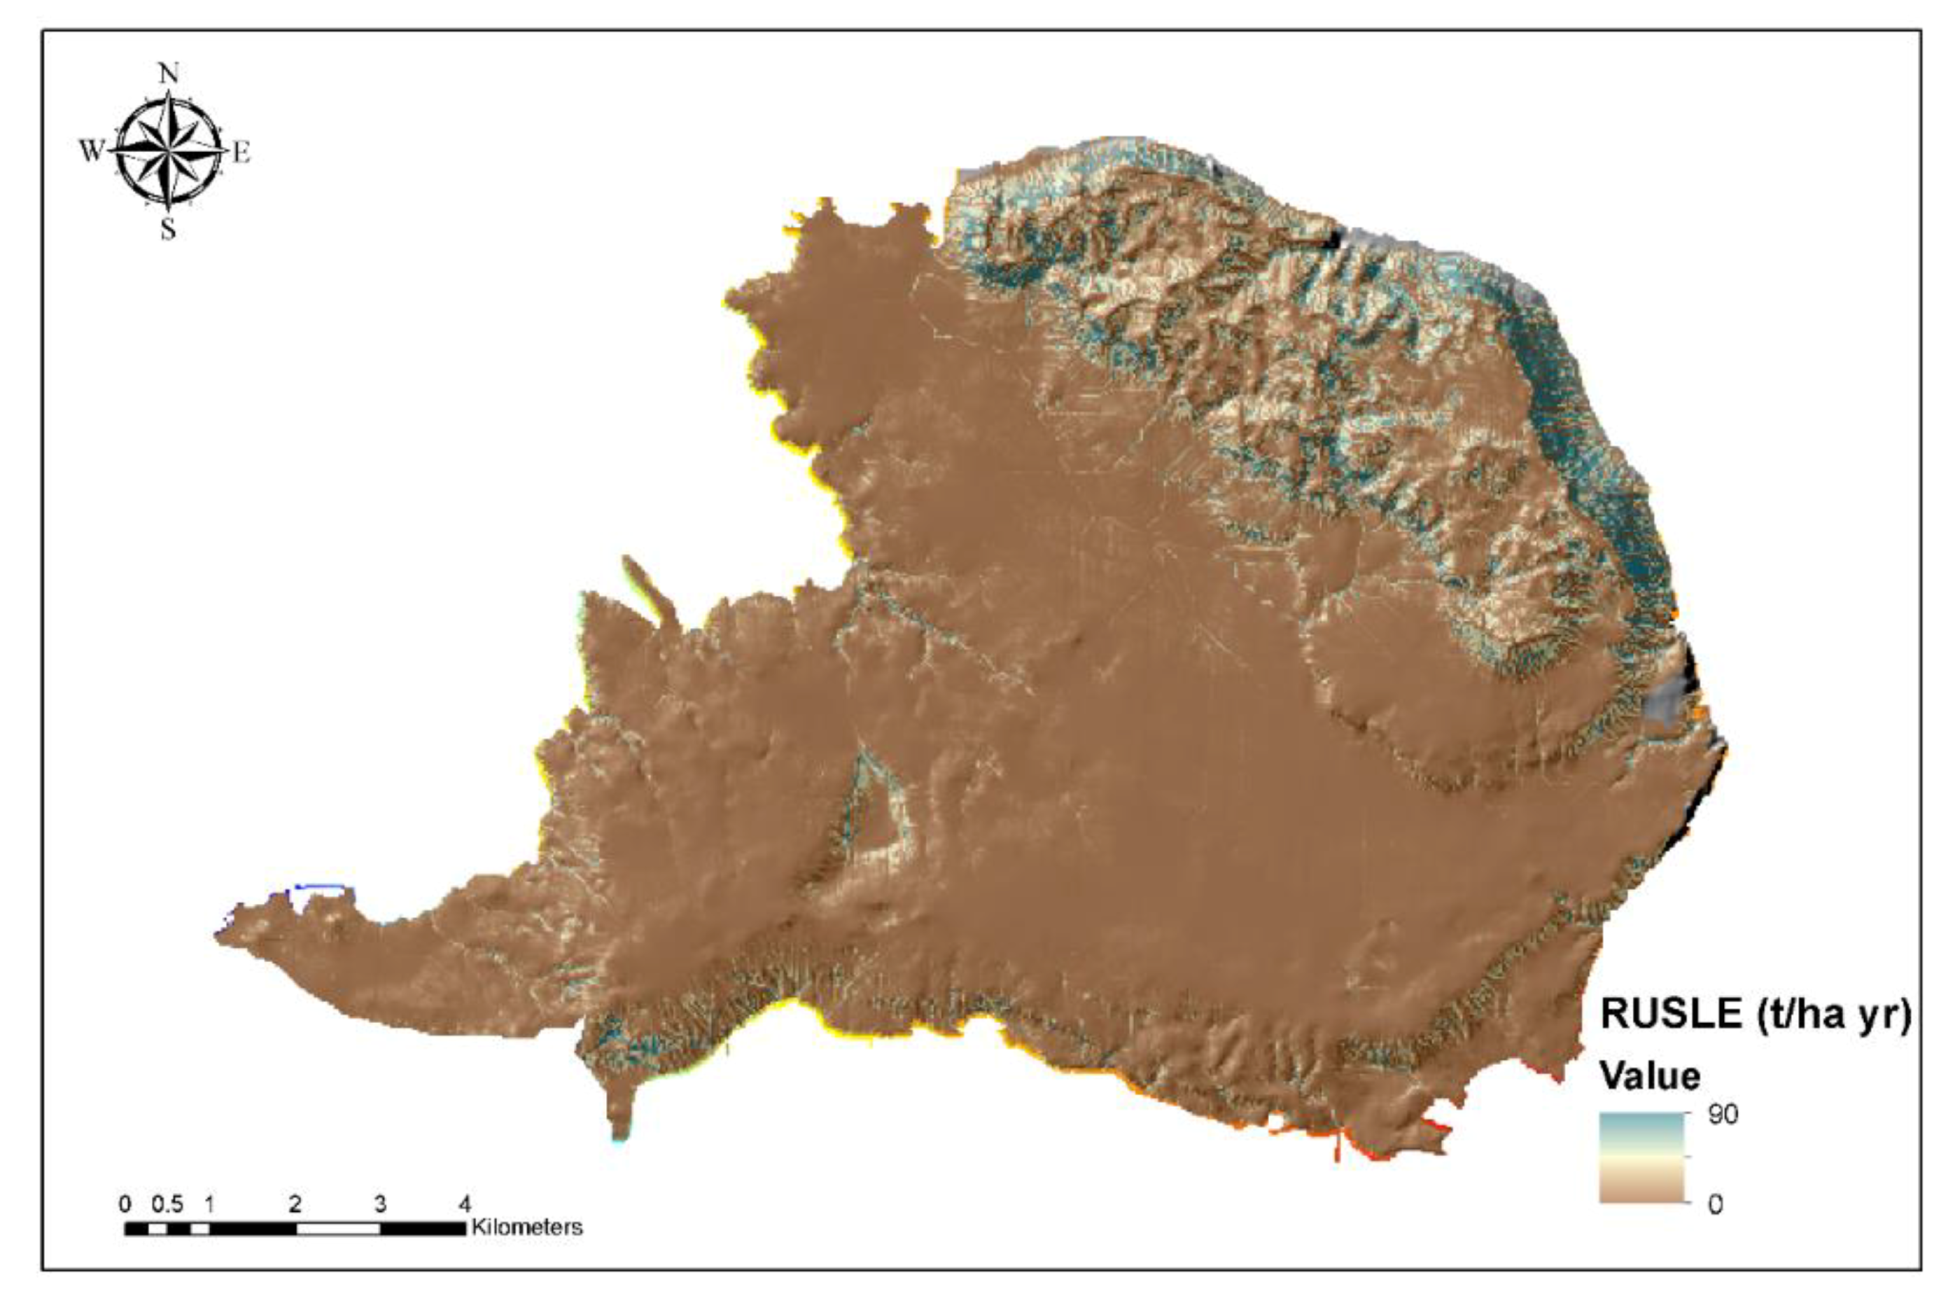
Using the RUSLE model, the final soil erosion map of the Akrotiri cape was developed (
Figure 10). The results denote high soil erosion risk in the northeastern part of the cape, where steep slopes occur. Specifically, an average soil loss rate of more than 80
was recorded for 2018 in the specific area.
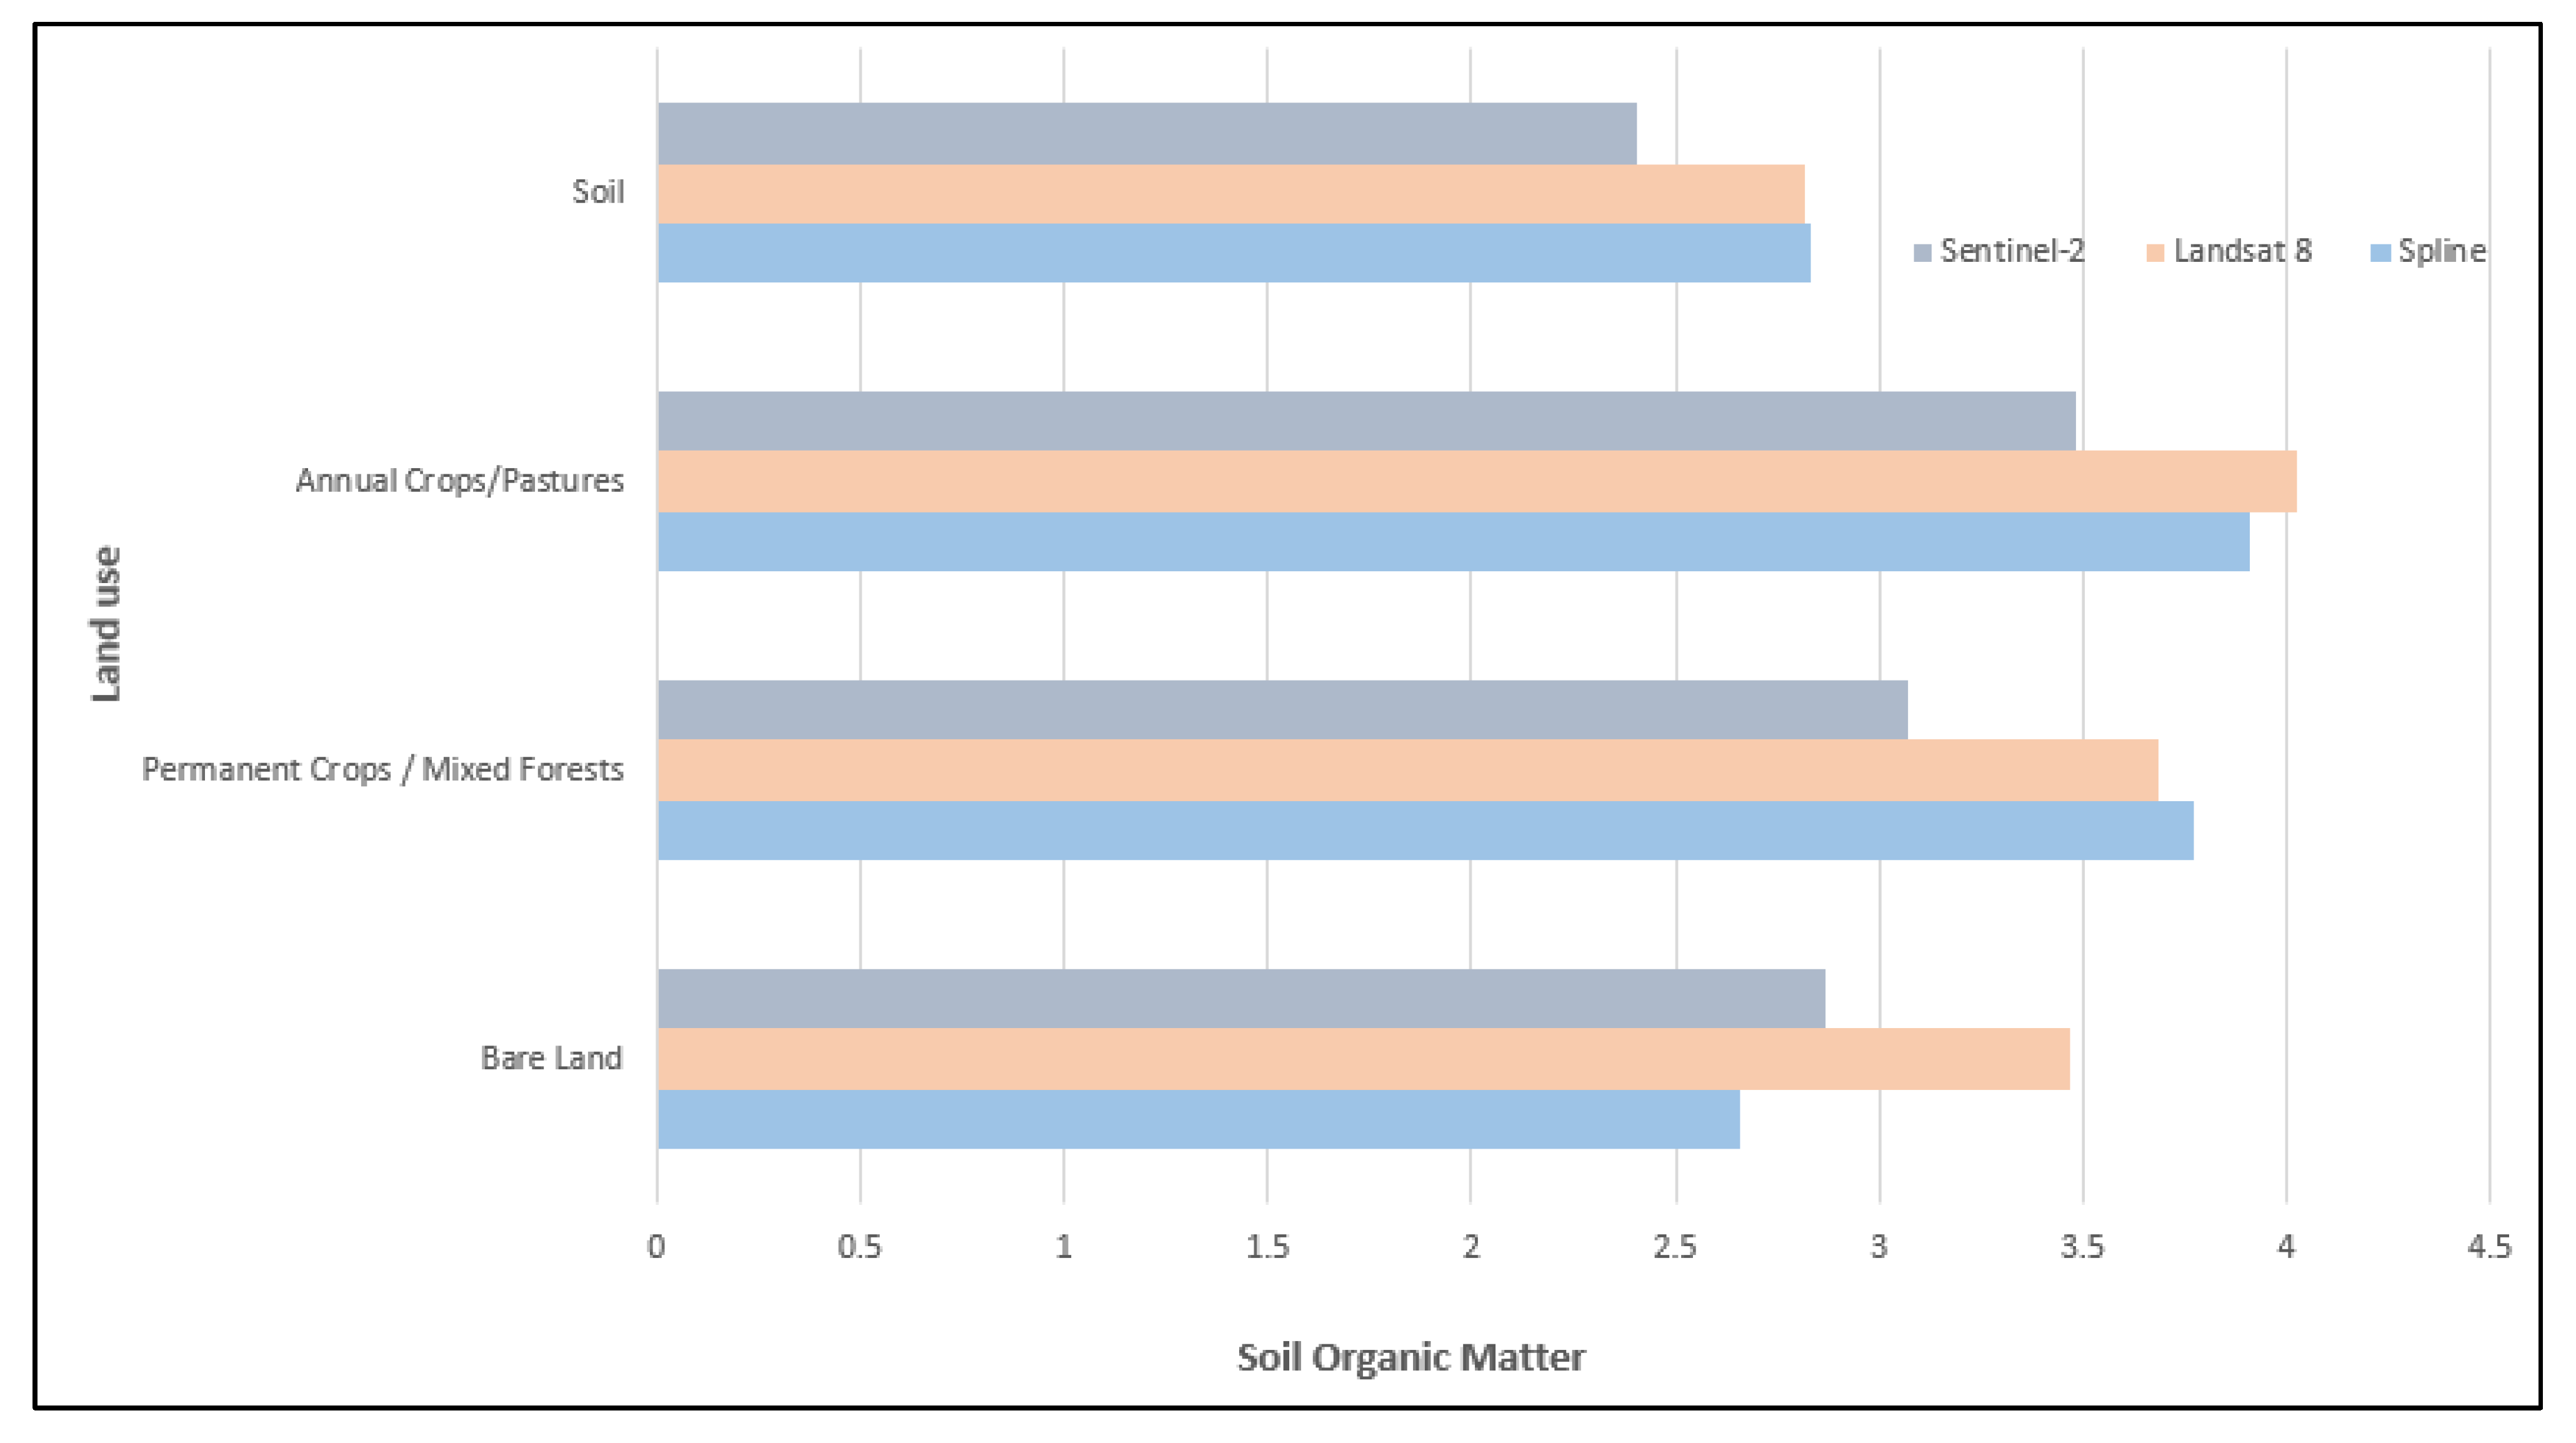
The study area was divided to four different land use classes according to CORINE 2006 land cover data, and zonal statistics were calculated in terms of SOM content using different methodological approaches (Spline interpolation, Sentinel-2, and Landsat-8). The results denote the trend of the Sentinel-2 methodology to underestimate SOM values compared to the Spline and the Landsat 8 approaches (
Figure 11).
The study area was divided according to topography and the RUSLE results into affected (>50 m height) and no erosion-affected areas (<50 m height). The affected areas were delineated in the northeastern part of the cape where high slope inclinations occur, and corresponding high soil loss rates were recorded (approximately 80
). The less erosion prone areas were delineated in the almost flat areas in the central part of the cape, where minimum soil loss rates (~6
) were recorded.
Table 5 indicates the statistical correlation between soil loss rates and SOM measurements in the above-mentioned areas. The results highlight the fact that the average SOM deposits decrease in areas that suffer from water soil erosion due to the phenomenon of topsoil removal.
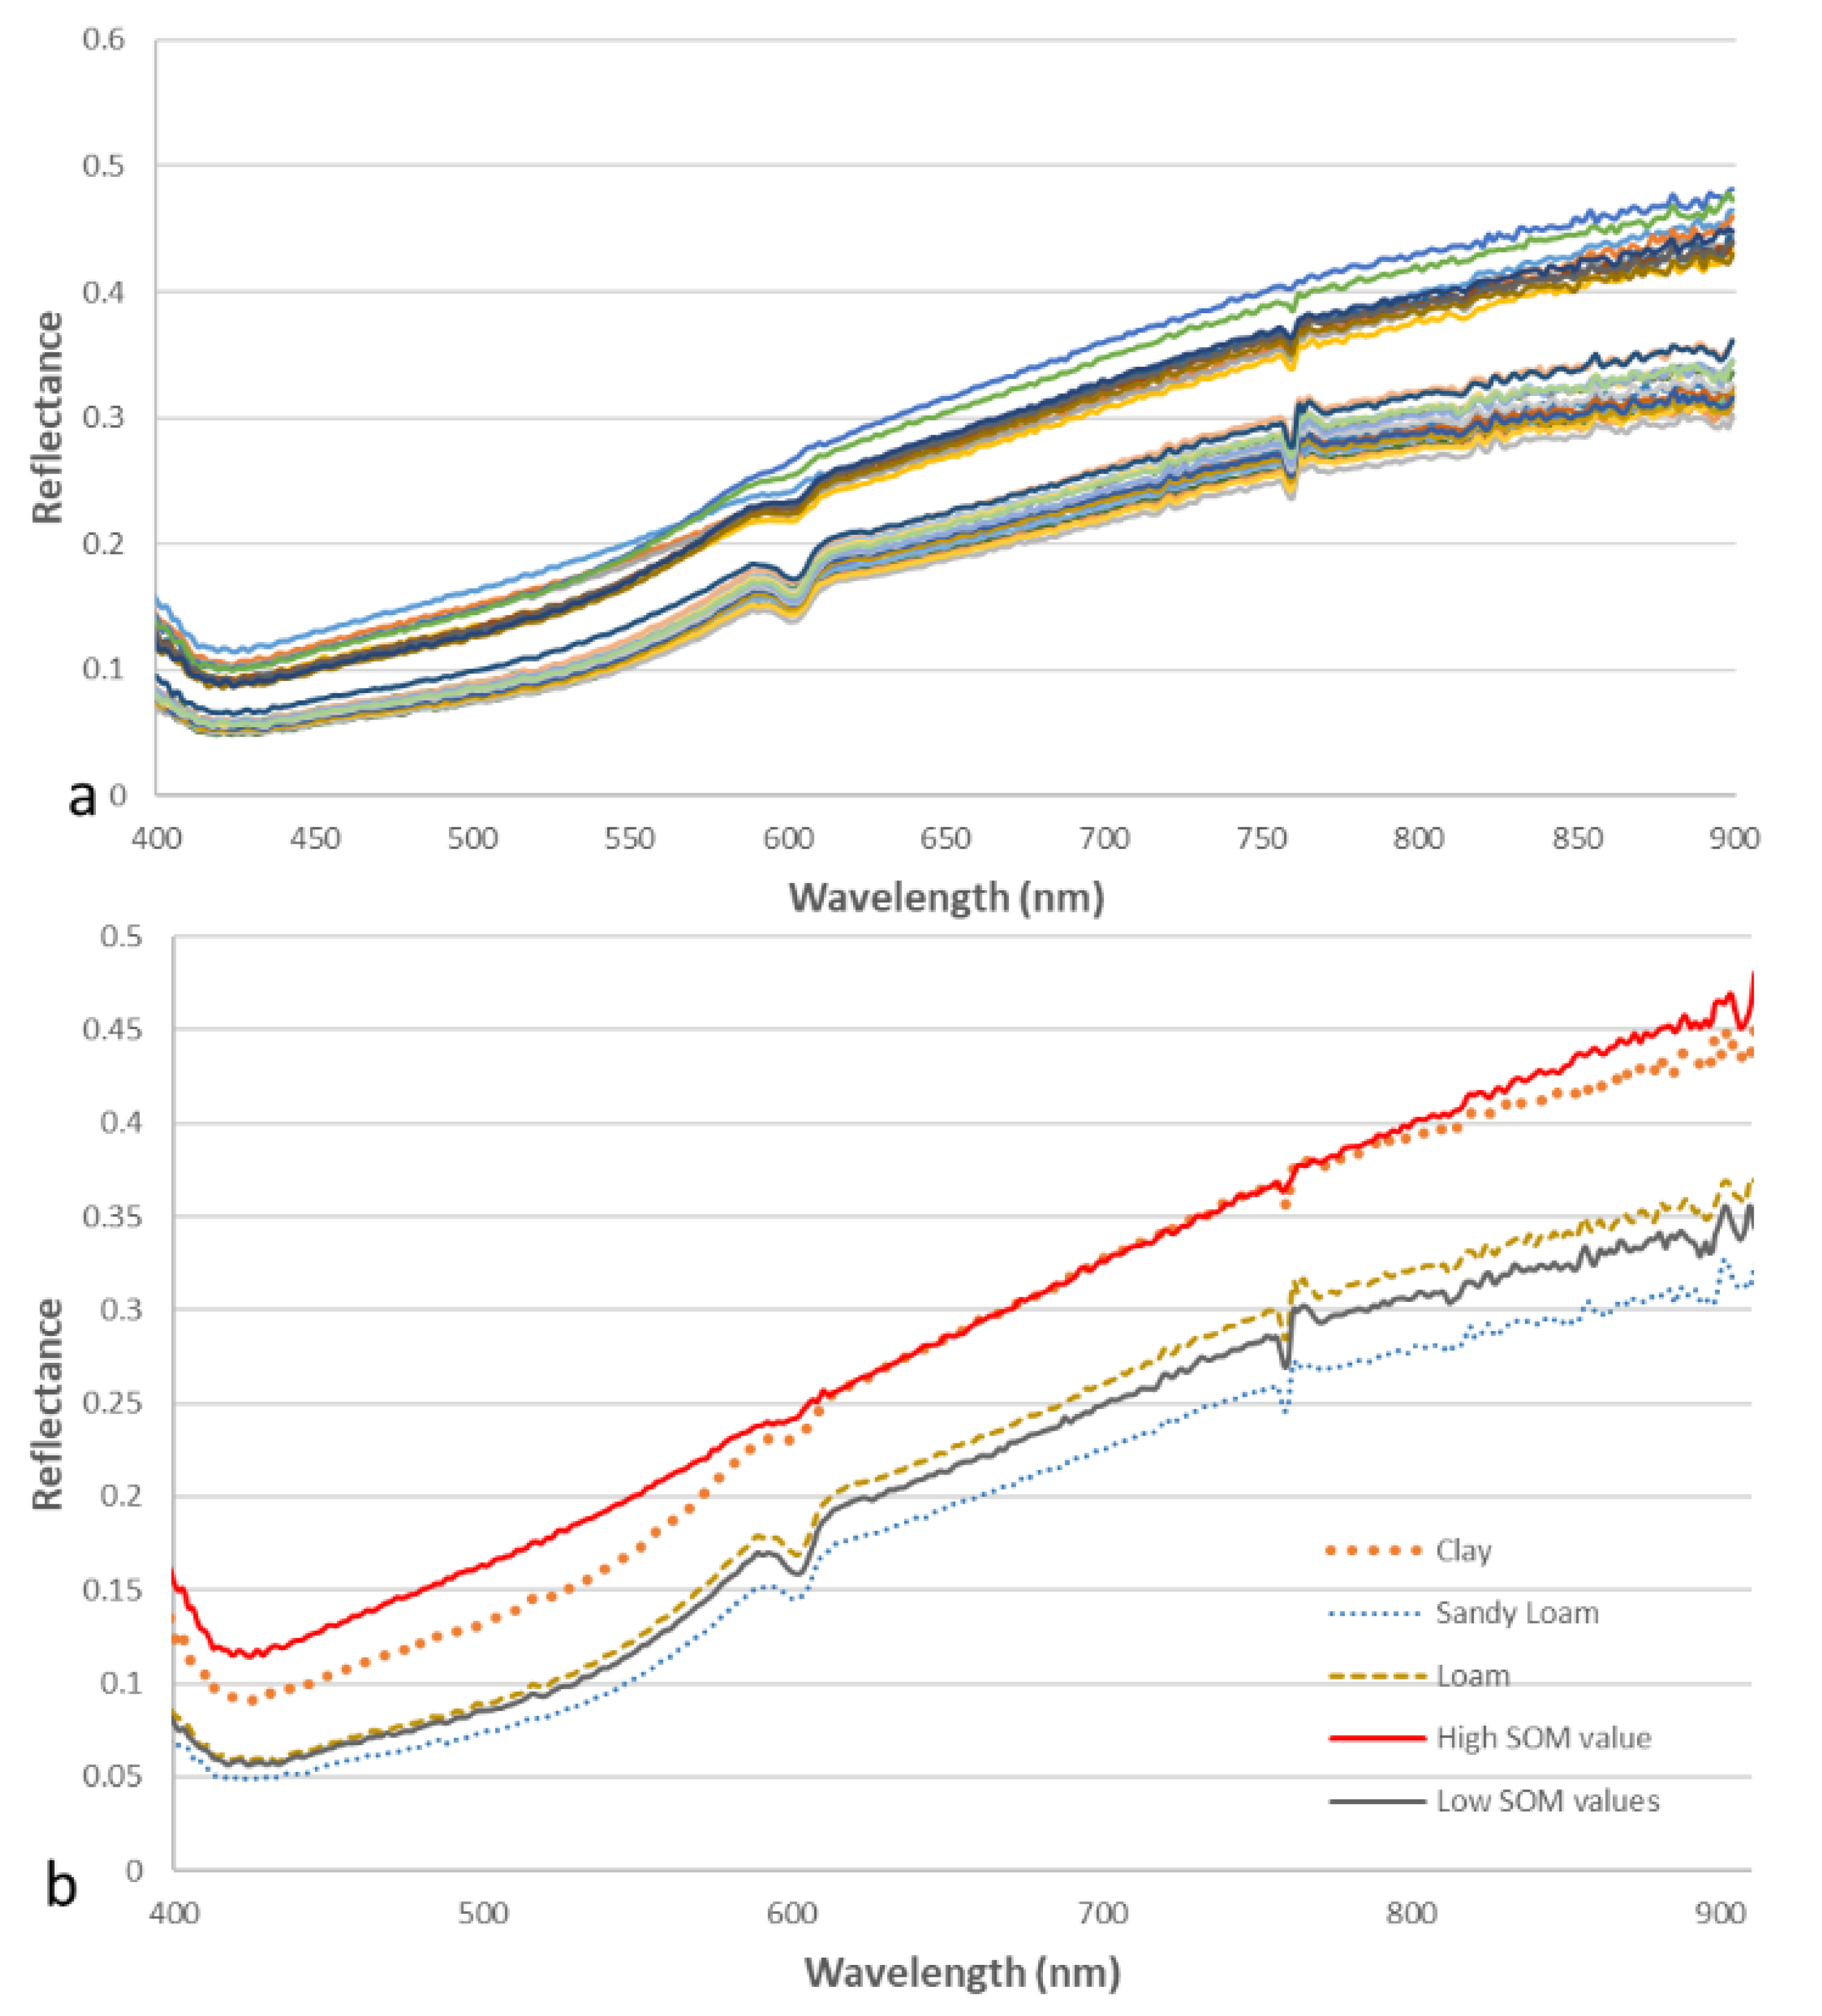
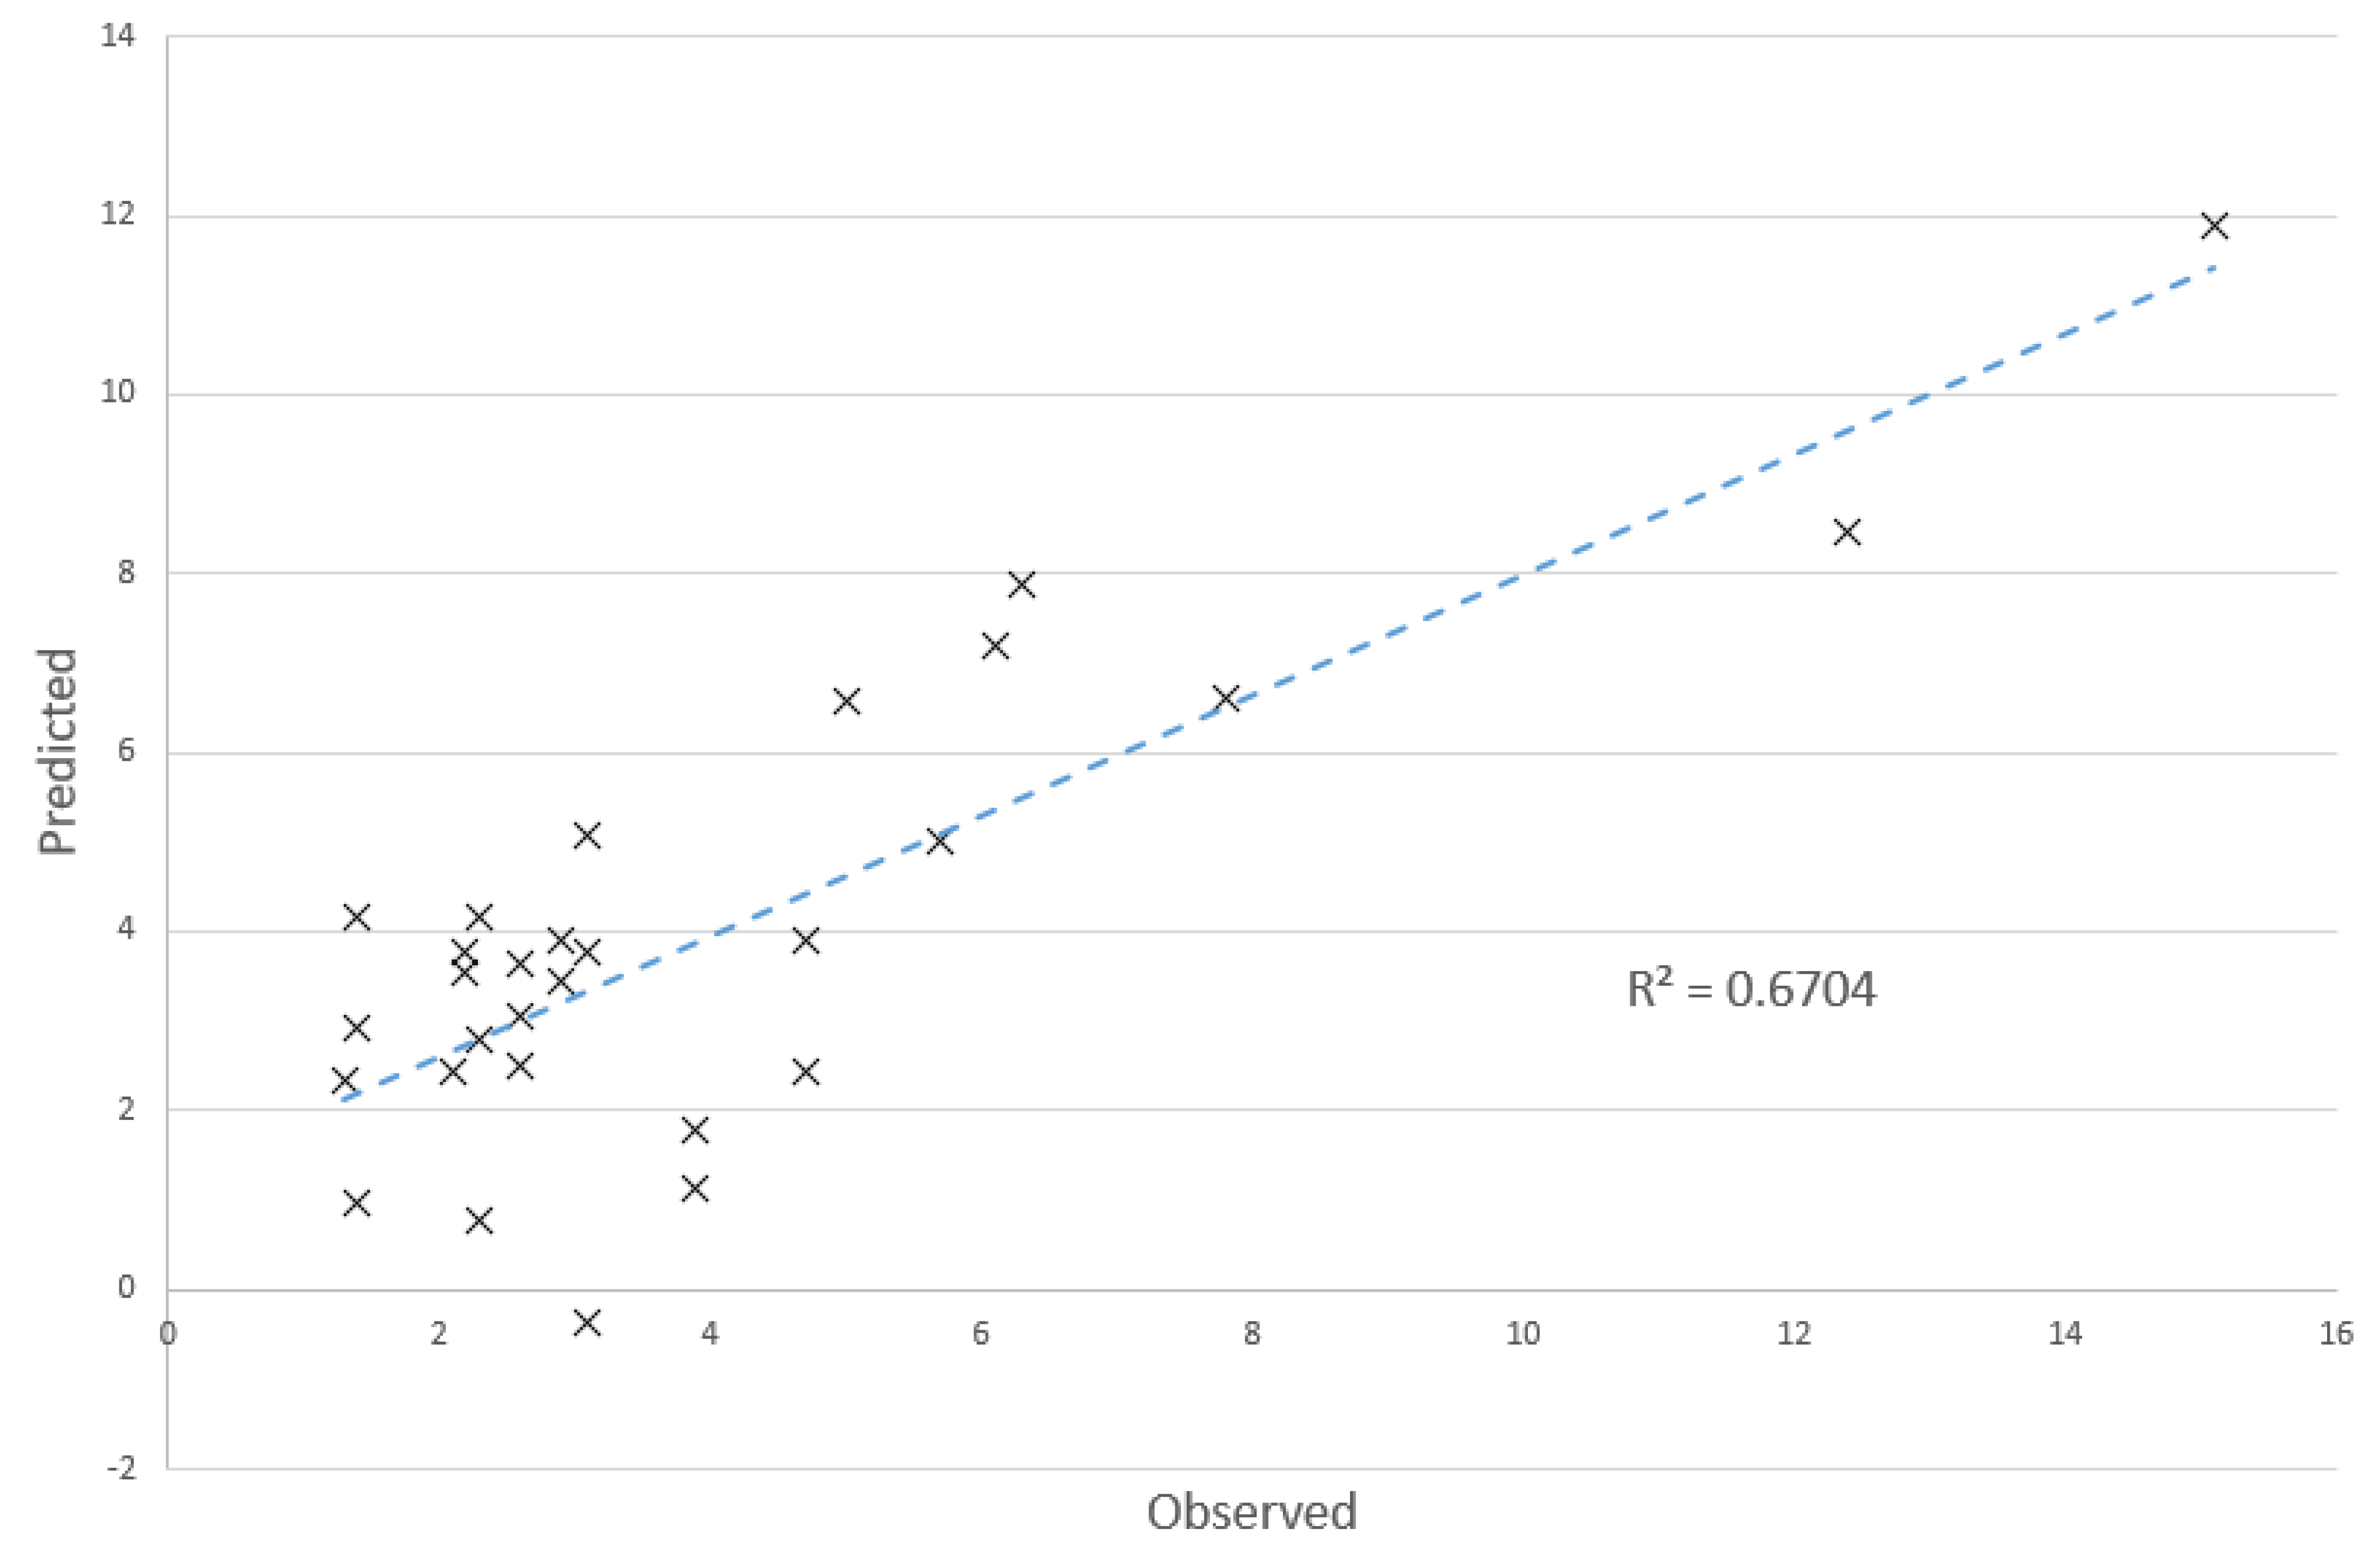
Following this, the OLSR methodology was applied to correlate the SOM parameter with the soil samples’ corresponding spectral signatures, as derived from field spectroscopy campaigns. As it was previously stated, in case there is an initial filtering of the vast number of the available spectral bands, the field spectroscopy can be a valuable tool in modeling and predicting soil parameters with means of spectral analysis. The value of
R2 = 0.67, as indicated in
Figure 12, is promising for actively incorporating field spectroscopy in soil studies.
The results concerning the application of the GWR methodology for comparing the RUSLE, the slope inclination (degrees), and the SOM datasets in terms of
R2 are presented in
Table 6.
The
R2 values describe the overall fit of the developed models. The results denote the ultimate correlation of SOM with the terrain morphology in terms of slope inclination. On the other hand, the low
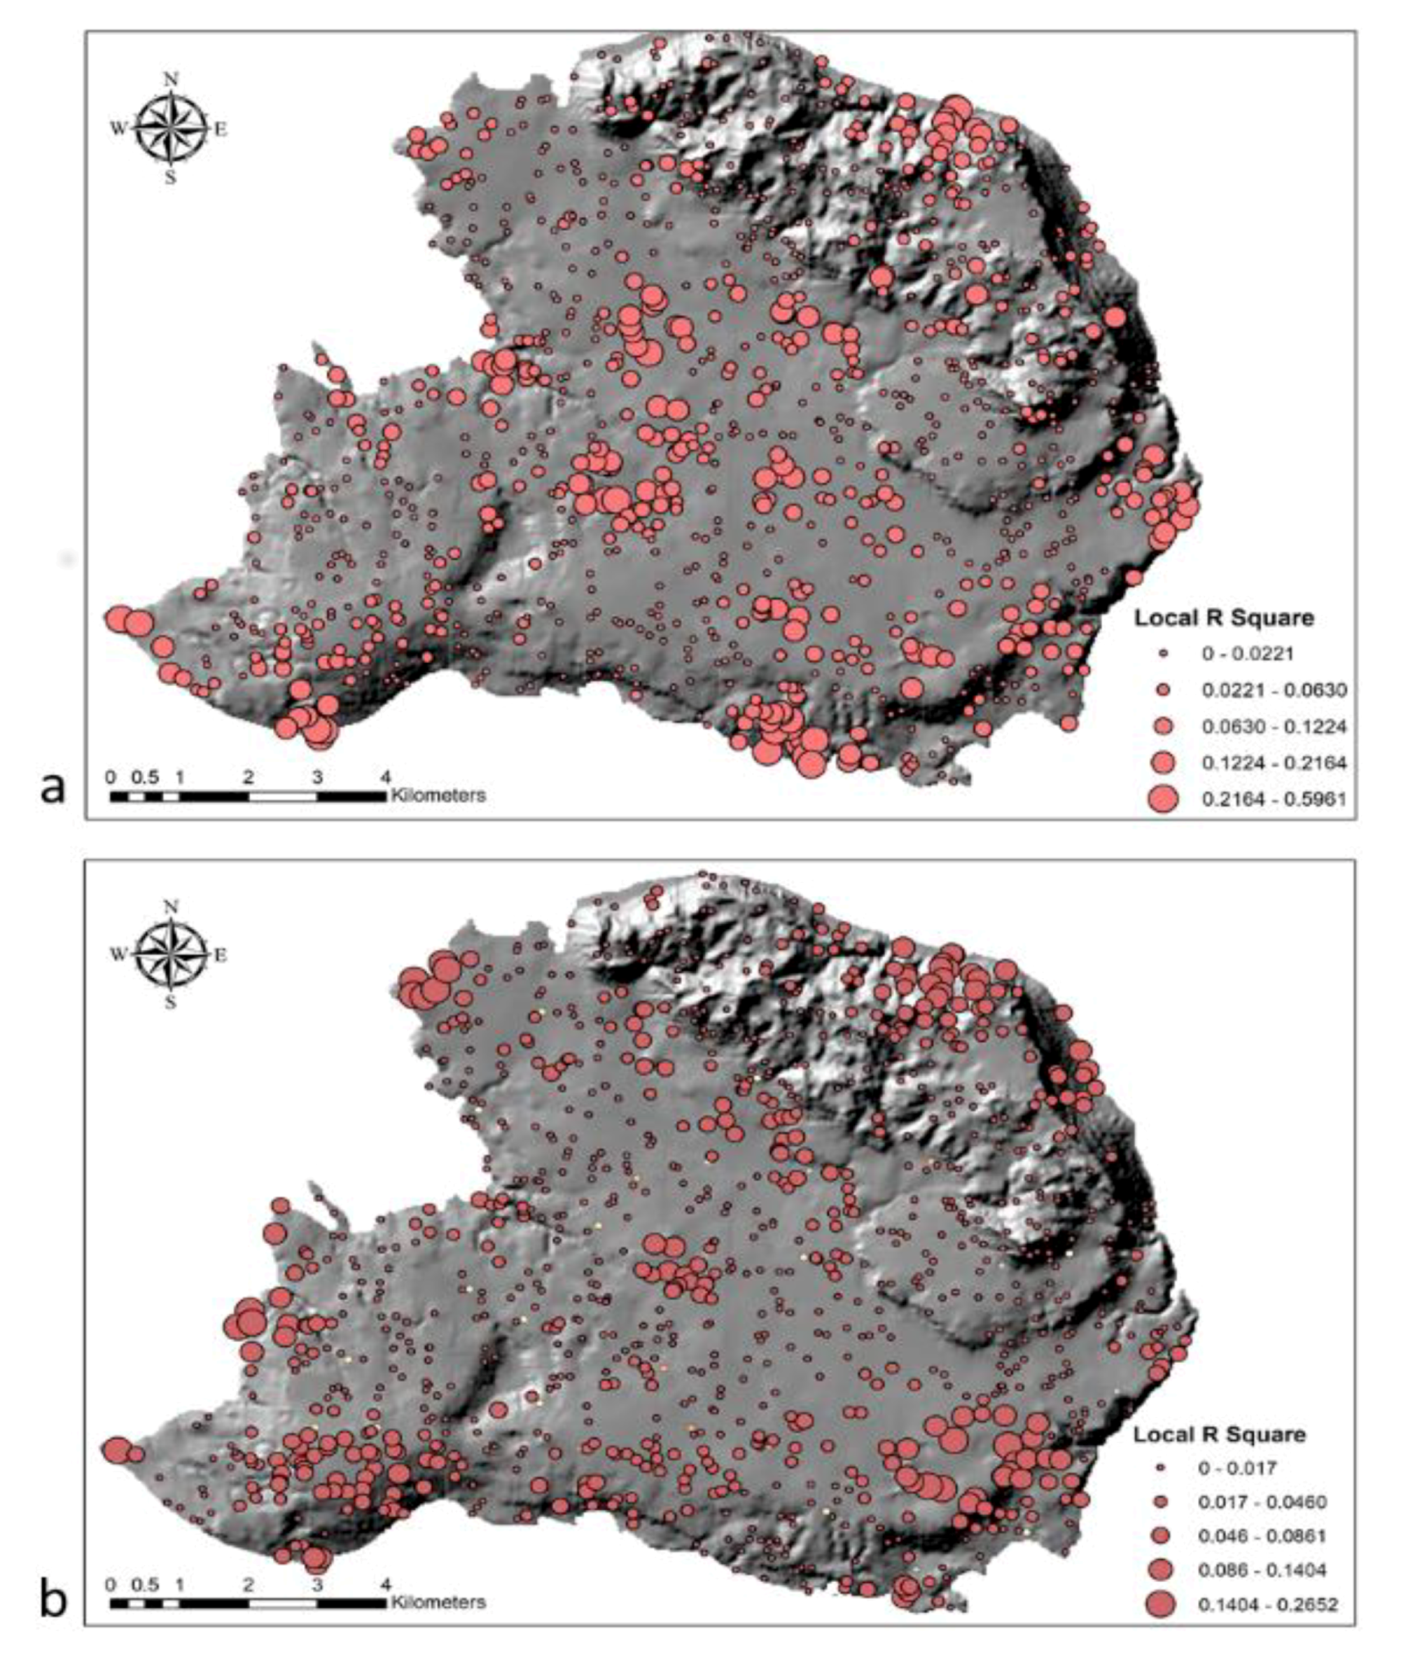
R2 values concerning comparison of the soil loss model with the SOM parameter highlight the multi-parametric nature of the soil erosion phenomenon, which cannot be actually described with the employment of a unique variable such as SOM. In
Figure 13, the overall spatial allocation of local
R2 values concerning the correlation between the RUSLE and the ANN satellite derived SOM products is presented. It seems that Landsat 8 had greater spatial allocation of high
R2 values across the study area (
Figure 13a).
5. Conclusions
Greece is a Mediterranean Europe hotspot extremely prone to soil erosion. Both Mediterranean land managers and stakeholders need sound, evidence-based information about land degradation patterns and the effectiveness of their management responses [
8]. Obtaining such information, however, is particularly difficult in Mediterranean grazing lands, where a long history of anthropogenic pressure, high topographical and climatic variability, and frequent disturbances combine to create a highly diverse and unstable environment.
This paper highlights the significance of determining the soil erosion threat using both EO and field spectral VIS-NIR data in order to monitor soil regime and adopt the appropriate measures and practices for soil conservation and sustainable land use. Furthermore, the manuscript highlights the potential of the ANN inversion model for the estimation of the soil erosion phenomenon with the use of EO data. The collection of crucial in situ soil parameters data such as SOM and CaCO3 in remote areas is often an impractical, expensive, and time-consuming process; therefore, the development of alternative data collection methodologies is indispensable. In this context, efficient spatial simulations of the crucial soil parameters, SOM and CaCO3, were carried out using field spectral VIS-NIR measurements and satellite remote sensing observations (Sentinel-2 and Landsat 8) combined with non-linear (ANNs) approaches. The derived maps successfully captured the SOM and the CaCO3 spatial distribution in the GIS environment (approximately 80% R2 for images from both sensors). It is important to state that the results are optimum for SOM compared to CaCO3. Accordingly, the aforementioned maps were used for the spatial estimation of K-factor, which formed the main data input in the RUSLE model to estimate the soil erosion risk in the study area. The results depicted increased soil erosion risk in the northeastern part of the Akrotiri cape, where steep slopes occur. In addition, field spectroscopy data were collected for various soil samples, and statistical analysis (OLSR and GWR) was carried out to compare them to relevant soil parameters (SOM and CaCO3) values. The high corresponding R2 values (67%) for OLSR denoted the potential of field spectroscopy to describe soil health effectively. Finally, the results highlighted the fact that the terrain morphology is absolutely related to soil erosion rates rather than SOM values that cannot successfully describe the soil erosion regime.
The presented approach forms a sufficient methodology for incorporating EO data in monitoring soil parameters and consequently estimating soil erosion. Results demonstrate that the retrieval of soil parameters is possible by using satellite data, either Sentinel-2 or Landsat 8, and an inversion algorithm, making the whole process both time and cost efficient. This overall approach will contribute to the design of good soil erosion management practices and wise land use planning in the study region or wherever it is needed. In addition, this work can provide significant guidelines for defining and monitoring additional areas susceptible to soil erosion. Future research will focus on further data collection in broader areas for a more accurate validation of the results.

 ,
, 


