Article

A Comprehensive Evaluation of 4-Parameter Diurnal Temperature Cycle Models with In Situ and MODIS LST over Alpine Meadows in the Tibetan Plateau

1
Key Laboratory of Ecohydrology of Inland River Basin, Northwest Institute of Eco-Environment and Resources, Chinese Academy of Sciences, Lanzhou 730000, China
2
College of Resources and Environment, University of Chinese Academy of Sciences, Beijing 100049, China
3
State Key Laboratory of Cryospheric Sciences, Northwest Institute of Eco-Environment and Resources, Chinese Academy of Sciences, Lanzhou 730000, China
4
Shaanxi Key Laboratory of Earth Surface System and Environmental Carrying Capacity, Northwest University, Xi’an 710027, China
5
College of Urban and Environmental Sciences, Northwest University, Xi’an 710027, China
*
Author to whom correspondence should be addressed.
Remote Sens. 2020, 12(1), 103; https://doi.org/10.3390/rs12010103
Submission received: 9 December 2019 / Accepted: 23 December 2019 / Published: 27 December 2019

Abstract

:
Diurnal variation of land surface temperature (LST) is essential for land surface energy and water balance at regional or global scale. Diurnal temperature cycle (DTC) model with least parameters and high accuracy is the key issue in estimating the spatial–temporal variation of DTC. The alpine meadow is the main land cover in the Tibetan Plateau (TP). However, few studies have been reported on the performance of different DTC models over alpine meadows in the TP. Four semi-empirical types of DTC models were used to generate nine 4-parameter (4-para) models by fixing some of free parameters. The performance of the nine 4-para DTC models were evaluated with four in situ and MODIS observations. All models except GOT09-dT-ts (dT means the temperature residual between T0 and T (t→∞); ts means the time when free attenuation begins) had higher correlation with in situ data (R2 > 0.9), while the INA08-ts model performed best with NSE of 0.99 and RMSE of 2.04 K at all sites. The GOT09-ts-τ (τ is the total optical thickness), VAN06-ts1 (ω1 means the half-width of the cosine term in the morning), and GOT01-ts models had better performance, followed by GOT09-dT-τ, GOT01-dT, and VAN06-ts2 (ω2 means the half-width of the cosine term in the afternoon) models. All models had higher accuracy in summer than in other seasons, while poorer performance was produced in winter. The INA08-ts model showed best performance among all seasons. Models with fixing ts could produce higher accuracy results than that with fixing dT. The comparison of INA08-ts model driven by in situ and Moderate Resolution Imaging Spectroradiometer (MODIS) data indicated that the simulation accuracy mainly depended on the accuracy of MODIS LST. The daily maximum temperature generated by the nine models had high accuracy when compared with in situ data. The sensitivity analysis indicated that the INA08-dT and GOT09-dT-ts models were more sensitive to parameter dT, while all models were insensitive to parameter ts, and all models had weak relationship with parameters ω and τ. This study provides a reference for exploring suitable DTC model in the TP.

Graphical Abstract

1. Introduction

Land surface temperature (LST) is a key and basic parameter for land surface energy balance and water balance at regional and global scales [1,2]. The diurnal LST variation is crucial for meteorological, hydrological and climatological research and applications [3,4,5,6]. Moreover, it is also a very sensitive parameter to describe the characteristics of surface energy balance, surface thermal inertia, and surface water-heat budget [4]. The larger error of diurnal temperature cycle (DTC) probably leads to high uncertainty in each component of the energy balance.
Tibetan Plateau (TP), with the average elevation of more than 4000 m above sea level (MASL) and an area of about 2.5 × 10⁶ km2 [7,8], is regarded as the world’s Third Pole and one of most sensitive areas for climate change [9,10]. TP has an important impact on the Asian Monsoon and even global climate through its orographic and thermal effects [11,12]. The complex interactions between land surface and atmosphere of TP play an important role in modulating these effects [13]. Serious challenges still existed in simulating land-surface processes of the TP (i.e., the surface energy balance) [14,15]. Since LST is a critical parameter for calculating land surface energy balance and water-heat budget [16], it is therefore very important to evaluate the different DTC models in TP.
The DTC is affected by many factors, and these factors can mainly be divided into two categories: one is surface energy balance, which depends on solar insolation, land surface properties, and atmospheric variables. The other is surface thermal inertia, which depends on soil type, soil moisture content, and vegetation cover [4,17]. The DTC is also very important to interpolate the missing data of LST, improve the cloud screening algorithms, and analyze urban thermal environment [18,19,20], which can be simulated by DTC models.
Many DTC models have been developed with various functions [18,19,21,22]. Generally, DTC models can be divided into four categories: (1) the physical method, such as land surface models (LSMs); (2) the quasi-physical method, based on surface energy flux or thermal inertia; (3) the semi-physical method, based on the thermal diffusion equation during daytime and Newton’s law of cooling theory during nighttime; and (4) the statistical method, mainly based on the relationship between LST and local geographic information [23]. Among these, the semi-physical method was widely used [2,17,18,24,25,26] due to its flexibility.
For example, Parton and Logan [27] developed a semi-physical model for predicting diurnal variation in soil and air temperatures, which utilized a truncated sine function and an exponential function to simulate the diurnal temperature variations during daytime and nighttime, respectively. Göttsche and Olesen [22] improved the DTC model originally developed by Göttsche and Olesen [18] through smooth the increase of LST around sunrise and change the width of DTC by adding total optical thickness after validating at oak forest and desert sites.
On the other hand, some studies calibrated DTC model through satellite data or combining both in situ and satellite data. Ignatov and Gutman [4] derived a statistical model to reconstruct the monthly mean DTC by using data from the International Satellite Cloud Climatology Project (ISCCP). Schädlich et al. [21] proposed a simple semi-physical model to temporally interpolate brightness temperature by using Meteorological Satellite (METEOSAT) data. Göttsche and Olesen [18] developed a semi-physical model, which combined cosine and exponential functions with brightness temperature derived from geostationary METEOSAT satellites data. Based on Geostationary Operational Environmental Satellite (GOES-8) observations, Sun and Pinker [28] proposed a new fitting algorithm by using sine function during nighttime and cosine function during daytime, which was applied to estimate DTC with LSTs extracted from Advanced Very High-Resolution Radiometer (AVHRR). Van den Bergh et al. [29] presented a three-step semi-physical model by using Meteosat Second Generation (MSG) data to interpolate missing values. Jiang et al. [24] modified the model originally developed by Göttsche and Olesen [18] to interpolate temperature temporally for thermal infrared channels of METEOSAT data, and they found it performed well on vegetated and bare areas. Inamdar et al. [19] pointed out that a hyperbolic function was more suitable for modeling DTC during nighttime and modeled DTC with MODIS and GOES data. Duan et al. [25] compared six DTC models with in situ LST and that derived from Spinning Enhanced Visible and Infrared Imager (SEVIRI) data, and reported that the model proposed by Göttsche and Olesen [22] showed best performance. Huang et al. [23] proposed a generic framework for monitoring temperature variation, and the mean absolute error between observed LST and the brightness temperatures of Moderate Resolution Imaging Spectroradiometer (MODIS) and SEVIRI data reduced from 1.71 to 0.33 °C. Hong et al. [26] comprehensively evaluated four-parameter DTC models with in situ and satellite (including SEVIRI and FengYun-2F) data.
The above studies suggested that the quasi- and semi-physical methods can successfully model DTC through discrete values, especially when models combined with remote sensing data. The semi-physical method was applied with free parameters ranging from three to six, while the quasi-physical method with free parameters ranging from two to twelve when modelling DTC [16]. Many semi-physical DTC models need more than six input data, which makes it difficult to obtain high accuracy DTC variation at regional or global scale.
Some geostationary satellites can provide the DTC with temporal resolution of 15 or 30 minutes (i.e., SEVIRI and METEOSAT). Geostationary satellites scan large areas, i.e., their specific Earth orbits. However, only some regions can be scanned, which could not describe the diurnal temperature characteristics in large regions or at global scale by these satellites. MODIS provides the global reasonable LST product with transiting four transit times per day, which have been widely effective and applied in many regions, and brings the possibility of DTC estimation at global scale. Thus, it is one of key issues to reduce the free parameters of DTC models to less than or equal to four parameters. For example, Duan et al. [17] modified the model of Inamdar et al. [19] to estimate the DTC variation by reducing free parameters to four by using MODIS data. Hong et al. [26] reduced the number of free parameters to four and compared eight four-parameter DTC models under various bio-climates with multi-source (SEVIRI and FY-2F) data.
DTC models showed varied performances with in situ data and different satellite images over different land covers [25,26]. For example, Duan et al. [25] evaluated six DTC models over different land cover types using in situ data and satellite data, and found JNG06 and GOT09 models may performed better. Hong et al. [26] compared four-parameter DTC models over four land cover types with in situ data and satellite data, and they found the GOT-dT-τ model was more suitable for most land covers. Alpine meadow and steppe account for about 50% of the total area of the TP [30]. However, few studies focus on the performance of DTC models over alpine meadows in the TP due to limited in situ data. Most in situ stations are located in the eastern and southern TP, and there are few stations in the western TP due to the extreme fragile environment [31].
On the other hand, there are many poor-quality remote-sensing productions of LST in the Tibetan Plateau (TP) due to the influence of clouds [32], while reanalysis data also have large biases and uncertainties [33,34]. It is difficult to quantify the physical processes of land surface energy and water balance at regional scale in the TP. There are many studies that have focused on LST estimation and validation in the TP [35,36,37]. Seldom studies which investigated the diurnal variation of LST in the TP regions have reported. Therefore, it is very important to evaluate the performances of different DTC models in the TP, especially when it combined with remote sensing data (i.e., MODIS LST).
In this study, nine 4-para DTC models were compared for monitoring the DTC variations over alpine meadows in the TP with half-hour observation data. The aim is to compare the performances of different models with in situ data and MODIS LST data, and identify the best semi-physical method over alpine meadows in the TP.

2. Data and Methods

2.1. Data

To explore the suitable DTC model for the TP, alpine meadow as one of the main underlying surfaces was selected as representative. In addition, we incorporated both in situ data and LSTs extracted from satellite products (i.e., MODIS) for study.

2.1.1. In Situ Data

The half-hourly LST observation data at five sites with alpine meadow were selected to evaluate the performance of the nine 4-para models (Figure 1). The detail information of the stations and observation data are shown in Table 1. Due to the availability of observation stations, only five sites were chosen for representing alpine meadows. The half-hourly LST is calculated by Yang et al. [38], based on the upward and downward longwave radiation:
L S T = ( L ( 1 ε ) L ε σ ) 1 / 4
where L and L are the observed upward and downward long-wave radiation fluxes (W m−2), respectively; σ is Stefan-Boltzmann constant (5.67 × 10⁻⁸ W m−2 K−4); ε is the land surface emissivity, with 0.99 at all alpine meadow sites [25] and the reasonability of the value will be discussed in Section 4.1.
Considered the observation date of different stations varied, the representative days are selected to evaluate the performance of nine DTC models. Furthermore, several days for each season at one representative site were randomly selected for evaluating the universality of each DTC model. Four necessary conditions were considered for selecting the represent days and running the model: (1) all models are generated under clear-sky condition without obvious change in wind speed, generally standard deviation of wind speed at the height of 2 m less than 2 m s−1; (2) sunrise only appears once per day; (3) temperature decays freely after “thermal sunset” at time ts; (4) The MODIS satellite temperatures acquired four times per day. Therefore, the half-hour LSTs (48 values per day) were used to validate the model performances; while the day with four observations corresponding to the MODIS transit time (10:30, 13:30, 22:30, and 01:30 at local time) were chosen for fitting DTC model. Under the premise of meeting the above conditions, four days in each season were randomly selected at each site to compare the performance of different models.

2.1.2. MODIS Data

The MODIS LST products (MOD11A1 and MYD11A1) were retrieved through the generalized split-window algorithm [44] with spatial resolution of 1 km and transit 2 times per day, respectively. The high quality (QC = 0) LST and local solar time at the observation sites were extracted from the MODIS LST products. Four days at the Suli (21 April and 2 October 2010) and Tanggula sites (26 April and 4 May 2010) were used to evaluate the performance of the best model with MODIS data. The MODIS Aqua and Terra LST products (collection 5) were downloaded from NASA website (https://search.earthdata.nasa.gov).

2.2. Methods

Four popular semi-physical (SEM) DTC methods, including GOT01 model developed by Göttsche and Olesen [18], VAN06 model proposed by Van den Bergh et al. [29], INA08 model founded by Inamdar et al. [19] and GOT09 model developed by Göttsche and Olesen [22], were chosen for experiment on reducing the number of free parameters to four.

2.2.1. GOT01 Model

Göttsche and Olesen [18] assumed that DTC of daytime could be simulated by a cosine function based on the thermal diffusion equation, and an exponential function to describe the decay of nighttime LST with the assumption of obeying Newton’s law of cooling. The model can be expressed as follows:
T d a y ( t ) = T 0 + T a c o s ( π w ( t t m ) ) , t < t s T n i g h t ( t ) = T 0 + d T + [ T a c o s ( π w ( t s t m ) ) d T ] e ( t t s ) k , t t s
where Tday(t) and Tnight(t) are the LST of daytime and nighttime, respectively; T0 is the residual temperature around sunrise; Ta is the temperature amplitude; ω is the duration of daytime (DD), which represents the width over the half-period of the cosine term and can be expressed as a function of latitude (φ) and the solar declination (δ); tm is the time when the temperature reaches peak; ts is the time when free attenuation begins; dT is the temperature residual between T0 and T (t→∞); k is the attenuation constant. There are five free parameters in this model (T0, Ta, tm, ts, and dT).
In order to apply the model with MODIS LST, it is essential to reduce the number of free parameters to four. Base on previous studies [17,26], two schemes were made: (a) fix dT as zero (dT = 0), named as GOT01-dT; (b) set ts to be one hour before sunset (ts = tss − 1, where tss is the sunset time, which can be calculated from website https://www.esrl.noaa.gov/gmd/grad/solcalc), named as GOT01-ts (Table 2).

2.2.2. VAN06 Model

Van den Bergh et al. [29] proposed a three-stage model to describe DTC due to different width of the half-period cosine term on the rising slope (in the morning) and falling slope (in the afternoon). This model is expressed as follows:
T d a y 1 ( t ) = T 0 + T a c o s ( π w 1 ( t t m ) ) , t < t m T d a y 2 ( t ) = T 0 + T a c o s ( π w 2 ( t t m ) ) , t m t < t s T n i g h t ( t ) = T 0 + T a c o s ( π w 2 ( t s t m ) ) e ( t t s ) k , t t s
where Tday1(t) and Tday2(t) are the daytime temperatures before and after tm; ω1 and ω2 are the half-width of the cosine term in the morning and afternoon, respectively. There are six free parameters in the VAN06 model (T0, Ta, tm, ts, ω1, and ω2). Two of the six free parameters need to be fixed in this model, while ω1 and ω2 are different. Therefore, two schemes generate: (a) ts = tss − 1 and ω1 = DD, named as Van06-ts1; (b) ts = tss − 1 and ω2 = DD, named as Van06-ts2 (Table 2).

2.2.3. INA08 Model

Inamdar et al. [19] proposed a hyperbolic function to describe the decay of LST at night by replacing the exponential function developed by Göttsche and Olesen [8], which can be given as follows:
T d a y ( t ) = T 0 + T a c o s ( π w ( t t m ) ) , t < t s T n i g h t ( t ) = T 0 + d T + [ T a c o s ( π w ( t s t m ) ) d T ] k k + t t s , t t s
INA08 model contains five free parameters (T0, Ta, tm, ts, and dT), the same parameters as GOT01 model. Thus, the same schemes can be made: (a) dT = 0, named as INA08-dT; (b) ts = tss − 1, named as INA08-ts (Table 2).

2.2.4. GOT09 Model

Based on the energy balance, Göttsche and Olesen [22] considered that LST increased relative slowly around sunrise due to the higher total atmospheric optical thickness (TOT) at large sun zenith angles, which can be described by the following equations:
T d a y ( t ) = T 0 + T a cos ( θ z ) cos ( θ z , min ) e ( m min m ( θ z ) ) τ , t < t s T n i g h t ( t ) = T 0 + d T + [ T a cos ( θ z s ) cos ( θ z , min ) e ( m min m ( θ z s ) ) τ d T ] e 12 π k ( θ θ s ) , t t s
where θ is the thermal hour angle; θz is the solar zenith angle; θz,min is the zenith angle when t = tm; θzs is the thermal angle when θ = θs; mmin, m(θz) and m(θzs) are the relative air mass at θz,min, θz and θzs, respectively; τ is TOT. GOT09 model contains six free parameters (T0, Ta, tm, ts, dT, and τ). The total atmospheric optical thickness was generally regarded as a constant value for modeling DTC [3]. Therefore, τ can be regarded as a reduced parameter, and we selected τ as 0.01 based on Hong et al. [26]. There are three parameters that can be fixed and three schemes can be obtained by combining two of the three parameters: (a) dT = 0 and τ = 0.01, named as GOT09-dT; (b) dT = 0 and ts = tss − 1, named as GOT09-dT-ts; (c) ts = tss − 1 and τ = 0.01, named as GOT09-ts-τ (Table 2).

2.2.5. Solution of These Models

All the parameters of the nine 4-para DTC models were listed in Table 2. The Levenberg-Marquardt algorithm [45] was adopted to evaluate the performance of the nine 4-para DTC models. The initial values of the free parameters for each model were listed in Table 3.

2.3. Evaluation Metrics

The coefficient of determination relationship (R2), root mean square error (RMSE), mean bias (MB), and Nash—Sutcliffe efficiency coefficient (NSE) were used for statistical evaluation on different models. The equations are listed in Table 4.

3. Results

3.1. Performance of the Nine DTC Models at Each Observation Site

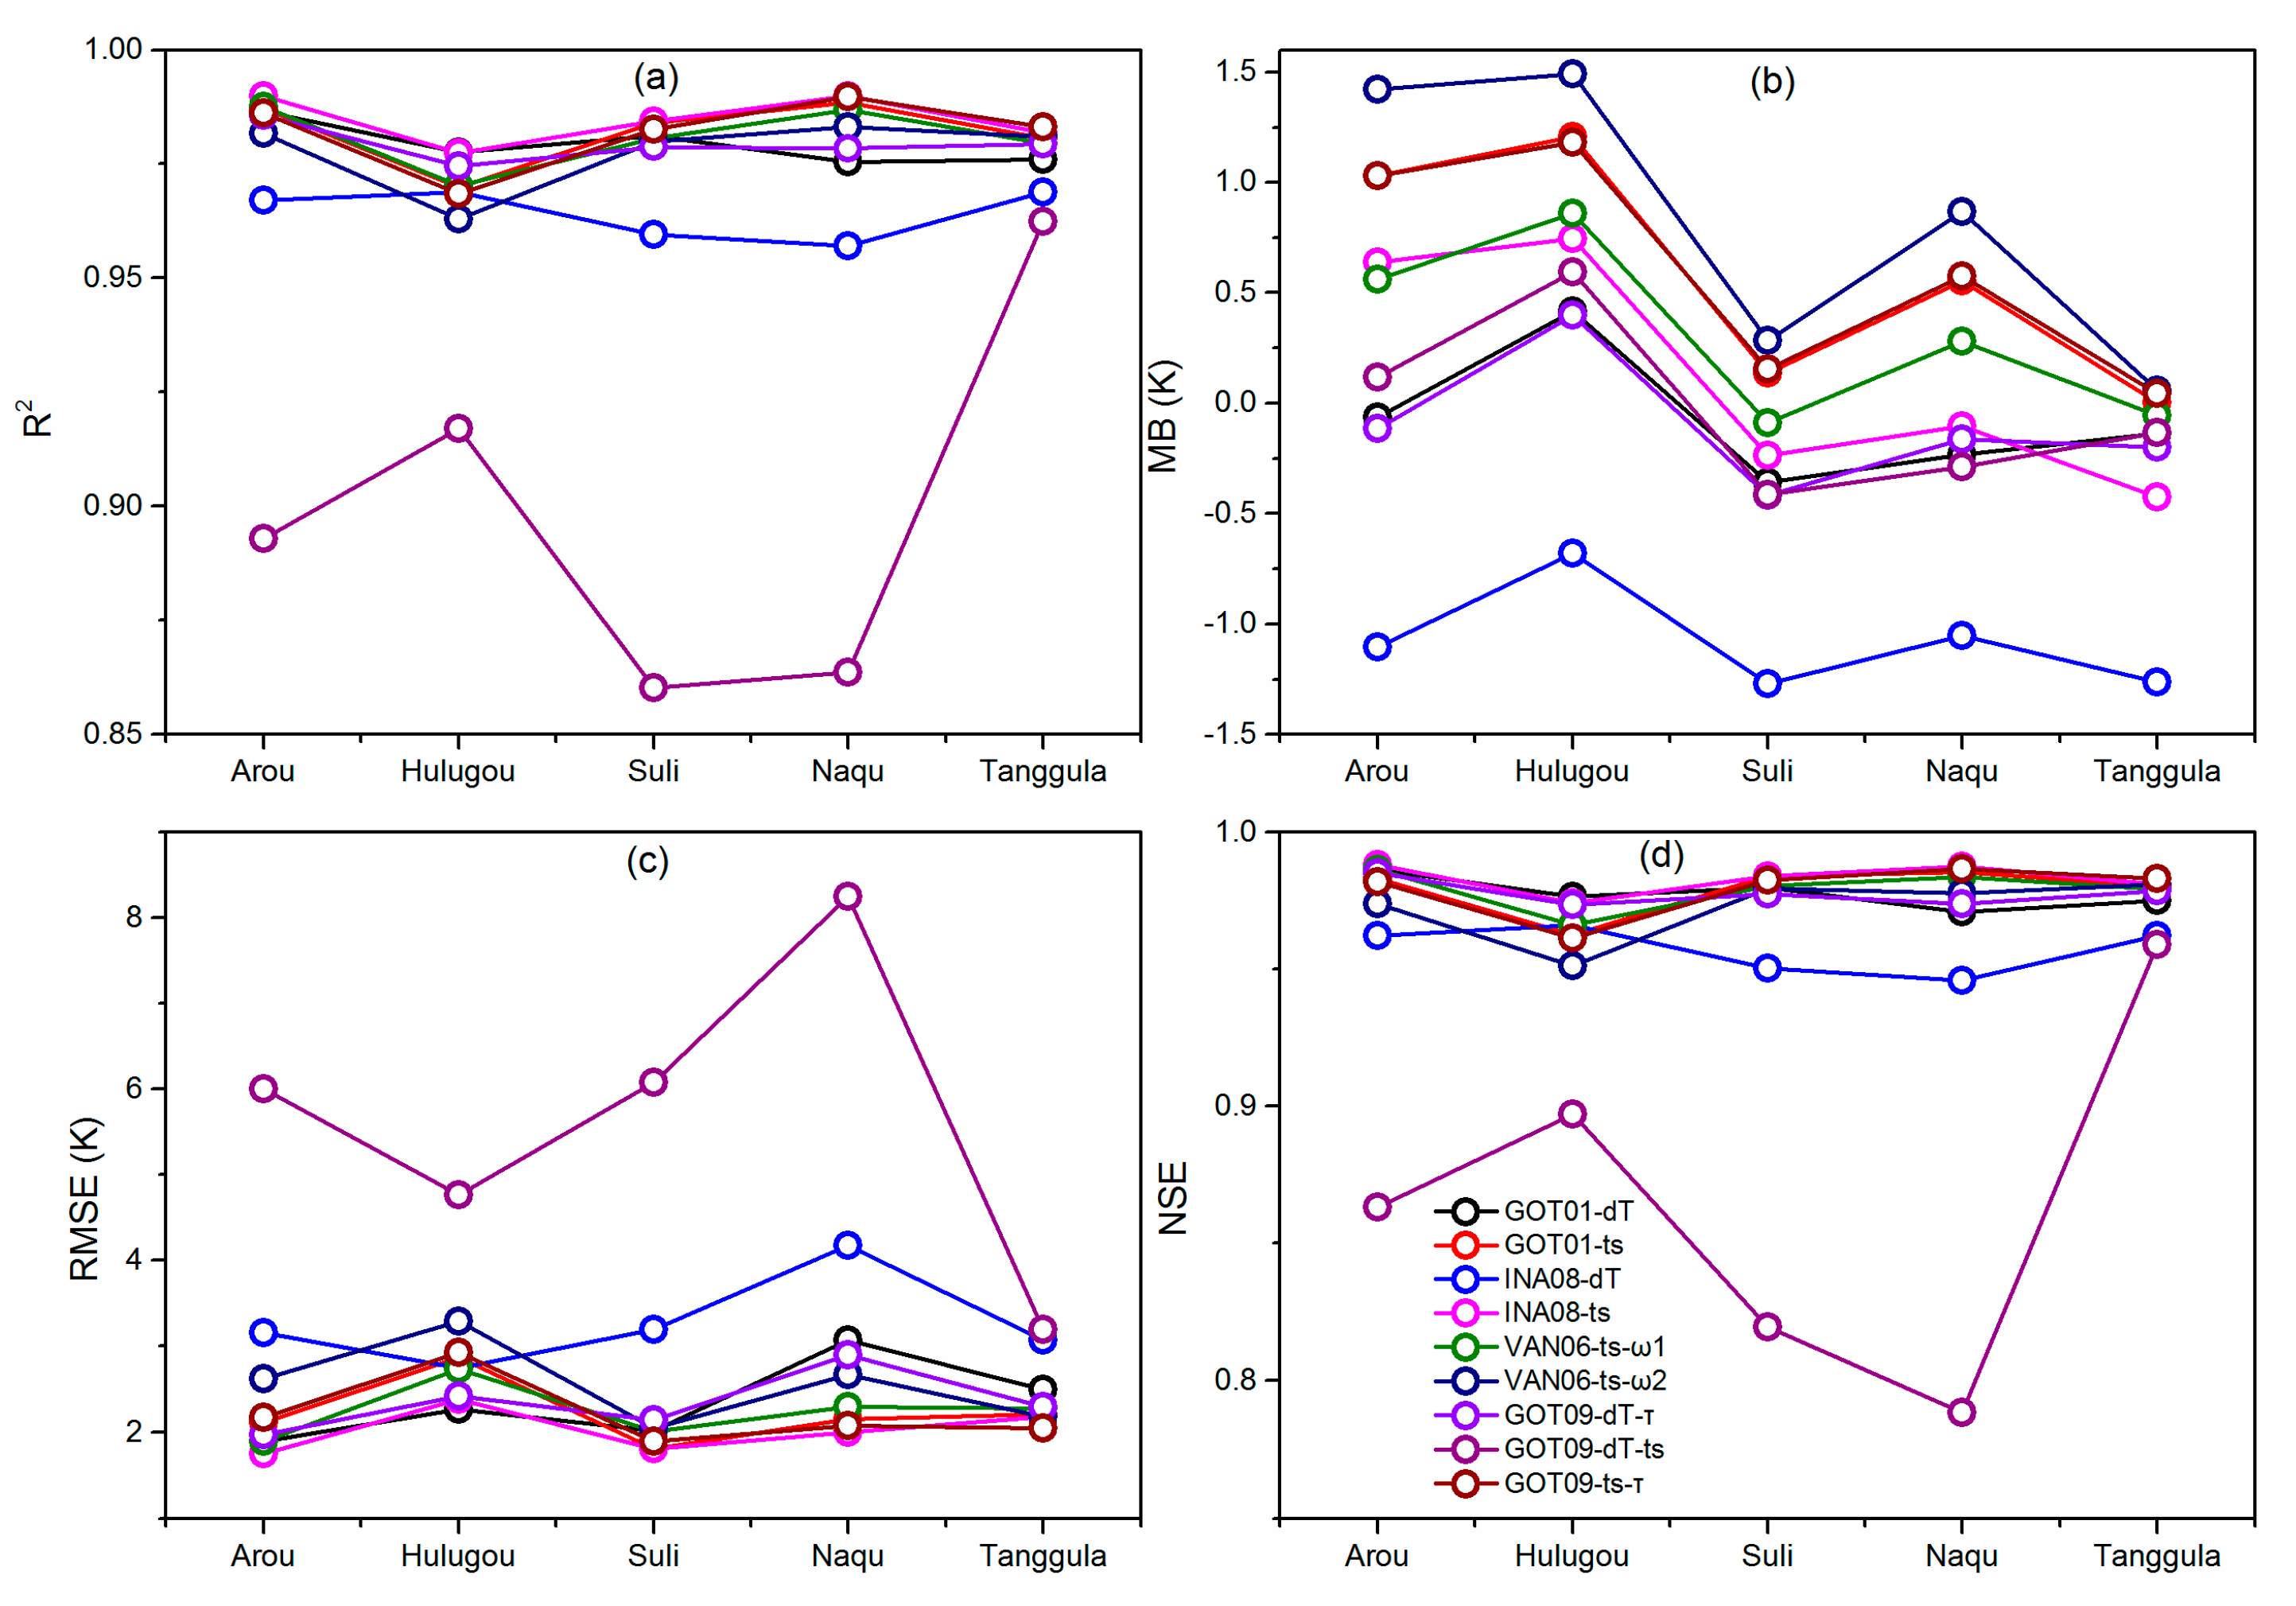
At the Arou site which has lower elevation and relative humid climate, the statistical indicators of DTC (Figure 2) suggested that all models performed well with higher R2 (>0.9) and NSE (>0.9) except GOT09-dT-ts model, which performed worst with lowest R2 (0.89), highest RMSE (6.0 K) and lowest NSE (0.86). The INA08-ts model produced the best result with the highest R2 (0.99) and lowest RMSE (1.76 K). The VAN06-ts1, GOT01-dT and GOT09-ts-τ models showed better performance with almost similar lower RMSE of 1.9, 1.9, and 1.97 K, respectively. The GOT01-ts and GOT09-ts-τ models showed reduced performance with RMSE of 2.12 and 2.18 K, respectively. Though the INA08-dT model had higher R2 (0.95) and NSE (0.94), it still performed worse with larger RMSE (3.15 K).
At the Hulugou site which has relative lower elevation and humid climate, the GOT01-dT model had good performance with highest R2 (0.98), lowest RMSE (2.27 K) and highest NSE (0.98). The INA08-ts and GOT09-dT-τ models showed better performance with similar lower RMSE (2.39 and 2.42 K) and higher NSE (0.97 and 0.97) followed by the INA08-dT, GOT09-ts-τ, and GOT01-ts models. The INA08-dT and GOT09-ts-τ models showed same performance with higher R2 (0.97), lower RMSE (2.74 K), and higher NSE (0.97). The VAN06-ts2 model showed reduced performance with higher RMSE (3.28 K) and lower NSE (0.95). The GOT09-dT-ts model performed worst with highest RMSE (4.77 K) and lowest NSE (0.9).
At the Suli site which has relative middle elevation and arid climate, all models performed well with higher R2 (>0.9) and NSE (>0.9). The INA08-ts and GOT01-ts models produced the highest R2 (0.98), lowest RMSE (1.81 K), and highest NSE (0.98), respectively. The GOT09-ts-τ performed better with lower RMSE (1.9 K) followed by the VAN06-ts1, GOT01-dT and VAN06-ts2 models. The INA08-dT model showed reduced performance with higher RMSE (3.19 K), while the GOT09-dT-ts model had worst performance with highest RMSE (6.08 K) among all models.
At the Naqu site which has higher elevation and arid climate, the INA08-ts model performed best with highest R2 (0.99), lowest RMSE (2.01 K) and highest NSE (0.99) among all models. The GOT09-ts-τ and GOT01-ts models performed better with higher R2 (0.99 and 0.99), lower RMSE (2.08 and 2.16 K), and higher NSE (0.99 and 0.99), respectively, and followed by the VAN06-ts1 and VAN06-ts2 models. The GOT09-dT-τ and GOT01-dT models showed reduced performance with higher RMSE (2.9 and 3.07 K), respectively. The INA08-dT model had larger error with RMSE of 4.17 K, while the GOT09-dT-ts model performed worst with lowest R2 of 0.86, highest RMSE of 8.25 K and lowest NSE of 0.79.
At the Tanggula site which has relative higher elevation and arid climate, all models performed well with higher R2 (>0.9) and higher NSE (>0.9). The GOT09-ts-τ, INA08-ts and VAN06-ts2 model performed best with same highest R2 (0.98), similar lowest RMSE of 2.05 and 2.18 K and same highest NSE (0.98). The GOT01-ts, VAN06-ts1, and GOT09-dT-τ models performed better, which had lower RMSE ranging from 2.21 to 2.3 K and followed by the GOT01-dT model. The INA08-dT and GOT09-dT-ts had largest errors with RMSE of 3.07 and 3.2 K, respectively. Moreover, all models had higher NSE, which suggested that all models produce better results for evaluating DTC at the Tanggula site.
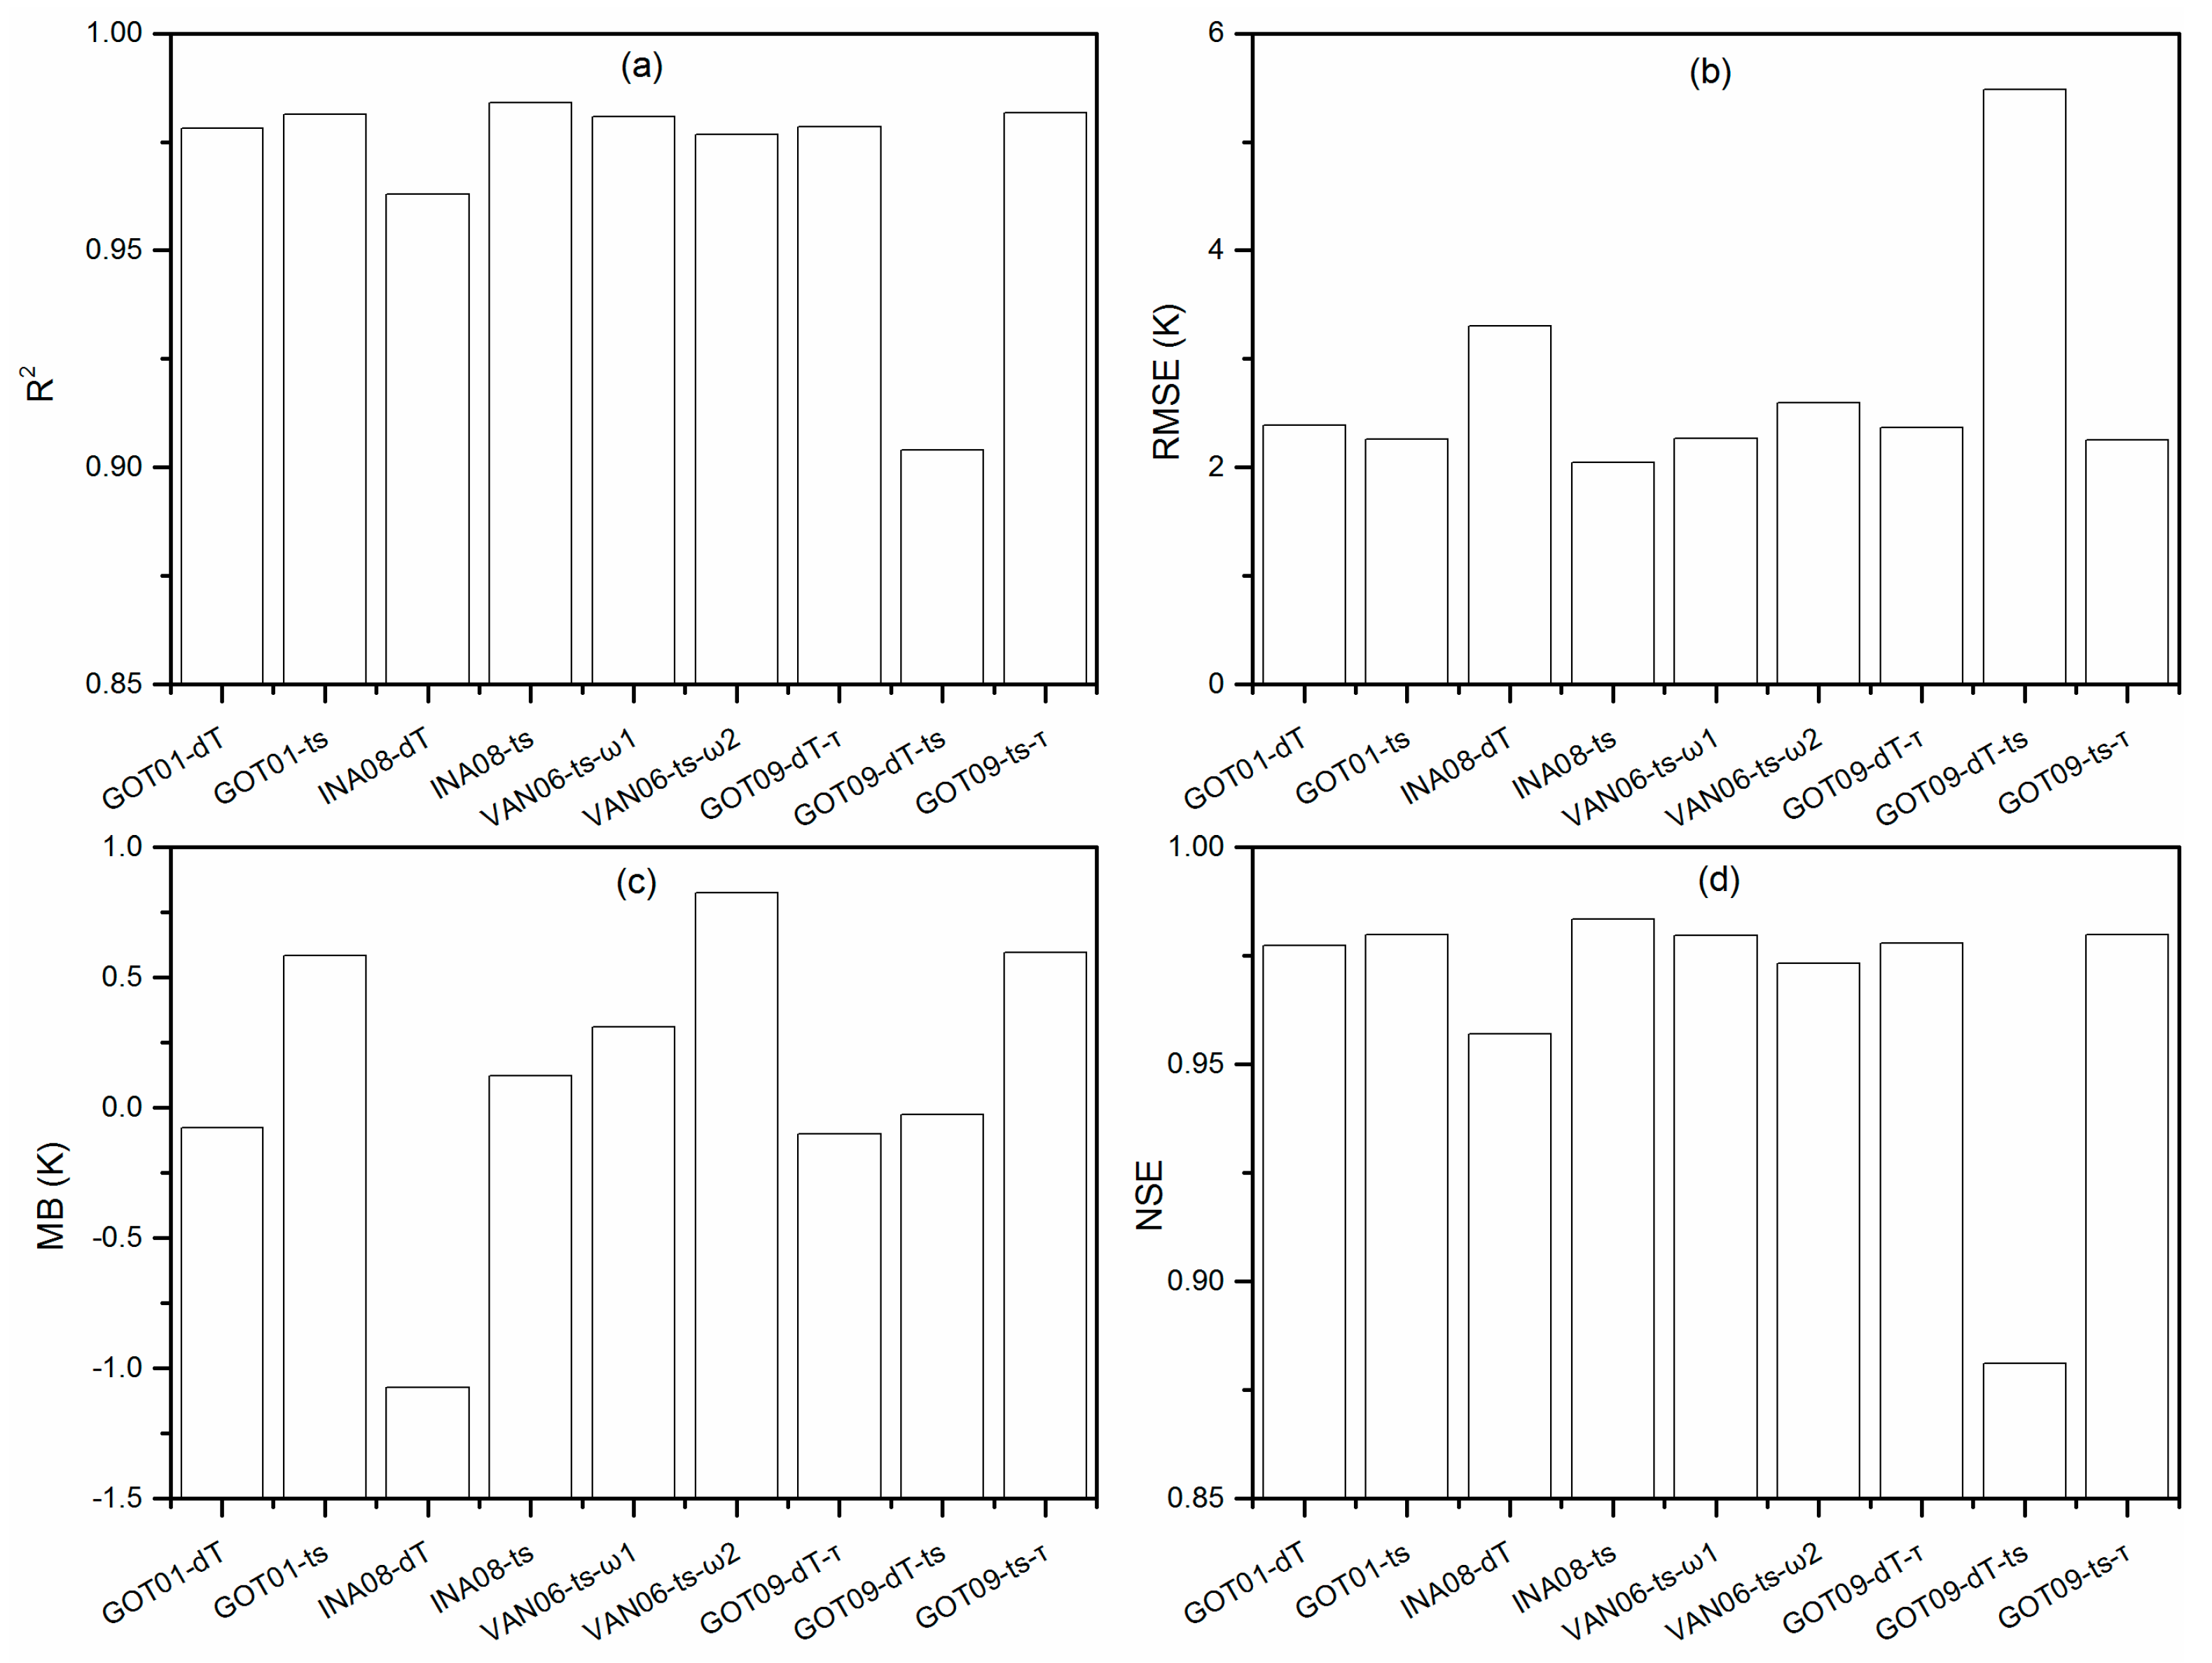
In a short summary, among the nine models, INA08-ts performed best than the other models with lowest average RMSE of 2.04 K and highest NSE of 0.99 at all alpine meadow sites (Figure 2 and Figure 3). The GOT09-ts-τ, VAN06-ts1 and GOT01-ts models had similar better performance with lower RMSE of 2.26 K, and higher average NSE of 0.98, followed by the GOT09-dT-τ, GOT01-dT, and VAN06-ts2 models, which showed better performance with RMSE ranging from 2.37 to 2.6 K, respectively. All models were highly correlated with measured values with R2 above 0.9 except GOT09-dT-ts model. The INA08-dT model showed poorer performance with higher average RMSE (3.3 K), while GOT09-dT-ts model produced poorest performance with highest average RMSE of 5.9 K and lowest NSE of 0.86 (Figure 3d).

3.2. Diurnal Temperature Variation over Different Seasons

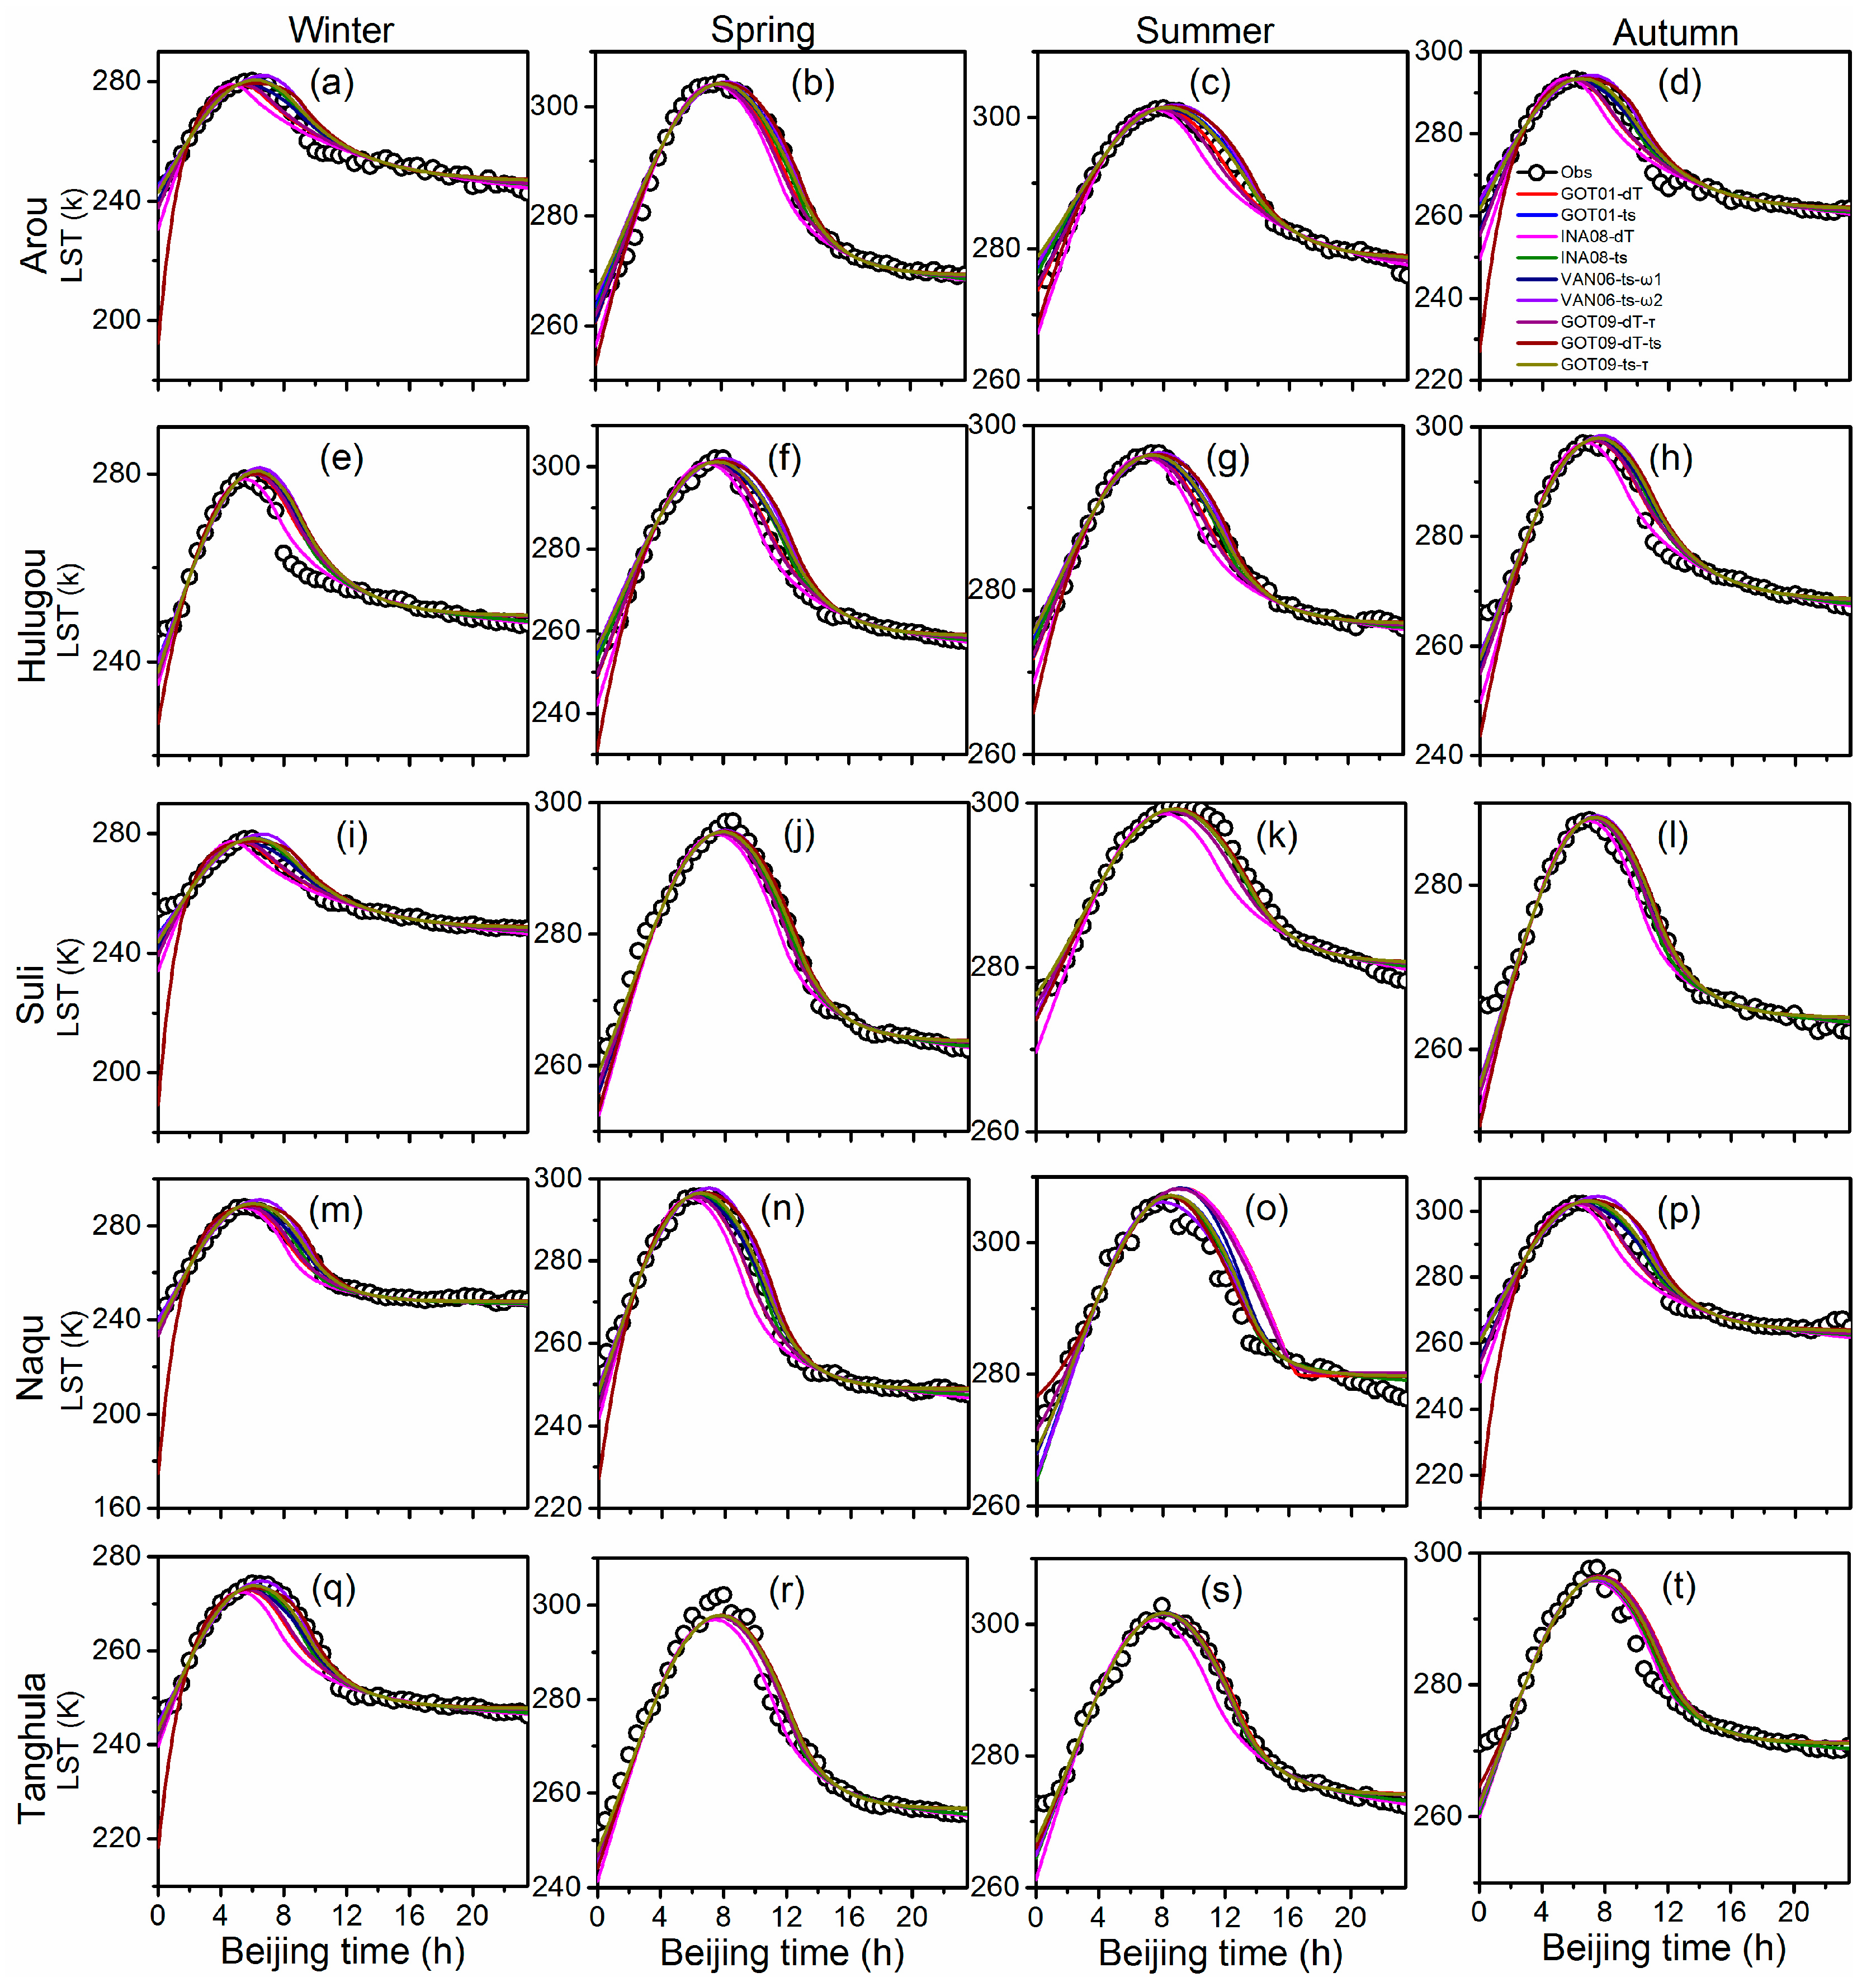
The comparisons between simulated by the nine 4-para DTC models and observed diurnal LST variations in four seasons at all sites (Figure 4) indicated that all models performed better at hours after sunrise, while LSTs were substantially underestimated around sunrise due to the ignorance of the slow increase in temperature around sunrise, which corresponding with the results reported by Hong et al. [26]. At the Suli site, the INA08-ts and GOT01-ts models produced better result in winter (Figure 4a), while all models except INA08-dT and GOT09-dT-τ models produced higher accuracy with lower RMSEs (<2 K) in spring (Figure 4b). At the Arou site, the INA08-ts, VAN06-ts1, and GOT01-dT models produced better results in winter (Figure 4e), spring (Figure 4f) and summer (Figure 4g), while the INA08-ts, GOT01-ts and GOT09-dT-τ models performed better in winter and summer. At the Hulugou site, the GOT09-dT-τ, GOT01-dT and INA08-ts models performed better in spring (Figure 4j) and summer (Figure 4k). The INA08-dT model produced lowest error in winter (Figure 4i). While the INA08-ts and GOT01-dT models performed better in autumn (Figure 4l). At the Naqu site, VAN06-ts1, INA08-ts and GOT01-ts models produced better results in winter. The INA08-ts, GOT01-ts and GOT09-ts-τ models performed better in spring and autumn, while the GOT09-dT-ts, INA08-ts and GOT09-ts-τmodels performed better in summer. At the Tanggula site, all models except the INA08-dT and GOT09-dT-ts models performed better in winter, while all models except the INA08-dT model could produce higher accuracy in summer. GOT09-dT-τ, GOT09-ts-τ and INA08-ts models performed better in spring, while GOT09-dT-ts and INA08-ts models produce higher accuracy results in autumn.
In general, all models showed similar patterns at each site in each season, most models performed worse in spring and autumn than summer. However, the performances of different models had large difference in some seasons. According to the performance of each model at all sites in four seasons, models with fixing ts seems produce higher accuracy results than that with fixing dT.
The RMSEs of the nine 4-para DTC models over four seasons (Figure 5) suggested that all models had good performance with lower RMSE in summer, which also had higher R2 (>0.9), NSE (>0.9) (not shown here), and while performances of all models were relatively lower in winter.
In winter, INA08-ts model had best performance with lower RMSE (2.4 K). VAN06-ts1, GOT01-dT, and GOT09-dT-τ models had relatively good performance with lower RMSE of 2.64, 2.66, and 2.81 K, and same higher NSE of 0.94. GOT01-ts and GOT09-ts-τ models showed reduced performance, while INA08-dT model produced larger error with higher RMSE of 3.56 K. GOT09-dT-ts model performed worst with highest RMSE (9.1 K) and lowest NSE (0.35) in winter. In spring, INA08-ts model performed best followed by GOT01-ts model, while GOT09-dT-ts model showed poor performance. In summer, all models performed well with higher NSE (>0.9). GOT09-ts-τ and INA08-ts models performed best with highest R2 (0.97), lowest RMSE (1.58 and 1.66 K), and highest NSE (0.97). Noting that GOT09-dT-ts model had good performance in summer while it performed poor in other seasons. In autumn, INA08-ts model produced highest accuracy, while GOT09-dT-ts performed worse with highest RMSE (5.93 K) and lowest NSE (0.72).
In a short summary, both the simulations in single day (Figure 3) and in different seasons (Figure 5) suggested that INA08-ts model can be used to combine with LST derived from remote sensing data.

3.3. Diurnal Temperature Variation over Days

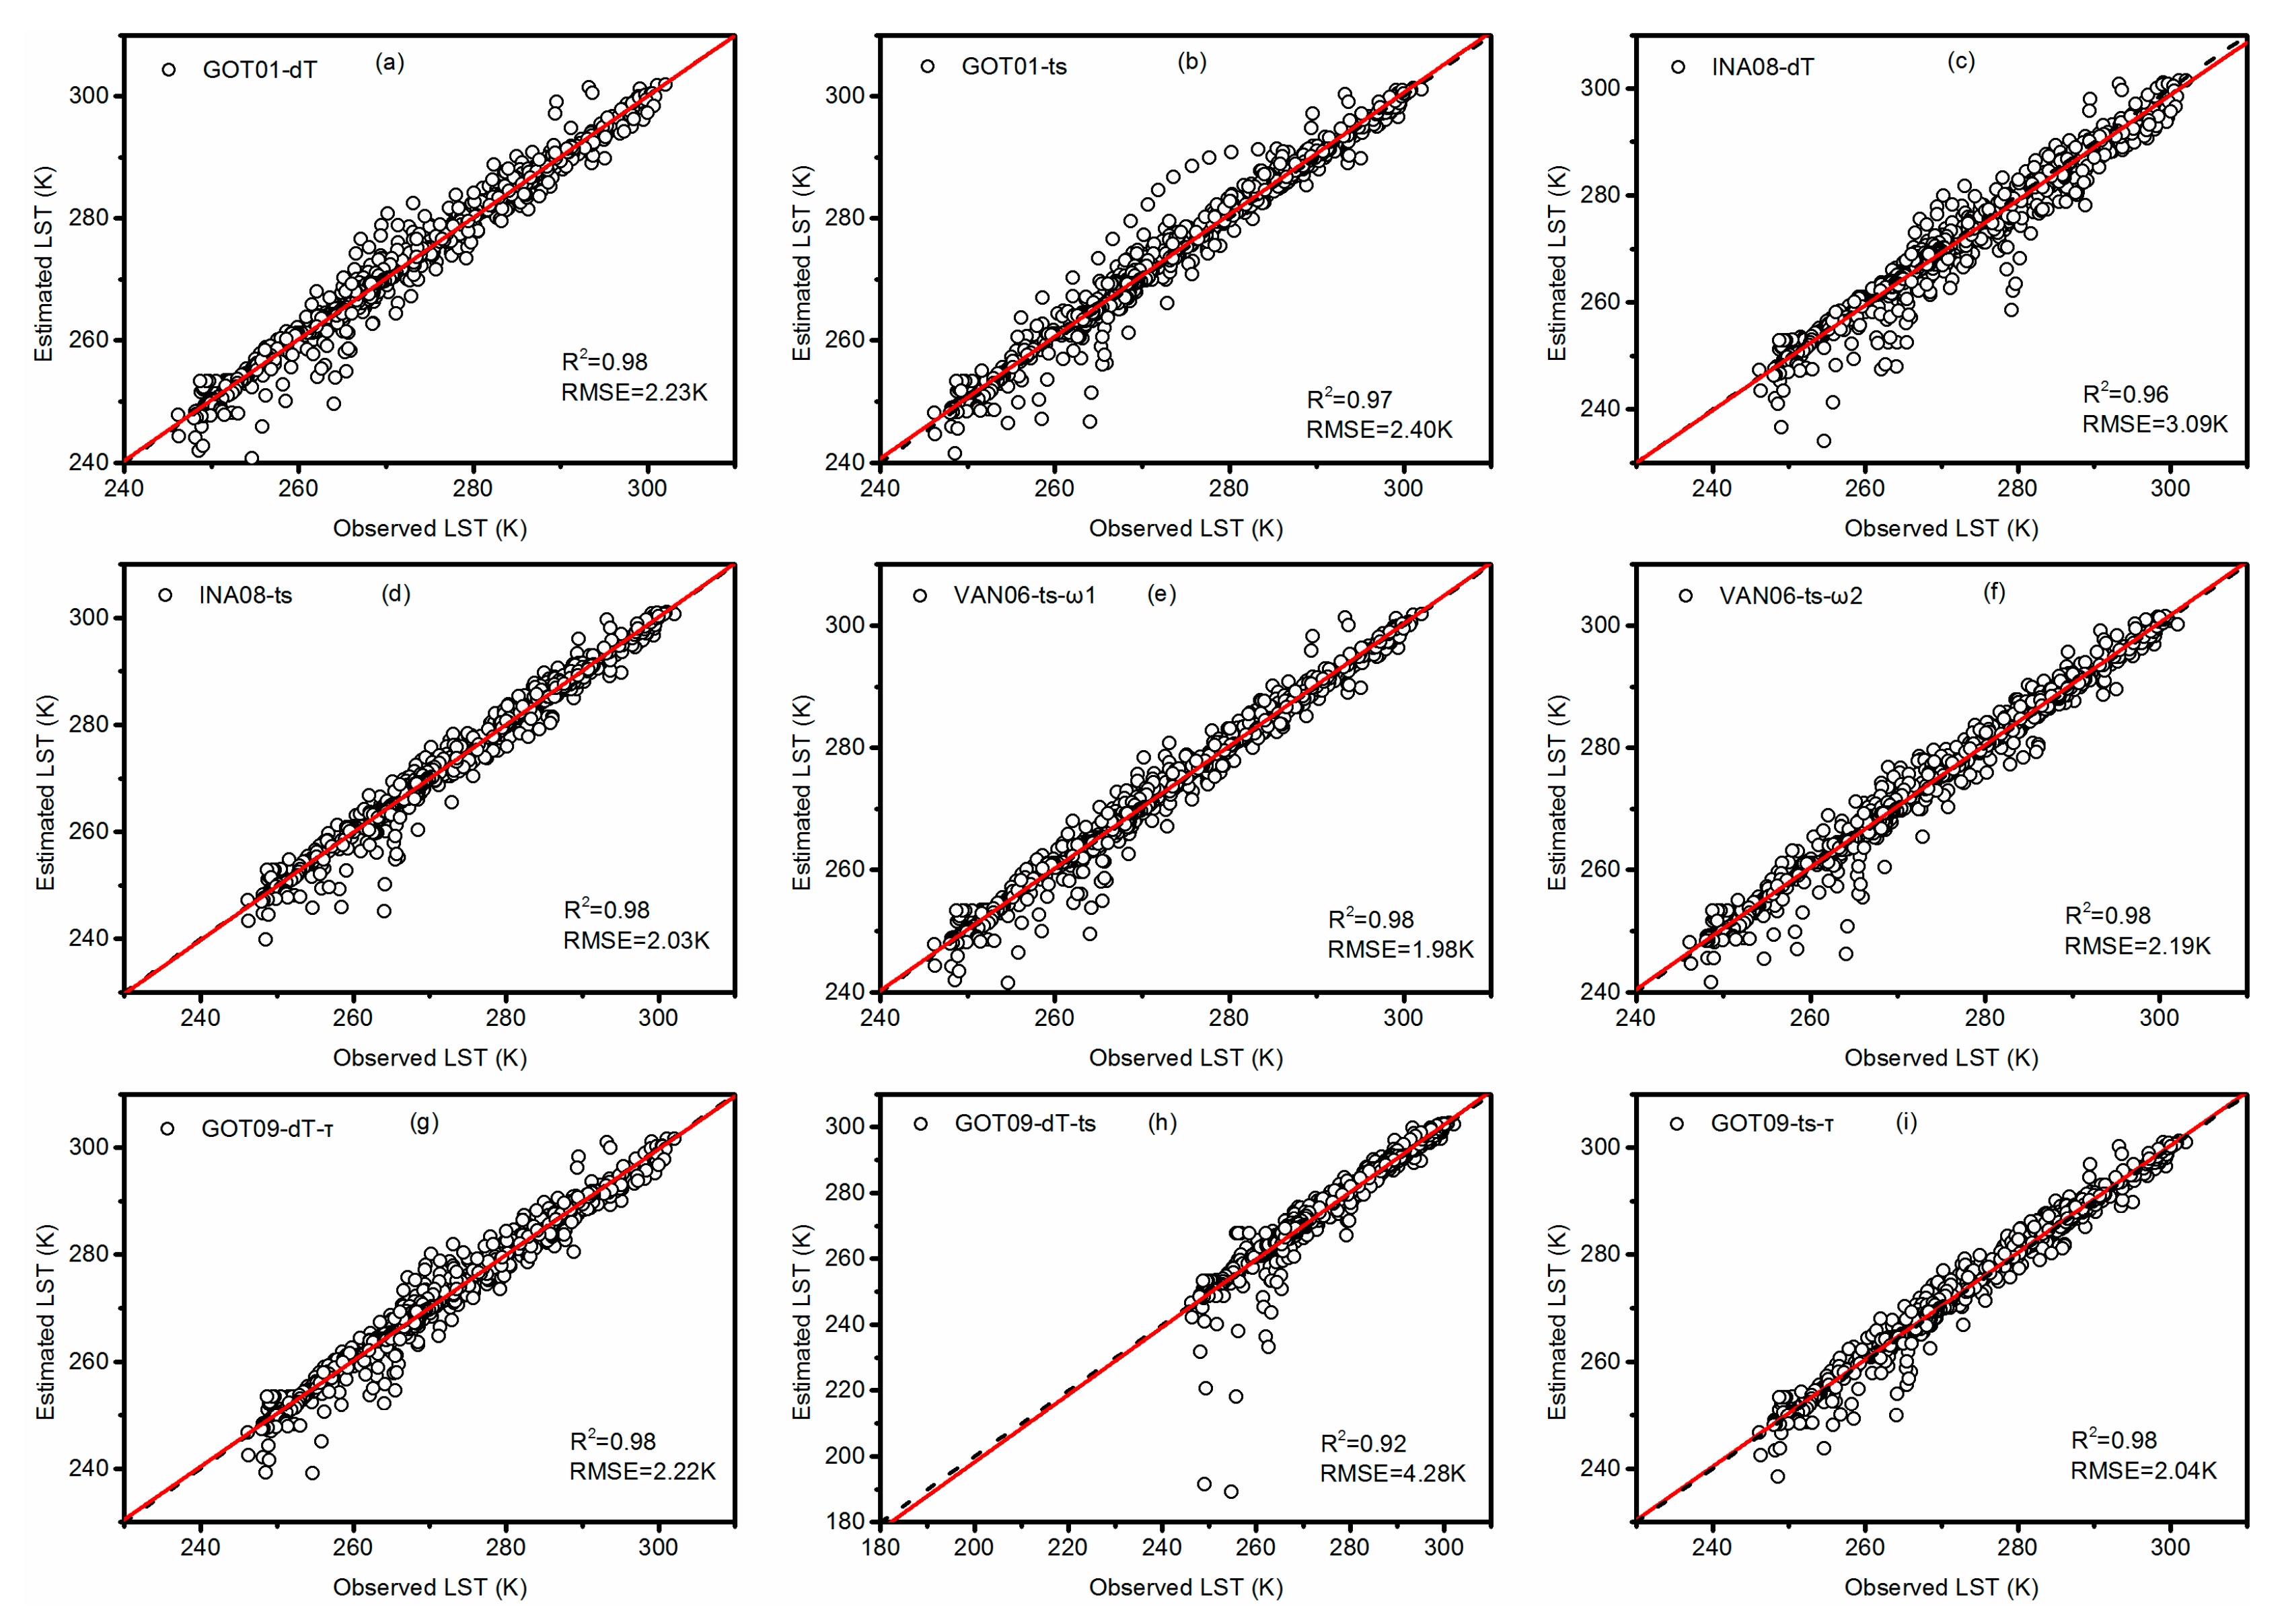
In order to evaluate the simulation effect of DTC models on any days, five days in 2010 at the Suli site were randomly chosen for representing each season, and 20 days were selected in this study (Figure 6). Compared with observed values, the VAN06-ts1 (Figure 6e), INA08-ts (Figure 6d) and GOT09-ts-τ (Figure 6i) models could evaluate DTC better with lower RMSEs (1.98, 2.03, and 2.04 K, respectively). The GOT09-dT-ts (Figure 6h) model performed worst with highest RMSE (4.28 K). These results indicated that models with fixing ts could produce higher accuracy, while models with fixing dT had large bias.

3.4. Performance of the INA08-ts Model with MODIS Data under Clear-Sky Day

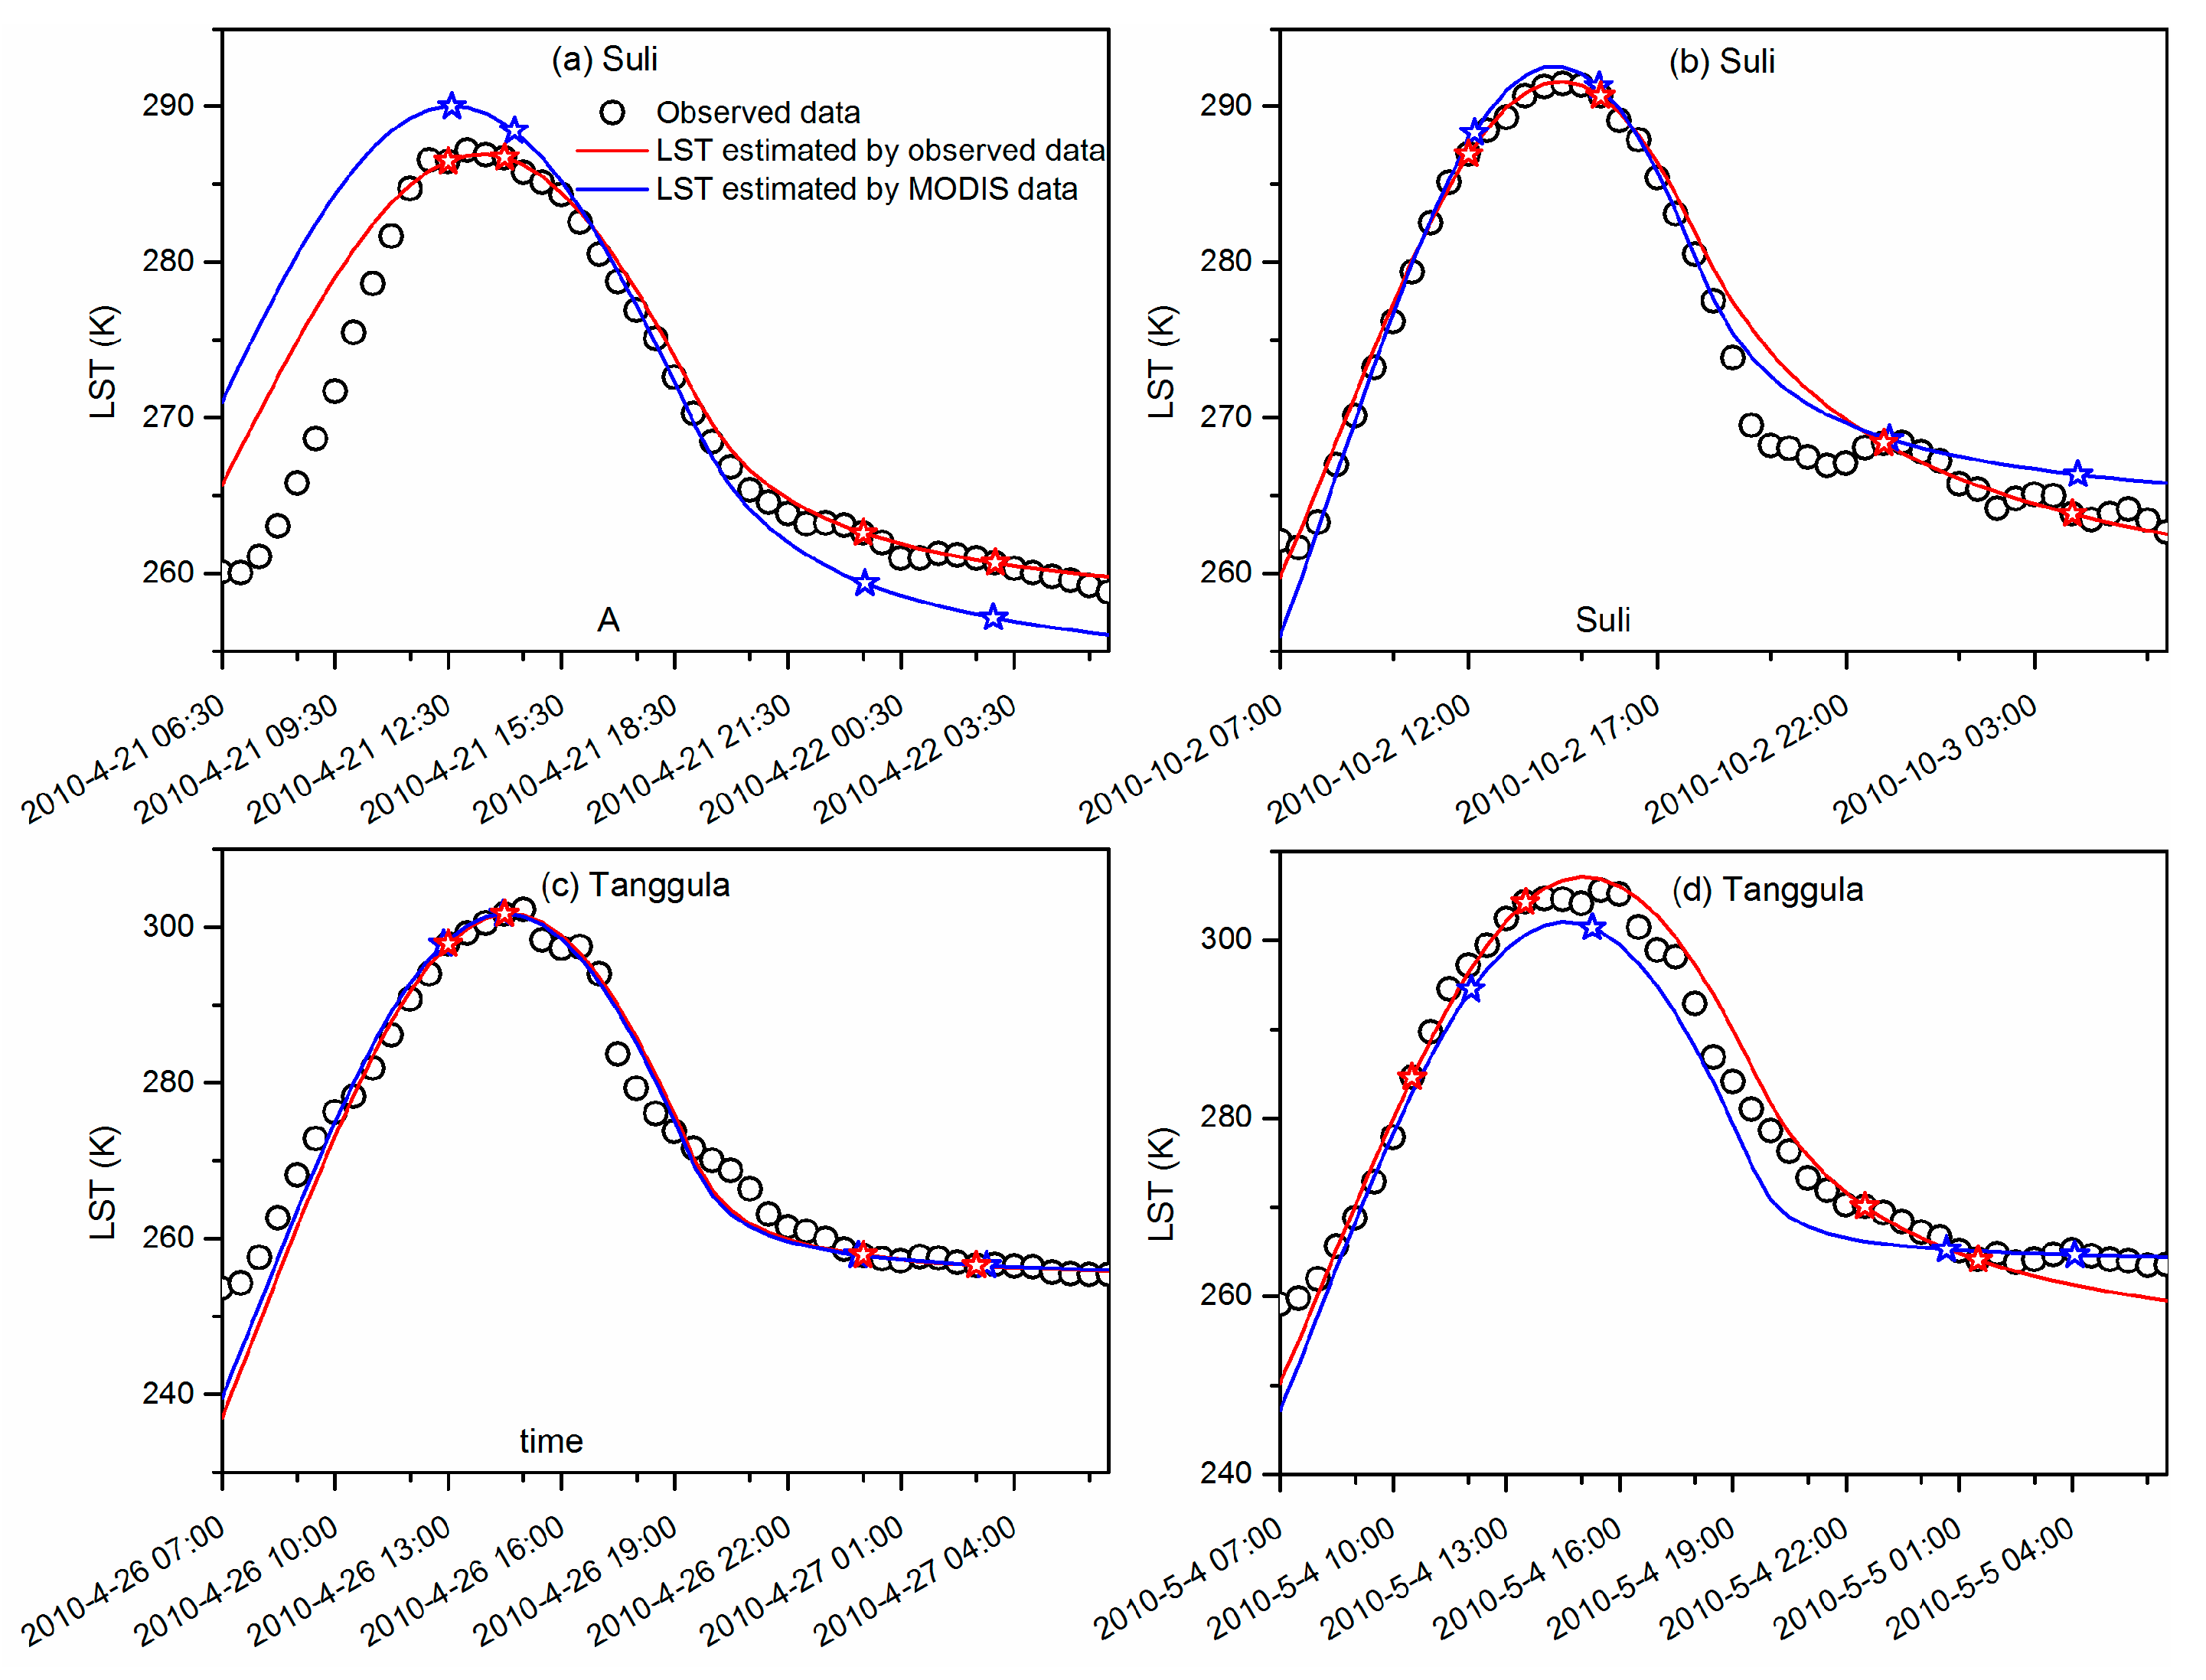
Considering the data availability, the MODIS LST data of four clear-sky days in 2010 at the Suli and Tanggula sites were selected to test the performance of INA08-ts model with remote sensing data (Figure 7). As expected, the INA08-ts model forced by the observed data performed better than that driven by the MODIS data at the Suli site on 21 April 2010 (Figure 7a) and the Tanggula site on 4 May 2010 (Figure 7d). This is most likely due to the large error of MODIS LST, which obviously overestimated at daytime and underestimated at nighttime at the Suli site on April 2010.
LST estimated by MODIS was underestimated during daytime at the Tanggula site on 4 May 2010. The INA08-ts model forced by the observed data and MODIS data showed similar performances at the Suli site on 2 October 2010 (Figure 7b) and the Tanggula site on 26 April 2010 (Figure 7c) due to the relatively high accuracy of MODIS LST. The different performances of the INA08-ts model forced by MODIS data (Figure 7) indicated that the accuracy of driving data was a primary factor for simulation accuracy [17] and the simulation accuracy of the INA08-ts model around sunrise will need further exploration. It indicated that day-to-day temporal simulation of LST is essential for improving the simulation accuracy around sunrise, which corresponding with that reported by Duan et al. [46].

4. Discussion

4.1. Sensitivity to the Surface Emissivity

There is no observation surface emissivity in the study area, which is a necessary parameter for calculating LST estimation. Moreover, there is no valid method for calculating surface emissivity. In order to study the sensitivity of LST to the surface emissivity, a semi-empirical method was applied based on heat transfer theory [10]. Once ε is overestimated or underestimated under near-neutral conditions, the estimated sensible heat flux (Hest) would produce large bias compared with observed sensible heat flux (Hobs). Thus, the difference between Hest and Hobs could be a judgment for LST. Therefore, RMSEs between Hest and Hobs were used to explore the sensitivity of LST to ε.
H e s t = ρ c p ( L S T T a ) / r h
where ρ is the air density (kg m–3), cp is the specific heat of air at constant pressure (1004 J kg–1 K–1), Ta is temperature at specific height (2 m), and rh is the heat transfer resistance.
Figure 8 showed that RMSE between Hest and Hobs changed with surface emissivity varying from 0.85 to 1.0 for all sites. Sensible heat flux was not sensitive to surface emissivity for all sites, which suggested that LST was not sensitive to surface emissivity. Therefore, a value of 0.99 recommended by Duan et al. [25] for surface emissivity is reasonable in the study. Moreover, the uncertainty of surface emissivity would not affect the evaluation on DTC models [25].

4.2. Influence of DTC Models on Energy Balance Components

The effect of each DTC model on energy balance components is essential for the adaptability of these models. We focused on the impact on net radiation flux, and sensible heat flux in the study (Figure 9).
Nine models were adopted for estimating net radiation and sensible heat flux over alpine meadows. The INA08-ts model performed best with lowest RMSEs both for net radiation (9.23 W m−2) and sensible heat flux (15.29 W m−2). Moreover, models with fixing ts produced better results than that with fixing dT or τ, which suggested that models with fixing ts was more suitable for estimating DTC and energy components over alpine meadows in the TP.

4.3. Comparison of the Model Parameters

As aforementioned, all nine models have three free parameters (T0, Ta, and tm), thus five variables include T0, Ta, Tmax (Tmax = T0 + Ta), tm, and k can be obtained. To evaluate the accuracy of the free parameters obtained by the other eight 4-para DTC models, Tmax was used to compare with in situ observation, while T0, Ta, tm, and k were compared with that estimated from INA08-ts model (Figure 10).
To facilitate understanding, RMSE between the value of parameters in each model and that of the INA08-ts model (or observed value) was calculated and compared. The results suggested that GOT01-ts and GOT09-ts-τ models overestimated T0, while T0 obtained from other models were underestimated when compared with that of the INA08-ts model (Figure 10a). GOT01-ts and GOT09-ts-τ models showed lower RMSEs, while the RMSEs of other models were more than 3 K, especially that INA08-dT model had a high RMSE of 9.9 K (Figure 10a). Moreover, Ta values for all models showed similar characteristic with that of T0. Although RMSEs of T0 and Ta were different for each other, values of Tmax are similar ranging from 1.23 K for the GOT09-ts-τ to 1.68 K for VAN06-ts2 model (Figure 10a), indicating that all models could accurately produce daily maximum temperature.
RMSEs of tm ranged from approximately 0.12 h for the GOT09-ts-τ and GOT01-ts models to 0.72 h for the INA08-dT model (Figure 10b). INA08-dT generated largest bias for k with RMSE of 1.71 h, while k values for other models showed similar RMSEs ranging from 0.37 h for the VAN06-ts1 model to 0.69 h for GOT01-dT model.

4.4. Sensitivity Analysis for the Parameters of Nine 4-Para DTC Models

To further understand the sensitivity of the free parameter to each model, a sensitivity analysis of parameters of each model was performed with reasonable ranges in practical situations at the Suli site (Table 5).
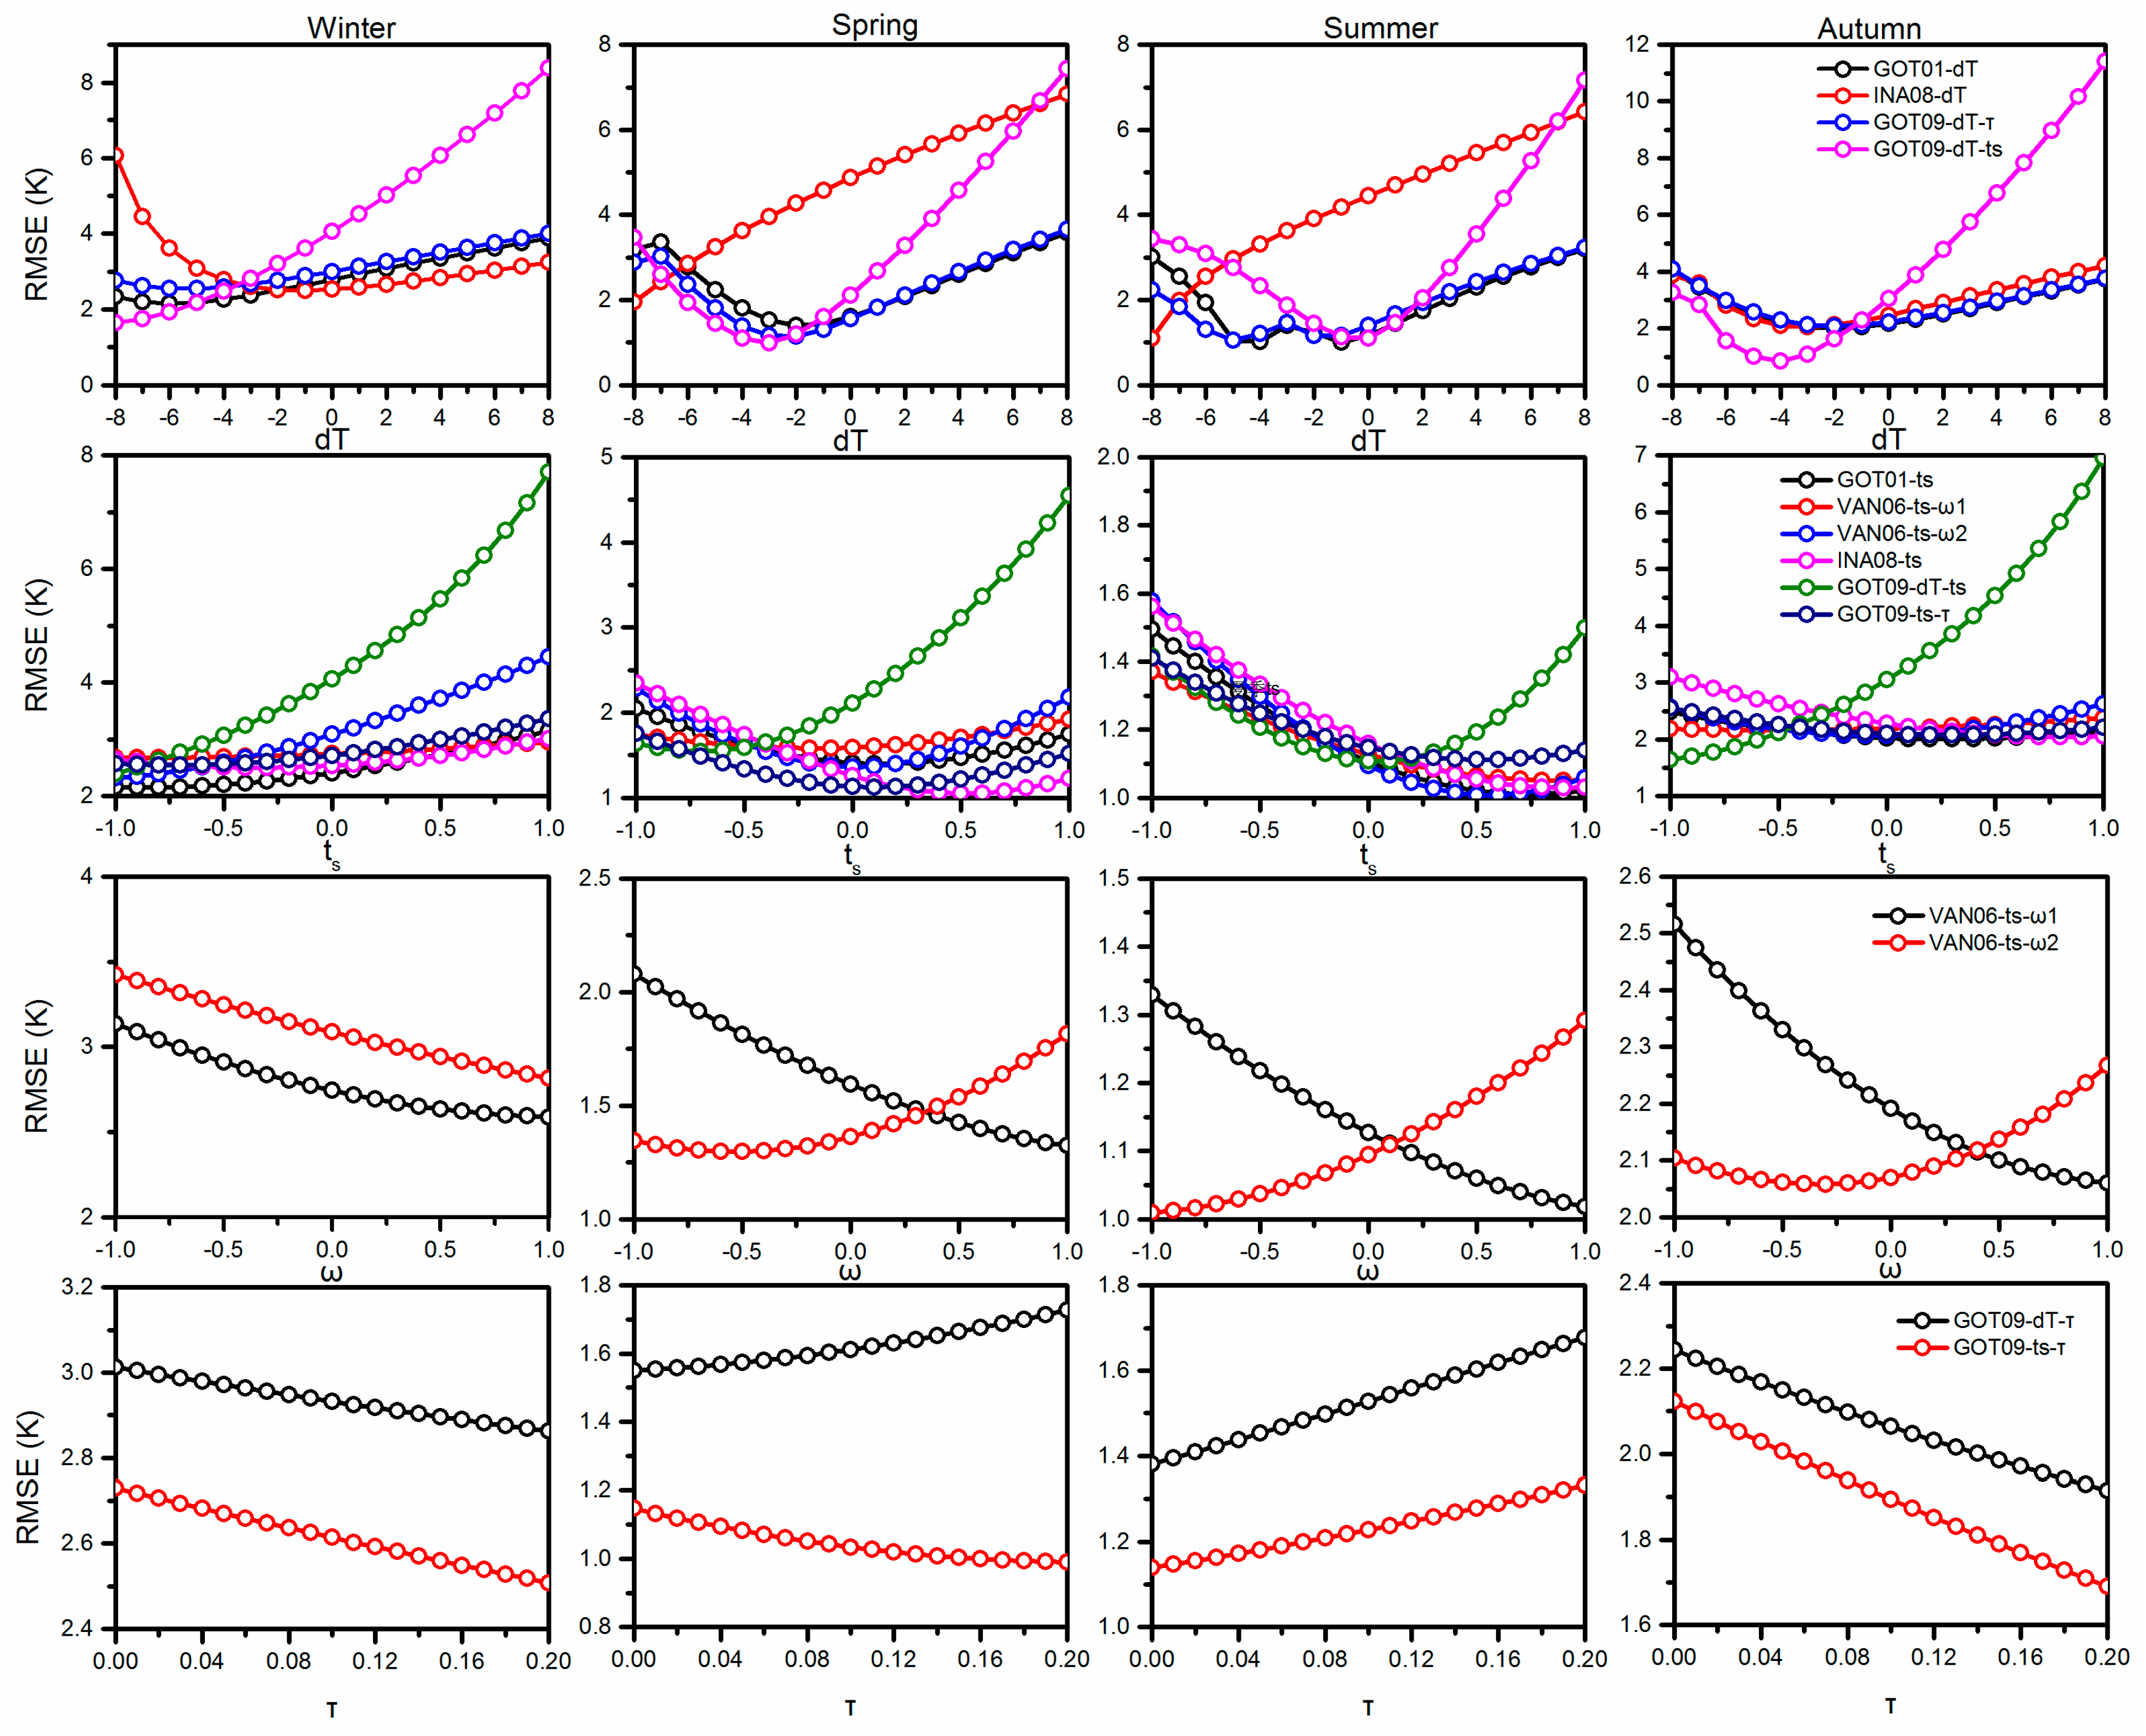
For dT, RMSEs of the GOT01-dT and GOT09-dT-τ models showed similar characteristics as dT varied in four seasons, which fluctuated from appropriately 1 to 3 K in summer and from nearly 2 to 4 K in other seasons (Figure 11). It suggested that dT had low sensitivity to the GOT01-dT and GOT09-dT-τ models. RMSEs of the INA08-dT model rapidly decreased at first and then slowly increased with increasing dT in winter, while it increased rapidly with increasing dT in spring and summer. However, the INA08-dT model displayed the similar trends with GOT01-dT and GOT09-dT-τ models in autumn, indicating that the INA08-dT model had high sensitivity to dT in winter, spring, and summer and low sensitivity in autumn. For the GOT09-dT-ts model, RMSEs rapidly increased in winter and followed a decreasing and then an obviously increasing trend with increasing dT in other seasons, indicating that dT was a very sensitive parameter in the GOT09-dT-ts model.
For ts, RMSEs of the GOT09-dT-ts model rapidly increased in winter, spring, and autumn, while it slowly decreased first and then slowly increased within the range from 1.1 to 1.5 K in summer (Figure 11). RMSEs of other models slowly increased between 2 and 4 K in winter and decreased slowly between 1 and 1.6 K in summer, while it slowly fluctuated in spring and autumn. RMSEs of all models fluctuated slowly in summer within a shallow range from 1 to 1.6 K. These results indicated that ts was sensitive to the GOT09-dT-ts model and insensitive to other five models in winter, spring, and autumn, while it had little impact on all models in summer.
For ω1, RMSEs of VAN06-ts1 slowly decreased in all seasons (Figure 11). As for ω2, RMSEs of VAN06-ts2 insignificantly decreased from 3.5 to 2.8 K in autumn and slowly increased in other seasons. Therefore, ω1 and ω2 were insensitive to VAN06-ts1 and VAN06-ts2 models, respectively. For τ, RMSEs of both GOT09-dT-τ and GOT09-ts-τ models insignificantly decreased in winter and autumn, while they slowly increased in spring and summer. Moreover, RMSEs of the GOT09-dT-τ model were higher than that of GOT09-ts-τ in whole four seasons.
In short summary, the INA08-dT and GOT09-dT-ts models are more sensitive to dT, indicating that fixing dT as zero in the INA08-dT and GOT09-dT-ts models probably yield large error. There exists an optimal value for dT in the GOT09-dT-ts model to acquire high accuracy result. ts is an insensitive parameter in the GOT01-ts, INA08-ts, VAN06-ts1, VAN06-ts2 and GOT09-ts-τ models, while it had large impact on the GOT09-dT-ts model in winter, spring and autumn, indicating that large error may yield when fix ts as a constant for GOT09-dT-ts model in these seasons. ω and τ had little impact on the related models, however, optimal values of these parameters are difficult to determine. Therefore, models with fixing ts (except the GOT09-dT-ts model) could produce high accuracy result, however, further study still need to reduce its error in winter, spring, and autumn.

4.5. Uncertainties and Limitations of the Evaluation on the Performance of the Nine 4-Para DTC Models

The uncertainty of the estimation on surface emissivity may influence the accuracy of the LST observations, thus affects the accuracy of model simulations, while values of the model parameters with and without error-added (Gaussian random error) were almost same [25]. Generally, the spatial resolution of MODIS is 1 km, while the observation data only represents the temperature characteristics around each observation site. The error between observation value and MODIS LST is inevitable due to the inconsistent scale [47]. Moreover, angular anisotropy of MODIS LSTs would also affect the accuracy of model performance. There is no ideal solution to make angular normalize due to its complexity [17]. Therefore, the accuracy of remote sensing products still needs to verify before application, especially in high altitude mountains. Moreover, there are at most four available data one day for MODIS, which may limit the DTC model operation.
All experiments in this study were performed under clear-sky conditions. However, clouds are common for high altitude mountains, which may limit model application in the TP. As Hong et al. [26] pointed out, one possible solution was to temporally aggregate clear-sky MODIS LSTs with a certain number of days to obtain representative clear-sky LST. However, it just reflects the thermal characteristics of the land surface, not the surface dynamics of a specific day. Further study is still needed to explore the universality of model application with and without cloud conditions. Previous studies have mainly focused on the model operation with single day [2,25,26], which caused the physical discontinuity around sunrise for modeling day-to-day DTC [46]. Therefore, further study is still needed to improve the LST accuracy around sunrise and verify in various underlying surfaces.

5. Conclusions

The performance of the nine 4-para DTC models were comprehensively evaluated and compared in the study. Some conclusions are made:
(1)
The INA08-ts model showed best performance among all models over alpine meadows under in situ data. All models had highest accuracy in summer, though poorest performance displayed in winter.
(2)
Models with fixing ts (i.e., INA08-ts) could produce higher accuracy over random days. Moreover, the INA08-ts model could evaluate high accuracy DTC with MODIS data.
(3)
T0 values obtained from the GOT01-ts and GOT09-ts-τ models were overestimated compared with that generated by the INA08-ts model, while other models underestimated T0 value. Ta values for all models showed similar characteristics with that of T0 values. The estimated daily maximum temperature for all models showed high accuracy compared with in situ data.
(4)
The sensitive analysis indicated that the INA08-dT and GOT09-dT-ts models was more sensitive to dT, while ts was an insensitive parameter for the related models. ω and τ had little impact on the related models. Models with fixing ts could produce higher accuracy result than that with fixing dT.
This research provides guidance for evaluating suitable 4-para DTC models in various applications in different regions. Day-to-day temporal simulation of LST is essential for improving the simulation accuracy and helpful for describing surface energy balance and surface thermal inertia in the TP. Further study is still needed to consider day-to-day DTC simulation. Alpine meadows were chosen to investigate the performance of nine 4-para DTC models in the TP. Further study will focus on other underlying surfaces.

Author Contributions

Conceptualization, Y.C. and S.Z.; methodology, Y.C.; data curation, Y.D., Q.Z., and S.Z.; writing—original draft preparation, Y.C.; writing—review and editing, Y.C., Y.D., Q.Z., and S.Z.; visualization, Q.Z.; supervision, Y.D. and S.Z.; funding acquisition, Y.D., Q.Z., and S.Z. All authors have read and agreed to the published version of the manuscript.

Funding

This research was funded by the Strategic Priority Research Program of the Chinese Academy of Sciences (XDA19070503) and the China National Natural Science Foundation (Grants Nos. 41730751, 41671056, and 41871059).

Acknowledgments

The authors would like to thank the Heihe Watershed Allied Telemetry Experimental Research (HiWATER), the Naqu Station of plateau Climate and Environment, the Cryosphere Research Station on the Tibetan Plateau and the Qilian Alpine Ecology and Hydrology Research Station, Northwest Institute of Eco-Environment and Resources (NIEER), Chinese Academy of Sciences (CAS) for providing meteorological data.

Conflicts of Interest

The authors declare no conflicts of interest.

References

  1. Wan, Z.M. New refinements and validation of the collection-6 MODIS land-surface temperature/emissivity product. Remote Sens. Environ. 2014, 140, 36–45. [Google Scholar] [CrossRef]
  2. Duan, S.B.; Li, Z.L.; Tang, B.H.; Wu, H.; Tang, R.L. Direct estimation of land-surface diurnal temperature cycle model parameters from MSG–SEVIRI brightness temperatures under clear sky conditions. Remote Sens. Environ. 2014, 150, 34–43. [Google Scholar] [CrossRef]
  3. Price, J.C. Thermal inertia mapping: A new view of the Earth. J. Geophys. Res. 1977, 82, 2582–2590. [Google Scholar] [CrossRef]
  4. Ignatov, A.; Gutman, G. Monthly Mean Diurnal Cycles in Surface Temperatures over Land for Global Climate Studies. J. Clim. 1999, 12, 1900–1910. [Google Scholar] [CrossRef]
  5. Zhan, W.F.; Chen, Y.H.; Voogt, J.; Zhou, J.; Wang, J.F.; Liu, W.Y.; Ma, W. Interpolating diurnal surface temperatures of an urban facet using sporadic thermal observations. Build. Environ. 2012, 57, 239–252. [Google Scholar] [CrossRef]
  6. Zhan, W.F.; Zhou, J.; Ju, W.M.; Li, M.C.; Sandholt, I.; Voogt, J.; Yu, C. Remotely sensed soil temperatures beneath snow-free skin-surface using thermal observations from tandem polar-orbiting satellites: An analytical three-time-scale model. Remote Sens. Environ. 2014, 143, 1–14. [Google Scholar] [CrossRef]
  7. Qiu, J. China: The third pole. Nature 2008, 454, 393. [Google Scholar] [CrossRef] [Green Version]
  8. Kang, S.; Xu, Y.; You, Q.; Flügel, W.A.; Pepin, N.; Yao, T. Review of climate and cryospheric change in the Tibetan Plateau. Environ. Res. Lett. 2010, 5, 015101. [Google Scholar] [CrossRef]
  9. Zheng, D.; Zhang, Q.S.; Wu, S.H. Mountain Geoecology and Sustainable Development of the Tibetan Plateau; Springer: Berlin, Germany, 2000. [Google Scholar]
  10. Lin, X.W.; Zhang, Z.H.; Wang, S.P.; Hu, Y.G.; Luo, C.Y.; Chang, X.F.; Duan, J.C.; Lin, Q.Y.; Xu, B.; Wang, Y.F.; et al. Response of ecosystem respiration to warming and grazing during the growing seasons in the alpine meadow on the Tibetan plateau. Agric. For. Meteorol. 2011, 151, 792–802. [Google Scholar] [CrossRef]
  11. Zhang, R.; Jiang, D.B.; Zhang, Z.S.; Xu, E.T. The impact of regional uplift of the Tibetan Plateau on the Asian monsoon climate. Palaeogeogr. Palaeocl. 2015, 417, 137–150. [Google Scholar] [CrossRef]
  12. Peng, F.; Sun, G.D. Identifying Sensitive Model Parameter Combinations for Uncertainties in Land Surface Process Simulations over the Tibetan Plateau. Water 2019, 11, 1724. [Google Scholar] [CrossRef] [Green Version]
  13. Li, J.G.; Zhang, G.; Chen, F.; Peng, X.D.; Gan, Y.J. Evaluation of land surface subprocesses and their impacts on model performance with global flux data. J. Adv. Model. Earth Syst. 2019, 11, 1329–1348. [Google Scholar] [CrossRef]
  14. Yang, K.; Wu, H.; Qin, J.; Lin, C.G.; Tang, W.J.; Chen, Y.Y. Recent climate changes over the Tibetan Plateau and their impacts on energy and water cycle: A review. Global Planet. Chang. 2014, 112, 79–91. [Google Scholar] [CrossRef]
  15. Xin, Y.F.; Chen, F.; Zhao, P.; Barlage, M.; Blanken, P.; Chen, Y.L.; Chen, B.; Wang, Y.J. Surface energy balance closure at ten sites over the Tibetan plateau. Agric. For. Meteorol. 2018, 259, 317–328. [Google Scholar] [CrossRef]
  16. Chang, Y.P.; Ding, Y.J.; Zhao, Q.D.; Zhang, S.Q. Remote estimation of terrestrial evapotranspiration by Landsat 5 TM and the SEBAL model in cold and high-altitude regions: A case study of the upper reach of the Shule River Basin, China. Hydrol. Process 2017, 31, 514–524. [Google Scholar] [CrossRef]
  17. Duan, S.B.; Li, Z.L.; Tang, B.H.; Wu, H.; Tang, R.L.; Bi, Y.Y.; Zhou, G.Q. Estimation of Diurnal Cycle of Land Surface Temperature at High Temporal and Spatial Resolution from Clear-Sky MODIS Data. Remote Sens. 2014, 6, 3247–3262. [Google Scholar] [CrossRef] [Green Version]
  18. Göttsche, F.M.; Olesen, F.S. Modelling of diurnal cycles of brightness temperature extracted from METEOSAT data. Remote Sens. Environ. 2001, 76, 337–348. [Google Scholar] [CrossRef]
  19. Inamdar, A.K.; French, A.; Hook, S.; Vaughan, G.; Luckett, W. Land surface temperature retrieval at high spatial and temporal resolutions over the southwestern United States. J. Geophys. Res. 2008, 113, D07107. [Google Scholar] [CrossRef]
  20. Zhou, J.; Chen, Y.H.; Zhang, X.; Zhan, W.F. Modelling the diurnal variations of urban heat islands with multi-source satellite data. Int. J. Remote Sens. 2013, 34, 7568–7588. [Google Scholar] [CrossRef]
  21. Schädlich, S.; Göttsche, F.M.; Olesen, F.S. Influence of Land Surface Parameters and Atmosphere on METEOSAT Brightness Temperatures and Generation of Land Surface Temperature Maps by Temporally and Spatially Interpolating Atmospheric Correction. Remote Sens. Environ. 2001, 75, 39–46. [Google Scholar] [CrossRef]
  22. Göttsche, F.M.; Olesen, F.S. Modelling the effect of optical thickness on diurnal cycles of land surface temperature. Remote Sens. Environ. 2009, 113, 2306–2316. [Google Scholar] [CrossRef]
  23. Huang, F.; Zhan, W.F.; Duan, S.B.; Ju, W.M.; Quan, J.L. A generic framework for modeling diurnal land surface temperatures with remotely sensed thermal observations under clear sky. Remote Sens. Environ. 2014, 150, 140–151. [Google Scholar] [CrossRef]
  24. Jiang, G.M.; Li, Z.L.; Nerry, F. Land surface emissivity retrieval from combined mid-infrared and thermal infrared data of MSG-SEVIRI. Remote Sens. Environ. 2006, 105, 326–340. [Google Scholar] [CrossRef]
  25. Duan, S.B.; Li, Z.L.; Wang, N.; Wu, H.; Tang, B.H. Evaluation of six land-surface diurnal temperature cycle models using clear-sky in situ and satellite data. Remote Sens. Environ. 2012, 124, 15–25. [Google Scholar] [CrossRef]
  26. Hong, F.L.; Zhan, W.F.; Göttsche, F.M.; Liu, Z.H.; Zhou, J.; Huang, F.; Lai, J.M.; Li, M.C. Comprehensive assessment of four-parameter diurnal land surface temperature cycle models under clear-sky. ISPRS J. Photogramm. Remote Sens. 2018, 142, 190–204. [Google Scholar] [CrossRef]
  27. Parton, W.J.; Logan, J.A. A model for diurnal variation in soil and air temperature. Agric. Meteorol. 1981, 23, 205–216. [Google Scholar] [CrossRef]
  28. Sun, D.; Pinker, R.T. Implementation of GOES-based land surface temperature diurnal cycle to AVHRR. Int. J. Remote Sens. 2005, 26, 3975–3984. [Google Scholar] [CrossRef]
  29. Van den Bergh, F.; van Wyk, M.A.; van Wyk, B.J. A comparison of data-driven and model-driven approaches to brightness temperature diurnal cycle interpolation. In Proceedings of the 17th Annual Symposium of the Pattern Recognition Association of South Africa, Parys, South Africa, 29 November–1 December 2006. [Google Scholar]
  30. Zhang, L.; Wang, C.Z.; Yang, H.X.; Zhang, B.H. Phenological metrics dataset, land cover types map for the Tibetan Plateau and grassland biomass dataset for Qinghai Lake Basin. China Sci. Data 2017, 2. [Google Scholar] [CrossRef]
  31. Qin, J.; Yang, K.; Liang, S.L.; Guo, X.F. The altitudinal dependence of recent rapid warming over the Tibetan Plateau. Clim. Chang. 2009, 97, 321–327. [Google Scholar] [CrossRef]
  32. Xu, Y.M.; Shen, Y.; Wu, Z.Y. Spatial and Temporal Variations of Land Surface Temperature Over the Tibetan Plateau Based on Harmonic Analysis. Mt. Res. Dev. 2013, 33, 85–94. [Google Scholar] [CrossRef]
  33. Zheng, W.; Wei, H.L.; Wang, Z.; Zeng, X.B.; Meng, J.; Ek, M.; Mitchell, K.; Derber, J. Improvement of daytime land surface skin temperature over arid regions in the NCEP GFS model and its impact on satellite data assimilation. J. Geophys. Res. 2012, 117, D06117. [Google Scholar] [CrossRef] [Green Version]
  34. Trigo, I.F.; Boussetta, S.; Viterbo, P.; Balsamo, G.; Beljaars, A.; Sandu, I. Comparison of model land skin temperature with remotely sensed estimates and assessment of surfaceatmosphere coupling. J. Geophys. Res. Atmos. 2015, 120, 12096–12111. [Google Scholar] [CrossRef] [Green Version]
  35. Hu, Y.; Zhong, L.; Ma, Y.; Zou, M.; Xu, K.; Huang, Z.; Feng, L. Estimation of the Land Surface Temperature over the Tibetan Plateau by Using Chinese FY-2C Geostationary Satellite Data. Sensors 2018, 18, 376. [Google Scholar] [CrossRef] [PubMed] [Green Version]
  36. Min, W.; Li, Y.; Zhou, J. Validation of MODIS land surface temperature products in east of the Qinghai-Xizang Plateau. Plateau Meteo 2015, 34, 1511–1516. [Google Scholar]
  37. Zhou, C.; Wang, K.; Ma, Q. Evaluation of Eight Current Reanalyses in Simulating Land Surface Temperature from 1979 to 2003 in China. J. Clim. 2017, 30, 7379–7398. [Google Scholar] [CrossRef]
  38. Yang, K.; Koike, T.; Ishikawa, H.; Kim, J.; Li, X.; Liu, H.Z.; Liu, S.M.; Ma, Y.M.; Wang, J.M. Turbulent flux transfer over bare-soil surfaces: Characteristics and parameterization. J. Appl. Meteorol. Clim. 2008, 47, 276–290. [Google Scholar] [CrossRef] [Green Version]
  39. Liu, S.M.; Li, X.; Xu, Z.W.; Che, T.; Xiao, Q.; Mingguo, M.G.; Liu, Q.H.; Jin, R.; Guo, J.W.; Wang, L.X.; et al. The Heihe integrated observatory network: A basin-scale land surface processes observatory in China. Vadose Zone J. 2018, 17, 180072. [Google Scholar] [CrossRef]
  40. Han, C.T.; Chen, R.S.; Liu, Z.W.; Yang, Y.; Liu, J.F.; Song, Y.X.; Wang, L.; Liu, G.H.; Guo, S.H.; Wang, X.Q. Cryospheric hydrometeorology observation in the Hulu catchment (CHOICE), Qilian mountains, China. Vadose Zone J. 2018, 17, 180058. [Google Scholar] [CrossRef]
  41. Chang, Y.P.; Qin, D.H.; Ding, Y.J.; Zhao, Q.D.; Zhang, S.Q. A modified MOD16 algorithm to estimate evapotranspiration over alpine meadow on the Tibetan Plateau, China. J. Hydrol. 2018, 561, 16–30. [Google Scholar] [CrossRef]
  42. Sun, G.H.; Hu, Z.Y.; Wang, J.M.; Ma, W.Q.; Gu, L.L.; Sun, F.L.; Xie, Z.P.; Yan, X.Q. The spatial heterogeneity of land surface conditions and its influence on surface fluxes over a typical underlying surface in the Tibetan Plateau. Theor. Appl. Climatol. 2018, 135, 221–235. [Google Scholar] [CrossRef]
  43. Yao, J.M.; Zhao, L.; Gu, L.L.; Qiao, Y.P.; Jiao, K.Q. The surface energy budget in the permafrost region of the Tibetan Plateau. Atmos. Res. 2011, 102, 394–407. [Google Scholar] [CrossRef]
  44. Wan, Z.M.; Zhang, Y.L.; Zhang, Q.C.; Li, Z.L. Validation of the land-surface temperature products retrieved from Terra Moderate Resolution Imaging Spectroradiometer data. Remote Sens. Environ. 2002, 83, 163–180. [Google Scholar] [CrossRef]
  45. Press, W.H.; Teukolsky, S.A.; Vetterling, W.T.; Flannery, B.P. Numerical Recipes in C: The Art of Scientific Computing, 2nd ed.; Cambridge University Press: New York, NY, USA, 1997; pp. 683–688. [Google Scholar]
  46. Duan, S.B.; Li, Z.L.; Wu, H.; Tang, B.H.; Jiang, X.G.; Zhou, G.Q. Modeling of Day-to-Day Temporal Progression of Clear-Sky Land Surface Temperature. IEEE Geosci. Remote Sens. Lett. 2013, 10, 1050–1054. [Google Scholar] [CrossRef]
  47. Wang, B.B.; Ma, Y.M.; Ma, W.Q. Estimation of land surface temperature retrieved from EOS/MODIS in Naqu area over Tibetan Plateau. Int. J. Remote Sens. 2012, 16, 1289–1309. [Google Scholar]
Figure 1. Geolocations of the alpine meadow observation sites in the Tibetan Plateau, the land cover distribution were based on Zhang et al. [30].
Remotesensing 12 00103 g001
Figure 2. Statistical indicators (coefficient of determination: (R2) (a); mean bias (MB) (b); root mean square error (RMSE) (c); and Nash—Sutcliffe efficiency coefficient: (NSE) (d) of Diurnal Temperature Cycle (DTC) between estimated by the nine 4-para DTC models and in situ data at each observation site under clear-sky day.
Remotesensing 12 00103 g002
Figure 3. The average statistical indicators (R2, (a); RMSE, (b); MB, (c); and NSE, (d) of the nine 4-para DTC models at all sites compare with in situ data under clear-sky day.
Remotesensing 12 00103 g003
Figure 4. Simulated by the nine 4-para DTC models and in situ observed diurnal variations of LST at each site (Arou, (ad); Hulugou, (eh); Suli, (il); Naqu, (mp); Tanggula, (qt)) in four seasons.
Remotesensing 12 00103 g004
Figure 5. RMSEs of the nine 4-para DTC models over four seasons in the TP.
Remotesensing 12 00103 g005
Figure 6. Scatter plots of observed LST and that estimated by the GOT01-dT (a), GOT01-ts (b), INA08- dT (c), INA08-ts (d), Van06-ts1 (e), Van06-ts-ω2 (f), GOT09-dT-τ (g), GOT09-dT-ts (h) and GOT09-ts-τ (i) models, respectively.
Remotesensing 12 00103 g006
Figure 7. DTC estimated by the INA08-ts model driven by the observed and MODIS data at the Suli (a,b) and Tanggula (c,d) sites, respectively.
Remotesensing 12 00103 g007
Figure 8. Sensitivity of sensible heat flux to the surface emissivity.
Remotesensing 12 00103 g008
Figure 9. RMSEs of the nine 4-para DTC models for net radiation and sensible heat flux in the TP.
Remotesensing 12 00103 g009
Figure 10. RMSEs of the differences between values of the parameters (T0, Ta, and Tmax: (a); tm, and k: (b)) generated from the nine 4-para DTC models and that of the INA08-ts model (or observed values, like Tmax).
Remotesensing 12 00103 g010
Figure 11. RMSEs of the nine 4-para models with ranging the corresponding fixed parameters (dT, ts, ω, and τ) in four seasons.
Remotesensing 12 00103 g011
Table 1. Information of the land surface temperature (LST) observation sites in the Tibetan Plateau.
Site NameLatitude (°)Longitude (°)Elevation (MASL)YearData Source
Arou38.05100.4630332014Liu et al., 2018 [39]
Hulugou38.2599.8832322013Han et al., 2018 [40]
Suli38.4298.3238852010Chang et al., 2018 [41]
Naqu31.3791.945092011Sun et al., 2018 [42]
Tanggula33.0791.9351002010Yao et al., 2011 [43]
Table 2. Summary of parameters for the nine diurnal temperature cycle (DTC) models.
CasesAll ParametersFixed ParametersCategoryReference
GOT01-dTT0, Ta, tm, ts, dTdT = 0SEMSchädlich et al. [21]
GOT01-tsT0, Ta, tm, ts, dTts = tss − 1SEMHong et al. [26]
Van06-ts1T0, Ta, tm, ts, ω1, ω2ts = tss − 1; ω1 = DDSEMthis study
Van06-ts2T0, Ta, tm, ts, ω1, ω2ts = tss − 1; ω2 = DDSEMthis study
INA08-dTT0, Ta, tm, ts, dTdT = 0SEMHong et al. [26]
INA08-tsT0, Ta, tm, ts, dTts = tss − 1SEMHong et al. [26]
GOT09-dT-τT0, Ta, tm, ts, dT, τdT = 0; τ = 0.01SEMHong et al. [26]
GOT09-dT-tsT0, Ta, tm, ts, dT, τdT = 0; ts = tss − 1SEMHong et al. [26]
GOT09-tsT0, Ta, tm, ts, dT, τts = tss − 1; τ = 0.01SEMHong et al. [26]
Table 3. Initial values of the free parameter for the nine 4-para DTC models.
ParameterGOT01-dTGOT01-tsVan06-ts1Van06-ts2INA08-dTINA08-tsGOT09-dT-τGOT09-dT-tsGOT09-ts
T0 (K)TminTminTminTminTminTminTminTminTmin
Ta (K)TmaxTminTmaxTminTmaxTminTmaxTminTmaxTminTmaxTminTmaxTminTmaxTminTmaxTmin
tm (h)13.513.513.513.513.513.513.513.513.5
ts (h)tss − 1tss − 1tss − 1
dT (K)0.50.50.5
ω1 (h)DD
ω2 (h)DD
τ0.01
Table 4. Statistical indexes used in this study.
IndexAbbreviationEquation
Coefficient of determinationR2 ( n i = 1 n ( T e s t T o b s ) i = 1 n T e s t i = 1 n T o b s ) 2 ( n i = 1 n T e s t 2 ( i = 1 n T e s t ) 2 ) ( n i = 1 n T o b s 2 ( i = 1 n T o b s ) 2 )
Root mean square errorRMSE i = 1 n ( T e s t T o b s ) 2 n
Mean biasMB i = 1 n ( T o b s T e s t ) n
Nash–Sutcliffe efficiency coefficientNSE 1 i = 1 n ( T o b s T e s t ) 2 i = 1 n ( T o b s T o b s ¯ ) 2
Note: Test stands for simulations, Tobs is the observed values, T o b s ¯ is the average of Tobs, and n is the sample number.
Table 5. Sensitivity parameters and variation range for each model.
CasesSensitive ParameterRanges of Variation; Steps
GOT01-dTdT−8:8; 1
GOT01-tststs − 1:ts + 1; 0.1
VAN06-ts-ω1tsts − 1:ts + 1; 0.1
ω1DD − 1:DD + 1; 0.1
VAN06-ts-ω2tsts − 1:ts + 1; 0.1
ω2DD − 1:DD + 1; 0.1
INA08-dTdT−8:8; 1
INA08-tststs − 1:ts + 1; 0.1
GOT09-dT-τdT−8:8; 1
Τ0:0.2; 0.01
GOT09-dT-tsdT−8: 8; 1
tsts − 1:ts + 1; 0.1
GOT09-tststs − 1:ts + 1; 0.1
Τ0:0.2; 0.01