1. Introduction
Data shows that we are entering an age of bigger, more aggressive fires that kill more people, and do more damage to our environment, our infrastructure, and our atmosphere. For example, a recent study shows that the State of California has experienced a fivefold increase in annual burned area since 1972 [
1]. This is mirrored in wildfires getting bigger and more destructive all over the world—for example, in the greater USA [
2], Australia [
3], and South America [
4]. These trends have been attributed to many causes, such as warmer temperatures, drought [
5], fuel accumulation (some due to aggressive fire suppression) [
6], dead vegetation, and increased population density near wildlands [
7]. These trends are likely to continue and perhaps even accelerate [
8,
9], likely leading to even more dangerous wildfires in the future.
Figure 1 below from Cal-Adapt [
10] gives the depressing outlook for California.
The authorities responsible for managing wildfires must respond to the increasing threat in a wide variety of ways including monitoring, suppression, evacuation, prescribed fire, and other means of fuels management. In all cases, fire agencies prefer to be made aware of the wildfire as early as possible. In an evacuation scenario, every minute of earlier notice can save lives and result in safer and better coordinated evacuation. Regarding suppression, smaller fires are clearly much easier to extinguish or redirect. It is certainly more cost effective for fire suppression agencies to assign an excessive number of resources, keeping a fire at a few acre fire compared to the cost of a weeks-long battle against a 100,000 acre fire. Even in monitoring scenarios, early notification is useful to get the appropriate monitoring equipment and personnel in the right locations, and to assess the magnitude of the danger, and possibly start evacuations. We assert that modern imaging and computing now gives us the capability to catch fires earlier, and reduce their damage.
In the state of California, the first notification of a fire is typically received from someone calling 9-1-1 (the United States nation-wide emergency number) from their mobile phone. When asked, fire personnel tend to say that fires are typically reported within 15 min of ignition. In reality, it is usually difficult to determine how long a fire has been burning before it is reported. Camera networks will help us to better understand the ignition-to-report interval. Our goal is to minimize that interval and, at the very least, to be competitive with call-in reports.
There are many sensors that can potentially detect fires from long distances, ranging from satellites to aerial vehicles to mountain top cameras. Some of the past research has focused on satellites [
11,
12] and there are several operational satellites deployed today. In the United States, some of the main satellites used for fire detection are GOES 16, GOES 17, MODIS and VIIRS. Currently operational non-US satellites that have the potential to be used for fire detection include Meteosat-11, GEO-KOMPSat-2A, and Himawara-8. Multiple organizations (governmental, educational, and commercial [
13,
14]) have developed algorithms to check for fires in the data from these satellites, and they are running these algorithms continuously.
Satellite design involves many tradeoffs and no satellite that is currently in orbit was designed specifically for rapid fire detection. Nonetheless, there is a growing appreciation for the potential value of satellites to aid in early fire detection especially as the spatial and temporal resolution of satellites improve. The robust fire intelligence system that we are building will accept data from all appropriate systems. Most of the satellites that will be useful will be either geo-synchronous or part of a system of many lower earth orbit platforms. Geosynchronous satellites such as GOES operate at an altitude of 35,786 km above the earth’s surface. At this long distance, they have the benefit of being able to view the entire hemisphere of the earth, but the cost is relatively coarse resolution. In the GOES-16 and GOES-17 satellites, the infrared bands currently used to detect fire have ground sample distances of 2 km × 2 km covering the entire hemisphere in one view and the contiguous United States (CONUS) in another view [
15]. Each of the two present GOES satellites also provides two moveable mesoscale sectors covering areas of 1000 km by 1000 km, with 1 km × 1 km ground sample distance. The full hemispheric data arrives on a 15 min cadence, the CONUS on a 5 min, and the Mesoscale data on a 1 min cadence. The finer spatial and temporal resolution of the Mesoscale sectors make them more useful for early fire detection but only for the monitored regions. The infrared sensors effectively measure the average temperature across the entire area of the pixel. A small but hot fire growing in moderate fuels may burn hot enough to be detected above the background, but many times fires that are burning slowly and even large fires in light fuels do not always generate enough heat to rise above the background noise. Theoretically, it may be possible to build geosynchronous satellites with resolution sufficient to detect fires in moderate fuels that are 10 square meters [
11] with fast cadence and data transfer. Although no such publicly accessible system has been built and deployed, the trends are encouraging for the future. Below, in our discussion of how we are applying the camera-based fire detections systems, we give examples of the fusion of camera and satellite data and the promise that this fusion seems to hold.
Lower altitude (500–2000 km) orbiting satellites have finer resolution that makes it easier to detect fires in their early phases, but they take several hours to days to return to the same view. For example, VIIRS has a 12 h revisit time, together the two MODIS satellites cover the Earth four times per day, and Landsat-8 has a 16 day revisit time [
16,
17,
18]. It is rare, but has happened, that one of these satellites provides the first notification of a fire because the fire would have to start just as the satellites happens to be passing overhead. Theoretically, a constellation of several hundred or so low orbiting satellites with real-time network capabilities may be able to provide the required coverage to discover fires in a timely manner, but no such system has been deployed yet.
Another option for deploying sensors closer to earth are high altitude aircrafts. High altitude long endurance aircraft have ceiling near 18 km [
19], which implies a circular area of π*18
2 ≈ 1000 square kilometers, assuming 90 degrees field of view to limit distortion. At this rate, just to encompass the State of California, with an area of 424,000 square kilometers, one would need more than 424,000/1000 ≈ 420 such aircrafts for continuous coverage even if there was a way to perfectly divide the territory into circles without overlaps and gaps. Furthermore, aircrafts require constant energy, limiting their flight time to several hours with current technology, which makes this option have a very high monetary and energy cost. Although complete coverage with such systems appears untenable, they may prove cost effective if used to surveil areas that are historically prone to fires during extreme fire threat conditions. One exception to this is high-altitude long-duration balloons that can stay aloft for weeks [
20] and attain an altitude near 45 km. At this distance, they can image large areas up to 6000 square kilometers, lowering the number of devices for California to approximately 70. Some balloons have limited networking capability, but there are proposals for building mesh network of balloons with networking capabilities [
21]. One challenge with balloons is that it is difficult to position them precisely due to wind currents, especially when managing a fleet of thousands of balloons. Regardless, as of today, there is still no large-scale mesh deployment of balloons available to mount fire-sensing devices, but we think this may be a potential opportunity in the future.
An option for fire-sensing devices closest to the ground is optical cameras installed at good vantage points, such as fire towers and mountain tops. Such cameras can easily see smoke in the first few minutes of a fire from more than 50 km away and, combined with optical zoom, they could peer even farther. Once installed, these require minimal maintenance and energy, and they can run continuously. There are two robust networks of such cameras already deployed in the State of California (HPWREN [
22] and Alert Wildfire [
23]). We have built an early wildfire detection system that searches images from these cameras. Detecting wildfires from cameras is not a novel idea, and there are some commercial companies already selling products to do this (ForestWatch [
24], FireWatch [
25], SmokeD [
26], Wildland Detection Systems [
27], and InsightFD [
28]). Multiple researchers [
29,
30,
31] have either built their own machine learning-based techniques to detect smoke in images or evaluated techniques built by others and proved the feasibility of the approach. However, [
30] showed that the commercial FireWatch product outperformed all machine learning models, and a study on real-world deployment from Australia [
32] shows that FireWatch and ForestWatch performed similarly and had a median detection time near 40 min. The novel aspect of our approach is the ability to detect smoke within a few minutes on real-world deployment at high accuracy. Although we are still improving our detection system, some preliminary results show that our approach is an order of magnitude better than published results from some other systems. By comparing our results with those of geosynchronous satellites, we found that the two approaches complement each other and ideally should be used together to achieve the best results.
2. Detecting Fires from Terrestrial Cameras
Multiple organizations have already installed network-connected optical cameras in or near wildland areas in California which show live images on internet web pages, and even more cameras are planned to be installed in the next few years. The motivation for installing these cameras has been for people to be actively monitoring them with three main goals: (1) Detect fires by continuous manual observation of the images, (2) Verify and locate fires reported by telephone, and (3) Closely monitor a known fire by panning and zooming around the incident. The cameras are very effective for the latter two, but for people to manually detect fires with these cameras requires them to constantly and diligently stare at the live image streams that only change gradually. Studies have shown that humans encounter difficulties in maintaining attention when performing monotonous tasks such as starting at very slowly changing live images for hours [
33]. This task is better suited for computerized automation, which can process an unlimited number of images continuously with a consistent level of accuracy, all the while maintaining sensitivity for detection and a low false alarm rate.
Any automated system will have some false positives and false negatives. Cal Fire and some other local fire agencies in California have previously deployed at least one computerized smoke detection system, ForestWatch from EnviroVision [
24], but these deployments were abandoned because the systems were plagued by high false detection error rates. An evaluation of ForestWatch in Alberta, Canada [
34] documents an initial false positive rate of more than 300 per day, which was reduced to 10–30 per day after fine-tuning camera settings. Another study [
35] reviews multiple automated digital optical image detection systems and notes that ForestWatch is the most popular system. Besides the false positives, another issue with existing systems is the detection latency. The earlier referenced Australia study [
32] reported median detection time of 39 min for FireWatch and 46 min for ForestWatch. The 75 percentile detection latency was 141 for FireWatch and 123 for ForestWatch. In densely populated California, most fires are reported within 15 min, and so any system that takes longer than that is unlikely to ever be the first source of notification.
We believed that it was possible to build a system that is more accurate and faster at detecting fires in the incipient phase by employing a state of the art, image recognition machine learning model called InceptionV3 [
36] if trained on a dataset consisting of images of smoke from small fires. Other researchers [
31] have also noted that Inception-based networks perform better at smoke detection. We leveraged the InceptionV3 model definition from the tensorflow-slim open source code repository [
37], and we did not perform an exhaustive investigation of alternative models. It is fully possible that a different machine learning model may perform better than InceptionV3. We plan to investigate some alternatives in future work, but our results, presented below, are already better than all existing systems that we were able to research. The InceptionV3 model expects images to be 299 × 299 pixels, and anything not that size is typically resized to 299 × 299. Resizing a 3000 × 2000 pixels (6MP) image with a small bit of smoke down to 299 × 299 would lose all pixels of smoke. So, instead, we chop the image into slightly overlapping 299 × 299 squares. One alternative to segmenting large images would be to change the model architecture to handle larger images, but we decided to defer that for future research in order to prioritize testing the feasibility of using machine learning for smoke detection. We could not simply use the pretrained InceptionV3 model for inference because it was designed and trained to detect 1000 different everyday objects such as dogs, cats, cups, cars, etc. The images from the fire camera networks contain natural landscapes and we’re trying to detect tiny smoke plumes. So, we trained a model with the InceptionV3 architecture on our own dataset of images from these cameras. We conducted an experiment in the early stage of the project to see if there would be benefits from transfer learning by comparing fine-tuning a pretrained model vs. full training from scratch. Both approaches gave similar results but full training from scratch performed slightly better. We have used the full training approach to obtain the results reported here. In the future, we may reevaluate transfer learning by conducting more exhaustive experiments with a variety of hyperparameters. Training a deep learning model from scratch requires, at minimum, many tens of thousands of images and vastly more images are always desirable.
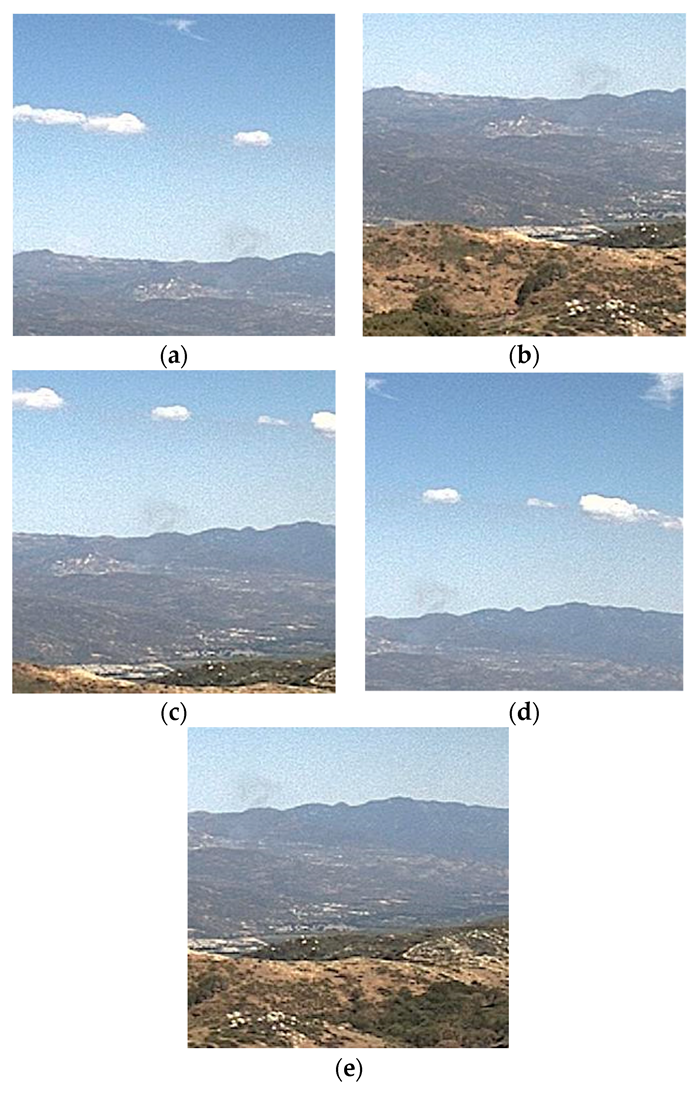
Finding tens of thousands of real smoke images was a huge challenge. The HPWREN camera network has been archiving images from all their cameras every minute for several years, and this archive is internet accessible. In order to find the images in this archive that contained smoke, we used the location and time of historical fires in the records of the California Department of Forestry and Fire Protection (Cal Fire) within the region covered by the HPWREN network. By combining the fire locations with camera locations and archive dates, we were able to determine the list of camera archives that may contain a view of each fire. A team of volunteers manually checked this list and placed a bounding box around any visible smoke from the early phases of the fire. Once the fires became large, they were no longer included in the dataset because the goal of the project is to catch fires within 15 min of start time. We collected approximately 8500 unique images that we could crop to the bounding boxes and use for training the model. Given the small number of unique images, we decided to leverage a standard augmentation technique of shifting and flipping images. We got a 5 times boost by sliding the original image bounding box in the four diagonal directions: top left, bottom left, top right, and bottom right as shown in
Figure 2a–e below. Besides increasing the number of images, these shifts also help to make the model tolerant of smoke not being centered in the image. We got another 2 times boost by horizontally flipping each image, and this also makes the model more tolerant of different terrains. With the shifts and flips, we now have approximately 85,000 smoke image segments for training.
To ensure that the model is unbiased, it is necessary to have a similar number of objects in both smoke and non-smoke datasets. Collecting 85,000 non-smoke images is relatively easy and did not require any augmentation technique because most of the time the image streams contain no active fire. However, to get an even more useful non-smoke dataset, we chose images that contained features similar to smoke, such as fog and clouds. Even with that, the first few trained models had very high false positive rates. To improve the quality of our training set, we added these false detections to the non-smoke dataset and retrained the model. We repeated this exercise every few weeks, and noticed the model giving better output with every training iteration. After multiple iterations, we now have a system with dramatically improved accuracy. This is just the result of improving the non-smoke dataset as significant changes to the smoke dataset were not made.
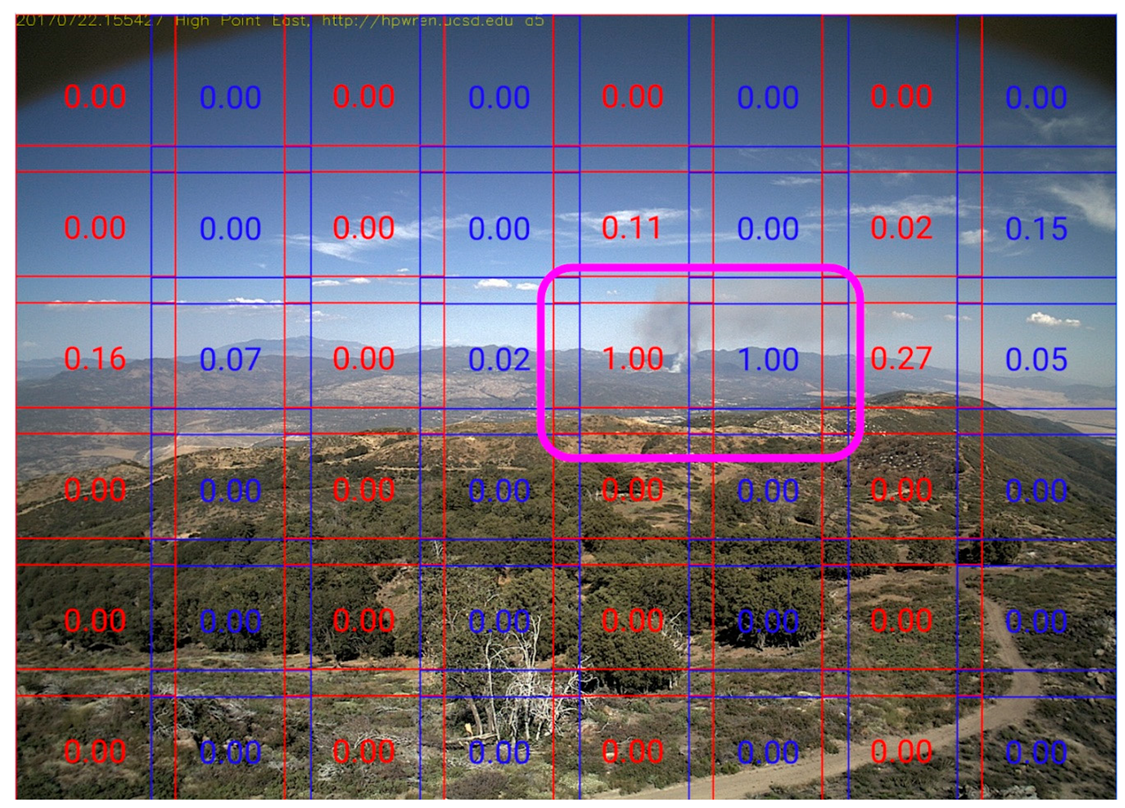
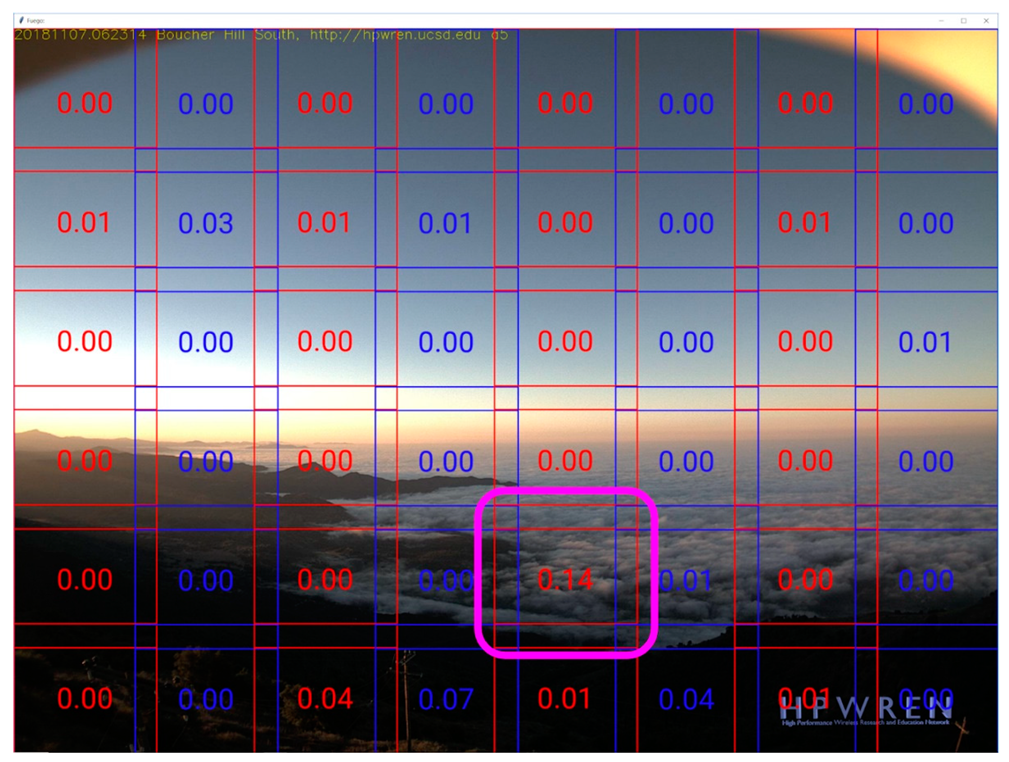
The detection process first splits the image into 299 × 299 square segments, then sends each segment to the Machine Learning (ML) inference system to be evaluated independently of any neighboring segments. The ML inference system applies the trained model to the segment and returns a softmax score between 0 and 1. High values are likely to have smoke.
Figure 3 shows an example of the sub-image scoring within an image that includes a fire.
While analyzing the results, we noticed a pattern in the false positives: certain segments from some cameras tended to have higher scores at the same time of the day, likely due to periodic weather events (fog and solar reflection) or human activity (smog and haze). To reduce these false positives, we implemented an algorithm to raise the smoke threshold above 0.5. The algorithm finds the maximum value for each individual square from the last 3 days in a two hour window around current time. Then it sets the new threshold to be the average of that maximum value and 1. If the historical maximum value was 0, the threshold would be 0.5, but if, for example, the historical maximum was 0.4, then the threshold would be raised to (0.4 + 1)/2 = 0.7. This dynamic adjustment of the threshold reduced the false positives by 30%. The time periods (3 days and 2 h window) were chosen arbitrarily, and we plan to experiment with a variety of time periods as well as explore incorporating weather conditions in the future.
As expected, with real fires, the detection system continues to report positive results until the fire is extinguished. Sometimes fires extinguishes to an extent that smoke is undetectable for a period of time, yet the fire may smoke again within an hour or so. We consider these as a different class of events which we do not report to authorities as they monitor burns closely for flare-ups. To avoid continuously bombarding people reviewing the notifications from our detection system, we suppress all notifications from the same camera until one hour has passed without any detectable smoke. Nonetheless, we continue to collect and score images. This way, even if a fire persists for several hours, the system will only send a single notification when the first image has detectable smoke.
3. Evaluation of Machine Learning Subsystem
Examining success (true positive and true negative) as well as failure (false negative, and false positive) data points can be helpful in understanding the system.
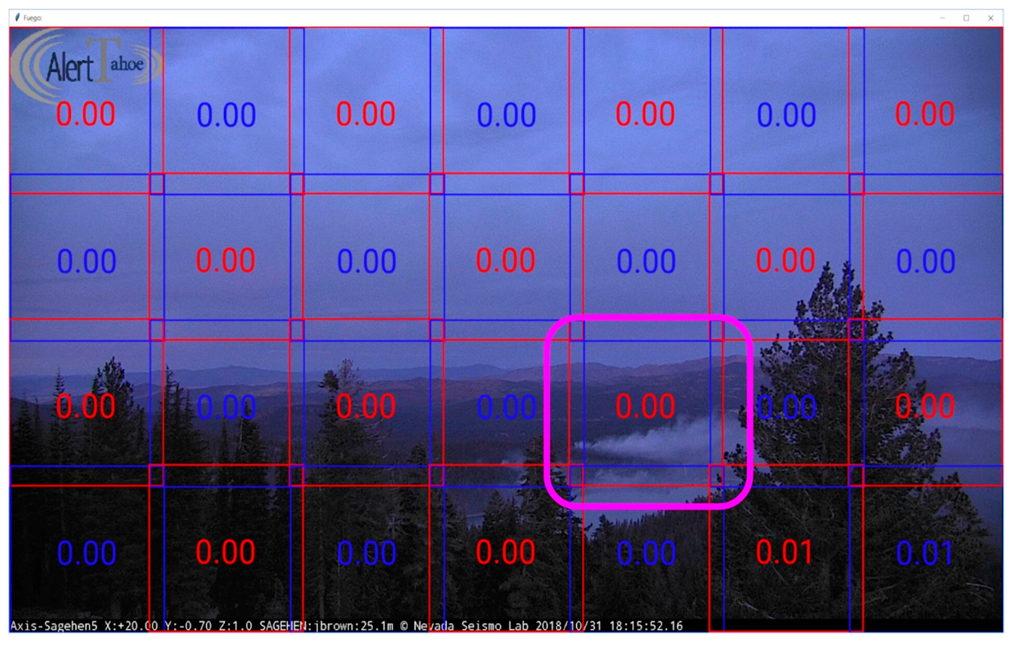
Figure 3 above showed a true positive example.
Figure 4,
Figure 5 and
Figure 6 below show true negative, false negative, and false positive examples respectively.
For a more comprehensive evaluation of the machine learning system, we examine accuracy values on the validation and test set as well as F-1 scores. The accuracy metric ((true positive + true negative)/total number of samples) on the validation dataset (10% of overall dataset) was 0.9967. We also use a separate test set that contains hand-selected images of both smoke and non-smoke. We deliberately chose some faint far way smoke images and some clouds and fog images as well. The reasoning behind making this test set particularly difficult is so that we can continue using the same test set even as the system quality improves over time. We selected 100 smoke images from our dataset for the test set. We deleted all images within 10 min of the selected images from the training set to widen the difference between the training set and test set images. Ideally, the test set would have more images, but each image placed in the test set effectively removes an order of magnitude more images from the training set (temporarily adjacent images of the same fire). Because we currently feel limited by the total number of historic smoke images, we have not finished expanding our test set. Although the non-smoke test set could be drastically larger, we chose to limit it to 150 images to maintain some balance.
Unlike the training and validation test set, which are composed of image segments, the test set is composed of full-sized images which are segmented into 299 × 299 squares. For a correct inference, every single segment of a non-smoke test set image must be classified as non-smoke, and at least one segment of smoke test set image must be classified as smoke. Classifying every square correctly compounds the error rate by the total number of segments, resulting in lower overall values. The accuracy on the test set was 0.91 and F-1 score was 0.89.
Table 1 below shows the full confusion matrix on the test set.
Another way to evaluate the machine learning system is to ask how it performs on a sequence of images from the camera archives. One encouraging result was that the machine learning subsystem detects the ignition of the destructive 2018 Holy Fire [
38] in an archived image which was taken 8 min before the first 9-1-1 phone call. We reconstructed the following timing information (in Pacific Daylight Time) for this 6 August 2018 incident (
Table 2):
If the Fuego detection system had been operational at the time, it could have saved not only 8 min between 13:09 and 13:17, it could have even reduced some or all of the 3 min between 13:17 and 13:20 because our notification would include the image from the camera, location of the camera, and the direction the camera was pointing. There is a good chance that people in the Emergency Communications Center would have quickly recognized the fire’s location and the hazard posed by the fire.
4. Evaluation of the Full Detection System
Machine learning is the most important component of the full detection system but, as mentioned earlier, we have also incorporated post-processing layers to reduce the false positives and suppress repetitive notifications for the same fire. We collect statistics on the number of images that advance through each stage of our system. The system is presently continuously scanning 65 HPWREN cameras. Presently, our practice is processing an image from each camera once a minute during the peak fire danger days, but we lower the scanning frequency when the fire danger is low. We modulate the cloud computing resources committed to the system as we vary the image processing frequency.
Table 3 below shows the statistics for a nine day period from 23 October 2019 to 31 October 2019. This period included a few days of high fire danger with Santa Ana winds.
There are a few interesting things to note from the numbers in
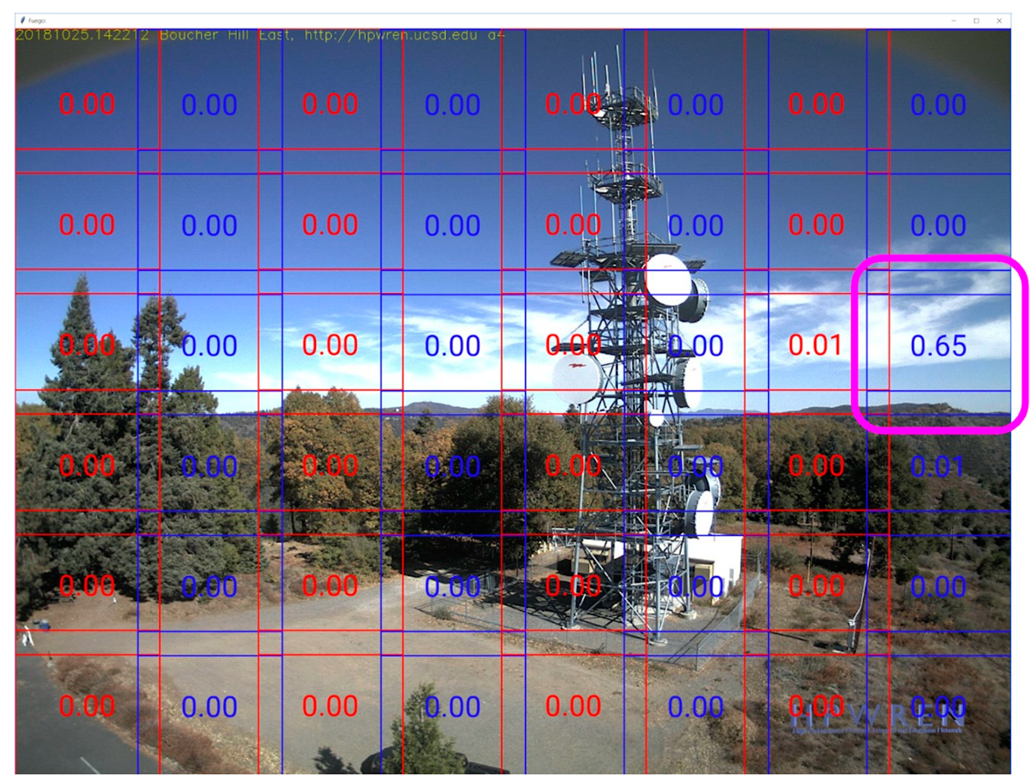
Table 3. Although there are 103 confirmed smoke images, some of them are images of the same fire captured by different cameras that can observe the same region. Unfortunately, only 103/494 = 21% of the notifications showed smoke from real fires. We have several ideas on ways to improve the system as discussed below in the Future Work section. There were (494 − 103)/9 = 43 false positives per day across 65 cameras, which on a per camera basis is 0.66 false detections per day. Most of these were triggered by cloud patterns as illustrated in
Figure 6. To put the frequency of false notifications in context, the false alert rate from a ForestWatch system documented by an Alberta study [
34] was 10–30 per day. Our system is performing at least an order of magnitude better. Even at the current accuracy, the system is likely more effective than human observers, because it is easier to maintain attention for a few seconds to evaluate a single image every 10 min or so across 65 cameras than it is to monotonously stare at a live image stream from 65 cameras.
In addition to the accuracy evaluation above, we evaluated the detection latency for the notifications during the same nine day period. A challenge in discussing detection latency measurement is that the exact start time of most fire events is not precisely known. That is the case for all of the fires on our system in this time period. We calculated an approximate fire start time by manually examining the archived images for each of the captured events and recording the timestamp of the first image where we could visually notice the slightest change near the fire origin. Often, there will be a small delay from the time of actual fire start until smoke is visible to our eyes in the image sequence. The duration of the delay depends on the fuel conditions, distance from the fire, atmospheric conditions such as haze, and obstructions like trees and hills. We estimate the length of this initial delay by examining the difference in the timestamps of images of first specks of smoke from cameras in different locations when multiple cameras capture the start of the same fire. This latter quantifiable difference is usually within 5 min when there are no occlusions due to terrain.
Table 4 presents the distribution of difference between the timestamps of images containing the first specks of smoke and the timestamps when our system detects the smoke. For comparison, the table also includes detection delay data from an Australian study [
32] on ForestWatch and FireWatch, but it should be noted that the Australian study ignited experimental fires, and so their data includes the time between fire start and first specks of smoke.
We have partnered with the Forest Fire Lookout Association (FFLA) of San Diego [
39] to review our detections in a timely manner and alert the appropriate agencies when new wildfires are found that they were not already aware of. Feedback from the FFLA has been essential to us especially in improving the notification aspect of our system. We want to provide the most relevant pieces of information to the agencies while consuming the minimum amount of their bandwidth. For example, the FFLA guided us to include a sequence of recent images in the notification because sometimes a single image by itself is insufficient for even trained wildfire detection experts to determine whether there is a real fire. Such ideas feed into our future plans for improving the automated detection system.
5. Future Work on Camera-Based Detections
Although our current system is already better than the other automated systems that we are aware of, there are many avenues that may improve it even further. The primary way we have been improving the system recently is by adding new training data (both smoke and non-smoke images) for the Inception V3 model. Although the increases in accuracy are now diminishing, we plan to continue to add images to eke out further improvements.
We think a much bigger improvement in accuracy is possible by giving the machine learning system more context beyond the 299 × 299 square segment. We believe this because many times the positives returned by the system are difficult even for people to properly classify just by looking at the 299 × 299 segments. We have found that manually examining the full image helps correctly classify many of the ambiguous segments that contain a portion of smoke or haze. Many of the cases that are ambiguous, even after examining the full image become easier to correctly classify by examining a sequence of a few images spaced one minute apart. Both these approaches (full-sized images, and sequence of image) seem likely also help improve the accuracy of the machine learning system. We plan to investigate these approaches by leveraging different types of deep learning models. In particular, deeper models to handle larger images, wider models to handle sequences of images in parallel, and recurrent networks to handle sequences of images in series.
Besides experimenting with different machine learning model architectures, we also want to experiment with different types of cameras with more features, such as infrared capability for night time images, potassium narrow band filters as proposed by [
40], and higher resolution cameras. Unlike the software-only experiments mentioned earlier, hardware-based experiments are more difficult, because they need to be physically deployed at multiple sites. They would also need to be deployed at a sufficient scale and for sufficient duration to have a good chance of being able to capture multiple fires in order to properly evaluate any improvements. Even if the evaluation demonstrates the effectiveness of one of these hardware-based approaches, it would still require retrofitting a large number of camera installations. There are also some easier to deploy intermediate options where we may be able to control the existing hardware through software changes. Modifying exposure times to generate high dynamic range composite images for better night time data is one such idea.
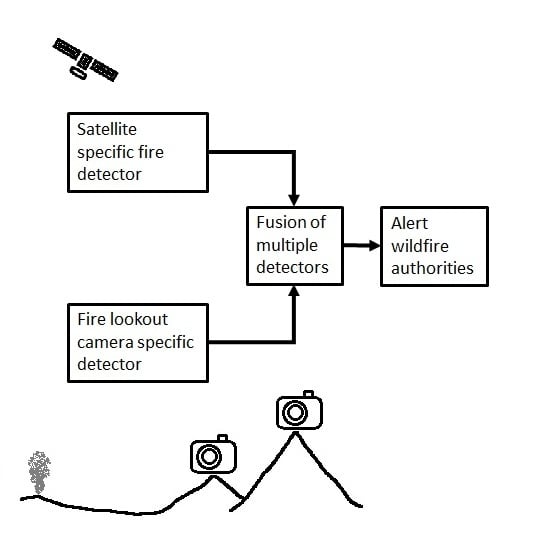
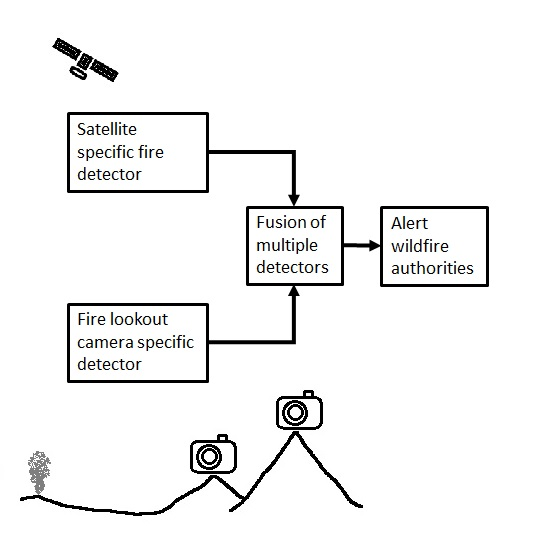
6. Data Fusion with Multiple Independent Sources
Our system works best when the base of the smoke (the fire location) is visible in the images, but that depends on a clean atmosphere, distance of the fire from camera, adequate light, and lack of topographical obstructions. We have seen cases where only a subset of the cameras pointing towards a fire location yields a detectable smoke image due to the above mentioned issues. Higher resolution cameras, optical zoom, infrared sensors, and higher density camera networks can alleviate some of these issues, but there will be locations and times that will be challenging. We will work with our collaborators who are installing the cameras to investigate camera improvements. Having multiple cameras from different locations able to examine the fire candidate location is useful. Separate perspectives are useful even when more than one camera detects a fire because we can use the combined information to have a higher confidence for a detection. Detections from multiple cameras provides the necessary information to triangulate the location of the fire.
Satellite data is also useful for the exact same reasons. Because they have different sensors and perspectives, they can often observe things that terrestrial cameras cannot. They are generally less affected by the topography and the infrared sensors can sense the heat from fires, especially at night when the background is relatively colder. For areas with sparse camera coverage, satellites are the only realistic detection option.
Multiple researchers have published work on both theoretical and operational satellite-based fire detection systems. We plan to leverage the existing fire detection algorithms others have developed, but combine their information with the information from our camera-based detection system to produce a faster and more robust combined system. One idea to speed up detection time with a combined system is to lower the alerting thresholds on each system when both systems confirm an event at the same location.
As we watched the smoke detection system operate, we also watched for the development of detectable temperature signatures for 26 fires in the GOES image feeds presented on NOAA’s Regional and Mesoscale Meteorology Branch (RAMMB) SLIDER [
41]. As time permitted, we also listened to the radio traffic and watched any news helicopter video feeds, so that we could understand the kind of fire that the smoke and satellite data represented. This helped us think about the practical steps needed to combine and use the two detection modalities. In seven of those 26 cases, the fires did not get hot enough for us to see a color change in the GOES Fire Temperature image stream. These cases were low intensity but not necessarily small fires. In one notable case, a fire in Riverside County, California that grew to over 100 acres could not be detected. Images from the AlertWildfire cameras and personal images that were posted on social media showed flames of one to two feet spreading at moderate rates through grass-covered hills covered by large boulders that occasionally acted as a fire break.
In some cases, steep topography may have shielded the fire from the view of one or the other of the GOES satellites’ view. On the other hand, a fire in San Diego County, California, that was quickly detected on at least four HPWREN cameras became detectable in the RAMMB images at the same time that the first fire crews arrived and reported 2 to 3 acres of brush moving rapidly up hill. In the August through November 2019 time frame, fires we tracked and that were described by arriving crew as having moderate or rapid rates of spread were detected in the GOES 17 data between 2 to 12 min after our system detected the smoke. Based on the median time to detect smoke of 13.5 min shown in
Table 4 above, the satellite detections occurred in the range of 15 to 25 min after ignition. In general, we saw a satisfying trend in the direction that fires producing large and rapidly growing smoke plumes also quickly produced signals in the satellite data which grew more rapidly and to higher apparent temperature. A number of the events that we tracked occurred when the GOES Mesoscale sectors were not pointed toward California, and so the data was from the CONUS view. The 5 min cadence of the CONUS view could have limited the detection time. In the case of the rapidly spreading Kincade Fire in Sonoma County which began at 21:19:55 local time on 24 October 2019, the time of ignition and first detection in the GOES-17 data stream are known with precision. The Barnham North camera in the Alertwildfire network was pointed in the direction of the point of origin. The video recorded from that camera shows lights going off as electrical transmission lines dropped. One minute and six seconds later, the temperature signature of this explosive fire was visible in the data from the GOES 17 Mesoscale sector. The pattern is that the fires that are immediately dangerous are likely to have a rapidly detected smoke column and rapidly detected satellite signal. The two systems help to confirm each other, and we plan to leverage that to provide rapid and reliable early fire detection.


