Figure 1.
DenseNet architecture with dense blocks and transition layers.
Figure 1.
DenseNet architecture with dense blocks and transition layers.
Figure 2.
Flowchart of the proposed extended topology-preserving segmentation (ETPS)-based multi-scale and multi-feature method using the convolutional neural network (CNN) for high spatial resolution (HSR) image land-cover classification.
Figure 2.
Flowchart of the proposed extended topology-preserving segmentation (ETPS)-based multi-scale and multi-feature method using the convolutional neural network (CNN) for high spatial resolution (HSR) image land-cover classification.
Figure 3.
Comparison of superpixel segmentation using extended topology-preserving segmentation (ETPS)based on different color compositions. (a) ETPS segmentation based on true color. (b) ETPS segmentation based on standard false-color.
Figure 3.
Comparison of superpixel segmentation using extended topology-preserving segmentation (ETPS)based on different color compositions. (a) ETPS segmentation based on true color. (b) ETPS segmentation based on standard false-color.
Figure 4.
1-D CNN-MLP hybrid network with attention-based weighting design for comprehensive land-cover classification. (a) Multi-scale CNN feature fusion and encoding. (b) Hand-delineated feature encoding. (c) Multi-scale and multi-feature fusion and classification. CNN: convolutional neural network; MLP: multi-layer perception.
Figure 5.
Study areas (a) and GaoFen-2 images of Beilun urban scenes (c) and Cixi rural scenes (b) in true color.
Figure 5.
Study areas (a) and GaoFen-2 images of Beilun urban scenes (c) and Cixi rural scenes (b) in true color.
Figure 6.
Study areas (a), GaoFen-2 images of Xiaoshan for training and testing (b) and validation (c), and GaoFen-2 images of Yuecheng for training and testing (d) and validation (e) in true color.
Figure 6.
Study areas (a), GaoFen-2 images of Xiaoshan for training and testing (b) and validation (c), and GaoFen-2 images of Yuecheng for training and testing (d) and validation (e) in true color.
Figure 7.
Examples of different land-cover classes in false-color for Beilun and Cixi datasets. (a) Images of 10 land-cover classes in the Beilun dataset. (b) Images of 8 land-cover classes in the Cixi dataset.
Figure 7.
Examples of different land-cover classes in false-color for Beilun and Cixi datasets. (a) Images of 10 land-cover classes in the Beilun dataset. (b) Images of 8 land-cover classes in the Cixi dataset.
Figure 8.
Confusion matrices of testing samples in the Beilun dataset for the ESSCNN, EMMCNN, OCNN, PCNN, SMCNN, SMMCNN, and ORF methods. The numbers 1 to 10 in horizontal and vertical axis denote the farmland, woodland, grassland, dense building, sparse building, road, impervious surface, facility land, vacant, and water classes, respectively. ESSCNN: extended topology-preserving segmentation (ETPS)-based single-scale and single-feature convolutional neural network (CNN); EMMCNN: ETPS-based multi-scale and multi-feature CNN; OCNN: object-based CNN; PCNN: patch-based CNN; SMCNN: simple linear iterative clustering (SLIC)-based multi-scale CNN; SMMCNN: SLIC-based multi-scale and multi-feature CNN; ORF: object-based random forest.
Figure 9.
Three typical image subsets (a, b, and c) in the Beilun dataset and their classification results using ESSCNN, EMMCNN, OCNN, PCNN, SMCNN, SMMCNN, and ORF methods. The white and black circles denote the correct and incorrect classification, respectively. ESSCNN: extended topology-preserving segmentation (ETPS)-based single-scale and single-feature convolutional neural network (CNN); EMMCNN: ETPS-based multi-scale and multi-feature CNN; OCNN: object-based CNN; PCNN: patch-based CNN; SMCNN: simple linear iterative clustering (SLIC)-based multi-scale CNN; SMMCNN: SLIC-based multi-scale and multi-feature CNN; ORF: object-based random forest.
Figure 10.
Confusion matrices of testing samples in the Cixi dataset for the ESSCNN, EMMCNN, OCNN, PCNN, SMCNN, SMMCNN, and ORF methods. The numbers 1 to 8 in horizontal and vertical axis denote the water, farmland, woodland, grassland, building, road, impervious surface, and facility land classes, respectively. ESSCNN: extended topology-preserving segmentation (ETPS)-based single-scale and single-feature convolutional neural network (CNN); EMMCNN: ETPS-based multi-scale and multi-feature CNN; OCNN: object-based CNN; PCNN: patch-based CNN; SMCNN: simple linear iterative clustering (SLIC)-based multi-scale CNN; SMMCNN: SLIC-based multi-scale and multi-feature CNN; ORF: object-based random forest.
Figure 11.
Three typical image subsets (a, b, and c) in the Cixi dataset and their classification results using ESSCNN, EMMCNN, OCNN, PCNN, SMCNN, SMMCNN, and ORF methods. The white and black circles denote the correct and incorrect classification, respectively. ESSCNN: extended topology-preserving segmentation (ETPS)-based single-scale and single-feature convolutional neural network (CNN); EMMCNN: ETPS-based multi-scale and multi-feature CNN; OCNN: object-based CNN; PCNN: patch-based CNN; SMCNN: simple linear iterative clustering (SLIC)-based multi-scale CNN; SMMCNN: SLIC-based multi-scale and multi-feature CNN; ORF: object-based random forest.
Figure 12.
Confusion matrices of testing (test) and validating (val) samples in the Xiaoshan dataset for the ESSCNN, EMMCNN, OCNN, PCNN, SMCNN, SMMCNN, and ORF methods. The numbers 1 to 7 in horizontal and vertical axis denote the farmland, woodland, building, road, impervious surface, vacant, and water classes, respectively. ESSCNN: extended topology-preserving segmentation (ETPS)-based single-scale and single-feature convolutional neural network (CNN); EMMCNN: ETPS-based multi-scale and multi-feature CNN; OCNN: object-based CNN; PCNN: patch-based CNN; SMCNN: simple linear iterative clustering (SLIC)-based multi-scale CNN; SMMCNN: SLIC-based multi-scale and multi-feature CNN; ORF: object-based random forest.
Figure 13.
Confusion matrices of testing (test) and validating (val) samples in the Yuecheng dataset for the ESSCNN, EMMCNN, OCNN, PCNN, SMCNN, SMMCNN, and ORF methods. The numbers 1 to 7 in horizontal and vertical axis denote the farmland, woodland, building, road, impervious surface, vacant, and water classes, respectively. ESSCNN: extended topology-preserving segmentation (ETPS)-based single-scale and single-feature convolutional neural network (CNN); EMMCNN: ETPS-based multi-scale and multi-feature CNN; OCNN: object-based CNN; PCNN: patch-based CNN; SMCNN: simple linear iterative clustering (SLIC)-based multi-scale CNN; SMMCNN: SLIC-based multi-scale and multi-feature CNN; ORF: object-based random forest.
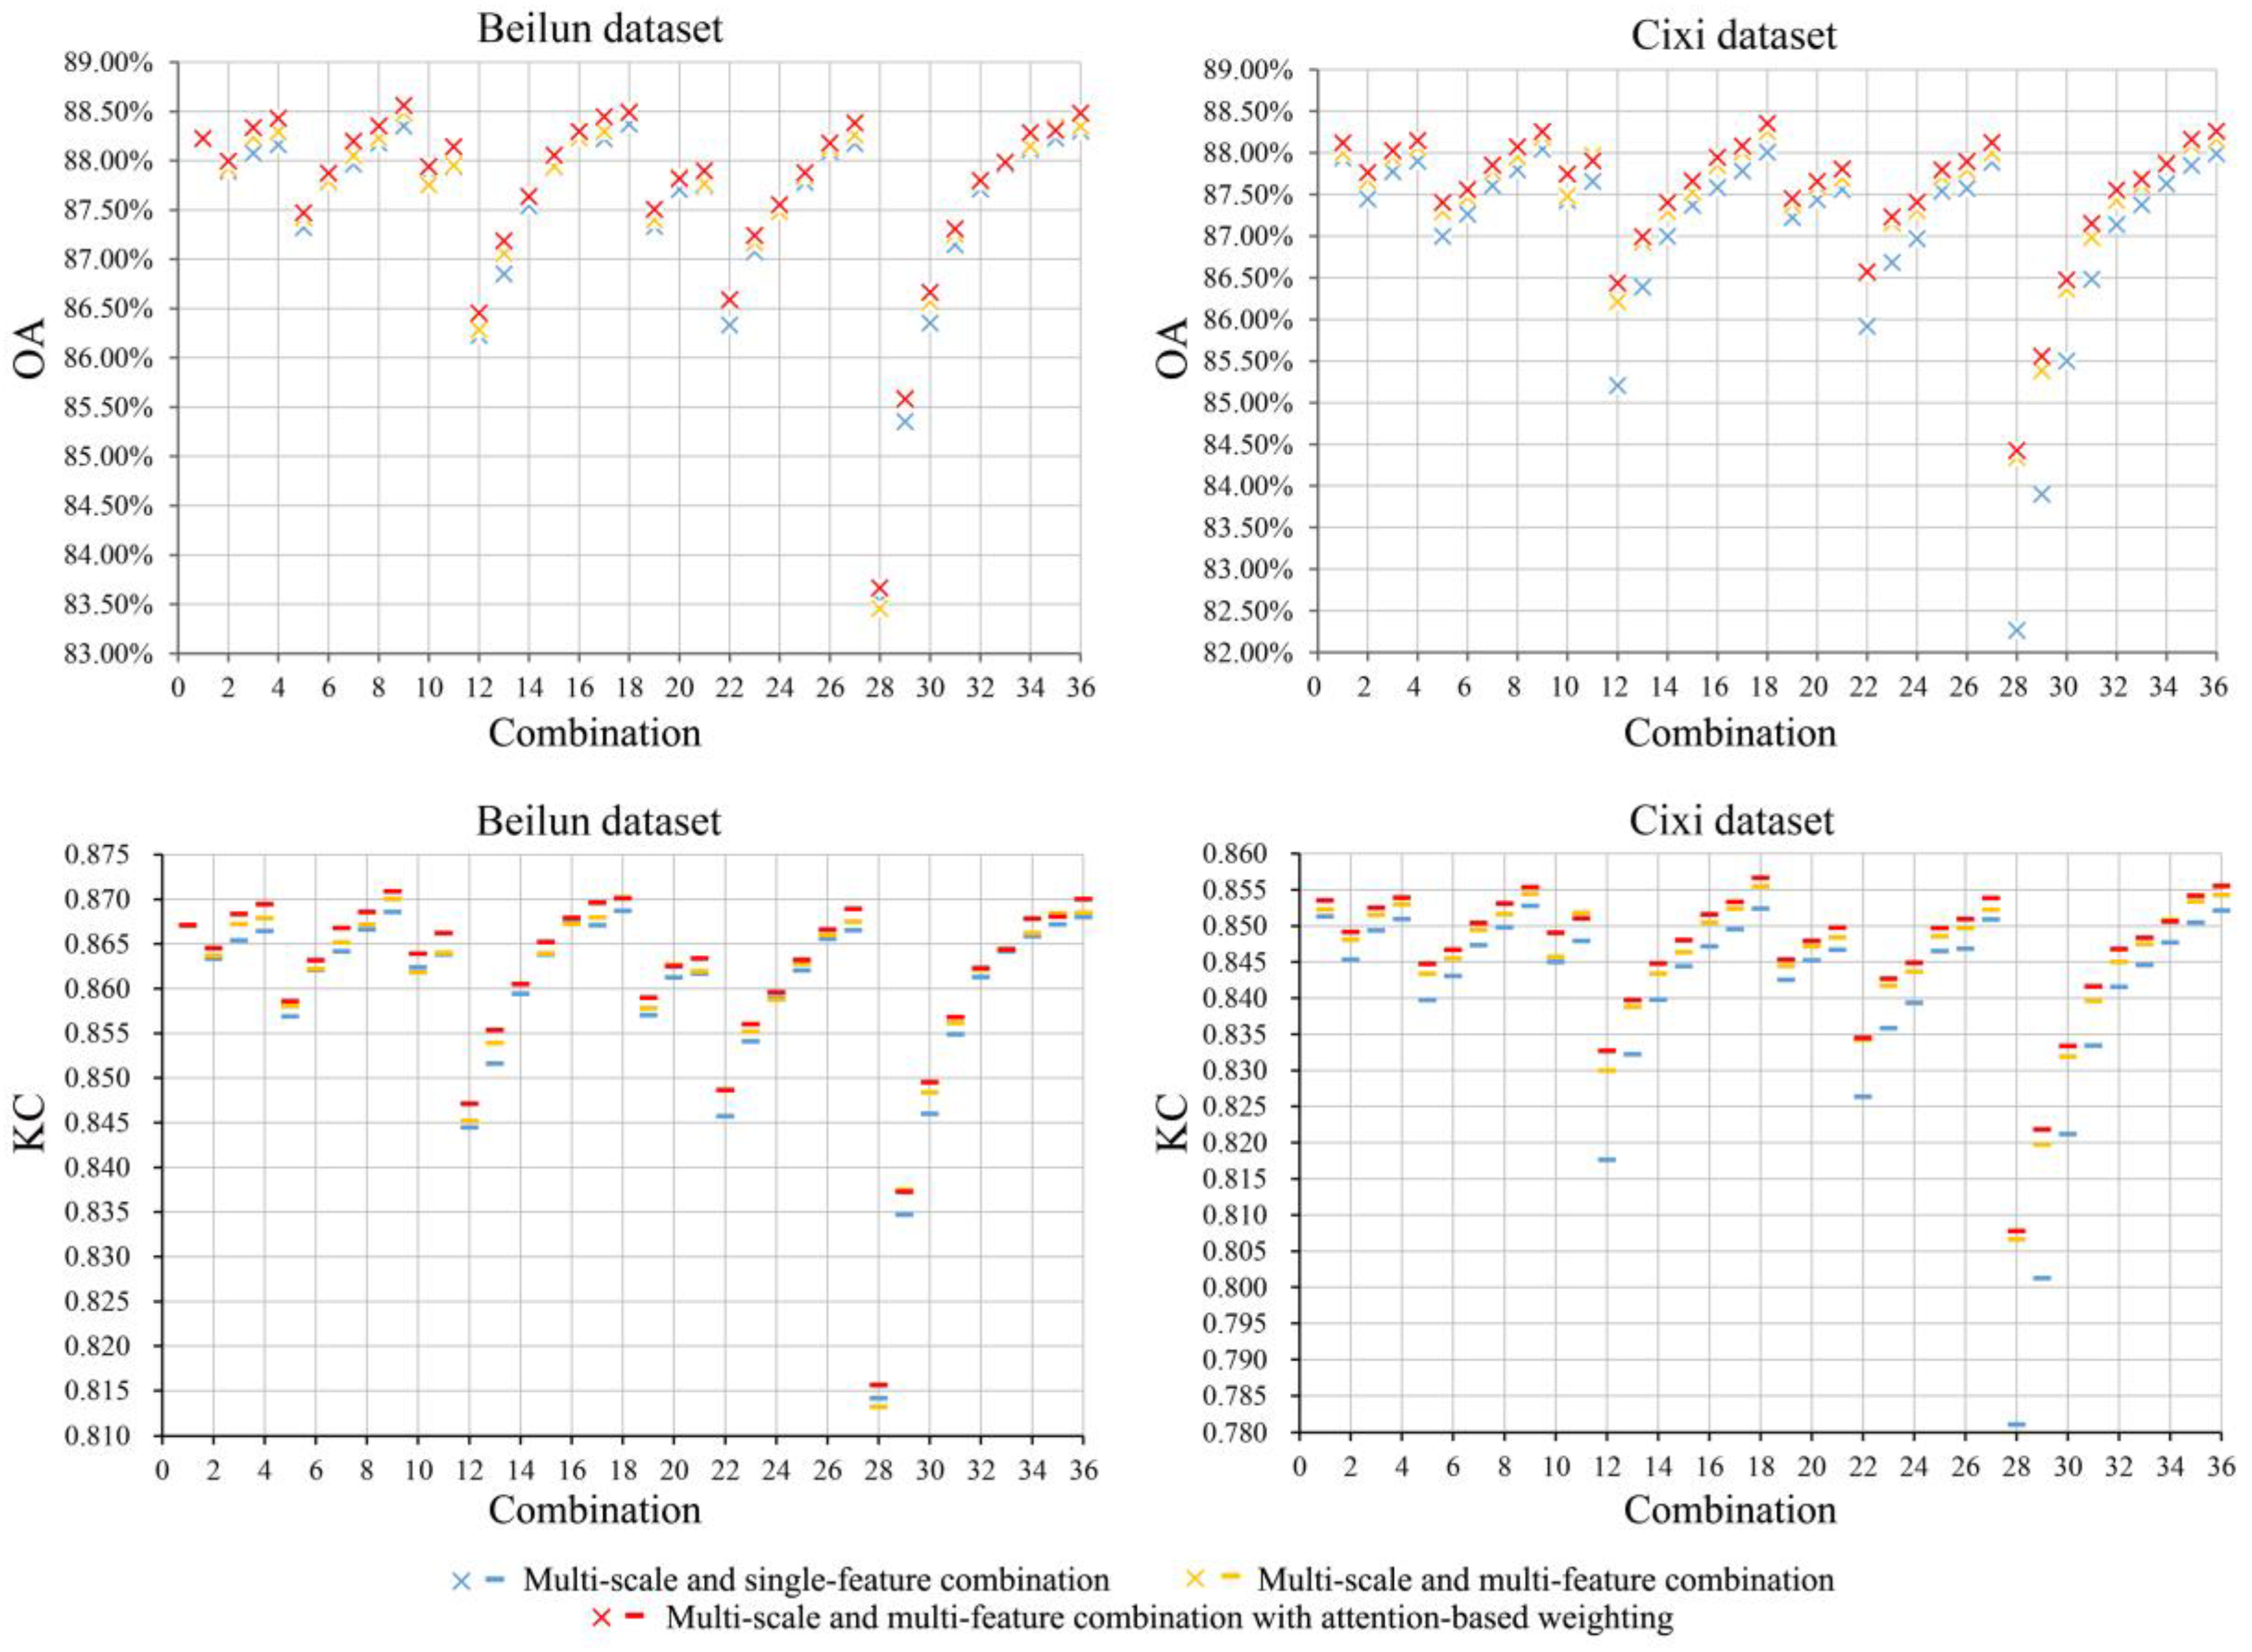
Figure 14.
Classification accuracy comparison among single-feature, multi-feature, and multi-feature with attention-based weighting methods upon multi-scale combinations. The 1st to 36th columns of the horizontal axis represent the COMB1 to COMB36 combining solutions, as shown in
Table 2. OA: overall accuracy; KC: Kappa coefficient.
Table 1.
Dense convolutional neural network (CNN) architecture for multi-scale feature extraction in high spatial resolution (HSR) land-cover classification.
Table 1.
Dense convolutional neural network (CNN) architecture for multi-scale feature extraction in high spatial resolution (HSR) land-cover classification.
| Layers | DCNN-5 | Output Size | DCNN-6 | Output Size |
|---|
| Convolution | 3 × 3 conv | 80 × 80, 24 | 3 × 3 conv | 80 × 80, 24 |
| Dense block (1) | | 80 × 80, 84 | | 80 × 80, 96 |
| Transition layer (1) | 1 × 1 conv | 80 × 80, 42 | 1 × 1 conv | 80 × 80, 48 |
| 2 × 2 avg pool, stride 2 | 40 × 40, 42 | 2 × 2 avg pool, stride 2 | 40 × 40, 48 |
| Dense block (2) | | 40 × 40, 102 | | 40 × 40, 120 |
| Transition layer (2) | 1 × 1 conv | 40 × 40, 51 | 1 × 1 conv | 40 × 40, 60 |
| 2 × 2 avg pool, stride 2 | 20 × 20, 51 | 2 × 2 avg pool, stride 2 | 20 × 20, 60 |
| Dense block (3) | | 20 × 20, 111 | | 20 × 20, 132 |
| Transition layer (3) | 1 × 1 conv | 20 × 20, 55 | 1 × 1 conv | 20 × 20, 66 |
| 2 × 2 avg pool, stride 2 | 10 × 10, 55 | 2 × 2 avg pool, stride 2 | 10 × 10, 66 |
| Dense block (4) | | 10 × 10, 115 | | 10 × 10, 138 |
| GAP layer | 10 × 10 GAP | 1 × 1, 115 | 10 × 10 GAP | 1 × 1, 138 |
| Classification layer | softmax | softmax |
Table 2.
Multi-scale combining solutions based on single-scale convolutional neural network (CNN) features for high spatial resolution (HSR) land-cover classification.
Table 2.
Multi-scale combining solutions based on single-scale convolutional neural network (CNN) features for high spatial resolution (HSR) land-cover classification.
| Scale | 1 | 2 | 3 | 4 | 5 | 6 | 7 | 8 | 9 | 10 | 11 | 12 | 13 | 14 | 15 | 16 | 17 | 18 | 19 | 20 | 21 | 22 | 23 | 24 | 25 | 26 | 27 | 28 | 29 | 30 | 31 | 32 | 33 | 34 | 35 | 36 |
|---|
| 24×24 | * | * | | | * | | | | | * | | * | | | | | | | * | | | * | | | | | | * | | | | | | | | |
| 32×32 | * | * | * | | * | * | | | | | * | * | * | | | | | | | * | | | * | | | | | * | * | | | | | | | |
| 40×40 | * | * | * | * | * | * | * | | | * | | * | * | * | | | | | | | * | * | | * | | | | * | * | * | | | | | | |
| 48×48 | * | * | * | * | * | * | * | * | | | * | * | * | * | * | | | | * | | | | * | | * | | | * | * | * | * | | | | | |
| 56×56 | * | * | * | * | * | * | * | * | * | * | | * | * | * | * | * | | | | * | | * | | * | | * | | | * | * | * | * | | | | |
| 64×64 | * | * | * | * | * | * | * | * | * | | * | * | * | * | * | * | * | | | | * | | * | | * | | * | | | * | * | * | * | | | |
| 72×72 | * | * | * | * | * | * | * | * | * | * | | | * | * | * | * | * | * | * | | | * | | * | | * | | | | | * | * | * | * | | |
| 80×80 | * | * | * | * | * | * | * | * | * | | * | | | * | * | * | * | * | | * | | | * | | * | | * | | | | | * | * | * | * | |
| 88×88 | * | * | * | * | | * | * | * | * | * | | | | | * | * | * | * | | | * | | | * | | * | | | | | | | * | * | * | * |
| 96×96 | * | * | * | * | | | * | * | * | | * | | | | | * | * | * | * | | | | | | * | | * | | | | | | | * | * | * |
| 104×104 | * | | * | * | | | | * | * | * | | | | | | | * | * | | * | | | | | | * | | | | | | | | | * | * |
| 112×112 | * | | | * | | | | | * | | * | | | | | | | * | | | * | | | | | | * | | | | | | | | | * |
Table 3.
Land-cover classes, sample numbers, and subclass descriptions in the Beilun dataset.
Table 3.
Land-cover classes, sample numbers, and subclass descriptions in the Beilun dataset.
| Class | Proportion | Train | Test | Subclass |
|---|
| Farmland | 7.09% | 4262 | 2841 | Paddy fields, dry lands, nurseries, orchards |
| Woodland | 6.74% | 4056 | 2703 | Timber forest, shrub forest, planted forest |
| Grassland | 10.37% | 6236 | 4156 | Native grassland, planted grassland |
| Dense building | 14.65% | 8811 | 5873 | Dense high-rise and low-rise buildings |
| Sparse building | 4.67% | 2811 | 1874 | Sparse high-rise and low-rise buildings |
| Road | 11.88% | 7143 | 4761 | Highways, overpasses, streets |
| Impervious surface | 17.91% | 10769 | 7179 | Squares, stadiums, parking lots, storage fields, rolled surface |
| Facility land | 8.18% | 4923 | 3281 | Oil drums, container fields, docks, industrial facilities |
| Vacant | 5.15% | 3096 | 2063 | Digging lands, bare surface |
| Water | 13.37% | 8040 | 5360 | Rivers, rivulets, ponds, lakes |
Table 4.
Land-cover classes, sample numbers, and subclass descriptions in the Cixi dataset.
Table 4.
Land-cover classes, sample numbers, and subclass descriptions in the Cixi dataset.
| Class | Proportion | Train | Test | Subclass |
|---|
| Water | 9.93% | 4627 | 3085 | Rivers, rivulets, ponds, lakes |
| Farmland | 27.62% | 12864 | 8576 | Paddy field, dry land, nursery, orchard |
| Woodland | 16.56% | 7714 | 5143 | Timber forest, shrub forest, planted forest |
| Grassland | 4.41% | 2056 | 1371 | Native grassland, planted grassland |
| Building | 20.39% | 9499 | 6333 | Low-rise and mid-rise buildings |
| Road | 3.54% | 1648 | 1099 | Streets, country roads |
| Impervious surface | 1.95% | 909 | 607 | Threshing ground, rolled surface |
| Facility land | 15.59% | 7260 | 4840 | Greenhouses, agricultural facilities |
Table 5.
Land-cover classes, sample numbers, and subclass descriptions in the Xiaoshan dataset.
Table 5.
Land-cover classes, sample numbers, and subclass descriptions in the Xiaoshan dataset.
| Class | Proportion | Train | Test | Subclass |
|---|
| Farmland | 22.01% | 11200 | 7500 | Paddy field, dry land, nursery, orchard |
| Woodland | 21.88% | 11152 | 7441 | Timber forest, shrub forest, planted forest, grassland |
| Building | 25.48% | 13047 | 8602 | Low-rise and mid-rise buildings |
| Road | 5.92% | 3013 | 2019 | Streets, country roads |
| Impervious surface | 5.58% | 2836 | 1902 | Threshing ground, rolled surface, facility land |
| Vacant | 6.29% | 3208 | 2134 | Digging lands, bare surface |
| Water | 12.85% | 6527 | 4391 | Rivers, rivulets, ponds, lakes |
Table 6.
Land-cover classes, sample numbers, and subclass descriptions in the Yuecheng dataset.
Table 6.
Land-cover classes, sample numbers, and subclass descriptions in the Yuecheng dataset.
| Class | Proportion | Train | Test | Subclass |
|---|
| Farmland | 20.10% | 10029 | 6537 | Paddy field, dry land, nursery, orchard |
| Woodland | 13.33% | 6619 | 4367 | Timber forest, shrub forest, planted forest, grassland |
| Building | 27.03% | 13345 | 8935 | Low-rise and mid-rise buildings |
| Road | 6.72% | 3331 | 2205 | Streets, country roads |
| Impervious surface | 6.34% | 3176 | 2046 | Threshing ground, rolled surface, facility land |
| Vacant | 5.12% | 2494 | 1722 | Digging lands, bare surface |
| Water | 21.37% | 10459 | 7157 | Rivers, rivulets, ponds, lakes |
Table 7.
Land-cover classes and sample numbers in Xiaoshan and Yuecheng validating datasets.
Table 7.
Land-cover classes and sample numbers in Xiaoshan and Yuecheng validating datasets.
| Class | Xiaoshan Dataset | Yuecheng Dataset |
|---|
| Proportion | Validate | Proportion | Validate |
|---|
| Farmland | 27.13% | 13581 | 14.44% | 5592 |
| Woodland | 17.95% | 8986 | 19.89% | 7704 |
| Building | 27.52% | 13773 | 29.18% | 11303 |
| Road | 4.81% | 2408 | 7.66% | 2966 |
| Impervious surface | 7.57% | 3787 | 14.34% | 5556 |
| Vacant | 2.85% | 1428 | 4.55% | 1763 |
| Water | 12.17% | 6091 | 9.95% | 3855 |
Table 8.
Classification accuracy comparison amongst ESSCNN, EMMCNN, OCNN, PCNN, SMCNN, SMMCNN, and ORF methods for the Beilun dataset.
Table 8.
Classification accuracy comparison amongst ESSCNN, EMMCNN, OCNN, PCNN, SMCNN, SMMCNN, and ORF methods for the Beilun dataset.
| Land-Cover | ESSCNN | EMMCNN | OCNN | PCNN | SMCNN | SMMCNN | ORF |
|---|
| UA | PA | UA | PA | UA | PA | UA | PA | UA | PA | UA | PA | UA | PA |
|---|
| Farmland | 92.05% | 91.51% | 92.68% | 93.81% | 76.93% | 82.16% | 85.23% | 86.86% | 89.09% | 87.49% | 91.57% | 89.70% | 73.04% | 66.67% |
| Woodland | 81.55% | 84.97% | 85.69% | 85.53% | 68.86% | 71.91% | 64.12% | 85.60% | 79.91% | 79.83% | 79.14% | 81.71% | 72.75% | 66.66% |
| Grassland | 86.32% | 90.72% | 90.41% | 90.27% | 73.79% | 69.71% | 85.77% | 77.96% | 73.72% | 91.70% | 82.79% | 88.21% | 64.19% | 67.44% |
| Dense building | 88.76% | 87.39% | 89.85% | 90.01% | 76.90% | 72.65% | 88.94% | 76.81% | 82.41% | 87.20% | 86.61% | 85.19% | 75.19% | 56.54% |
| Sparse building | 83.15% | 82.12% | 86.37% | 86.52% | 57.21% | 60.16% | 75.80% | 75.09% | 74.73% | 75.83% | 77.35% | 80.22% | 23.02% | 48.62% |
| Road | 73.61% | 75.61% | 77.12% | 77.86% | 57.99% | 56.16% | 55.22% | 68.00% | 72.31% | 65.60% | 71.78% | 68.61% | 52.76% | 58.03% |
| Impervious surface | 86.89% | 82.40% | 87.56% | 87.45% | 66.29% | 65.76% | 76.57% | 76.13% | 82.09% | 77.86% | 80.94% | 83.54% | 54.37% | 53.66% |
| Facility land | 89.73% | 89.93% | 92.51% | 90.49% | 66.99% | 71.61% | 85.34% | 82.24% | 88.67% | 80.37% | 89.86% | 82.53% | 33.85% | 51.16% |
| Vacant | 92.09% | 89.21% | 92.05% | 93.33% | 65.96% | 64.85% | 89.38% | 74.38% | 79.50% | 79.41% | 82.41% | 87.72% | 32.66% | 52.54% |
| Water | 90.10% | 90.40% | 91.69% | 90.57% | 81.39% | 85.57% | 82.37% | 88.81% | 91.02% | 84.56% | 90.82% | 87.46% | 84.72% | 83.47% |
| AA | 86.43% | 88.59% | 69.23% | 78.87% | 81.35% | 83.33% | 56.65% |
| OA | 86.45% | 88.56% | 70.57% | 79.08% | 81.55% | 83.67% | 61.72% |
| KC | 0.847 | 0.871 | 0.667 | 0.763 | 0.792 | 0.816 | 0.564 |
Table 9.
Classification accuracy comparison amongst ESSCNN, EMMCNN, OCNN, PCNN, SMCNN, SMMCNN, and ORF methods for the Cixi dataset.
Table 9.
Classification accuracy comparison amongst ESSCNN, EMMCNN, OCNN, PCNN, SMCNN, SMMCNN, and ORF methods for the Cixi dataset.
| Land-Cover | ESSCNN | EMMCNN | OCNN | PCNN | SMCNN | SMMCNN | ORF |
|---|
| UA | PA | UA | PA | UA | PA | UA | PA | UA | PA | UA | PA | UA | PA |
|---|
| Water | 83.59% | 81.99% | 84.46% | 82.89% | 69.11% | 61.27% | 64.94% | 82.52% | 61.03% | 80.14% | 59.67% | 86.25% | 81.49% | 83.82% |
| Farmland | 90.19% | 88.02% | 90.29% | 90.02% | 75.94% | 83.21% | 91.29% | 78.63% | 80.28% | 83.41% | 86.62% | 83.87% | 87.26% | 82.35% |
| Woodland | 91.89% | 90.77% | 92.63% | 92.13% | 85.48% | 78.19% | 91.14% | 80.52% | 88.22% | 85.88% | 88.66% | 89.67% | 87.22% | 83.49% |
| Grassland | 59.47% | 75.45% | 70.39% | 79.01% | 20.79% | 48.83% | 19.33% | 78.41% | 47.83% | 71.71% | 49.26% | 79.02% | 19.12% | 77.63% |
| Building | 92.33% | 89.25% | 92.89% | 89.65% | 91.51% | 79.16% | 92.04% | 86.08% | 92.72% | 82.10% | 94.19% | 82.28% | 91.55% | 79.53% |
| Road | 57.68% | 67.39% | 59.25% | 70.54% | 13.64% | 58.41% | 24.31% | 65.00% | 35.74% | 52.48% | 33.16% | 62.42% | 45.98% | 72.21% |
| Impervious surface | 65.27% | 72.87% | 74.00% | 75.22% | 32.28% | 54.80% | 39.37% | 67.93% | 48.24% | 66.60% | 41.21% | 79.99% | 18.16% | 75.67% |
| Facility land | 89.39% | 89.92% | 90.32% | 90.20% | 84.93% | 71.92% | 83.59% | 83.51% | 90.11% | 74.34% | 93.04% | 76.43% | 82.40% | 76.98% |
| AA | 78.73% | 81.78% | 59.21% | 63.25% | 68.02% | 68.23% | 64.15% |
| OA | 87.13% | 88.35% | 75.78% | 81.39% | 80.27% | 82.63% | 80.77% |
| KC | 0.841 | 0.857 | 0.701 | 0.767 | 0.756 | 0.784 | 0.761 |
Table 10.
Classification accuracy comparison amongst ESSCNN, EMMCNN, OCNN, PCNN, SMCNN, SMMCNN, and ORF methods for the Xiaoshan testing samples.
Table 10.
Classification accuracy comparison amongst ESSCNN, EMMCNN, OCNN, PCNN, SMCNN, SMMCNN, and ORF methods for the Xiaoshan testing samples.
| Land-Cover | ESSCNN | EMMCNN | OCNN | PCNN | SMCNN | SMMCNN | ORF |
|---|
| UA | PA | UA | PA | UA | PA | UA | PA | UA | PA | UA | PA | UA | PA |
|---|
| Farmland | 89.99% | 89.45% | 91.91% | 90.31% | 75.68% | 81.60% | 90.21% | 83.22% | 85.77% | 88.77% | 87.21% | 89.57% | 78.15% | 64.58% |
| Woodland | 86.97% | 86.06% | 88.85% | 88.01% | 70.62% | 74.71% | 83.21% | 82.74% | 81.77% | 84.42% | 83.58% | 85.52% | 65.62% | 71.60% |
| Building | 91.73% | 87.85% | 92.31% | 89.89% | 88.74% | 78.39% | 86.92% | 88.06% | 89.03% | 85.43% | 91.74% | 84.17% | 90.14% | 68.60% |
| Road | 67.82% | 72.71% | 69.98% | 75.08% | 56.46% | 47.71% | 56.36% | 68.36% | 59.34% | 65.16% | 63.96% | 63.60% | 54.99% | 70.69% |
| Impervious surface | 62.42% | 73.74% | 69.97% | 76.43% | 29.03% | 49.65% | 65.11% | 60.17% | 62.93% | 62.19% | 60.27% | 70.26% | 5.78% | 52.67% |
| Vacant | 91.06% | 89.20% | 92.10% | 93.01% | 70.20% | 70.41% | 85.12% | 89.44% | 83.32% | 83.31% | 83.42% | 87.58% | 37.78% | 75.28% |
| Water | 89.72% | 92.00% | 90.66% | 92.93% | 86.29% | 82.23% | 85.33% | 90.40% | 89.43% | 84.03% | 87.40% | 88.15% | 81.86% | 90.76% |
| AA | 82.81% | 85.11% | 68.14% | 78.89% | 78.80% | 79.65% | 59.19% |
| OA | 86.91% | 88.63% | 75.22% | 83.48% | 83.16% | 84.42% | 70.98% |
| KC | 0.839 | 0.860 | 0.694 | 0.796 | 0.793 | 0.808 | 0.634 |
Table 11.
Classification accuracy comparison amongst ESSCNN, EMMCNN, OCNN, PCNN, SMCNN, SMMCNN, and ORF methods for the Xiaoshan validating samples.
Table 11.
Classification accuracy comparison amongst ESSCNN, EMMCNN, OCNN, PCNN, SMCNN, SMMCNN, and ORF methods for the Xiaoshan validating samples.
| Land-Cover | ESSCNN | EMMCNN | OCNN | PCNN | SMCNN | SMMCNN | ORF |
|---|
| UA | PA | UA | PA | UA | PA | UA | PA | UA | PA | UA | PA | UA | PA |
|---|
| Farmland | 65.38% | 75.09% | 67.04% | 77.68% | 51.37% | 77.40% | 69.60% | 71.87% | 58.24% | 76.97% | 57.86% | 77.02% | 63.14% | 60.72% |
| Woodland | 66.31% | 58.39% | 68.02% | 60.02% | 61.75% | 55.10% | 65.49% | 58.95% | 63.40% | 56.27% | 66.16% | 56.13% | 62.40% | 52.81% |
| Building | 83.23% | 72.05% | 83.64% | 72.87% | 83.06% | 67.03% | 76.50% | 75.48% | 82.74% | 69.16% | 85.90% | 69.38% | 76.93% | 66.49% |
| Road | 32.64% | 43.55% | 36.50% | 42.52% | 33.75% | 27.69% | 34.64% | 43.95% | 31.36% | 40.48% | 34.41% | 39.57% | 29.95% | 34.94% |
| Impervious surface | 19.65% | 35.59% | 24.48% | 41.94% | 12.29% | 32.88% | 30.15% | 36.84% | 22.22% | 34.06% | 19.42% | 42.02% | 2.62% | 31.93% |
| Vacant | 43.43% | 26.81% | 43.70% | 30.74% | 43.76% | 26.39% | 34.70% | 25.08% | 43.26% | 24.85% | 40.70% | 23.43% | 31.43% | 23.29% |
| Water | 76.03% | 76.41% | 76.99% | 76.47% | 75.60% | 64.67% | 75.71% | 75.89% | 76.61% | 71.92% | 75.21% | 76.41% | 69.72% | 80.97% |
| AA | 55.24% | 57.20% | 51.65% | 55.25% | 53.98% | 54.24% | 48.03% |
| OA | 65.62% | 67.20% | 60.46% | 65.43% | 63.24% | 64.20% | 60.06% |
| KC | 0.568 | 0.588 | 0.507 | 0.567 | 0.541 | 0.551 | 0.493 |
Table 12.
Classification accuracy comparison amongst ESSCNN, EMMCNN, OCNN, PCNN, SMCNN, SMMCNN, and ORF methods for the Yuecheng testing samples.
Table 12.
Classification accuracy comparison amongst ESSCNN, EMMCNN, OCNN, PCNN, SMCNN, SMMCNN, and ORF methods for the Yuecheng testing samples.
| Land-Cover | ESSCNN | EMMCNN | OCNN | PCNN | SMCNN | SMMCNN | ORF |
|---|
| UA | PA | UA | PA | UA | PA | UA | PA | UA | PA | UA | PA | UA | PA |
|---|
| Farmland | 91.60% | 90.34% | 92.96% | 91.90% | 84.36% | 73.73% | 92.93% | 80.02% | 86.99% | 88.92% | 91.68% | 85.05% | 79.13% | 64.13% |
| Woodland | 75.83% | 75.84% | 78.33% | 79.85% | 52.95% | 48.59% | 63.10% | 68.79% | 68.33% | 70.80% | 66.30% | 76.94% | 36.86% | 46.92% |
| Building | 89.61% | 87.56% | 90.69% | 89.29% | 83.56% | 75.09% | 85.15% | 83.28% | 87.35% | 85.73% | 91.02% | 83.25% | 88.16% | 62.81% |
| Road | 73.53% | 76.41% | 76.94% | 76.74% | 41.35% | 63.60% | 61.71% | 68.67% | 76.12% | 60.25% | 73.34% | 64.66% | 46.75% | 56.49% |
| Impervious surface | 59.33% | 65.74% | 64.76% | 70.46% | 25.09% | 42.96% | 40.65% | 61.32% | 42.82% | 63.17% | 42.84% | 70.82% | 8.17% | 44.71% |
| Vacant | 83.31% | 88.51% | 89.48% | 89.38% | 45.20% | 48.88% | 79.95% | 78.87% | 73.68% | 82.97% | 70.92% | 89.21% | 3.91% | 61.03% |
| Water | 92.96% | 91.83% | 93.54% | 93.18% | 83.47% | 88.93% | 90.51% | 89.99% | 92.38% | 87.88% | 91.07% | 89.88% | 86.78% | 91.45% |
| AA | 80.88% | 83.81% | 59.43% | 73.43% | 75.38% | 75.31% | 49.97% |
| OA | 85.62% | 87.52% | 71.11% | 80.30% | 81.68% | 82.73% | 67.19% |
| KC | 0.822 | 0.846 | 0.641 | 0.756 | 0.774 | 0.785 | 0.584 |
Table 13.
Classification accuracy comparison amongst ESSCNN, EMMCNN, OCNN, PCNN, SMCNN, SMMCNN, and ORF methods for the Yuecheng validating samples.
Table 13.
Classification accuracy comparison amongst ESSCNN, EMMCNN, OCNN, PCNN, SMCNN, SMMCNN, and ORF methods for the Yuecheng validating samples.
| Land-Cover | ESSCNN | EMMCNN | OCNN | PCNN | SMCNN | SMMCNN | ORF |
|---|
| UA | PA | UA | PA | UA | PA | UA | PA | UA | PA | UA | PA | UA | PA |
|---|
| Farmland | 67.56% | 52.05% | 69.16% | 49.80% | 63.37% | 40.72% | 81.61% | 40.81% | 60.64% | 52.52% | 75.94% | 46.60% | 74.37% | 36.91% |
| Woodland | 49.17% | 56.08% | 46.44% | 56.74% | 35.34% | 42.60% | 32.81% | 55.47% | 47.36% | 55.38% | 34.49% | 57.70% | 26.81% | 50.96% |
| Building | 80.55% | 73.13% | 81.30% | 76.35% | 76.55% | 71.34% | 77.94% | 74.80% | 76.72% | 75.41% | 83.90% | 68.63% | 86.11% | 60.85% |
| Road | 46.83% | 56.67% | 53.33% | 53.97% | 43.44% | 36.14% | 42.74% | 54.93% | 59.24% | 34.08% | 53.19% | 43.92% | 37.92% | 44.56% |
| Impervious surface | 33.89% | 44.27% | 34.38% | 45.27% | 21.27% | 38.60% | 17.49% | 38.38% | 32.17% | 46.70% | 26.22% | 47.58% | 3.04% | 33.73% |
| Vacant | 19.48% | 20.90% | 16.80% | 21.73% | 14.84% | 10.90% | 25.73% | 16.74% | 13.14% | 18.23% | 8.77% | 23.88% | 1.58% | 15.38% |
| Water | 80.71% | 78.61% | 82.52% | 76.96% | 50.49% | 76.65% | 77.75% | 79.92% | 78.44% | 77.75% | 80.06% | 78.55% | 79.91% | 71.91% |
| AA | 54.03% | 54.85% | 43.61% | 50.87% | 52.53% | 51.80% | 44.25% |
| OA | 60.39% | 60.93% | 50.51% | 55.69% | 58.14% | 58.48% | 52.51% |
| KC | 0.513 | 0.521 | 0.394 | 0.460 | 0.490 | 0.488 | 0.407 |
Table 14.
Classification accuracy comparison between single-feature and multi-feature methods based on single scales.
Table 14.
Classification accuracy comparison between single-feature and multi-feature methods based on single scales.
| Single-Scale | Beilun Dataset | Cixi Dataset |
|---|
| Single-Feature | Multi-Feature | Single-Feature | Multi-Feature |
|---|
| OA | KC | OA | KC | OA | KC | OA | KC |
|---|
| 24 × 24 | 75.24% | 0.720 | 75.56% | 0.724 | 76.02% | 0.703 | 81.73% | 0.774 |
| 32 × 32 | 78.71% | 0.760 | 79.01% | 0.763 | 78.72% | 0.737 | 82.59% | 0.784 |
| 40 × 40 | 81.41% | 0.790 | 81.50% | 0.791 | 80.80% | 0.763 | 83.98% | 0.802 |
| 48 × 48 | 83.36% | 0.812 | 83.39% | 0.812 | 82.43% | 0.783 | 84.60% | 0.810 |
| 56 × 56 | 84.82% | 0.829 | 84.97% | 0.830 | 83.73% | 0.800 | 85.52% | 0.822 |
| 64 × 64 | 85.25% | 0.834 | 85.43% | 0.835 | 85.31% | 0.819 | 86.33% | 0.831 |
| 72 × 72 | 85.68% | 0.838 | 85.82% | 0.840 | 85.83% | 0.825 | 86.69% | 0.836 |
| 80 × 80 | 86.04% | 0.843 | 86.22% | 0.844 | 86.61% | 0.835 | 87.12% | 0.841 |
| 88 × 88 | 86.20% | 0.844 | 86.39% | 0.847 | 86.57% | 0.834 | 87.08% | 0.841 |
| 96 × 96 | 86.40% | 0.846 | 86.45% | 0.847 | 86.89% | 0.838 | 87.29% | 0.843 |
| 104 × 104 | 86.45% | 0.847 | 86.52% | 0.848 | 86.97% | 0.840 | 87.38% | 0.845 |
| 112 × 112 | 86.42% | 0.847 | 86.55% | 0.848 | 87.13% | 0.841 | 87.54% | 0.846 |

 ,
, 


