Review

Radiometric Model and Inter-Comparison Results of the SGLI-VNR On-Board Calibration

1
Japan Aerospace Exploration Agency (JAXA), Tsukuba, Ibaraki 305-8505, Japan
2
National Aeronautics and Space Administration (NASA), Greenbelt, MD 20771, USA
3
Remote Sensing Technology Center of Japan (RESTEC), Minato, Tokyo 105-0001, Japan
*
Author to whom correspondence should be addressed.
Remote Sens. 2020, 12(1), 69; https://doi.org/10.3390/rs12010069
Submission received: 27 October 2019 / Revised: 11 December 2019 / Accepted: 17 December 2019 / Published: 23 December 2019

Abstract

:
The Second Generation Global Imager (SGLI) on Global Change Observation Mission–Climate (GCOM-C) satellite empowers surface and atmospheric measurements related to the carbon cycle and radiation budget, with two radiometers of Visible and Near Infrared Radiometer (SGLI-VNR) and Infrared Scanning Radiometer (SGLI-IRS) that perform a wide-band (380 nm–12 µm) optical observation not only with as wide as a 1150–1400 km field of view (FOV), but also with as high as 0.25–0.5 km resolution. Additionally, polarization and along-track slant view observations are quite characteristic of SGLI. It is important to calibrate radiometers to provide the sensor data records for more than 28 standard products and 23 research products including clouds, aerosols, ocean color, vegetation, snow and ice, and other applications. In this paper, the radiometric model and the first results of on-board calibrations on the SGLI-VNR, which include weekly solar and light-emitting diode (LED) calibration and monthly lunar calibration, will be described. Each calibration data was obtained with corrections, where beta angle correction and avoidance of reflection from multilayer insulation (MLI) were applied for solar calibration; LED temperature correction was performed for LED calibration; and the GIRO (GSICS (Global Space-based Inter-Calibration System) Implementation of the ROLO (RObotic Lunar Observatory) model) model was used for lunar calibration. Results show that the inter-comparison of the relative degradation amount between these three calibrations agreed to within 1% or less.

Graphical Abstract

1. Introduction

Global Change Observation Mission (GCOM) aims to establish and demonstrate a global, long-term satellite-observing system to measure essential geophysical parameters to facilitate understanding of global water circulation and climate change, and eventually contribute to improving future climate projection through a collaborative framework with climate model institutions [1]. GCOM consists of two polar orbiting satellite observing systems, GCOM-Water (GCOM-W) and GCOM-Climate (GCOM-C). The first satellite, GCOM-W with Advanced Microwave Scanning Radiometer 2 (AMSR2), was launched in 2012 and is observing continuously. The follower satellite, GCOM-C with Second Generation Global Image (SGLI), was launched from the Tanegashima Space Center at 10:26:22JST on December 23, 2017 and was named “SHIKISAI”, which means colorful. SGLI enables a new generation of operational moderate resolution-imaging capabilities following the legacy of the Global Imager (GLI) on Advanced Earth Observing Satellite-II (ADEOS-II). The SGLI empowers surface and atmospheric measurements related to the carbon cycle and radiation budget, with two radiometers of Visible and Near Infrared Radiometer (SGLI-VNR) [2,3] and Infrared Scanning Radiometer (SGLI-IRS) [4,5], which perform a wide-band (380 nm–12 μm) optical observation not only with as wide as a 1150–1400 km field of view (FOV), but also with as high as 250–500 m resolution. Additionally, polarization and along-track slant view observation are quite characteristic of SGLI, providing the sensor data records for more than 28 standard products and 23 research products including clouds, aerosols, ocean color, vegetation, snow and ice, and other applications. The proto-flight testing of the SGLI was completed and instrument radiometric, geometric, and spectral performances of SGLI have been well characterized [6,7]. After the launch, the satellite and SGLI instruments were initialized and commissioned for routine operations and solar and light-emitting diode (LED) calibrations are conducted once every eight days and trending data have been continuously monitored. In addition, solar beta angle correction maneuvers were performed on January 4, 2018 (within L+2 weeks) and February 8, 2019 (after L+1 year) and lunar calibration maneuvers were performed each synodic period from January 31, 2018. All of the SGLI sub-systems are operating properly and high-quality products are continuously acquired [8,9].
Onboard radiometric calibration for remote sensing instruments is of great importance to assure the validity of science data products continuously derived from radiometer outputs. Solar diffuser calibration is a traditional method that uses a natural source (the Sun), and many sensor instruments such as Sea-viewing Wide Field-of-view Sensor (SeaWiFS) [10], MEdium Resolution Imaging Spectrometer (MERIS) [11], Multi-angle Imaging SpectroRadiometer (MISR) [12], and MODerate resolution Imaging Spectroradiometer (MODIS) [13] have a diffuser panel that reflects the Sun’s irradiance. Lamp calibration is another traditional method that uses an artificial source, and sensor instruments such as Système Pour l’Observation de la Terre High Resolution Visible (SPOT HRV) [14] and Landsat TM [15] use a standard lamp and diffuser or integrating sphere. In addition, lunar calibration was developed by the NASA Ocean Biology Processing Group Calibration and Validation Team (OBPG CVT) and the NASA MODIS Characterization Support Team (MCST) to perform lunar calibration for SeaWiFS and MODIS [16,17,18]. SGLI-VNR accommodates on-board calibration modules for solar and LED calibration, and the attitude and orbit control subsystem of GCOM-C satellite was also designed to provide lunar calibration maneuver. It is very significant to provide highly accurate and consistent results with these independent calibration sources. The purpose of this paper is therefore to clarify the radiometric model and inter-comparison results of these three independent calibration methods of SGLI-VNR, whose specification and outer appearance are as shown in Figure 1.
Section 2, Section 3 and Section 4 provide the radiometric model and first year trend evaluations of each calibration method such as solar, LED, and lunar calibration, respectively. We focus on the inter-comparison of these calibration results on the SGLI-VNR Nadir telescope in Section 5. Finally, our conclusions and future work are stated in Section 6.

2. Solar Calibration

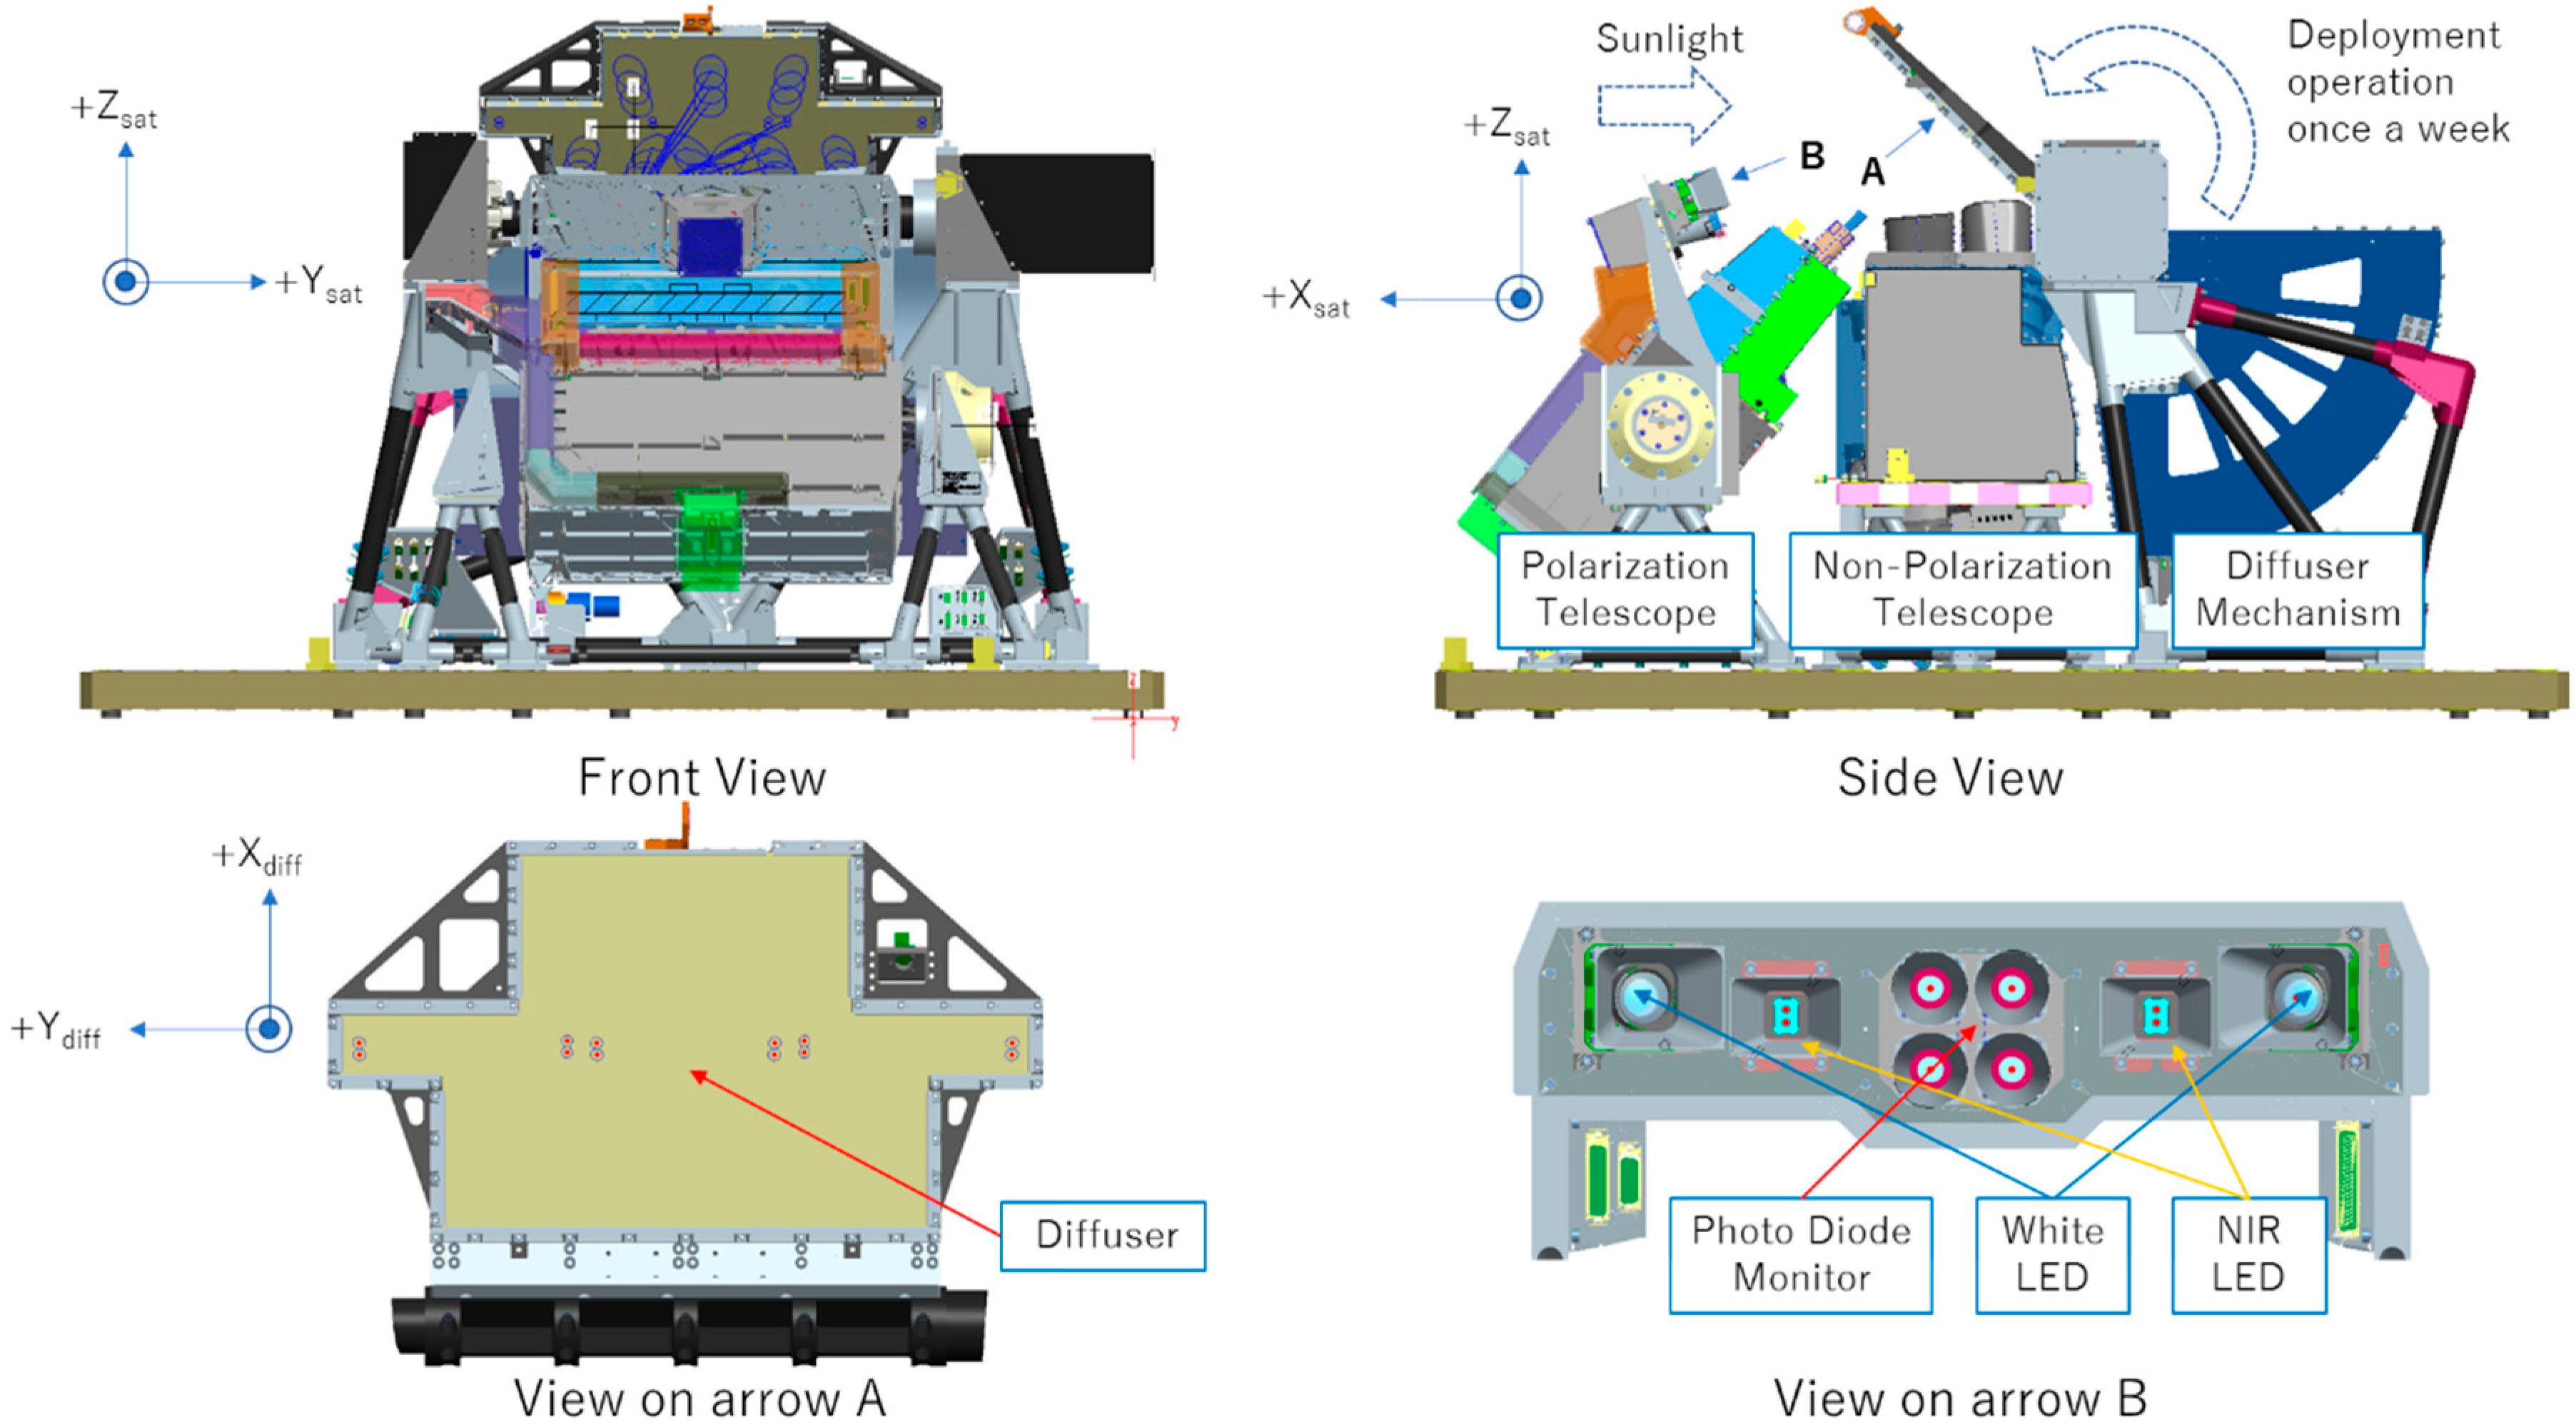
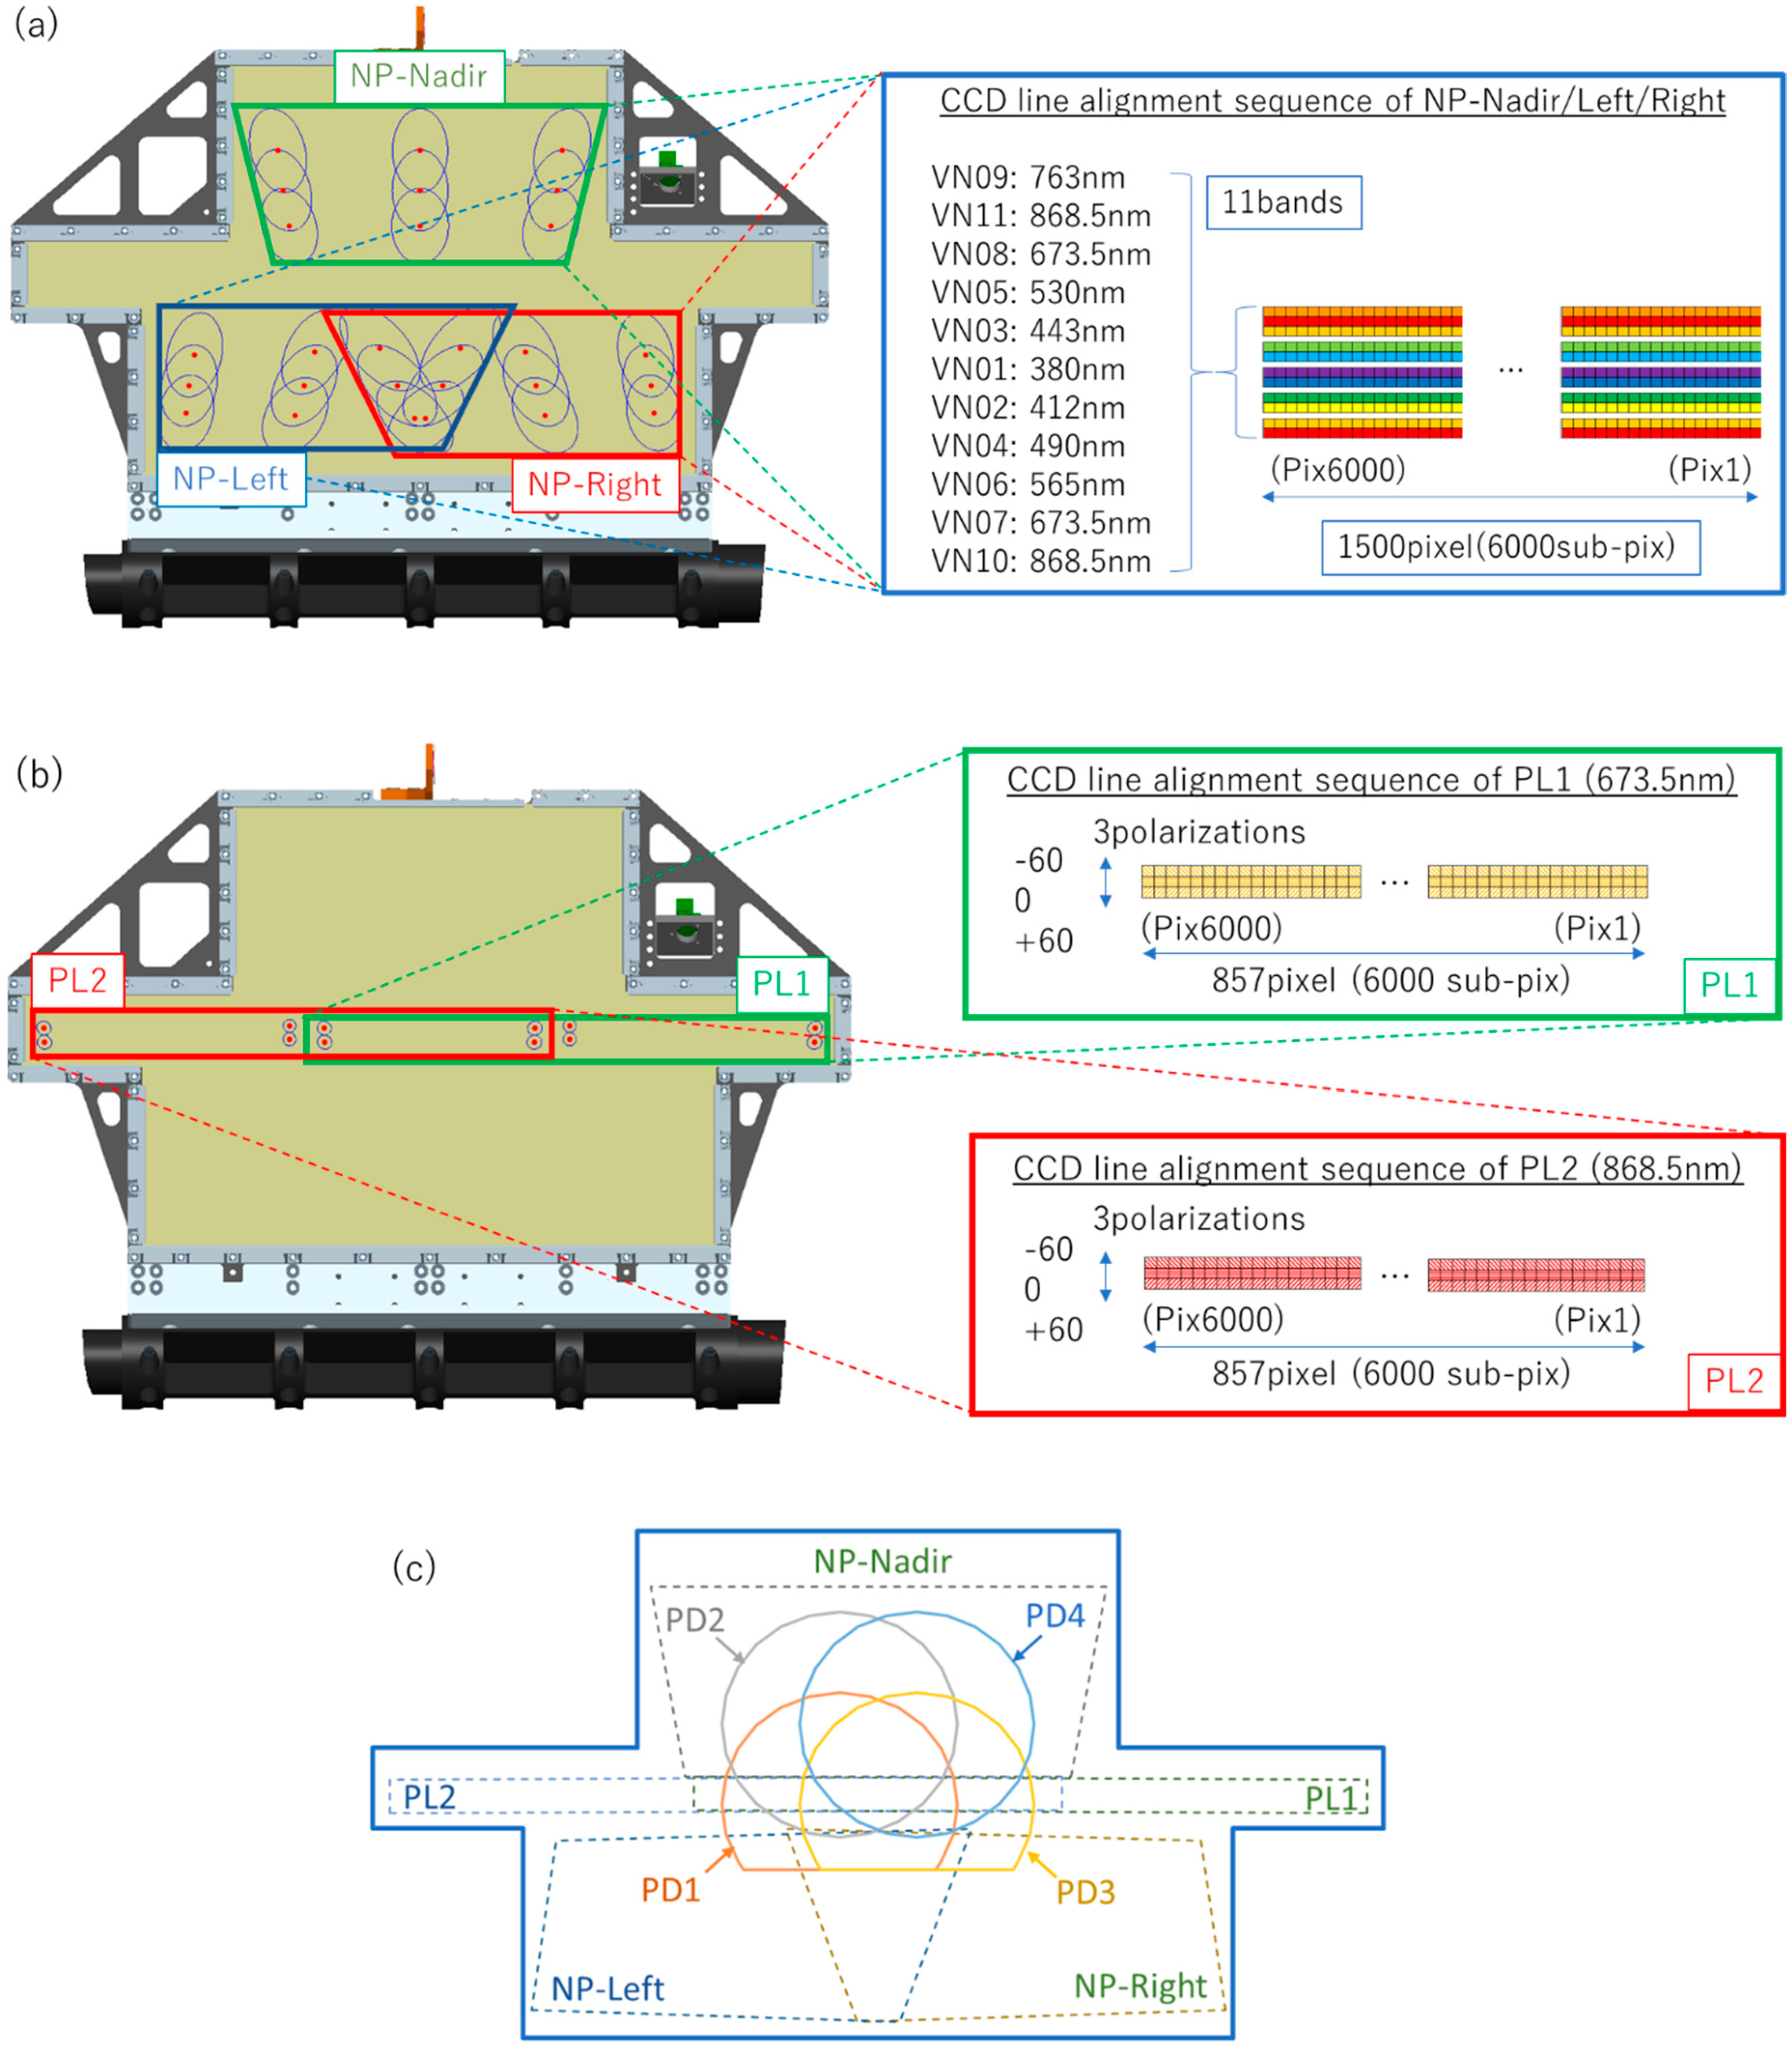
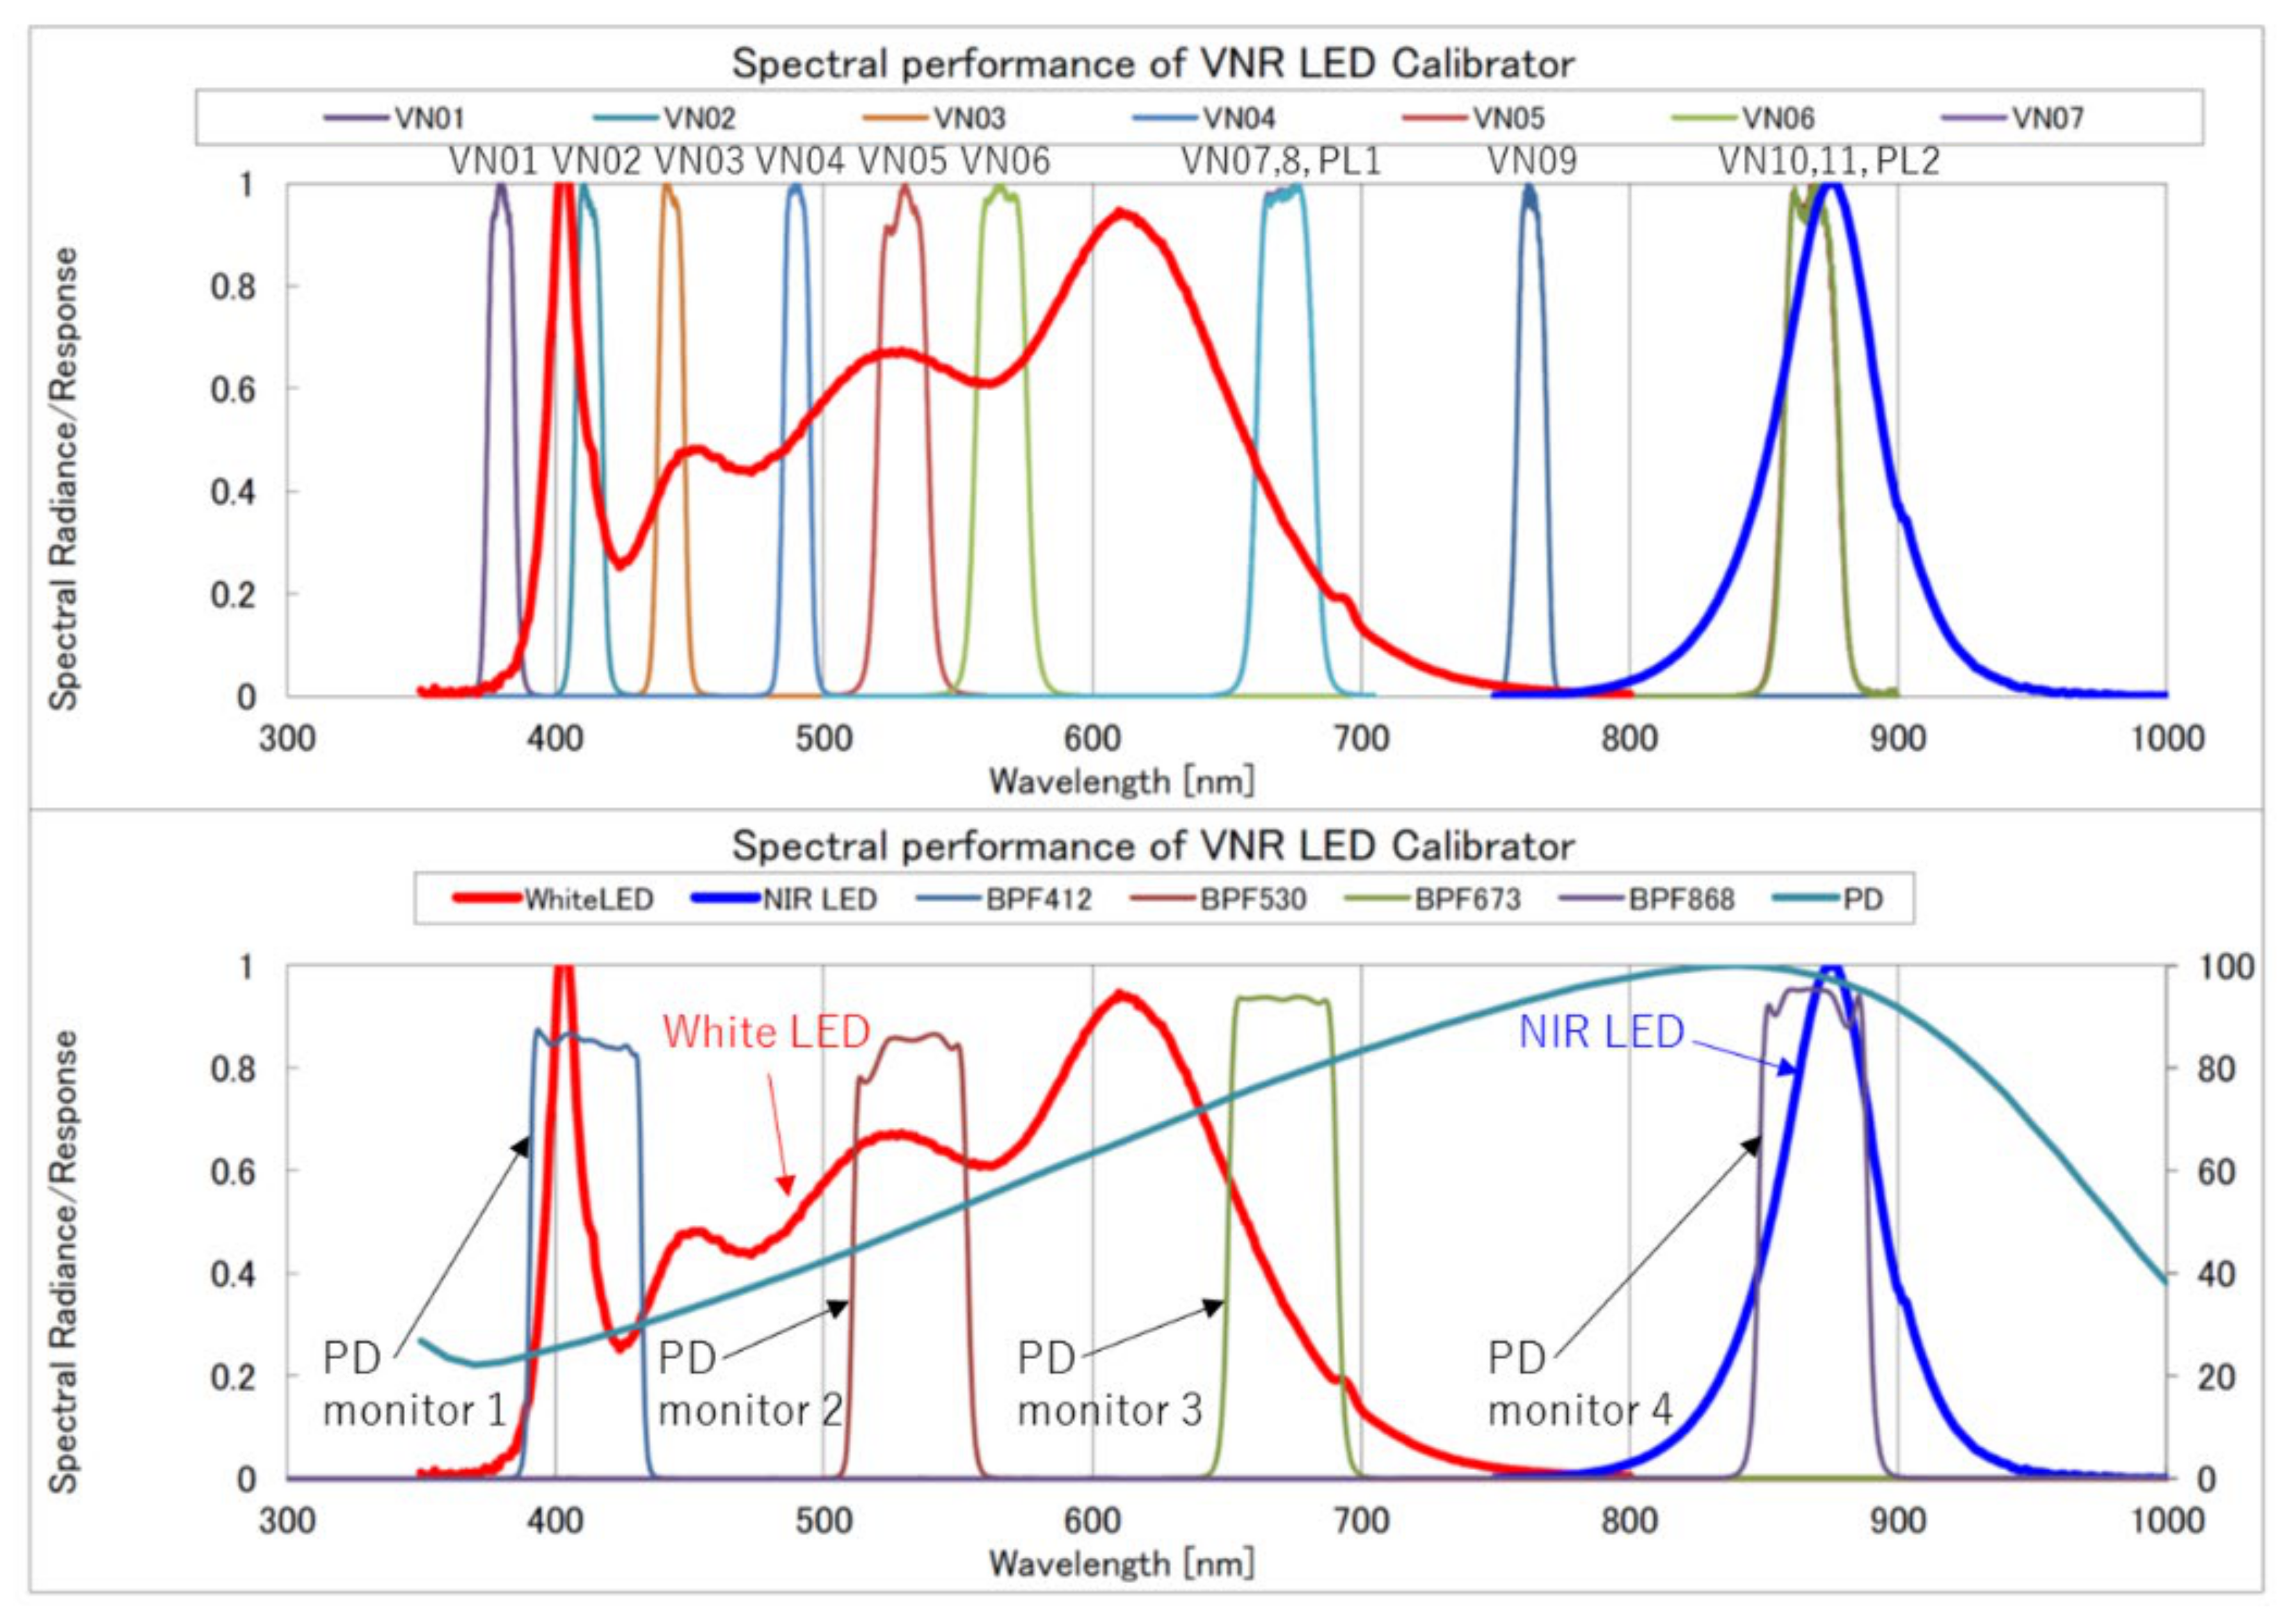
SGLI-VNR is equipped with a deployable diffuser to illuminate the uniformly scattered sunlight to charge-coupled device (CCD) elements for the solar calibration (Figure 2). The solar diffuser plate is made of Spectralon® and is normally shielded from direct solar illumination and atomic oxygen by storing inside the SGLI-VNR structure. The diffuser plate is only deployed for about 30 min a week. The long-term change of the CCD response to diffused sunlight may arise from the degradation of either the sensitivity of the telescopes or the bidirectional reflectance distribution function (BRDF) of the diffuser. Therefore, the stability photo diode monitor (PD), as an independent calibrator, was used to monitor the solar diffuser reflectance. The field of view of each telescope and the PD were covered with a diffuser plate (Figure 3). The wavelength characteristics of the telescope and the PD are shown in Figure 4. Since multilayer insulation (MLI) stray light and the diffuser plate degradation with a varying in-plane distribution caused by ultraviolet (UV) irradiation to the stored diffuser plate were confirmed during the initial check-out [8], it was necessary to take these matters into consideration.

2.1. Radiometric Model

The basic formula of the radiometric model of the solar calibration of telescopes and PDs are expressed as follows.

2.1.1. Telescope

Digital number (DN) values at each pixel obtained by the solar calibration are shown as follows:
D N s u n = L D G · Δ G s h u t t e r + D N d a r k s u n ,
  • D N s u n : Digital number of CCD response during solar calibration
  • L D : Measured radiance reflected by the diffuser
  • G : Gain of telescope
  • Δ G s h u t t e r : Electrical shutter correction coefficient
  • D N d a r k s u n : Average of digital number during dark (in earth shade) observation for solar calibration
where L D is shown as follows:
L D = L s u n · 1 D 2 · f β · R ,
  • L s u n : Solar radiance at the average distance of the Earth and Solar
  • D : Earth-Solar distance
  • f β : β angle correction coefficient
  • R : Diffuser plate reflectance
Therefore, the gain G can be shown as
G = L s u n · 1 D 2 · f β · R · Δ G s h u t t e r · 1 DN s u n DN d a r k s u n ,
The gain G is computed by multiplying G 0 : initial telescope gain, by G t e m p : CCD temperature correction coefficient, and by G p e r i o d : aging correction coefficient, so that it is shown as follows,
G = G 0 · G t e m p · G p e r i o d ,
Similarly, diffuser plate reflectance R is computed by multiplying R 0 : initial value of reflectance by G p e r i o d d i f : degradation coefficient of reflectance, so that it is expressed as follows,
R = R 0 · G p e r i o d d i f ,
Here, L s u n is supposed to be constant and G 0 was characterized as quadratic equations between radiance and CCD response for each sub-pixel using an integrating sphere that is traceable to National Standards before launch [19]. G t e m p is obtained at both the ground thermal vacuum test and the on-orbit initial checkout by changing the CCD temperature, and were 0.05%/degree for the VN9 band and 0.25%/degree for the VN10 and VN11 bands. The changes in the quantum efficiency of the CCD of the VN1–8 bands were negligibly small. For Δ G s h u t t e r , the electrical shutter parameters for several bands (VN5, 6, 8, 9, 11) were changed on orbit in order to avoid a saturation of CCD response during solar diffuser observations. The f β is derived by solar beta angle correction yaw maneuvers, which were conducted at β =   12, 16.75, 21.5, 26,25, 31 degree in five consecutive orbits. The ratio of these known factors is expressed as follows, which shows the ratio of aging of the telescope gain and degradation of the diffuser plate reflectance.
G p e r i o d , 0 · G p e r i o d d i f , t G p e r i o d , t · G p e r i o d d i f , 0 = D t 2 · f β 0 · Δ G s h u t t e r , 0 · G t e m p , t · G 0 · D N s u n D N d a r k s u n t D 0 2 · f β t · Δ G s h u t t e r , t · G t e m p , 0 · G 0 · D N s u n D N d a r k s u n 0 ,

2.1.2. Photo Diode Monitor (PD)

Light intensity monitor output during solar calibration D N s u n p d is expressed as follows,
D N s u n p d = L D G p d + D N d a r k s u n p d ,
  • D N s u n p d : Digital number of PD response during solar calibration
  • G p d : Gain of PD
  • DN d a r k s u n p d : Average of output during dark (in earth shade) observation for solar calibration
where the definition of the L D is the same as Equation (2), therefore, the gain G p d is expressed as
G p d = L s u n · 1 D 2 · f β · R · 1 D N s u n p d DN d a r k s u n p d ,
The gain of the PD is computed the same as that of the CCD and it is also expressed as follows:
G p d = G 0 p d · G t e m p p d · G p e r i o d p d ,
As is the case with the telescope (Section 2.1.1), the ratio of these known factors is expressed as follows, and it shows the aging of the PD gain and degradation of the diffuser plate reflectance.
G p e r i o d , 0 p d · G p e r i o d d i f , t G p e r i o d , t p d · G p e r i o d d i f , 0 = D t 2 · f β 0 · G 0 p d · G t e m p , t p d · D N s u n p d DN d a r k s u n p d t D 0 2 · f β t · G 0 p d · G t e m p , 0 p d · D N s u n p d DN d a r k s u n p d 0 ,

2.2. First Year Trend

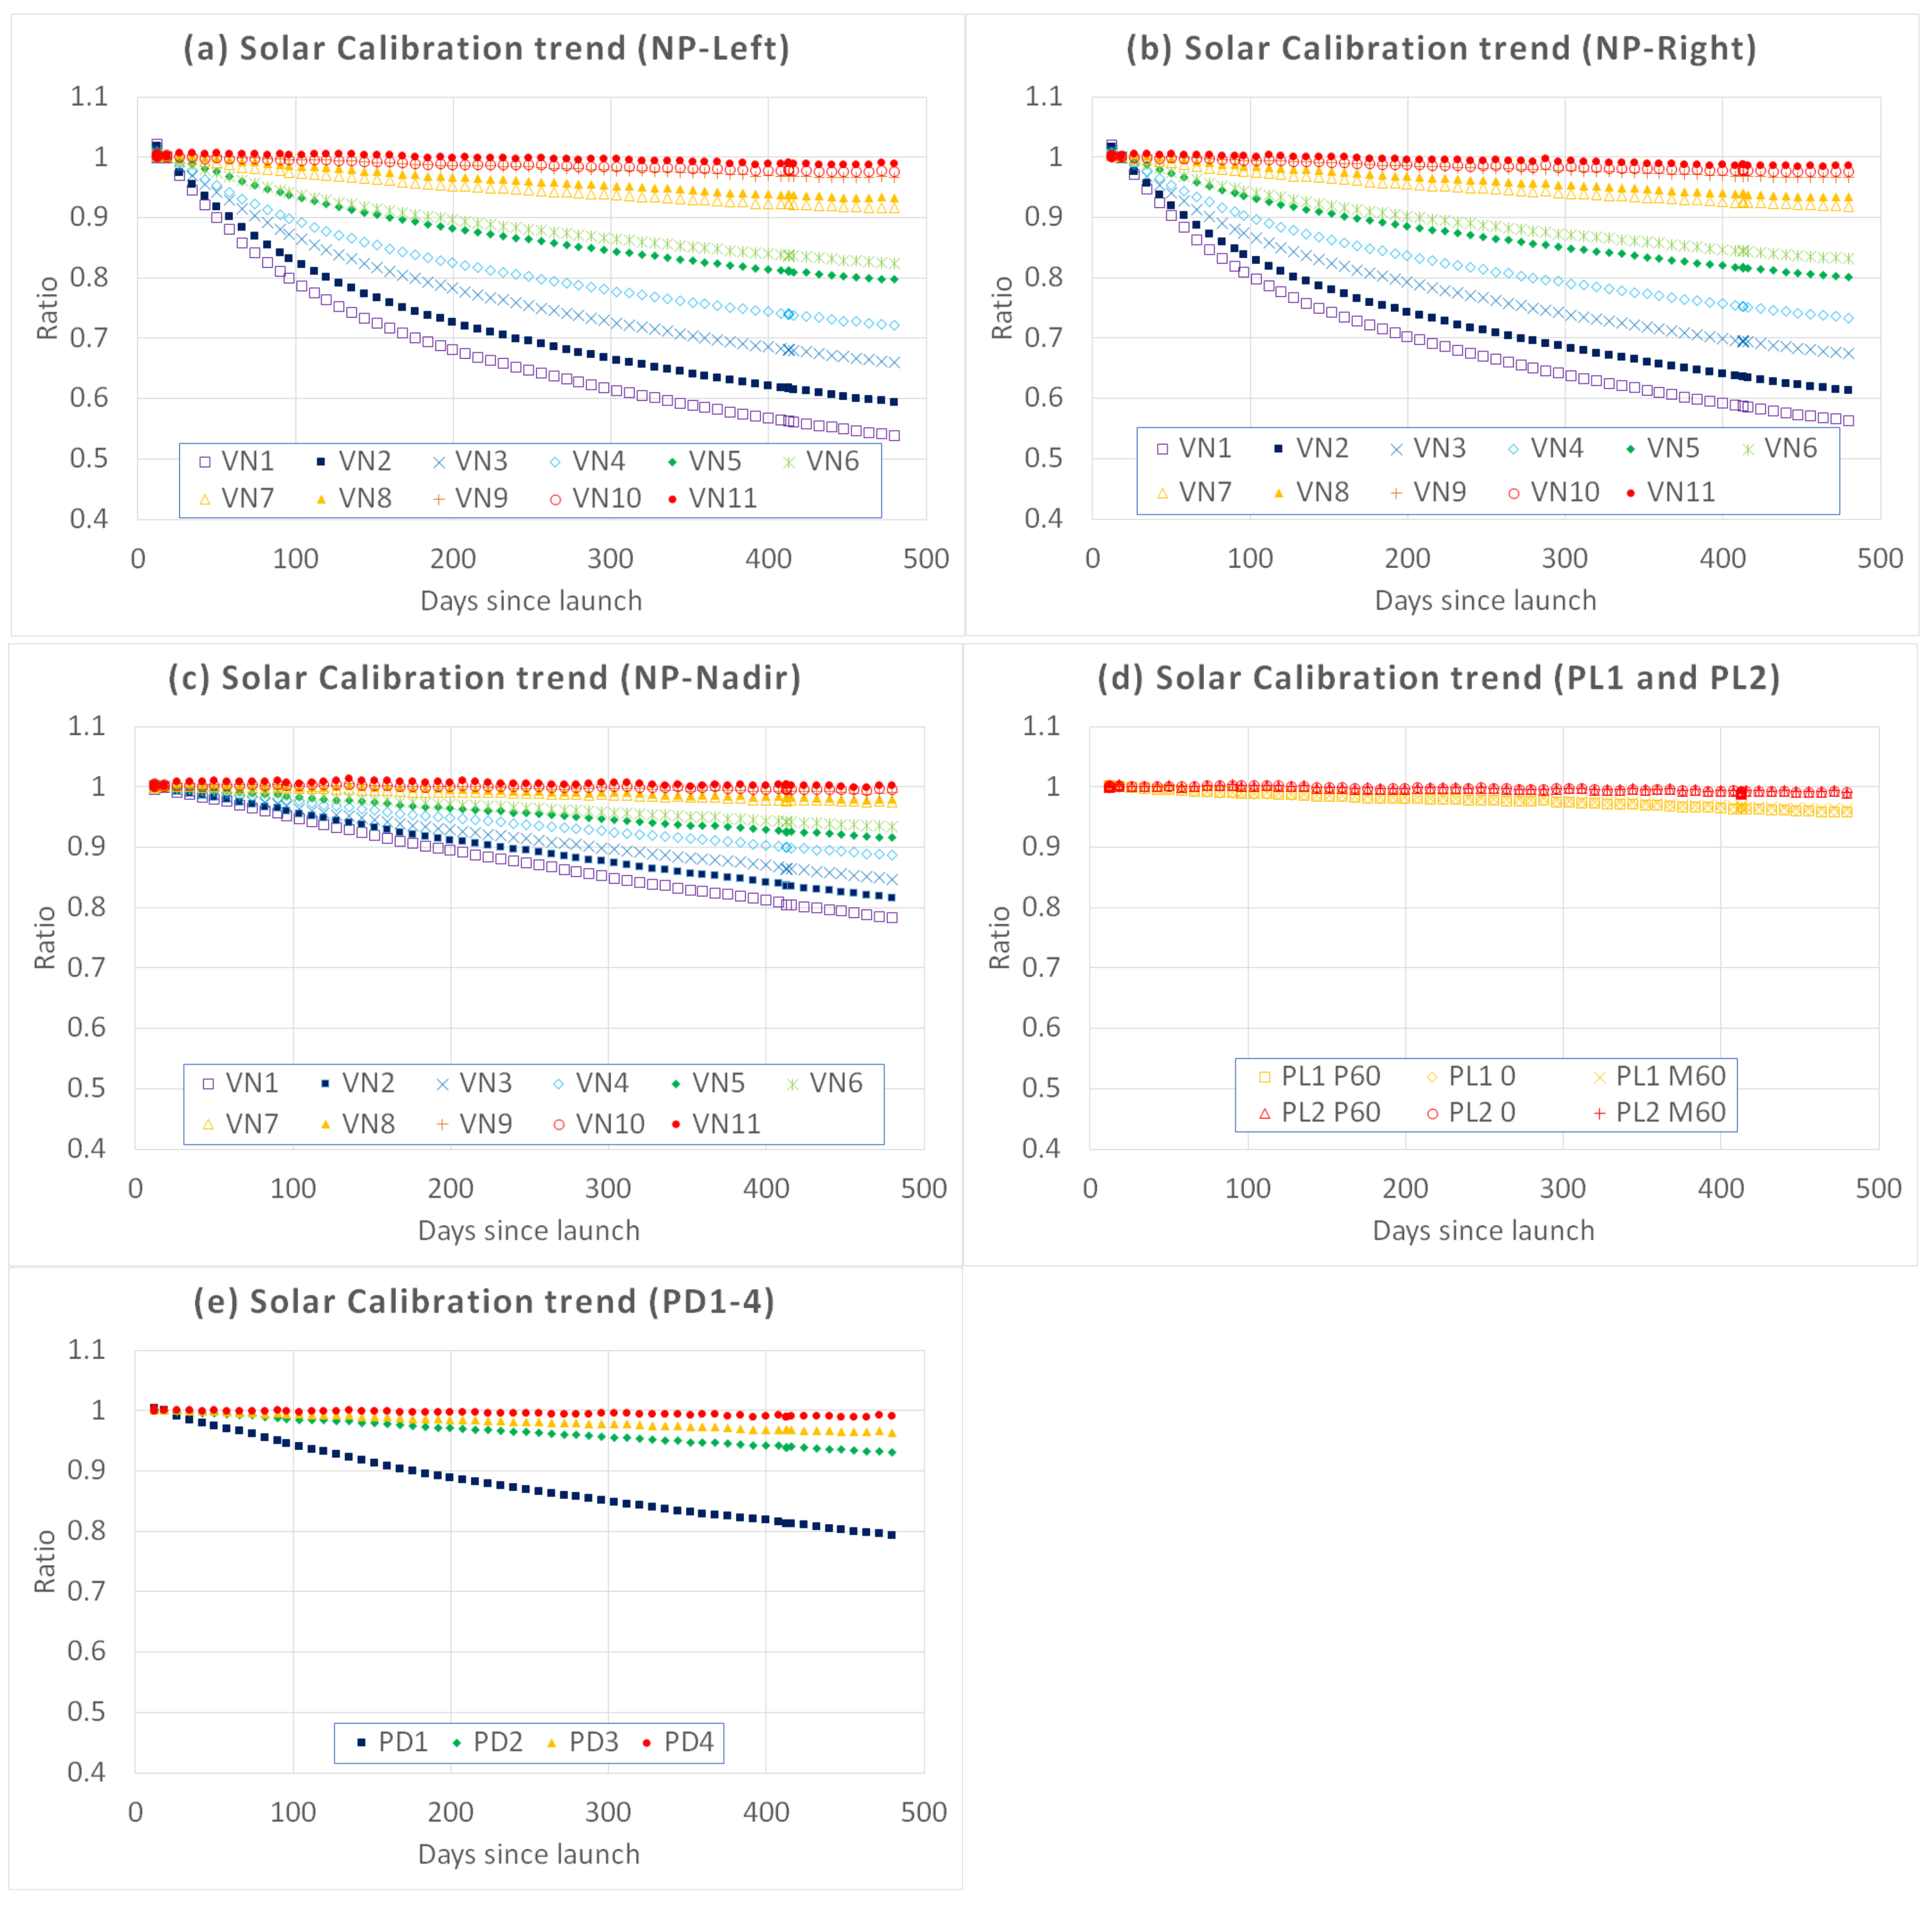
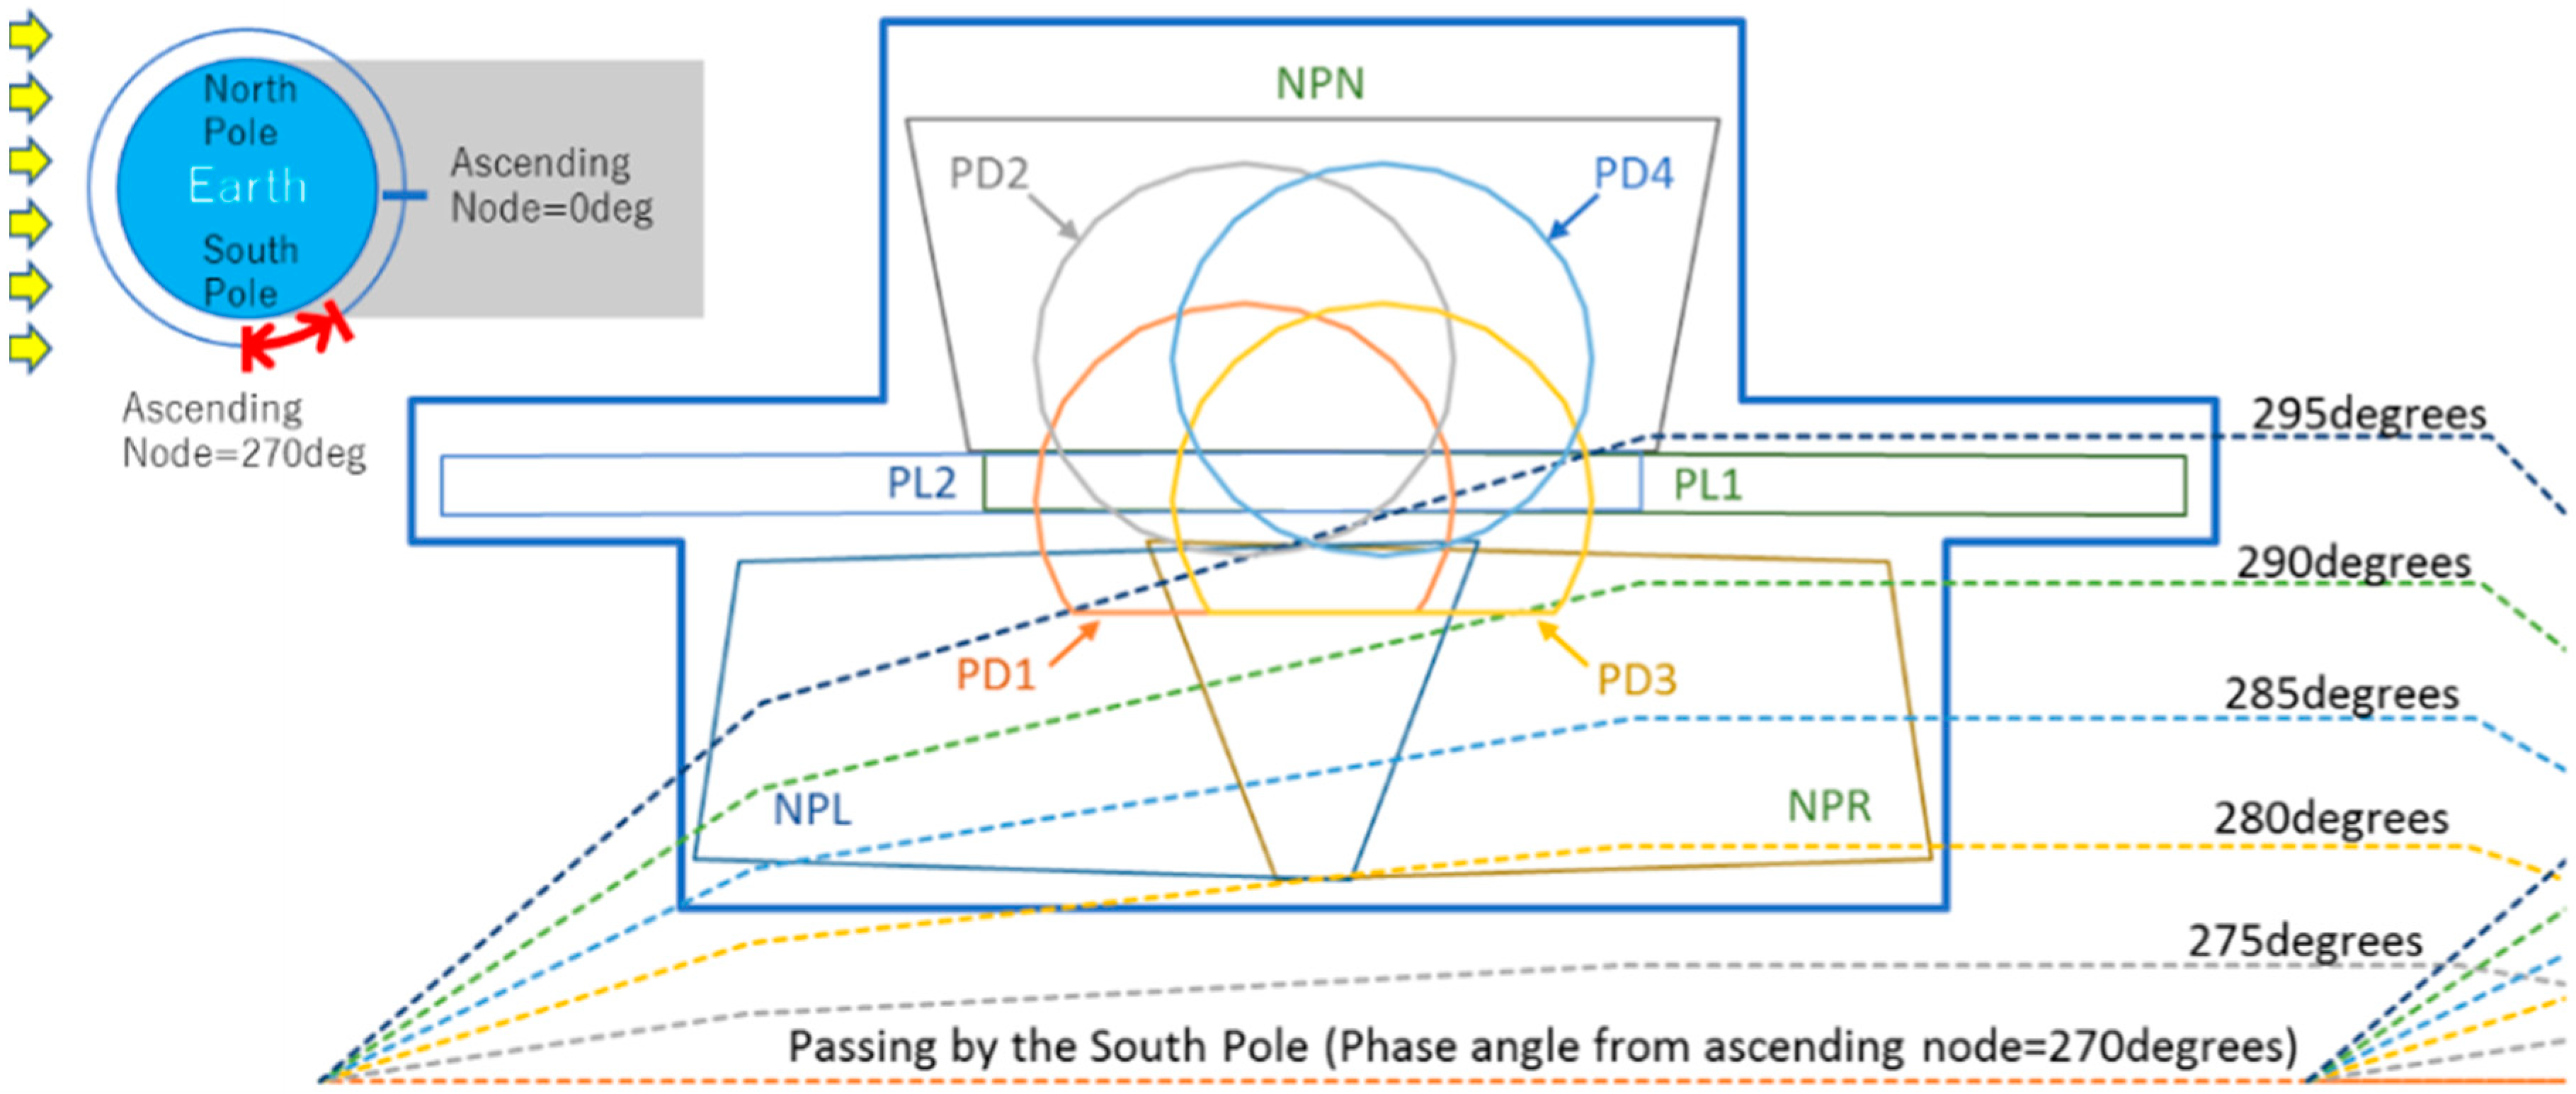
Solar diffuser calibration trends of the telescopes and the PDs agreed with the past cases of diffuser reflectance degradation in space [20] or in UV radiation tests on the ground [21]. First, to minimize the stray light reflected from the structure covered by MLI [8], these ranges of effective CCD pixels and zenith angles at the diffuser coordinate system were limited, as shown in Table 1. Since the pixels affected by the stray light change with the variation of the β angle, the pixels which are not affected by the stray light through a year are very limited. Next, the beta angle correction approximated curve, which was acquired by two solar yaw maneuvers, are shown in Figure 5. It is well known that the specular reflection component is larger than the diffuse reflection component, even if it is the reflection by the diffuser plate. Therefore, the tendency that the reflection intensity decreases as the solar beta angle increases is reasonable. In the second solar calibration maneuver, compared to the first one, the ratio of diffused light intensity at large solar beta angles tended to be small. This suggests that the bi-directional reflectance distribution function (BRDF) of the diffuser plate was slightly degraded. Generally speaking, UV degradation of the diffuser occurs fast at the beginning and the degradation rate gradually decreases, so that the second beta angle correction coefficient is better suited to represent the first-year trend. As a result, the first-year trends were obtained as shown in Figure 6. The ratio’s change of each telescope and PD over the years were very smooth and the beta angle correction worked well as seen at 412 days since launch when the second solar calibration maneuver was conducted. Detectors operated at shorter wavelengths showed larger degradation on each telescope and PD. In addition, telescopes calibrated at longer solar-exposed areas of the diffuser (Figure 7) showed larger degradation in the order of NP-Right ≈ NP-Left > NP-Nadir in descending order, as shown in Figure 6. Therefore, the solar diffuser calibration trends of the telescopes and the PDs agree with the general diffuser reflectance degradation caused by UV irradiation.

3. Light-emitting diode (LED) Calibration

Internal light calibration is the second method for monitoring the on-orbit radiometric performance of reflective solar bands. SGLI-VNR observes LED light reflected by the diffuser panel once in eight days as the spacecraft passes the Earth’s shadow and the light sources are used directly or through optical systems in the same manner as the solar diffuser calibration.

3.1. Radiometric Model

The basic formula of the radiometric model of the LED calibration of telescopes and PDs are expressed as follows.

3.1.1. Telescope

DN values at each pixel obtained by the LED calibration are shown as follows:
D N L E D = L D G · Δ G s h u t t e r + D N d a r k l e d ,
  • DNLED: Integrated digital number of LED calibration
  • DN(dark)led: Average of digital number during dark (in earth shade) observation for LED calibration
where the definition of LD, G, ΔGshuter is the same as Equation (1) and LD is shown as follows,
L D = L L E D · f T L E D · R ,
  • L L E D : LED radiance
  • f T L E D : LED temperature correction coefficient
Therefore, gain G can be shown as follows,
G = L L E D · f T L E D · R · Δ G s h u t t e r · 1 DN L E D DN d a r k l e d ,
Here, the gain G and diffuser plate reflectance R are the same as those of the solar calibration as shown in Equations (4) and (5) and Δ G s h u t t e r was fixed for LED calibration. The ratio of these known factors is expressed as follows, and it shows the aging of the telescope gain, degradation of LED irradiance, and degradation of the diffuser plate reflectance.
G p e r i o d , 0 · L L E D , t · G p e r i o d ( d i f ) , t G p e r i o d , t · L L E D , 0 · G p e r i o d ( d i f ) , 0 = ( T L E D ) 0 · G t e m p , t · G 0 · ( D L L E D D N d a r k ( l e d ) ) t f ( l e d ) t · G t e m p , 0 · G 0 · ( D L L E D D N d a r k ( l e d ) ) 0 ,

3.1.2. PD

Light intensity monitor output during LED calibration D N l e d p d is expressed as follows,
D N l e d p d = L D G p d + D N d a r k l e d p d ,
  • D N l e d p d : Digital number of PD response during LED calibration
  • D N d a r k l e d p d : Average of output during dark (in earth shade) observation for LED calibration
where the definition of the LD is the same as Equation (12), therefore, the gain Gpd is expressed as follows,
G p d = L L E D · f T L E D · R · 1 D N l e d p d D N d a r k l e d p d ,
Here, DN and LED temperature for f(TLED) correction are obtained by on-orbit data. The ratio of these known factors is expressed as follows, and it shows the aging of the PD gain and degradation of the diffuser plate reflectance.
G p e r i o d , 0 p d · L L E D , t · G p e r i o d ( d i f ) , t G p e r i o d , t p d · L L E D , 0 · G ( p e r i o d ( d i f ) , 0 = f ( T L E D ) 0 · G 0 p d · G t e m p , t p d · ( D N l e d p d D N d a r k ( l e d ) p d ) t f ( T L E D ) t · G 0 p d · G t e m p , 0 p d · ( D N l e d p d D N d a r k ( l e d ) p d ) 0

3.2. First Year Trend

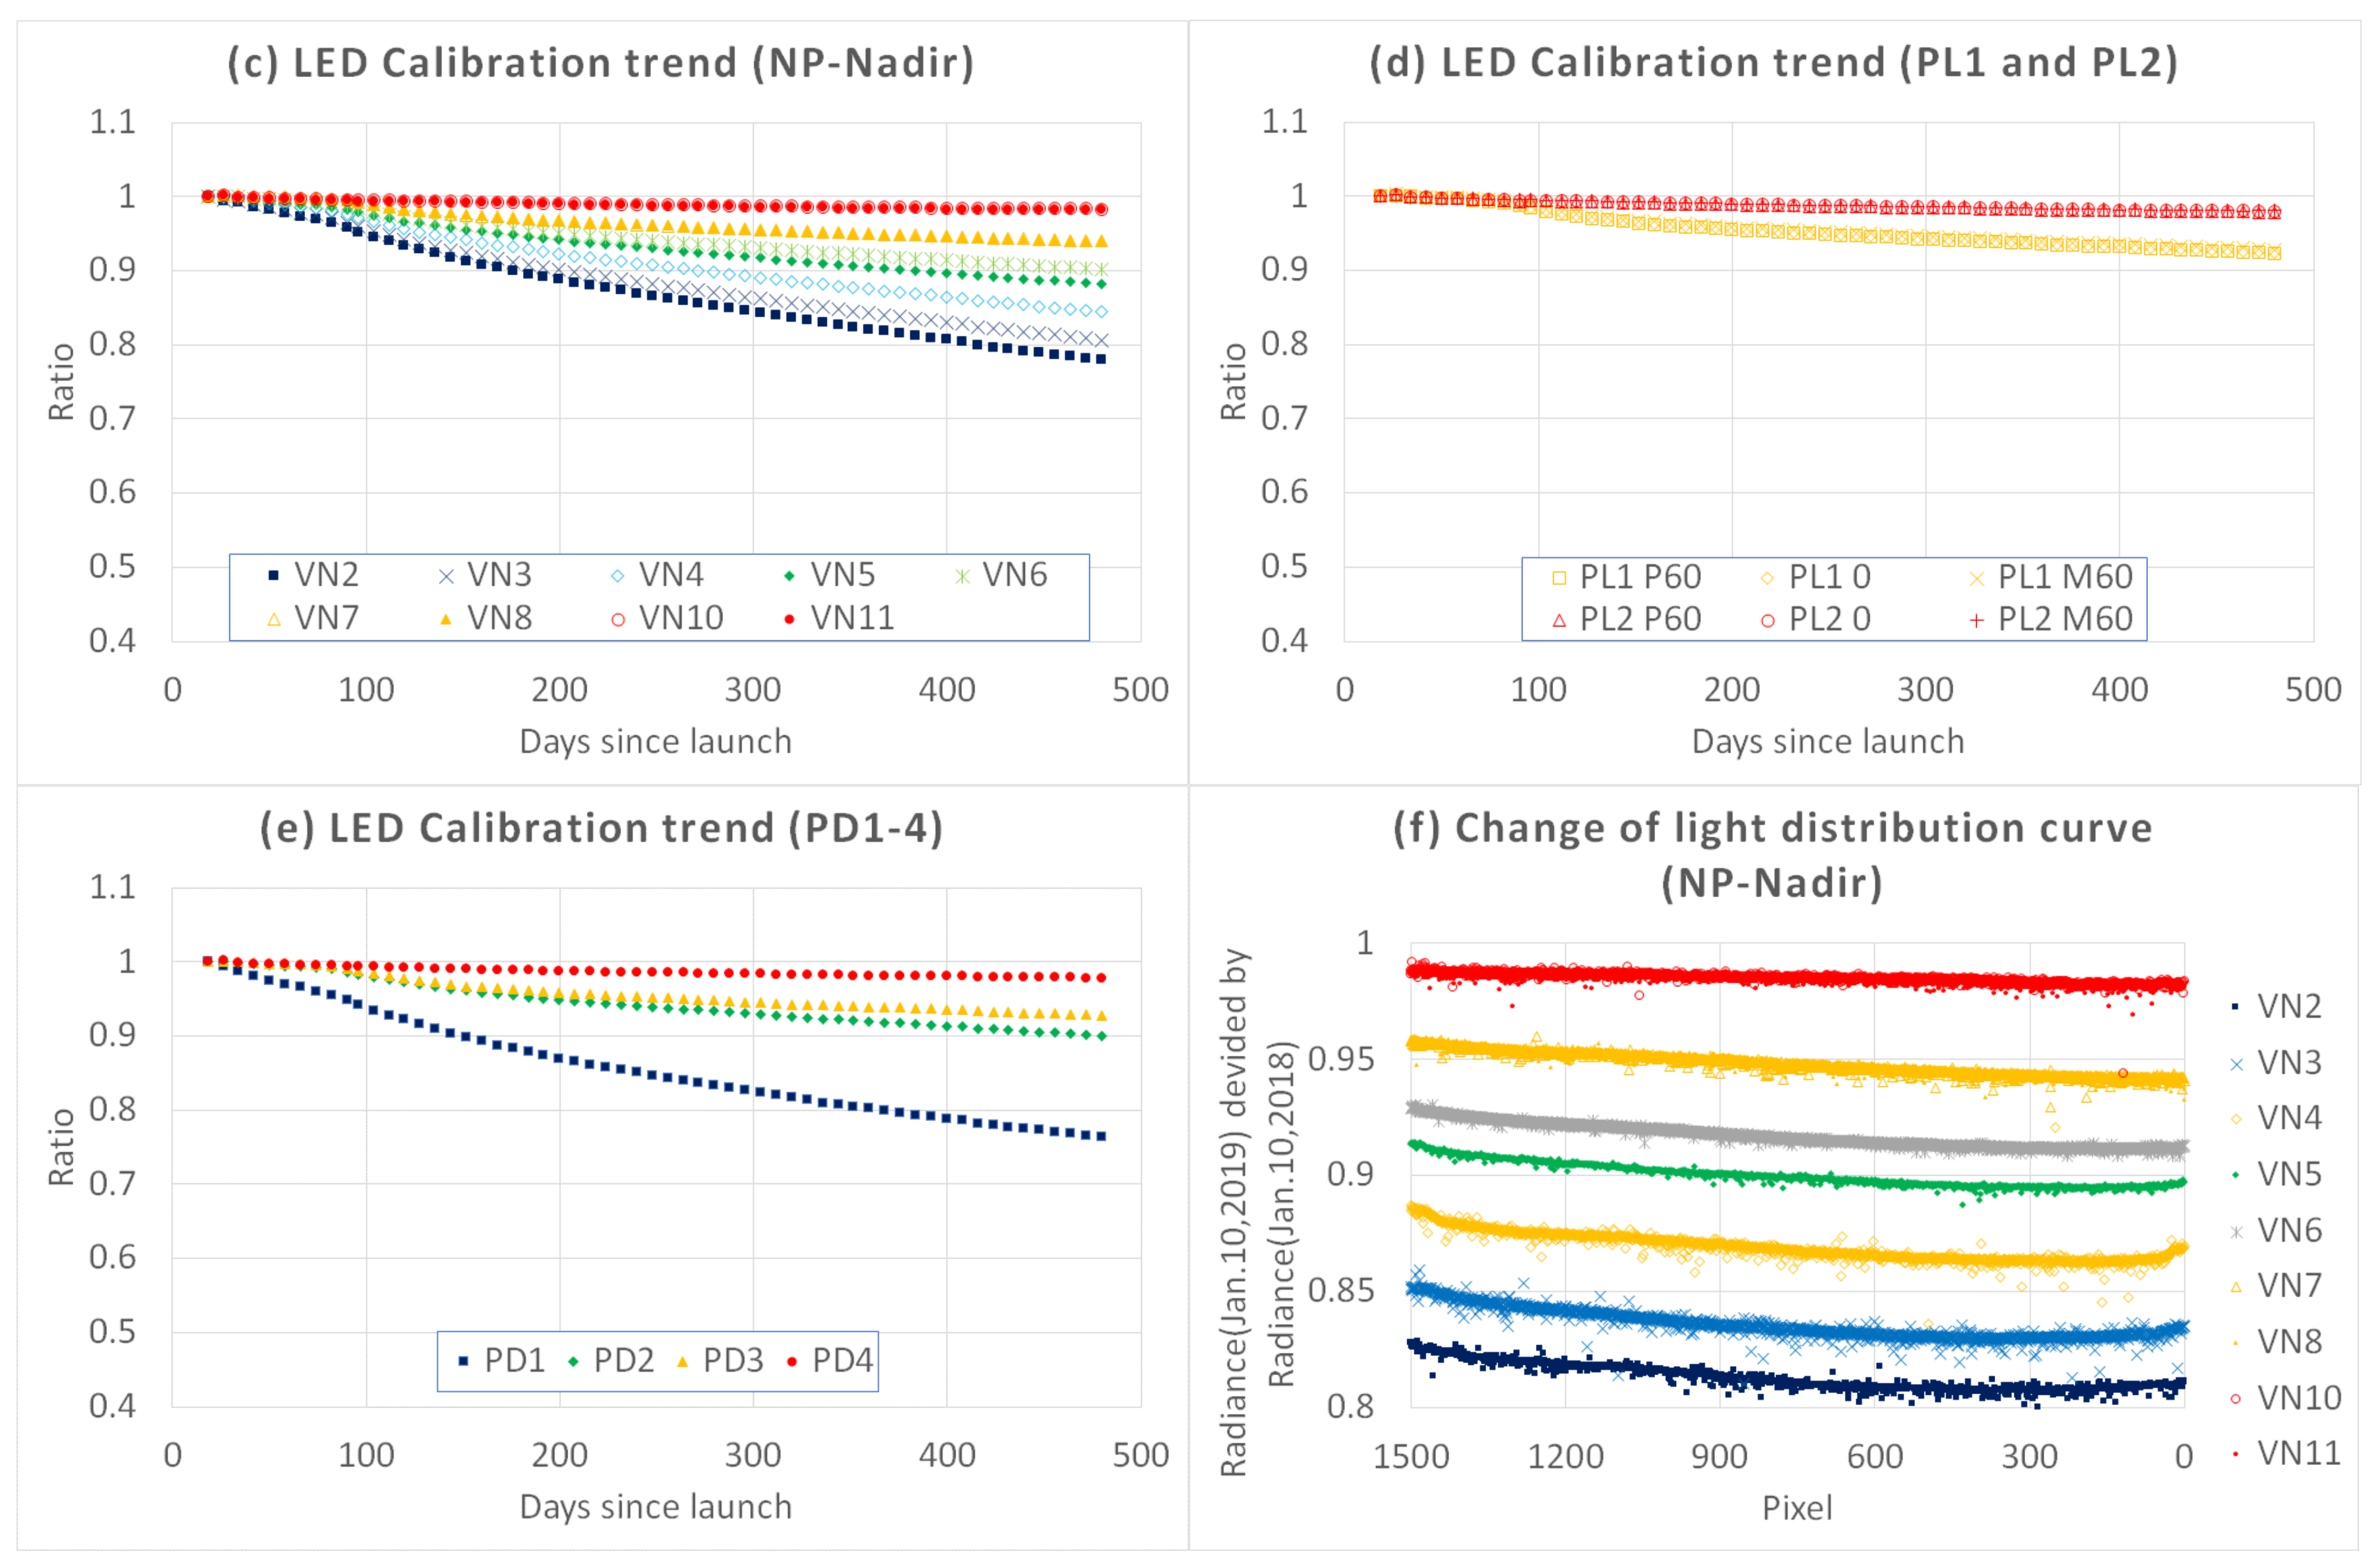
As is the case with solar calibration, the LED calibration trends of the telescopes and the PDs agreed with the degradation caused by UV irradiation as shown in Figure 8. Detectors operated at shorter wavelengths showed larger degradation on each telescope and PD and telescopes calibrated at longer solar-exposed areas of the diffuser (Figure 7) showed larger degradation, NP-Right ≈ NP-Left > NP-Nadir in descending order. Both telescopes and PDs showed inflection points around 100 days since launch, indicating that the intensity of the LEDs had degraded. Furthermore, the ratio of NP-Right degraded more than that of NP-Left (Figure 8a,b), which was possibly caused by the light distribution difference of the two LEDs. One of the LEDs illuminates the NP-Left side of the diffuser and the other one the NP-Right side of the diffuser, so the ratio of the NP-Nadir’s radiance distribution should be symmetric if the two LEDs keep the same light intensity. It can be seen that the ratio of the NP-Nadir’s radiance, as shown in Figure 8f, was not symmetrical, and it shows that the irradiance on the right LED degraded more than that on the left LED.

4. Lunar Calibration

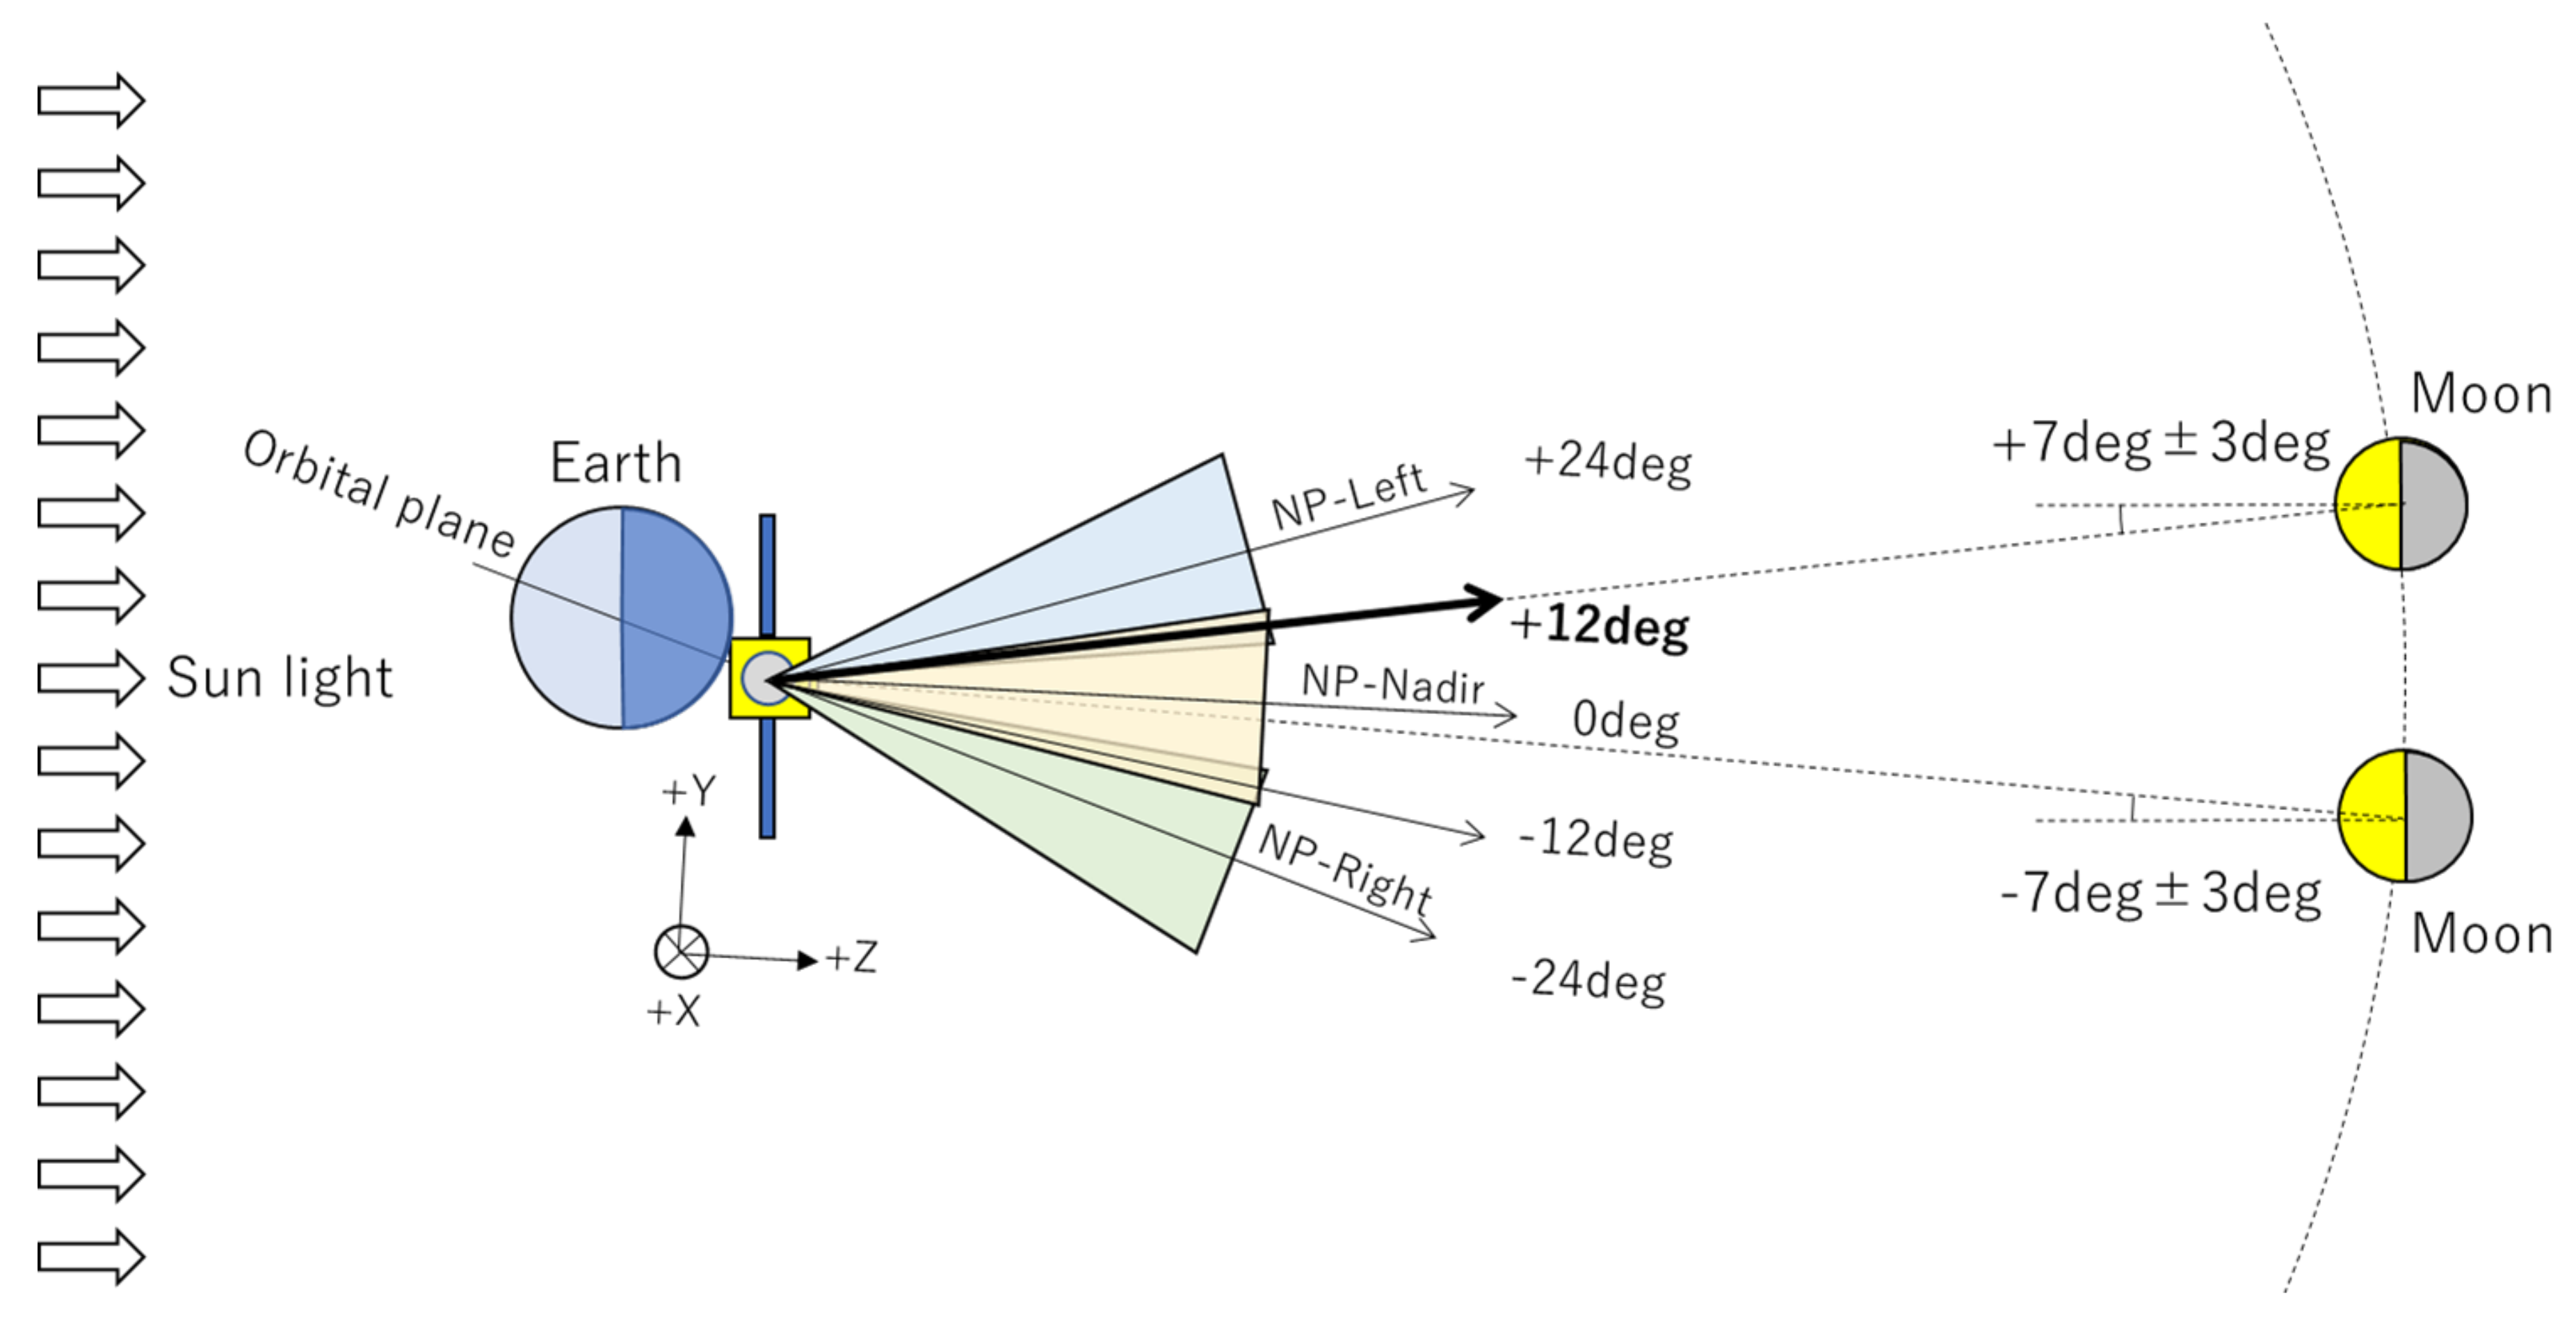
The lunar calibration is a complementary method for monitoring the radiometric response of the reflective solar bands on orbit. SGLI-VNR acquired its first lunar image with pitch maneuver on January 31, 2018 and since then, it has observed the Moon once a month at a target phase angle of +7 ± 3 degrees and −7 ± 3 degrees, as shown in Figure 9.

4.1. Radiometric Model

SGLI-VNR observes the Moon once a month through its nadir view, which requires a spacecraft pitch maneuver, so that the Moon is viewed in the same optical path. The pitch rate across the Moon is slower than the scanning rate across the Earth, resulting in an oversampled image of the Moon. Lunar data analysis methodologies of SGLI consists of four steps. First, the lunar radiance is obtained by the following equation:
L l u n a r = G · 1 Δ G s h u t t e r · D N l u n a r D N D a r k l u n a r ,
  • L l u n a r : Lunar radiance(k=ch1~11,p=pixel)
  • G : Gain(prelaunch measured)
  • Δ G s h u t t e r : Electrical shutter correction coefficient
  • D N l u n a r : Integrated digital number
  • D N D a r k l u n a r : Average of digital number of deep space observation data at each pixel
Second, the lunar irradiance is calculated by the following equation. During the pitch maneuvers, the pitch rate of the spacecraft is known by the inertial reference unit (IRU) and the oversampling factor can be obtained by comparing the IRU rate and the nominal rate of the Earth observation. sinθ in the equation gives the approximate correction term of scan rate decrease when the satellite scans the Moon with the offset angle from the nadir direction, where the vector of the line-of-sight rotates on a conical surface.
I = p = 1 N Ω p L p · 1 f o s · sin θ ,
  • I : Lunar irradiance
  • N : Total number of pixel
  • Ω p : Solid angle per pixel
  • f o s : Oversampling factor
  • θ : Angle between satellite-moon vector and satellite pitch axis
In the actual calculation process, the solid angle of each pixel is numerically calculated by the projection of line-of-sight vector on a two-dimensional (2D) angle plane (Along-track (AT)-Cross Track (CT) plane). The projected vector set of points forming a pixel, which is rigorously constructed by the optical distortion model, are moved over the 2D-plane as the satellite maneuvers along the pitch axis during the exposure time. The group of the points’ trajectory is numerically area-integrated over the plane to obtain the accurate solid angle during the exposure time. By doing this, one does not need to consider the oversampling factor or the term sinθ, which is one of the uncertain variables in a geometric sense. Third, we used the GIRO (GSICS (Global Space-based Inter-Calibration System) Implementation of the ROLO (RObotic Lunar Observatory) model) model to normalize the lunar calibration time series for variations in observing geometry: Spacecraft–Moon distances, Sun–Moon distances, phase and libration angles. GIRO [22] was developed by the European Organization for the Exploitation of Meteorological Satellites (EUMETSAT) in 2014 and provided access to the function of the ROLO [23] lunar calibration model for the international community. The basic processing function of the GIRO uses the observation time and the position of the satellite at the observation time to derive the reference lunar irradiance. The irradiance, which is stored in the output file, is used as the lunar irradiance of the GIRO model. Finally, the evaluated SGLI measured irradiance was compared to the GIRO irradiance shown as follows:
R a t i o = I M e a s u r e d / I G I R O   M o d e l ,

4.2. First Year Trend

A time series of the measured responses of the NP-Nadir and PL telescopes normalized to the GIRO model are shown in Figure 10. For the NP-Nadir telescope, about 1–2% degradation of the NP-Nadir telescope at short wavelengths (VN1–6) was clearly observed and a tiny degradation of the NP-Nadir telescope at long wavelengths (VN7–11) was observed. Although the trends had an obvious correlation to the phase angle, especially in the NIR band [24], phase angle dependence in the ROLO model has been observed at the NIR band with many instruments such as MODIS, SeaWiFS, and PLEIADES [17,25]. For the PL telescopes, the trends have a correlation to not only the phase angle, but also the satellite and sun selenographic latitude and longitude as is well known [26], and the trends of the PL1 and the PL2 changed around 200 days when the signs of the satellite selenographic latitude and longitude transit from negative and positive to the opposite sign, respectively.

5. Inter-Comparison of Solar, LED, and Lunar Calibration

By properly narrowing the target telescope and bands to the VN5, 10, and 11 bands of the NP-Nadir telescope, three independent calibration methods such as solar, LED, and lunar calibration can be compared with each other. In the solar and LED calibration, the NP-Left and NP-Right telescopes, PD1 and PD3 need further analysis to isolate the degradation of the telescope and PD sensitivity from that of the diffuser’s reflectance under the condition of the diffuser’s in-plane difference distribution caused by UV irradiation. In the lunar calibration, monthly calibration is possible only for the NP-Nadir telescope. Therefore, inter-comparison of the VN5, 10, and 11 bands of the NP-Nadir telescope is discussed here. Although there was diffuser plate degradation with in-plane difference distribution caused by UV irradiation to the stored diffuser plate, calibration areas of the NP-Nadir, PD2 and PD4 on the diffuser plate were less affected by UV degradation than other areas, as shown in Figure 7. In addition, UV exposure condition to these areas was exactly the same, so the PD2 and PD4, as an independent calibrator, must correct the solar diffuser reflectance degradation for the NP-Nadir telescope. The degradation of the NP-Nadir telescope caused by the degradation of either the sensitivity of the telescope or the reflectance of the diffuser can be separated, and only the sensitivity of the telescope is derived from the solar calibration and LED calibration, shown as follows,
E q u a t i o n 6 E q u a t i o n 10 = E q u a t i o n 14 E q u a t i o n 17 = G p e r i o d , 0 G p e r i o d , t · G p e r i o d , t p d G p e r i o d , 0 p d ,
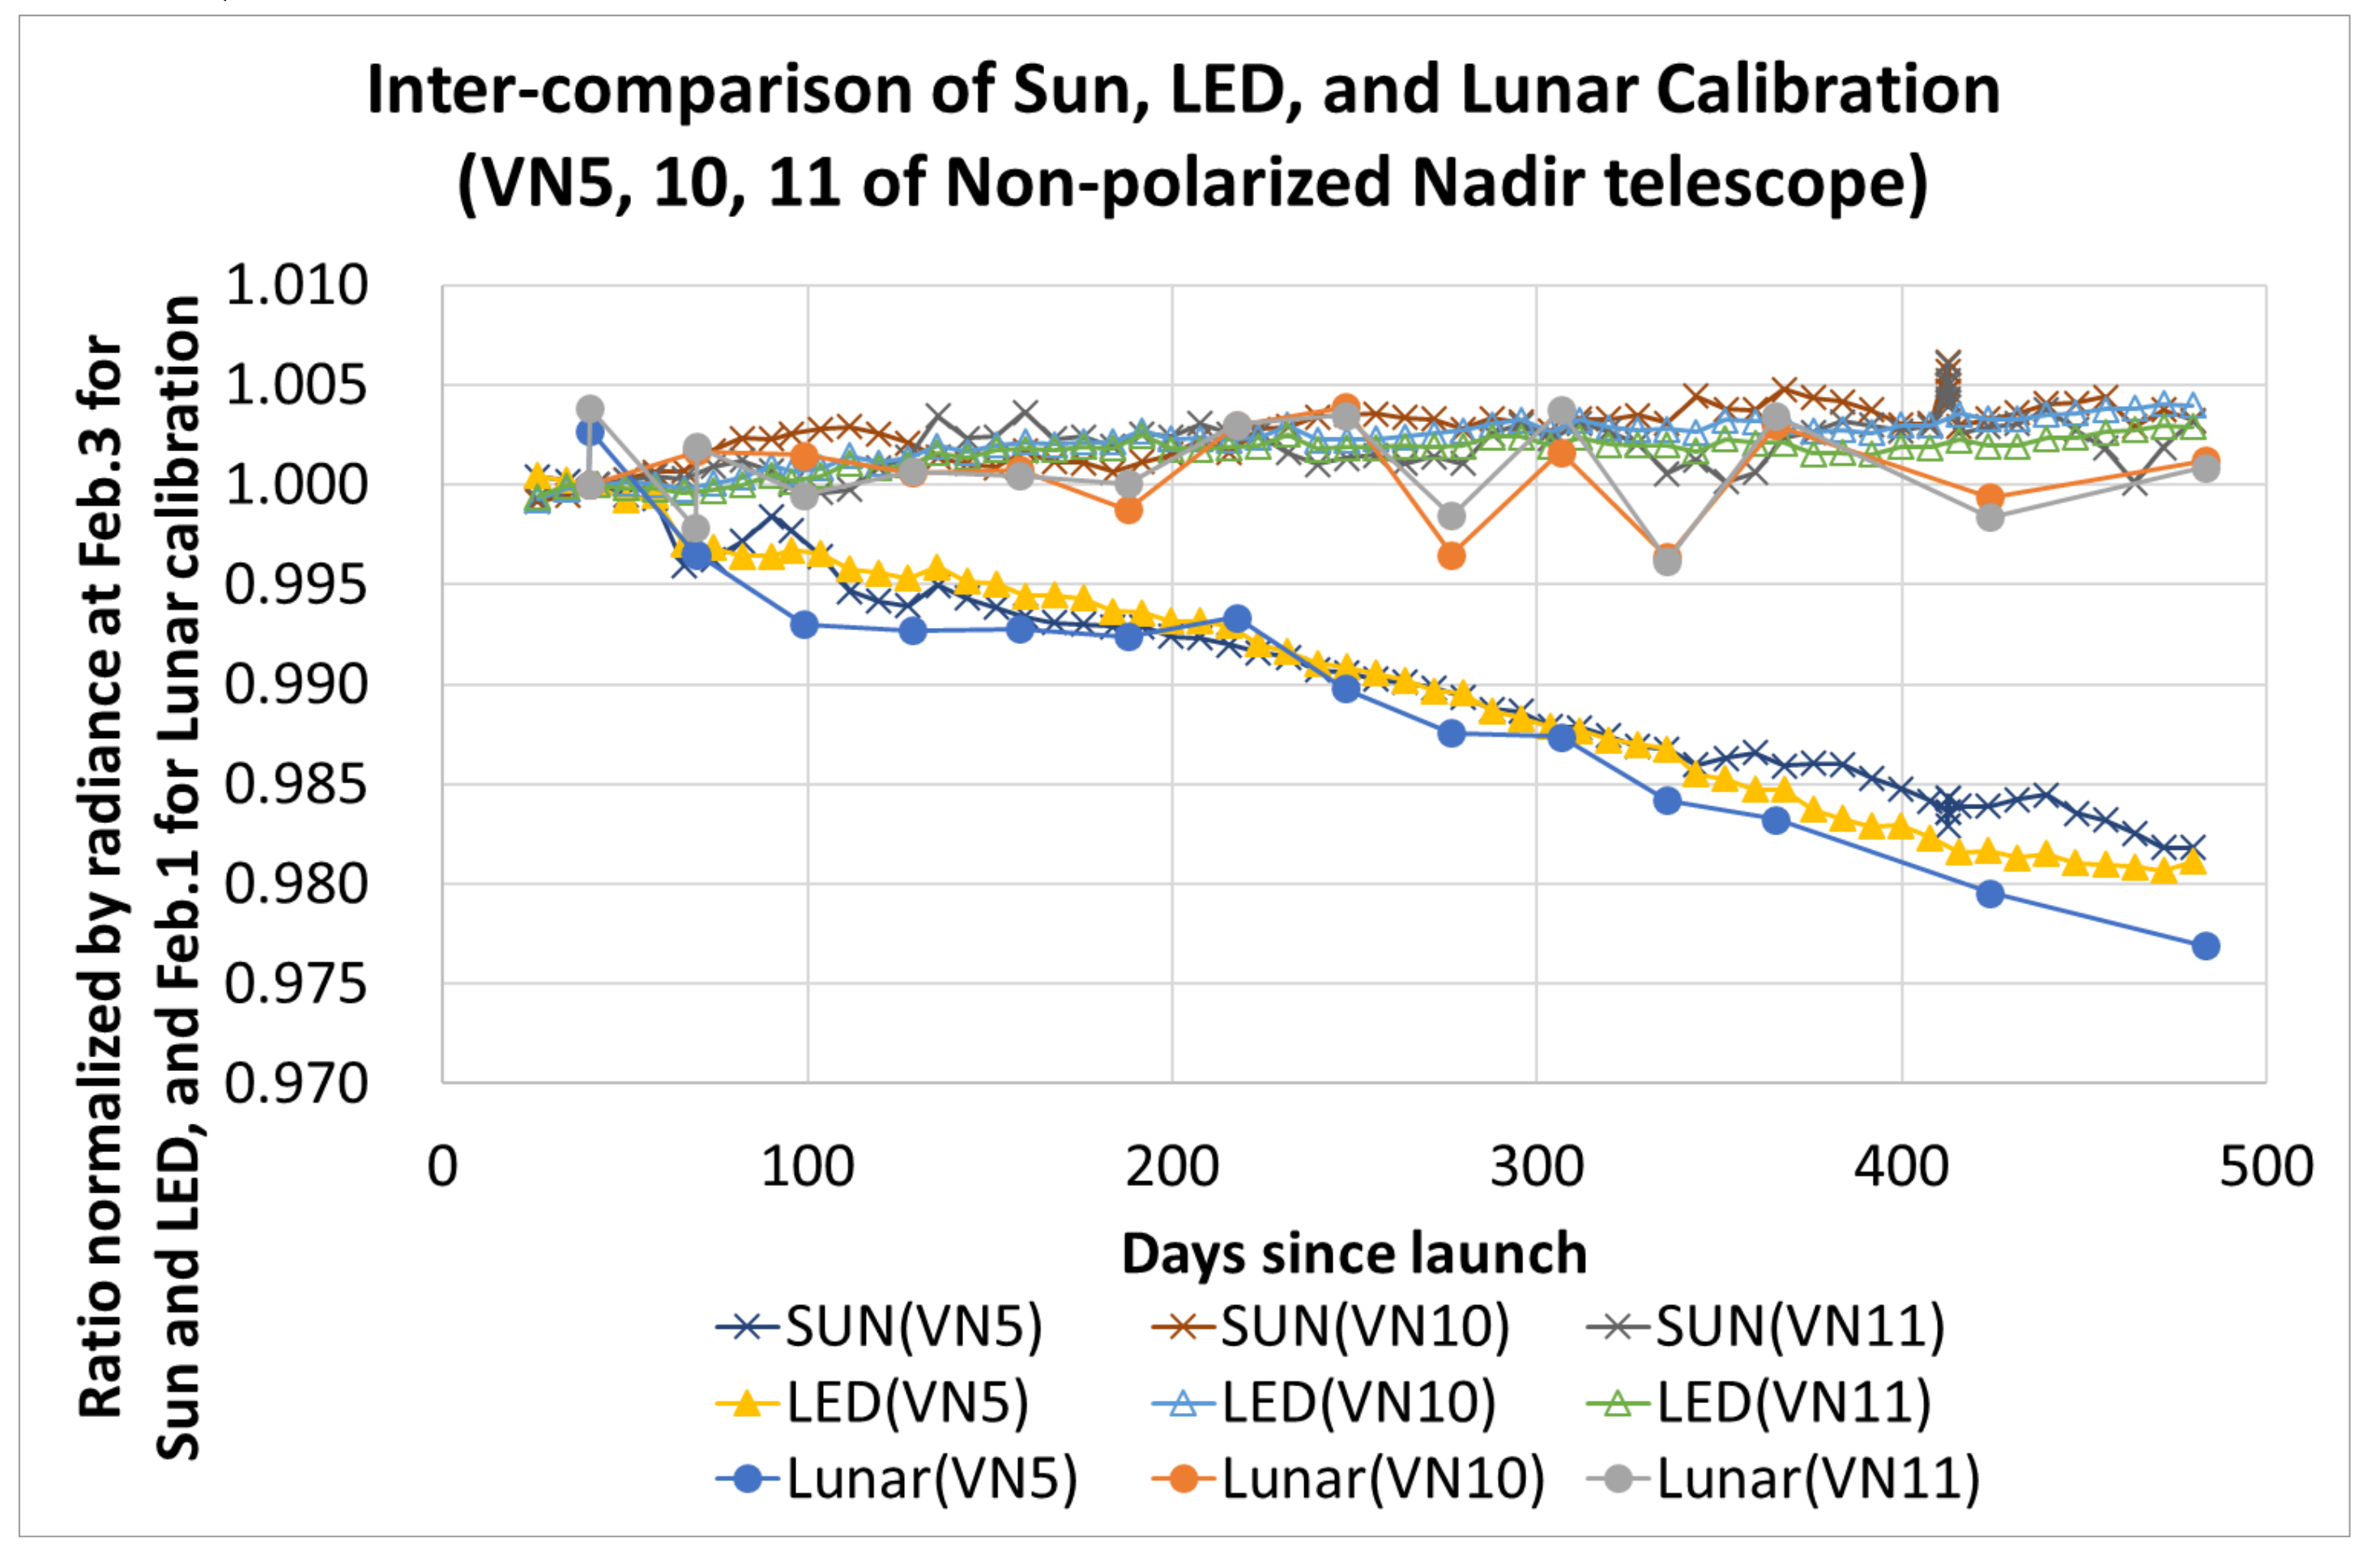
According to the device exposure tests to radiation on the ground, the degradation of the PD’s sensitivity was less than 1%/5 years. Therefore, the degradation of sensitivity of the NP-Nadir telescope’s VN5 (PD2 band), VN10, and VN11 (PD4 band) was obtained on the assumption that G p e r i o d , t p d = G p e r i o d , 0 p d and it is possible to evaluate the inter-comparison of the solar, LED calibration, and lunar calibration, as shown in Figure 11. Although the response degradation rate was not exactly the same because of the matter such as MLI stray light during solar calibration, light intensity distribution change at the LED calibration, and lunar phase angle dependency at the lunar calibration, these three calibrations showed a similar trend. For the VN5, 10, and 11 of the NP-Nadir, the relative response degradation between the solar, LED, and lunar calibration agreed to within 1% or less. The response change in the NIR spectral regions (VN10 and 11 with a wavelength of 868.5 nm) was very small and the shorter wavelength band (VN5 with wavelength of 530 nm) had more degradation. The relative response change from over one year of on-orbit observations (normalized to the initial lunar observation) was less than 2%.

6. Conclusions

The radiometric model and the first results of independent calibrations on the SGLI-VNR, which include weekly solar and LED calibration and monthly lunar calibration, were described. Each calibration result was obtained with corrections (e.g., the beta angle correction and avoidance of reflection from multi-layer insulation) that were applied for solar calibration; LED temperature correction was performed for LED calibration; and the GIRO model was used for lunar calibration. For the solar and LED calibrations, UV irradiation to the stored diffuser plate caused its degradation and gave an in-plane reflectance distribution to the NP-Left and NP-Right telescopes, PD1 and PD3, which needs further analysis to isolate the degradation of the telescope and PD sensitivity from that of the diffuser’s in-plane reflectance distribution. However, PD2 and PD4 can monitor the diffuser reflectance to correct the responses of the NP-Nadir’s VN5, 10, and 11 bands. As a consequence, inter-comparison of the solar, LED, and lunar calibration at these bands was enabled. Although the response degradation rate was not exactly the same because of issues such as MLI stray light during solar calibration, light intensity distribution change at the LED calibration, and lunar phase angle dependency at the lunar calibration, these three calibrations showed a similar trend, and inter-comparison of the relative response change between these three calibrations agreed to within 1%. The response change in the NIR spectral regions (VN10 and 11 with a wavelength of 868.5 nm) was very small and the shorter wavelength band (VN5 with a wavelength of 530 nm) had more degradation. The relative response change from over one year of on-orbit observations (normalized to the initial lunar observation) was less than 2%.

Author Contributions

Conceptualization, T.U., Y.O. and K.T.; Methodology, T.U., T.H. and S.A.; Software, T.U., T.H. and S.A.; Validation, T.U., T.H. and S.A.; formal analysis, T.U., T.H. and S.A.; Investigation, T.U., T.H. and S.A.; Resources, T.U., T.H. and S.A.; Data curation, T.U., T.H. and S.A.; Writing—original draft preparation, T.U.; Writing—review and editing, T.H., X.X., S.A., Y.O. and K.T.; Visualization, T.U., Y.O. and K.T.; Supervision, X.X. and K.T.; Project administration, T.U., X.X. and K.T.; Funding acquisition, Y.O. and K.T. All authors have read and agreed to the published version of the manuscript.

Funding

This research received no external funding.

Acknowledgments

The author would like to thank USGS for developing and improving the ROLO model and thank EUMETSAT for implementing GIRO. The SGLI lunar calibration results were obtained with the effort of RESTEC.

Conflicts of Interest

The authors declare no conflict of interest.

References

  1. Imaoka, K.; Kachi, M.; Fujii, H.; Murakami, H.; Hori, M.; Ono, A.; Igarashi, T.; Nakagawa, K.; Oki, T.; Honda, Y.; et al. Global Change Observation Mission (GCOM) for Monitoring Carbon, Water Cycles, and Climate Change. Proc. IEEE 2010, 98, 717–734. [Google Scholar] [CrossRef]
  2. Uchikata, T.; Tanaka, K.; Okamura, Y.; Tsuida, S.; Amano, T. Proto Flight Model (PFM) performance and development status of Visible and Near Infrared Radiometer (VNR) on the Second-generation Global Imager (SGLI). Proc. SPIE 2014, 9264, 92640Q. [Google Scholar]
  3. Sakashita, T.; Tsuida, S.; Amano, T.; Shiratama, K.; Tanaka, K. Proto Flight Model (PFM) development status of visible and near-infrared radiometer (VNR) on the Second-generation Global Imager (SGLI). Proc. SPIE 2016, 9881, 98810S. [Google Scholar]
  4. Tanaka, K.; Okamura, Y.; Amano, T.; Hosokawa, T.; Uchikata, T. The development status of Second Generation Global Imager (SGLI), Infrared Scanning Radiometer (SGLI-IRS). Proc. SPIE 2014, 9264, 92640G. [Google Scholar]
  5. Tanaka, K.; Amano, T.; Uchikata, T.; Sakashita, T. Early test results of proto-flight test of Second Generation Global Imager (SGLI) Infrared Scanning Radiometer (IRS). Proc. SPIE 2016, 9881, 98810M. [Google Scholar]
  6. Okamura, Y.; Tanaka, K.; Amano, T.; Shiratama, K.; Hosokawa, T. Development and pre-launch test status of Second Generation Global Imager (SGLI). Proc. SPIE 2015, 9639, 96390I. [Google Scholar]
  7. Urabe, T.; Ando, S.; Okamura, Y.; Tanaka, K.; Mokuno, M.; Amano, Y.; Shiratama, K.; Yoshida, J. Pre-launch instrument characterization results and in-orbit verification plan of GCOM-C/SGLI. Int. Soc. Opt. Photonics 2017, 10423, 104230O. [Google Scholar]
  8. Urabe, T.; Okamura, Y.; Tanaka, K.; Mokuno, M. In-orbit commissioning activities results of GCOM-C /SGLI. Int. Soc. Opt. Photonics 2018, 10785, 107850N. [Google Scholar]
  9. Tanaka, K.; Okamura, Y.; Mokuno, M.; Amano, T.; Yoshida, J. First year on-orbit calibration activities of SGLI on GCOM-C satellite. Proc. SPIE 2018, 10781, 107810Q. [Google Scholar]
  10. Barnes, R.A.; Holmes, A.W. Overview of the SeaWiFS ocean sensor. In Proceedings of the Sensor Systems for the Early Earth Observing System Platforms, Orlando, FL, USA, 11–16 April 1993; Volume 1939, pp. 224–232. [Google Scholar] [CrossRef]
  11. Baudin, G.; Matthews, S.; Bessudo, R.; Bezy, J.-L. Medium-Resolution Imaging Spectrometer (MERIS) calibration sequence. In Proceedings of the Imaging Spectrometry II, Denver, CO, USA, 4–9 August 1996; Volume 2819, pp. 141–150. [Google Scholar] [CrossRef]
  12. Bruegge, C.J.; Diner, D.J.; Duval, V.G. The MISR calibration program. J. Atmos. Ocean Technol. 1996, 13, 286–299. [Google Scholar] [CrossRef] [Green Version]
  13. Guenther, B.; Barnes, W.; Knight, E.; Barker, J.; Harnden, J.; Weber, R.; Abel, P. MODIS calibration: A brief review of the strategy for the At-launch calibration approach. J. Atmos. Ocean Technol. 1996, 13, 274–285. [Google Scholar] [CrossRef] [Green Version]
  14. Begni, G.; Dinguirard, M.C.; Jackson, R.D.; Slater, P.N. Absolute calibration of the SPOT-1 HRV cameras. SPIE 1986, 660, 66–76. [Google Scholar]
  15. Thome, K.J.; Markham, B.; Barker, J.; Slater, P.N.; Biggar, S.F. Radiometric calibration of Landsat. Photogramm. Eng. Remote Sens. 1997, 63, 853–858. [Google Scholar]
  16. Stone, T.C. Radiometric calibration stability and inter-calibration of solar-band instruments in orbit using the moon. In Proceedings of the Earth Observing Systems XIII, San Diego, CA, USA, 10–14 August 2008; Volume 7081, p. 70810X. [Google Scholar]
  17. Eplee, R.E., Jr.; Sun, J.-Q.; Meister, G.; Patt, F.S.; Xiong, X.; McClain, C.R. Cross calibration of SeaWiFS and MODIS using on-orbit observations of the moon. Appl. Opt. 2011, 50, 120–133. [Google Scholar] [CrossRef] [PubMed] [Green Version]
  18. Xiong, X.; Sun, J.; Barnes, W. Inter-comparison of On-orbit Calibration Consistency between Terra and Aqua MODIS Reflective Solar Bands Using the Moon. IEEE Geosci. Remote Sens. Lett. 2008, 5, 778–782. [Google Scholar] [CrossRef]
  19. Hashiguchi, T.; Okamura, Y.; Tanaka, K.; Nakajima, Y.; Suzuki, K.; Sakashita, T.; Amano, T. Radiometric performance of Second-generation Global Imager (SGLI) using integrating spheres. Proc. SPIE 2016, 10000, 1000007. [Google Scholar]
  20. Hilsenrath, E.; Herzig, H.; Williams, D.E.; Bruegge, C.J.; Stiegman, A.E. Effects of space shuttle flight on the reflectance characteristics of diffusers in the NIR, VIS, and UV. In Proceedings of the Passive Materials for Optical Elements II, San Diego, CA, USA, 11–16 July 1993; Volume 2018, pp. 104–113. [Google Scholar]
  21. Petroy, S.B.; Leland, J.E.; Chommeloux, B.; Bruegge, C.J.; Gourmelon, G. Phase 1. Analysis of spectralon(R) material for use in on-board calibration systems for the medium resolution imaging spectrometer (MERIS). SPIE 1994, 2210, 616–624. [Google Scholar]
  22. Wagner, S.C.; Hewison, T.; Stone, T.; Lacherade, S.; Fougnie, B.; Xiong, X. A summary of the joint GSICS—CEOS/IVOS lunar calibration workshop: Moving towards intercalibration using the Moon as a transfer target. In Proceedings of the Sensors, Systems, and Next-Generation Satellites XIX, Toulouse, France, 21–24 September 2015; Volume 9639, p. 96390Z. [Google Scholar] [CrossRef]
  23. Kieffer, H.H.; Stone, T.C. The spectral irradiance of the moon. Astron. J. 2005, 129, 2887–2901. [Google Scholar] [CrossRef] [Green Version]
  24. Urabe, T.; Xiong, X.; Hashiguchi, T.; Ando, S.; Okamura, Y.; Tanaka, K.; Mokuno, M. Lunar calibration inter-comparison of SGLI, MODIS and VIIRS. In Proceedings of the IGARSS 2018—2018 IEEE International Geoscience and Remote Sensing Symposium, Yokohama, Japan, 28 July–2 August 2019. [Google Scholar]
  25. Xiong, X.; Lacherade, S.; Lebegue, L.; Fougnie, B.; Angal, A.; Wang, Z.; Aznay, O. Comparison of MODIS and PLEIADES Lunar observations. In Proceedings of the Sensors, Systems, and Next-Generation Satellites XVIII, Amsterdam, The Netherlands, 22–25 September 2014; Volume 9241, p. 924111. [Google Scholar]
  26. Jeong, M.; Kim, S.S.; Garrick-Bethell, I.; Park, S.-M.; Sim, C.K.; Jin, H.; Min, K.W.; Choi, Y.-J. Multi-band polarimetry of the lunar surface. I. Global properties. Astrophys. J. Suppl. Ser. 2015, 221, 16. [Google Scholar] [CrossRef]
Figure 1. This is the specification and outer appearance of Visible and Near Infrared Radiometer (SGLI-VNR). SGLI-VNR consists of non-polarized (NP) observation telescopes, polarized (PL) observation telescopes, and solar diffuser. NP telescopes consist of three telescopes; NP-Nadir, NP-Left, and NP-Right, and each NP telescope has eleven channels from VN1 for 380 nm to VN11 for 868.5 nm. PL telescopes consist of two telescopes; PL1 for 673.5 nm and PL2 for 868.5 nm. λ and Δλ are the center wavelength and bandwidth, respectively. Specification of standard luminance (Lstd), maximum luminance (Lmax), signal-to-noise ratio (SNR), and instantaneous field of view (IFOV) for each channel are as shown in the table.
Remotesensing 12 00069 g001
Figure 2. This is a configuration of solar calibration and light-emitting diode (LED) calibration for Visible and Near Infrared Radiometer (SGLI-VNR). +Xsat and +Zsat are the ram direction and the nadir direction, respectively. SGLI-VNR observes sunlight reflected by the solar diffuser panel once every eight days as the spacecraft passes over the North Pole, moving from the Earth’s shadow into sunlight. White and near-infrared (NIR) LEDs were used for internal light calibration. Several monitors such as stability photo diode monitor (PD), the LED drive current monitor, and LED temperature monitor were installed for correction. +Xdiff and +Ydiff show the diffuser coordinate system.
Remotesensing 12 00069 g002
Figure 3. These are field of views from (a) the non-polarized (NP) telescopes, (b) polarized (PL) telescopes, and (c) stability photo diode monitors (PDs). Each NP telescope has eleven charge-coupled device (CCD) lines for the VN1 to VN11 channels and each line has 6000 sub-pixels. For the PL telescope, each telescope had three CCD lines for three polarization channels and each line had 6000 sub-pixels. All CCD pixels in all bands were designed to be calibrated using sunlight reflected by the diffuser as shown in (a,b). Four PDs were used to monitor the solar diffuser reflectance as independent calibrators as shown in (c).
Remotesensing 12 00069 g003
Figure 4. Wavelength characteristics of the non-polarized (NP) and polarized (PL) telescopes, the photo diode monitors (PDs) and light-emitting diodes (LEDs). White and near-infrared (NIR) LEDs cover a wide wavelength of Visible and Near Infrared Radiometer (SGLI-VNR), except for VN1 and VN9. PDs consist of PD1, 2, 3 and 4, which correspond to the VN2 band, VN5 band, VN7 and VN8 bands, and VN10 and VN11 bands, respectively.
Remotesensing 12 00069 g004
Figure 5. The beta angle correction fitted curve of the non-polarized (NP)-Nadir telescope (average of charge-coupled device (CCD) response of 501–600 pixels within 53–55 degrees of the zenith angle at the diffuser coordinate system), which were acquired on January 4, 2018 (12 days since launch) and on February 8, 2019 (412 days since launch).
Remotesensing 12 00069 g005
Figure 6. The first-year trends of solar calibration of (a) non-polarized (NP)-Left telescope, (b) NP-Right telescope, (c) NP-Nadir telescope, (d) polarized (PL) telescopes, and (e) Photo Diode monitors (PDs). As for figures (ae), the x-axis shows days since launch and the y-axis shows the ratio of Equation (10), which references the data of January 10, 2018 (the first day that both solar and light-emitting diode (LED) calibrations were conducted on orbit).
Remotesensing 12 00069 g006
Figure 7. Unexpected solar incidence to the stored diffuser plate around the spacecraft passes over the South Pole. The calibration areas of the diffuser exposed to sunlight during the phase angle (PA) from ascending node (AN) were around 280 degrees to 295 degrees.
Remotesensing 12 00069 g007
Figure 8. The first-year trend of the light-emitting diode (LED) calibration of (a) the non-polarized (NP)-Left telescope, (b) NP-Right telescope, (c) NP-Nadir telescope, (d) polarize (PL) telescopes, and (e) photo diode monitors (PDs). For figures (ae), the x-axis shows the days since launch and the y-axis shows the ratio of Equation (17), which reference the data of January 10, 2018 (the first day that both solar and LED calibrations were conducted on orbit). (f) The NP-Nadir radiance ratio of each pixel between January 10, 2019 and January 10, 2018 and it indicates that the light distribution of the LED slightly changed.
Remotesensing 12 00069 g008aRemotesensing 12 00069 g008b
Figure 9. The Global Change Observation Mission–Climate (GCOM-C) lunar calibration sequence requires an attitude pitch (y-axis) maneuver so that the Visible and Near Infrared Radiometer (SGLI-VNR) telescopes can scan the Moon. This sequence is planned to start when the satellite enters the shadow of the Earth. The satellite faces the Moon, then it scans the Moon once at a constant rate of 0.15 degrees per second, so the acquired Moon images are oversampled in the along-track direction. The satellite is then pitched back toward the Earth, recovering its normal Earth-oriented attitude before getting out of the Earth’s shadow. Since SGLI-VNR has three non-polarized (NP) telescopes with their offset angles around the roll axis (x-axis) at +23.3 or 0 or −23.3 degrees accordingly from the nadir direction, the maneuvers with a roll angle of ±24 degrees are dedicated to the calibration of the NP-Left and NP-Right telescopes. In addition, the roll bias of the intermediate angles of ±12 degrees allows for the simultaneous calibration of the two telescopes as shown in the figure. Only one roll bias angle can be selected on each orbit. Since the lunar disk is around 20 charge-coupled device (CCD) pixels in diameter and the accuracy of the GCOM-C attitude control during the lunar calibration is 0.025 degrees or less, the lunar calibration was performed with almost the same pixels every time.
Remotesensing 12 00069 g009
Figure 10. The first-year trend of lunar calibration of the non-polarized (NP)-Nadir and PL1 and PL2 telescopes, respectively, under the phase angle condition of +7 ± 3 degrees (lunar measurements were performed at either −7 or +7 degree phase, but the measurements of the NP-Nadir were not conducted at −7 degree).
Remotesensing 12 00069 g010
Figure 11. The first-year trend of solar, light-emitting diode (LED), and lunar calibration at VN5, 10, and 11 of the non-polarized (NP)-Nadir telescope. Since the first lunar observation though its nadir view at the satellite’s roll axis = 0 was conducted on January 31, 2018, the radiance’s ratio was normalized by the data acquired on January 31, 2018 for lunar calibration, and the radiance’s ratio for solar and LED calibrations were normalized by the data of February 3, 2018, since it is the nearest calibration timing close to the first lunar calibration date.
Remotesensing 12 00069 g011
Table 1. The ranges of effective charge-coupled device (CCD) pixels (pixel number) and zenith angles (degrees) at the diffuser coordinate system for solar calibration. Other CCD pixels and zenith angles are affected by the stray light reflected from the structure covered by multilayer insulation (MLI).
NP TelescopePL TelescopePD Monitor
LeftNadirRightPL1PL1PD1PD2PD3PD4
Pixel (pix)101–200501–6001–100301–40751–157-
Zenith angle (degree)56–5753–5557–6558–6052–5453–55