Abstract
The Asia-Pacific Lightning Location Network (APLLN) is a lightning location system consisting of a series of very low-frequency signal detection sites. Since 2018, 16 detection sites have been deployed with an average baseline longer than 1000 km. The detection site used a trigger sampling method to record the lightning signal with a duration of 2 ms and calculates the lightning arrival time based on digital filtering and the Hilbert envelope method. APLLN used a time difference location algorithm and improved Levenberg–Marquardt non-linear least squares iterative algorithm to calculate and optimize the lightning location results. The analysis results of a strong thunderstorm process show that the average detection efficiency of APLLN was 55.34% for intracloud (IC) strokes, 63.55% for cloud-to-ground (CG) strokes and 61.83% for all strokes (IC + CG). The average location error of APLLN for this thunderstorm is 5–10 km.
1. Introduction
Lightning is a severe discharge process that occurs between clouds and clouds, clouds and ground, or clouds and the atmosphere. Lightning can emit large amounts of electromagnetic energy in the frequency range from below 1 Hz to near 300 MHz [1]. Since the 1980s, multiple ground-based lightning location systems based on different detection technologies have been developed and deployed in different regions of the world. Most ground-based lightning location systems require multiple sites. In the early days, a magnetic direction finding instrument was developed using a wide-band magnetic field measurement module [2]. The azimuth between the lightning and site was calculated by the detection site according to the east-west and north-south magnetic field values. The directions calculated by multiple sites will converge in an area to estimate the location of the lightning occurrence. Due to the large measurement error, the magnetic direction-finding method is now used as an auxiliary method for lightning location, removing the fuzzy solution generated in the location calculation.
With the popularity of the Global Positioning System (GPS), the high-precision timing service provided by GPS makes the time accuracy between lightning detection sites better than 20 ns (clear sky). The time of arrival (TOA) method has been applied to different types of lightning location systems. Wu et al. [3] deployed a fast antenna lightning mapping array (FALMA) operating in the low-frequency (LF) band in Japan for imaging of entire lightning flashes. The distance between adjacent sites is 20–30 km, and the location accuracy is less than 25 m. When the baseline of the sites is 10–100 km, the detection site can receives very high frequency (VHF) electromagnetic radiation. Based on the GPS, Rison et al. [4] developed a lightning mapping array (LMA) working in the VHF band to achieve three-dimensional mapping of lightning discharge trajectories. For a lightning discharge process, the duration is several milliseconds to hundreds of milliseconds, and LMA can generally detect hundreds to thousands of radiation events. For a lightning location system with a site’s baseline above 100 km, it is mainly to receive very low-frequency or low-frequency (VLF/LF) lightning signals. Three-dimensional lightning location network (advanced direction-time lightning detection system, ADTD) of the Institute of Electrical Engineering, Chinese Academy of Sciences [5], the National Lightning Detection Network (NLDN) in the United States [6] and the European Cooperation for Lightning Detection (EUCLID) [7] all work in the VLF/LF band.
The lightning location system plays an important role in forecasting meteorological disasters, civil aviation safety, and lightning disaster investigation. For a long time, various types of commercial or research lightning location networks have been mainly distributed in densely populated areas. For some sparsely populated areas, plateaus or vast oceans and deserts, the lightning location network based on ground wave propagation mode cannot effectively cover the area when the distance between lightning and detection sites is more than 1000 km. Since the energy in the VLF band can be effectively transmitted on the surface of the Earth and the ionosphere (especially the D region of the ionosphere), the World Wide Lightning Location Network (WWLLN) based on this propagation mode of the Earth- ionosphere waveguide has been deployed since 2001 [8,9]. WWLLN currently has more than 70 VLF detection sites distributed around the world for “sferic” monitoring (a remote measurement of transient electric fields generated by lightning [10]). Due to the large baseline distance between WWLLN detection sites and the small number of sites in the Asia-Pacific region, the efficiency of lightning detection is limited. Srivastava et al. [11] compared the data of WWLLN and Beijing Lightning Network (BLNET) [12], by using a time window of 0.5 ms and location deviation of 30 km, and found that the lightning detection efficiency of WWLLN in Beijing was less than 20%, and the location deviation was 377 m–2744 m.
Novelty and Contributions
China and Southeast Asia have large spatial spans. From the vast ocean to the roof of the world, the Tibetan Plateau, lightning activity in this region is very frequent, posing a serious threat to traffic safety, human life, and property. In order to better detect lightning activity in China and Southeast Asia, and to provide lightning disaster forecasts for civil aviation and marine routes in the region, we have developed and deployed a regional long-baseline lightning location network (APLLN: the Asia-Pacific Lightning Location Network), which operates in the VLF band. In order to achieve higher lightning detection efficiency and location accuracy, we have done the following:
- In order to let more detection sites receive the same lightning signal, the average distance between APLLN sites is about 1000 km.
- This paper presented a method for VLF lightning signal processing, and designed a hardware circuit for VLF detection point lightning. The lightning signal envelope was calculated based on the Hilbert transform, and the peak value of the envelope was used as the arrival time of the lightning signal.
- The location algorithm was improved in this paper. The improved location algorithm obtains the initial location solution by the spherical triangular location method, and then optimizes the initial solution using the improved Levenberg–Marquardt (L–M) [13,14] non-linear least squares method. The detailed calculation steps are in Section 3.3.
- Compared with the traditional method that used the constant speed of light as the propagation factor, this paper introduces the propagation speed as a variable into the iterative algorithm and obtains better location results.
- The location accuracy of APLLN was simulated, and the detection performance of APLLN was evaluated based on the lightning location data of China’s three-dimensional lightning location network (generally known as ADTD).
The rest of this article is arranged as follows: Section 2 introduces the deployment of APLLN and related parameters of the detection sites. Section 3 introduces signal-processing methods and location calculation methods. Section 4 evaluates the current detection accuracy of APLLN. Section 5 compares and analyzes the APLLN data with the three-dimensional lightning location data of the Institute of Electrical Engineering, Chinese Academy of Sciences, and evaluates the detection efficiency and accuracy of lightning detection by APLLN in the Asia-Pacific region. Finally, Section 6 gives conclusions.
2. Network and Instrumentation
We have begun establishing VLF lightning detection sites in China and Southeast Asian countries since 2018. So far, APLLN has 16 detection sites with coverage ranging from 75°E to 134°E, and 7°N to 53°N. Figure 1 shows the current site distribution. Fourteen sites were deployed in China, and Cambodia and Sri Lanka each deployed one site. The average baseline between sites is about 1000 km, whereas the minimum and maximum distance are about 800 km and 3600 km, respectively. Among them, two sites are distributed on the Qinghai–Tibet Plateau, and the maximum height difference between all sites is about 4 km. At present, more sites are planned to be deployed in western and southern China and the “Belt and Road” countries.
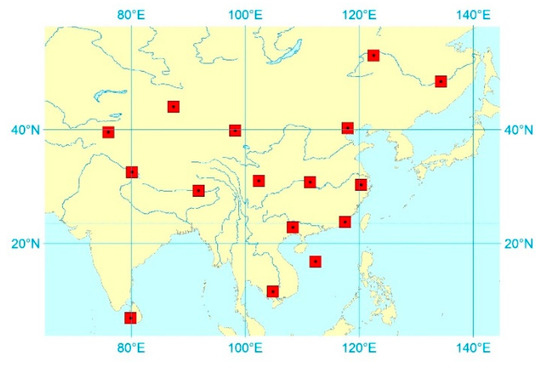
Figure 1.
The location of 16 very low-frequency (VLF) band detection sites (shown as red squares) as of mid-December 2019. Each red box represents a site.
Figure 2a shows the composition block diagram of the detection site. Each site consists of a VLF lightning signal receiving antenna, a GPS signal receiver, a signal acquisition with a processing unit, a network data transmission unit, a data storage unit, and a power control unit. The VLF receiving antenna is a whip antenna with a length of 1.5 meters, and the signal induced by the antenna is directly transmitted to the signal-processing unit by the feeder. The detection site used solar power to remove power frequency noise and also simplify the installation and maintenance of the detection site. Figure 2b shows the appearance of a complete VLF detection site, which is very concise.
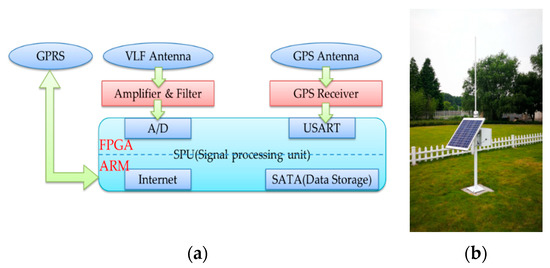
Figure 2.
(a) Block diagram of the VLF lightning sensor. (b) Photo of a VLF lightning detection site in Hangzhou, China.
The detection site samples the lightning signal at 500 kSPS (Kilo Samples per Second) and digitizes the signal with a 16-bit resolution. A trigger sampling method has been used to reduce the operating load of the system with a record time length of 2 ms and a pre-trigger time of 240 μs. More importantly, the signal collected by each trigger will be stored in the local solid-state hard disk of the detection site. The hard disk storage capacity can be flexibly configured, and generally is 250G. The processing system uses the framework of FPGA (Field-Programmable Gate Array) + ARM (Advanced RISC Machine). FPGA is responsible for real-time signal acquisition and triggers time labeling tasks. ARM is undertaking signal analysis, storage, and network data transmission tasks. The system is integrated on a PCB (printed circuit board), and the overall average power consumption is about 4 W.
3. Methodology
APLLN is a VLF location network. There is an essential difference in signal bandwidth between LF and VHF location systems. Therefore, signal-processing methods and location methods are also different. The following improvements were used in signal processing and location algorithms to achieve better results: signal preprocessing, time of arrival estimation, and location calculation of the data-processing center.
3.1. Signal Processing
3.1.1. Filtering
There may be interference from VLF communication sites or other power line harmonics in the signals received by the VLF detection sites. The interference signals are concentrated around 20 kHz, which affects the acquisition of the lightning signal arrival time. In severe cases, the lightning signal would be submerged by the interference signal. Therefore, the signal-processing unit uses a third-order zero-phase low-pass digital filtering technology to eliminate the interference signals. The 3 dB cut-off frequency of the filter is 17 kHz (see Section 3.1.2 for parameter selection). In this filtering stage, it is important to ensure that there is no significant phase shift in the signal. Figure 3 shows the original and denoised data of a lightning signal and compares the filtering effect of a Butterworth filter and zero-phase filter on the signal. Both filters have removed the noise very well, but the Butterworth filter produced a significant phase shift on the original signal, which can cause serious deviations in the location results.
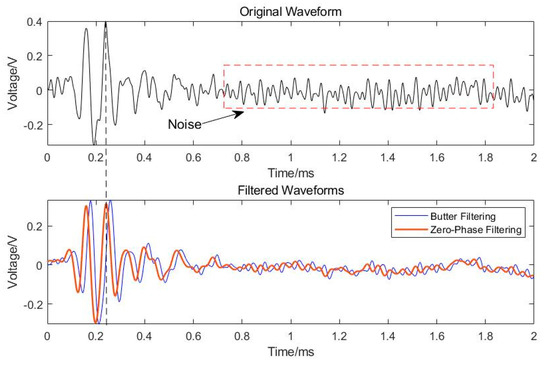
Figure 3.
Signal filtering. The upper graph is the original signal, and the lower graph is the comparison of the filtering results of the Butterworth filter and the zero-phase filter on the original signal. The dotted line indicates the moment when the signal was triggered for sampling.
3.1.2. Classification
Lightning radiation has a wide spectrum of frequencies, and the high-frequency components of the signal rapidly attenuate as the propagation distance increases. When the detection site is closer to the location where the lightning occurs, a large number of near-field lightning radiation signals will be received. Especially before the lightning stroke occurs, there would be preliminary breakdown process (PBP) and leader pulses. Figure 4 shows the near-field and far-field radiation signals received by the electric field antenna. Figure 4a shows the continuous electric field radiation signal generated by the preliminary breakdown process during the sampling time window (2 ms). These signals occurred before the stroke and have a higher spectral component (Figure 4b), ranging from 20 kHz to 40 kHz. Figure 4c shows a signal transmitted through the ionosphere in a distant region. As shown in Figure 4d, the signal spectrum is mainly concentrated within 17 kHz, and the maximum frequency component 13 kHz. From the spectrograms of the two signals, it can be found that the signal spectrum has a peak of around 36 kHz, which may be a navigation signal or other interference signals. Considering that the far-field lightning signal spectrum is mainly concentrated below 17 kHz, the cutoff frequency of the filter is chosen to be 17 kHz.
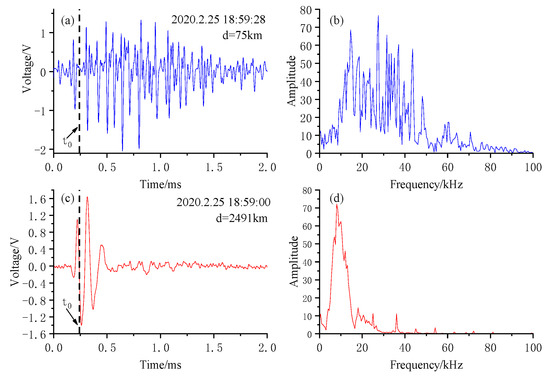
Figure 4.
Time and spectrum plots of electric field signals in the near (75 km) and far (2491 km) regions. The blue lines represent near-field lightning signals, (a) time-domain plot, and (b) spectrum plot. The red lines represent far-field lightning signals, (c) time-domain plots, and (d) spectrum plots. The marked time is the time when the signal triggers sampling, and d is the distance from the lightning signal to the detection site.
3.2. Time of Arrival
Due to the presence of high-frequency components of the radiation field in the near-field lightning, there is an obvious rising or falling edge of the electric field signal. When the site baseline is less than 100 km, the lightning signal is transmitted to each site in the form of a direct wave. The peak time of the signal can be used as the signal’s arrival time. Liu et al. [15] performed a Hilbert transform before cross-correlation, and converted the original VHF waveform to a Hilbert envelope to obtain the signal arrival time.
The lightning signal in the far area propagates in the Earth-ionosphere waveguide, and the VLF electric field signal received by the APLLN detection site has no sharp electric field change and no strict arrival time. In order to obtain a relatively accurate arrival time, Lee et al. [16] measured the arrival time difference (ATD) by cross-correlation of the full VLF wave trains received at a pair of sites; Richard L et al. [8] measured the rate of change of the sferic phase with respect to the frequency at the trigger time to find the time of group arrival (TOGA) at each receiver site. Liu et al. [17] used the Hilbert transform to generate a complex lightning waveform, obtained the instantaneous frequency and phase information of the lightning, and calculated the arrival time difference based on the instantaneous phase.
In this paper, the signal arrival time is obtained by calculating the Hilbert envelope of the triggered VLF wave train. Envelope function contains important information about signal energy [18], and this paper uses the peak point of the envelope, that is, the maximum energy point, as the signal’s arrival time. The real signal is converted into an analytical signal by the Hilbert transform. The real part of the analytical signal is the original signal, and the imaginary part is the Hilbert transformed signal. The amplitude of the analytical signal is the Hilbert envelope of the VLF lightning signal. The trigger time is consistent with the GPS time. For the VLF signal , its Hilbert transform is:
where, indicates the convolution operation. The constructed analytical signal is:
Figure 5 shows the Hilbert envelope of a VLF lightning signal, The detection site is triggered at , The peak time of the original signal is , Envelope peak time is , compared to the original signal, the envelope peak time is 8 μs earlier.
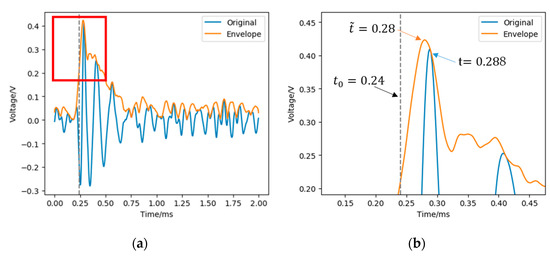
Figure 5.
(a) Lightning signal in the VLF band and Hilbert envelope. (b) The enlarged view near the peak point of (a). The dotted line indicates the trigger moment.
3.3. Lightning Location Algorithm
Based on multi-site TOA technology, many location algorithms have been developed. For the two-dimensional cloud-to-ground (CG) flash location network, the hyperbolic intersection method was used to calculate the initial position of the lightning [10,19,20,21]. This method requires a direction-finding system based on the magnetic loop antenna and a flat electric field antenna to eliminate azimuth ambiguity [22,23,24]. For the three-dimensional lightning location network, use the hyperboloid intersection method to determine the location of the lightning [3,12,25,26]. These methods assume that lightning travels to each site in the form of a direct wave with a propagation speed of approximately the speed of light c. When the distance between the lightning and the detection site is more than 1000 km, due to the influence of the curvature of the earth, the detection site cannot receive direct waves. All of the APLLN sites receive VLF sky waves that have been repeatedly reflected by the ionosphere. As shown in Figure 6, j1, j2, and j3 are the propagation paths of lightning radiation at different reflection times. It is assumed that the detection site receives both the direct wave and the reflected wave, and the reflected wave will arrive after the direct wave, that is, the reflected wave travels a longer distance because of reflections.
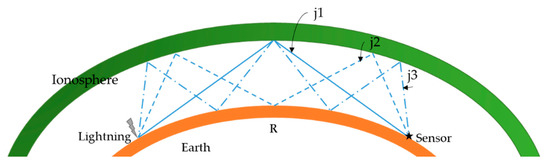
Figure 6.
Schematic representation of VLF lightning propagation in the Earth-ionosphere. The pentagram represents a lightning detection site.
Since the arrival time of sky waves cannot be measured accurately, when there is an arrival time error in one or more sites, it can cause the source location to be inaccurate. Considering the influence of the curvature of the Earth, this paper uses the spherical triangle location algorithm to obtain the initial solution of lightning location. APLLN’s location algorithm is based on the WGS-84 (World Geodetic System 1984 coordinate system) spatial coordinate system and the Levenberg–Marquardt (L–M) non-linear least-squares [27,28,29] iterative algorithm to optimize the location results.
In the calculation of the initial solution, it is generally assumed that the Earth is a uniform sphere with a radius of R, and the lightning signal propagates along the surface of the earth. Figure 7 shows that the electromagnetic signal emitted by a lightning L travels along the sphere to the detection sites P1 and P2 via different paths, and the arrival times are and respectively. The propagation distance (arc length) from the lightning to the detection site are and . and is the azimuth of lightning and detection site relative to the North Pole. is the azimuth of site P1 relative to site P2.
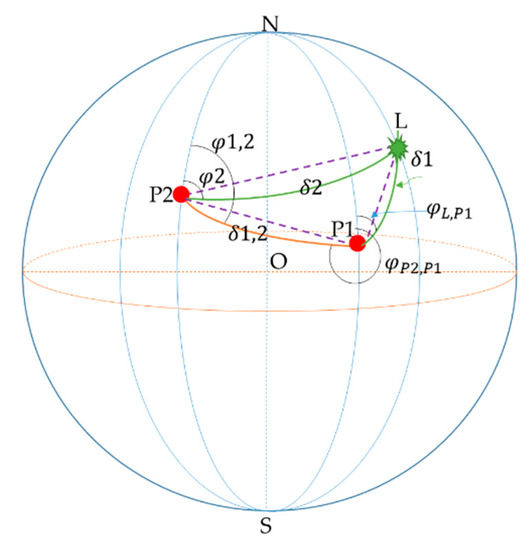
Figure 7.
Schematic diagram of the location method using spherical triangle. Lightning L traveled along the solid green line to sites P1 and P2. O is the center of the ball. N is the North Pole and S is the South Pole.
Assuming the propagation speed is the speed of light c, the distance difference between the sferic reaching the two detection sites has the following relationship:
According to the spherical triangle cosine theorem:
where, , is the azimuth of lightning relative to , is the azimuth of relative to .
Combining Equations (3) and (4), the time difference equation can be obtained:
For multiple sites (> = 4), there are multiple time difference equations. Solving the time difference equation can obtain the initial solution of the lightning position. Considering the different propagation distances caused by multiple reflections through the ionosphere, there is a difference in the propagation time. Different from other work, the lightning propagation speed is set to a constant c. The spherical location algorithm described above assumes that the signal travels along with the Earth. In this case, it can be understood that the difference in the reflection path causes the difference in the propagation speed. This paper introduces the propagation speed c as an iterative variable into the L-M least squares algorithm. This method effectively reduces the location deviation caused by the difference between the direct wave and the reflected wave on the propagation path. The detailed calculation steps of the improved L–M algorithm are as follows (Algorithm 1):
| Algorithm 1 Improved Levenberg-Marquardt iterative algorithm |
| Input: Time of arrival, ; The site No. (latitude and longitude), ; Convergence accuracy of the algorithm, ; Number of iterations, N;
Output: The distance and azimuth of the lightning from the main site, ; 1: Calculate the initial solution by using the spherical triangle location method, , and ; 2: Calculate the iterative solution by using the L-M algorithm, and the speed of propagation uses the speed of light, , and ; 3: Calculate the initial propagation speed of the lightning to each site, ; 4: Calculate the iterative solution by using the L-M algorithm, and the speed of propagation uses the , get , and ; Return: |
4. Simulation of Location Errors
4.1. Method of Evaluation
To evaluate the accuracy of APLLN for lightning location, we have referred to other lightning location networks using the Monte Carlo simulation evaluation method [30,31,32,33] to divide the area (10°E-180°E, 40°S-80°N) with a grid of 100 km * 100 km and obtained 20,984 grids. The simulation area is the effective detection area of APLLN. It is meaningless to perform simulation evaluations on the other areas (areas beyond 10°E-180°E, 40°S-80°N). On the one hand, APLLN has low detection efficiency in the other areas, and the lightning is too far away from the detection network. The distance between most of these areas and the center of the detection network is above 8000 km. Only strong lightning radiation signals can be received by multiple sites of the detection network together. On the other hand, from the perspective of location error, the farther the signal is from the detection network, the larger the location error. We followed these steps to evaluate location accuracy:
- (1)
- We assumed that lightning occurred in the center of each grid, and the height of the lightning is uniformly set to 0 km. At the same time, assuming that the electromagnetic signal emitted by the lightning travels to the four closest sites, we calculated the distance from the lightning to each site and the time that the signal travels to each site at the speed of light c.
- (2)
- We added a random error related to the propagation distance to the arrival time calculated in step 1, the maximum error was 100 μs.
- (3)
- The arrival time calculated in step 2 was brought into the APLLN location algorithm introduced in Section 3.3 to solve the location where the lightning occurred.
- (4)
- We compared the calculated position with the actual position to obtain the calculation error.
- (5)
- We repeated the above steps 1000 times to obtain the average and standard deviation of the location error of APLLN in each grid.
It should be emphasized that the location algorithm used in this paper is based on the premise that the signal travels along the sphere. However, the actual signal travels through Earth-ionosphere reflection. There must be a large time difference between them, which makes it impossible to use a small time error similar to other evaluation methods (for example: Wang et al. [12] used an overall effective rms timing error of 0.6 μs). At the same time, the farther the signal travels, the more reflections. Therefore, the random error increases as the signal propagation distance increases, making the simulation results closer to the real situation.
The propagation in the Earth-ionosphere waveguide is substantially different during day and night because of the huge attenuation of the reflecting wave during the day. This is mainly due to the influence of the height change of the D region of the ionosphere, especially during sunrise and sunset. Generally, the height of the D region during the day and night is 70 km and 85 km [34,35], respectively. It might be also influenced by the conductivity of the ground (for example rock is by 5 orders less conductive than seawater). Considering that these factors will affect the signal propagation, the simulation in this paper is equivalent to the signal propagating in the homogeneous medium and does not consider the effects of day and night changes.
Suppose a lightning source is 3000 km away from the detection site, and the signal travels along the sphere to the site at the speed of light. The time required for signal propagation is 10 milliseconds. However, in fact, the detection site will receive the signal after about 10.1–10.2 milliseconds. Therefore, the maximum time error of 100 μs added in this paper is only a conservative value. As the distance increases, the time deviation will be greater.
4.2. Simulation Result
Figure 8a,b, respectively, show the spatial distributions of the mean and standard deviation of the location errors of the APLLN simulated by the above method. For lightning occurring inside the location network, the average location error is less than 2 km; for lightning occurring outside the location network, the average location error is proportional to the propagation distance. Through simulation, it can be found that the detection network has a large location deviation in eastern Australia, which is related to the distribution of detection site points. Figure 9 shows the four APLLN detection sites closest to the eastern region of Australia. It can be found that the four sites are distributed almost in a straight line, the maximum distance is about 2600 km, and the minimum distance is about 800 km. Compared with the ‘Y’ type site distribution, the straight line has a larger location deviation, and an initial solution could not be obtained in the worst case.
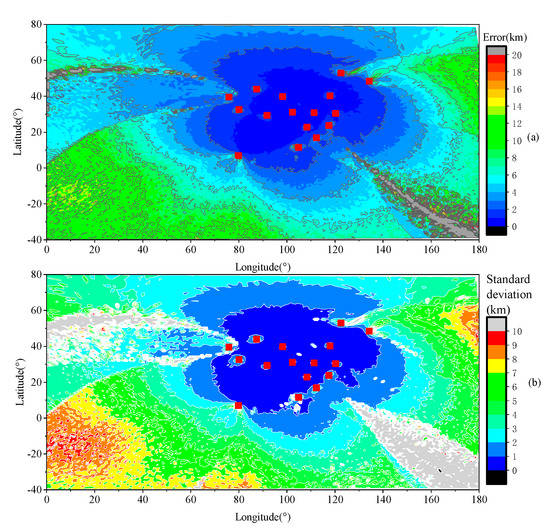
Figure 8.
(a) Spatial distribution of the mean location error that calculated by the Monte Carlo simulation. (b) Spatial distribution of the standard deviation of the location error that calculated by the Monte Carlo simulation. Each red box represents a site.
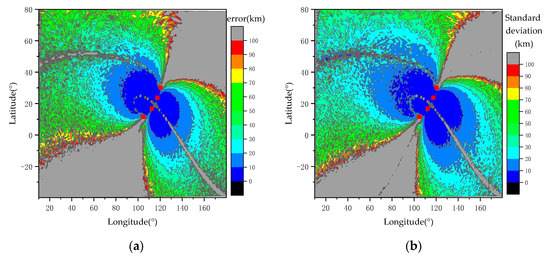
Figure 9.
The location error and standard deviation of the linear site distribution. (a) Location error distribution. (b) Standard deviation distribution. The 4 sites are distributed almost in a straight line. Each red box represents a site.
4.3. Comparative Analysis
Based on the Monte Carlo error simulation method, we have calculated the estimation of the location accuracy of APLLN by using the unimproved L-M location algorithm to analyze the effect of the improved L–M location algorithm proposed in this paper on the VLF lightning, as shown in Figure 10. To clearly distinguish the effect of the two methods on the location accuracy of APLLN, Figure 10 used the same color and error distribution interval as Figure 9. In terms of detection range, there are more gray areas (areas with larger errors) in Figure 10, which shows that the unimproved L–M algorithm has poor accuracy for VLF lightning. In terms of location accuracy, the improved algorithm doubles the location accuracy of APLLN at least. Before and after the algorithm is improved, the location accuracy of lightning within the APLLN is 1–2 km and less than 1 km, and outside the APLLN it is 2–20 km and 2–10 km, respectively.
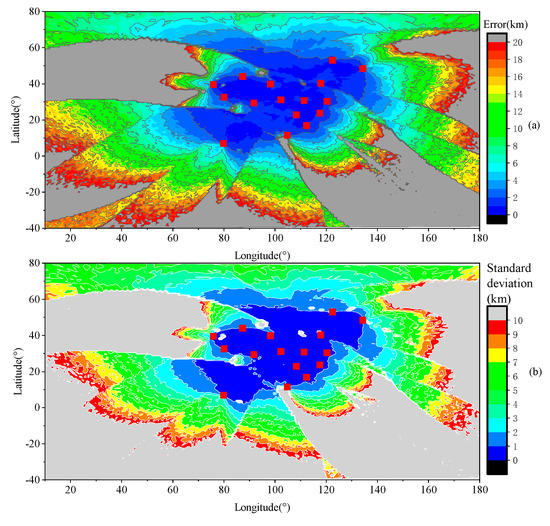
Figure 10.
Monte Carlo error simulation result of Asia-Pacific Lightning Location Network (APLLN) by using the unimproved Levenberg–Marquardt (L–M) positioning algorithm. (a) Location error distribution. (b) Standard deviation distribution. Each red box represents a site.
5. Result and Discussion
Since the deployment of the sites in 2018, APLLN’s lightning detection capabilities in the Asia-Pacific region have stabilized. From the beginning of 2019 to the present, APLLN successfully monitored multiple thunderstorm processes and their activity trends in the area. To evaluate the true location effect of APLLN, we selected a typical thunderstorm process that recorded by the detection network and compared the results of APLLN with ADTD. The ADTD three-dimensional lightning location network currently consists of 371 sites, and the detection range covers most of China and some countries in Southeast Asia. ADTD detects the time and type of lightning occurrence in real-time, calculates the location, height, peak current intensity, lightning cumulative density distribution, and movement trend of lightning. It carries out the monitoring and early warning of strong convective weather in thunderstorms. It provides disaster reduction and prevention services for meteorology, civil aviation, power industry, forestry and petrochemical industries. For lightning occurring in the detection network, the horizontal location error of ADTD is better than 500 meters and the height error is better than 1000 meters. The detection rate of CG flash is higher than 90%, and the detection rate of IC flash is higher than 45%. Table 1 lists the relevant parameters of APLLN and ADTD.

Table 1.
Comparison of detection network parameters.
5.1. Thunderstorm Process at 1:00~9:00 am on 26 May 2019
At 1:00 am on May 26, 2019, a thunderstorm process began in the southwestern region of Guangxi, China. The thunderstorm process lasted about 9 hours. The development process of the thunderstorm was well monitored by APLLN, which detected a total of 21,629 lightning strikes during this period. Figure 11 shows the distribution of lightning scattered points at different periods. The statistical analysis of lightning occurred in the areas from 107° E to 109° E and 21° N to 22.5° N. During the observation period, the trend of thunderstorm activity was from west to east, and gradually strengthened. The area affected by the thunderstorm reached its maximum around 4:00 am, and gradually dispersed eastward after 5:00 am, eventually forming a small-scale thunderstorm.
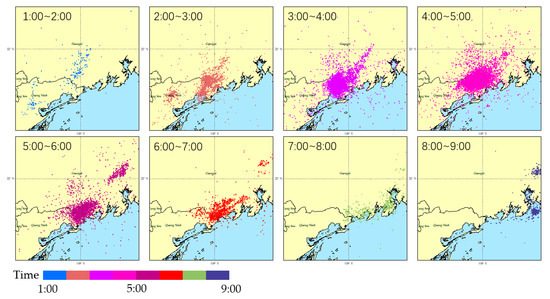
Figure 11.
A thunderstorm took place between 1:00 and 9:00 am on 26 May 2019, Beijing time. Different colors represent different time periods and each scattered dot represents a lightning. The range of thunderstorms is in the coastal areas of southwestern Guangxi, China.
Figure 12a shows the number of strokes detected by APLLN for different hours. It can be intuitively seen from the quantity that this thunderstorm has developed rapidly. The thunderstorm started at about 1:00 am, and the number of strokes peaked at about 4:00 am (8824 strokes were detected in one hour). Calculated based on the number of lightning occurrences per square kilometer, Figure 12b shows the distribution of stroke density during this thunderstorm (during 1:00 to 9:00 am). The thunderstorm showed obvious characteristics of aggregation and dispersal. During this thunderstorm (1:00 to 9:00 am), the stroke density was 65.5 per square kilometer. With the rapid release of atmospheric energy, the number of lightning occurrences has dropped rapidly in the late thunderstorm process.
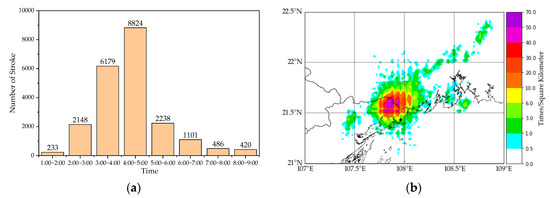
Figure 12.
(a) Number of strokes detected by APLLN for different hours. (b) Stroke density distribution during the thunderstorm (during 1:00 to 9:00 am).
5.2. Comparison of Asia-Pacific Lightning Location Network (APLLN) with Advanced Direction-Time Lightning Detection System (ADTD)
A comparative analysis of ADTD to the thunderstorm process in Section 5.1 shows that the detected lightning was a total of 26,165 strokes, including 5459 IC strokes and 20,706 CG strokes. IC strokes accounted for 20.9% of all lightning. The positive cloud-to-ground (+CG) strokes were 3875 times, accounting for 14.8% of all CG strokes. The average height of the IC stroke was 5.8 km. The maximum intensity of the positive intracloud (+IC) stroke was 160.7 kA, the minimum intensity was 5.6 kA, and the average intensity was 46.6 kA. The maximum intensity of negative intracloud strokes (–IC) was –198.7 kA, the minimum intensity was –6.2 kA, and the average intensity was –31.5 kA. Figure 13a shows the distribution of the number of CG strokes, IC strokes, and total strokes (CG + IC) in different periods. The distribution trend was consistent with the APLLN detection results. The number of strokes reached the maximum between 4:00 and 5:00 am and then began to decline rapidly. Figure 13b shows the percentage of IC and CG in total strokes at different times. It can be found that the thunderstorm process is the strongest between 3:00 and 5:00 am. At this time, the number of IC strokes remains above 20%. As the thunderstorm process subsides, the proportion of IC strokes also gradually decreases.
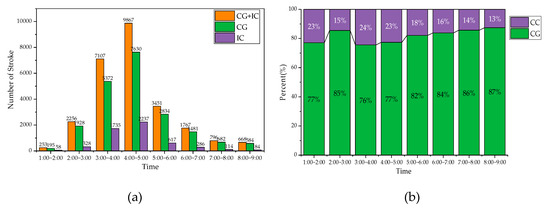
Figure 13.
(a) The distribution of lightning detection results of Advanced Direction-Time Lightning Detection System (ADTD) in different hours. Orange indicates all types of lightning, green indicates cloud-to-ground (CG) stroke, and purple indicates intracloud (IC) stroke. (b) IC and CG strokes as a percentage of total stroke in different hours.
5.2.1. Relative Detection Efficiency
From the overall observation results, the number of APLLN detections was 82.66% of ADTD (APLLN: 21629, ADTD: 26165). In order to determine the detection efficiency of APLLN relative to ADTD, it is necessary to identify shared events between the two networks. As for the lightning discrimination method of shared events, lightning detection networks in different regions have previously used several different criteria to define shared events. Lay et al. [36] and Rodger et al. [32] defined the criteria for shared events as time difference less than 3 ms and location deviation less than 50 km. Jacobson et al. [37] reduced the time difference between shared events to less than 1 ms, but the location deviation was less than 100 km. Srivastava et al. [11] used a time difference of 0.5 ms and a location deviation of 30 km. Rodger et al. [38] and Abreu et al. [39] found that if the time difference is less than 0.5 ms, the location deviation need not be considered.
Considering that the active area of the thunderstorm process studied in this paper was large, the shared events determination criteria used are: time deviation was less than 0.5 ms and the location deviation was less than 50 km. The spatial distance was calculated according to the WGS-84 coordinate system. The relative detection efficiency of APLLN was calculated according to the following formula:
A total of 16,179 lightning strokes detected by APLLN were shared with the events detected by ADTD, accounting for 61.83% of the total number of ADTD detected. The detection results of APLLN relative to ADTD in different periods are shown in Figure 14. On the other hand, 13,158 CG strokes and 3021 IC strokes events were detected by APLLN, accounting for 63.55% and 55.34% of the same type of lightning detected by ADTD, respectively. Generally, the intensity of cloud-to-ground discharge current is greater than IC stroke, which results in the detection efficiency of CG stroke by APLLN being higher than IC stroke.
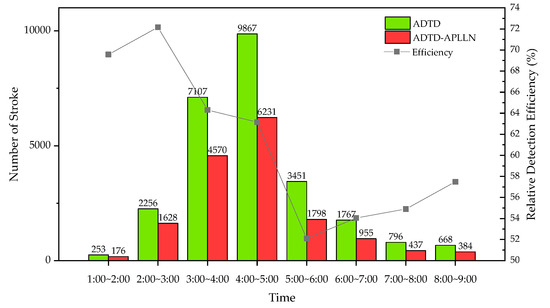
Figure 14.
Distribution of lightning quantity and detection efficiency at different periods. The green bars represent the detection results of ADTD in different time periods, the red bars represent the number of shared events between ADTD and APLLN in different time periods, and the points and lines represent the detection efficiency of APLLN relative to ADTD.
5.2.2. Relative Detection Accuracy
All shared events between ADTD and APLLN were evaluated for location accuracy. The ADTD location results used as a reference, the latitude deviation, longitude deviation, and azimuth deviation of the APLLN location results relative to ADTD were calculated. As shown in Figure 15a, the average deviation in latitude is 5.43 km, the standard deviation is 7.84 km, the average deviation in longitude is 4.35 km, and the standard deviation is 4.82 km. The average location error is 7.75 km, and the standard deviation is 8.55 km.
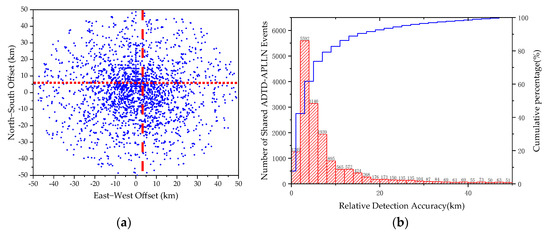
Figure 15.
(a) Location offsets between the shared strokes, taking each ADTD stroke as the origin and plotting the corresponding APLLN stroke relative to it (ADTD−APLLN). The mean north–south offset is 5.43 km, displayed as the dotted red line, and the mean east-west offset is 4.35 km, displayed as the dashed red line. (b) Distribution of relative location accuracy. The solid blue line indicates the cumulative percentage of shared events.
Figure 15b shows the number of distribution and normal distribution curve of shared events in different location deviation. It can be found that the deviation is mainly distributed within 8 km, and the number of 2 to 4 km intervals is the largest. This is consistent with the conclusions obtained in Section 4 using Monte Carlo simulations. Considering that ADTD uses ground wave signals, APLLN uses sky wave signals for location. The distance between the ADTD site and the lightning is usually tens of kilometers, and the distance between the APLLN site and the lightning is in the order of thousands of kilometers. Therefore, the location deviation of shared events is small, and the overall location accuracy meets the needs of meteorological observation.
5.2.3. Peak Current
The average positive peak current of shared events is 41.6 kA, and the average negative peak current is –34.3 kA, which is inconsistent with the data in Section 5.2 because the number of shared events is only part of the results of the ADTD detection. The peak current distributions of these shared events and the ADTD events are shown in Table 2.
Table 2.
The stroke detection efficiency of the APLLN relative to the ADTD under different peak current threshold.
The weaker strokes cannot be received by more or farther VLF detection sites. This leads to a positive correlation between the detection efficiency of APLLN and the intensity of lightning discharge. There is a large attenuation of the lightning signal during the propagation process. The propagation distance is greatly affected by the curvature of the Earth. Therefore, the detection efficiency of APLLN should increase as the discharge intensity increases. It can be found that the detection efficiency of APLLN gradually increases with the increase of the lightning peak current, and reaches maximum detection efficiency at 50 kA attachment, which is about 97.6%.
As the peak current continues to increase (>70kA), the detection efficiency of APLLN shows a downward trend. The signal processing system of the detection site has a waveform recognition function, which will filter out signals with the characteristics of near-field lightning radiation signals to prevent interference with location systems caused by signals like preliminary breakdown pulses. The electric field signal of a CG stroke will inevitably be removed when the signal-processing system removes the near-field radiation signal. The events counted in this article happened just inside the detection network. For high peak current strokes (>70 kA), although these signals travel at least 2000 km they still have obvious near-field characteristics. Many detection sites will directly ignore these signals, which directly leads to APLLN not having enough detection sites to locate these lightning strokes. As a result, the abnormally low detection efficiency of APLLN in Table 2. The significant decrease of CG detection efficiency in Table 2 illustrates this problem well.
5.3. Comparison with Lightning Accident
Lightning accidents can show the exact location of lightning and provide enough evidence to evaluate the performance of a lightning location network although it poses a great threat to human life. In this paper, two early-reported lightning accidents were selected. Concerning the location results of ADTD, the location results of these two events by APLLN were analyzed. The results of ADTD and APLLN are shown in Table 3. Event 1 occurred at 23:22:56 on 11 June 2019 (accident location: 26.58N, 106.469E). A CG stroke caused a lightning accident to the weather detection site in Qingzhen County, Guizhou Province, and damaged the Fengyun-3 Satellite signal receiver, visibility meter, weather phenomenon meter and other equipment. Within 1 second, there were 4 shared events between ADTD and APLLN. The minimum location deviation of ADTD was 0 m, the minimum location deviation of APLLN was 0.826 km, and the average relative location deviation was 6.17km. Event 2 occurred at 17:20:16 on 27 May 2019 (accident location: 22.231N, 108.849E). A CG stroke killed a villager and a cow in Qinzhou City, Guangxi Province. The location deviation of this event was 1.355 km for APLLN, and 1.262 km for ADTD. It can be seen from the location results of the two events that the accuracy of the ADTD detection network is generally several hundred meters, and APLLN is about 5 to 10 km.
Table 3.
The location results of the lightning location networks during two lightning accidents.
5.4. Comparison with World Wide Lightning Location Network (WWLLN)
This paper selected a large-scale thunderstorm weather that occurred on 22 March 2020, in southeast China (25°N-30°N, 112.8°E-121.4°E) to further evaluate the lightning positioning effect of APLLN under different climatic conditions, and compared and evaluated the location data of APLLN and WWLLN. Both detection networks work in the VLF band, and the lightning location results in each period are shown in Figure 16. Between 13:00 and 19:00, APLLN and WWLLN detected 6126 and 1470 lightning strokes in this area, respectively. The thunderstorm developed from west to east, and the scope of influence gradually expanded. Comparing these two results, it can be seen that both APLLN and WWLLN can well reflect the moving trend of thunderstorms, but the number of lightning strokes detected by APLLN was greater and the detection efficiency was higher.
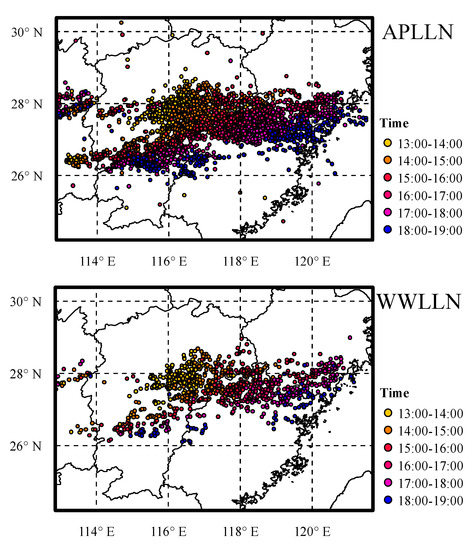
Figure 16.
A thunderstorm occurred in southeast China. The figure shows the lightning location results of APLLN and World Wide Lightning Location Network (WWLLN), respectively. Each scatters represents a detected lightning stroke, with different colors indicating when the lightning occurred.
Considering the quantity and distribution of APLLN and WWLLN sites in the surrounding areas of China, the number of WWLLN sites is less than APLLN and the baseline length of WWLLN is larger than APLLN. Details are shown in Table 4. This is the main reason why WWLLN detects fewer lightning events than APLLN. WWLLN mainly detects the strong discharge process, while APLLN can detect the lightning with weaker intensity. As described in Section 5.2.3 above, the detection efficiency of APLLN for the discharge process of less than 10 kA can reach 18.69%.
Table 4.
The number of sites and the baseline of APLLN and WWLLN in the surrounding areas of China.
6. Conclusions
For the first time, this paper introduced the deployment of the VLF lightning location network in the Asia-Pacific region, the performance parameters of the detection site, the lightning signal-processing method, and the location algorithm. APLLN has made the following improvements in the detector software and hardware to achieve higher lightning detection efficiency and measurement accuracy:
- (1)
- It used higher sampling rate (500 kSPS), digital filtering and the Hilbert envelope method to obtain the arrival time of lightning.
- (2)
- It was based on the FPGA + ARM system, real-time storage and network transmission of lightning waveforms were facilitated to improve the research on VLF lightning location algorithms and ground-ionospheric waveguide theory.
- (3)
- It used solar power to eliminate the interference of AC (Alternating Current) power on the signal acquisition system.
- (4)
- The initial solution of lightning location was obtained by using the spherical triangle location algorithm, and the propagation velocity was introduced as an optimization factor into the Levenberg–Marquardt non-linear least square algorithm to optimize the lightning location results.
- (5)
- APLLN can achieve relatively high detection efficiency with few detection sites to save hardware resources and the number of sites.
Through algorithm simulation, it was theoretically verified that APLLN has good location accuracy and a large detection range, and the average location error within the network was less than 2 km (Section 4.2). The process of a thunderstorm that occurred in the detection network was analyzed, and the detection efficiency and location accuracy of APLLN were given from the actual measurement results. The detection efficiency of APLLN relative to ADTD was 61.83%, the relative detection efficiency of a CG stroke was 63.55%, and the IC stroke was 55.34%. The average location error of APLLN relative to ADTD was 7.75km, and the standard deviation was 8.55 km. In the comparative analysis of lightning accidents, APLLN had high location performance, and location accuracy was 5–10 km.
As a low-frequency system, APLLN currently has only 16 detection sites. Compared with ADTD (there are more than 300 sites, but the detection range is still limited to China), APLLN can obtain a larger detection range at a lower cost. Due to the problem with the signal-processing method (Section 5.2.3), APLLN has a huge weakness in that it cannot detect energetic strokes within the network. In future work, we will use other signal-processing methods to classify lightning electromagnetic signals (such as machine learning), as well as accurately remove interference signals and improve the detection efficiency of energetic strokes. It is worth mentioning that APLLN is still under construction and being upgraded, and some upgrades will be continuously carried out in the future to improve the detection efficiency and location accuracy of the detection network.
Author Contributions
Conceptualization: J.W., Q.M., X.Z., S.C., J.H., H.W., F.X., S.Y., and Q.H.; Investigation: J.W., Q.M., X.Z., S.C., J.H., H.W., F.X., S.Y., and Q.H.; Data curation: J.W., X.Z., F.X., and S.Y.; Methodology: J.W., Q.M., X.Z., S.C., J.H., H.W., F.X., S.Y., and Q.H.; Software: J.W., X.Z., F.X., and S.Y.; Writing—original draft: J.W., Q.M., X.Z., S.C., J.H., H.W., F.X., S.Y. and Q.H.; Writing–review and editing: J.W., Q.M., X.Z., S.C., J.H., H.W., F.X., S.Y. and Q.H. All authors have read and agreed to the published version of the manuscript.
Funding
This work was supported by the Chinese Academy of Sciences Key Deployment Project (Grant No. KFZD-SW-432).
Acknowledgments
The authors thank all personnel and meteorological departments involved in the construction of the APLLN site, lightning data collection, and processing. The author would also like to thank the reviewers for their helpful feedback, which significantly improved the manuscript.
Conflicts of Interest
The authors declare no conflict of interest.
References
- Rakov, V.A. Electromagnetic Methods of Lightning Detection. Surv. Geophys. 2013, 34, 731–753. [Google Scholar] [CrossRef]
- Krider, E.P.; Noggle, R.C.; Uman, M.A. A Gated, Wideband Magnetic Direction Finder for Lightning Return Strokes. J. Appl. Meteorol. 1976, 15, 301–306. [Google Scholar] [CrossRef]
- Wu, T.; Wang, D.; Takagi, N. Lightning Mapping with an Array of Fast Antennas. Geophys. Res. Lett. 2018, 45, 3698–3705. [Google Scholar] [CrossRef]
- Rison, W.; Thomas, R.J.; Krehbiel, P.R.; Hamlin, T.; Harlin, J. A GPS-based three-dimensional lightning mapping system: Initial observations in central New Mexico. Geophys. Res. Lett. 1999, 26, 3573–3576. [Google Scholar] [CrossRef]
- Wang, J.; Huang, Q.; Ma, Q.; Chang, S.; He, J.; Wang, H.; Zhou, X.; Xiao, F.; Gao, C. Classification of VLF/LF Lightning Signals Using Sensors and Deep Learning Methods. Sensors 2020, 20, 1030. [Google Scholar] [CrossRef] [PubMed]
- Cummins, K.L.; Murphy, M.J. An Overview of Lightning Locating Systems: History, Techniques, and Data Uses, With an In-Depth Look at the U.S. NLDN. IEEE Trans. Electromagn. Compat. 2009, 51, 499–518. [Google Scholar] [CrossRef]
- Poelman, D.R.; Schulz, W.; Diendorfer, G.; Bernardi, M. European cloud-to-ground lightning characteristics. In Proceedings of the 2014 International Conference on Lightning Protection (ICLP); 2014; pp. 24–29. [Google Scholar]
- Dowden, R.L.; Brundell, J.B.; Rodger, C.J. VLF lightning location by time of group arrival (TOGA) at multiple sites. J. Atmos. Solar-Terr. Phys. 2002, 64, 817–830. [Google Scholar] [CrossRef]
- Rodger, C.J.; Brundell, J.B.; Hutchins, M.; Holzworth, R.H. The world wide lightning location network (WWLLN): Update of status and applications. In Proceedings of the 2014 XXXIth URSI General Assembly and Scientific Symposium (URSI GASS), Beijing, China, 16–23 August 2014; pp. 1–2. [Google Scholar] [CrossRef]
- Smith, D.A.; Eack, K.B.; Harlin, J.; Heavner, M.; Jacobson, A.R.; Massey, R.S.; Shao, X.M.; Wiens, K.C. The Los Alamos Sferic Array: A research tool for lightning investigations. J. Geophys. Res. Space Phys. 2002, 107, ACL 5-1. [Google Scholar] [CrossRef]
- Srivastava, A.; Tian, Y.; Qie, X.; Wang, N.; Sun, Z.; Yuan, S.; Wang, Y.; Chen, Z.; Xu, W.; Zhang, H.; et al. Performance assessment of Beijing Lightning Network (BLNET) and comparison with other lightning location networks across Beijing. Atmos. Res. 2017, 197, 76–83. [Google Scholar] [CrossRef]
- Wang, Y.; Qie, X.; Wang, N.; Liu, M.; Su, D.; Wang, Z.; Liu, D.; Wu, Z.; Sun, Z.; Tian, Y. Beijing Lightning Network (BLNET) and the observation on preliminary breakdown processes. Atmos. Res. 2016, 171, 121–132. [Google Scholar] [CrossRef]
- Pázman, A. Nonlinear least squares—Uniqueness versus ambiguity. Ser. Stat. 1984, 15, 323–336. [Google Scholar] [CrossRef]
- Markwardt, C.B. Non-Linear Least Squares Fitting in IDL with MPFIT. In Proceedings of the Astronomical Data Analysis Software and Systems XVIII, Quebec City, QC, Canada, 2–5 November 2009; Volume 411, pp. 251–254. [Google Scholar]
- Liu, B.; Shi, L.; Qiu, S.; Liu, H.; Dong, W.; Li, Y.; Sun, Z. Fine Three-Dimensional VHF Lightning Mapping Using Waveform Cross-Correlation TOA Method. Earth Space Sci. 2020, 7. [Google Scholar] [CrossRef]
- Lee, A.C.L. An experimental study of the remote location of lightning flashes using a VLF arrival time difference technique. Q. J. R. Meteorol. Soc. 1986, 112, 203–229. [Google Scholar] [CrossRef]
- Liu, Z.; Koh, K.L.; Mezentsev, A.; Enno, S.-E.; Sugier, J.; Füllekrug, M. Lightning Sferics: Analysis of the Instantaneous Phase and Frequency Inferred from Complex Waveforms. Radio Sci. 2018, 53, 448–457. [Google Scholar] [CrossRef]
- Feldman, M. Hilbert Transform, Envelope, Instantaneous Phase, and Frequency. In Encyclopedia of Structural Health Monitoring; Boller, C., Chang, F.K., Fujino, Y., Eds.; John Wiley & Sons: Hoboken, NJ, USA, 2009; pp. 1–16. [Google Scholar]
- Proctor, D.E. A hyperbolic system for obtaining VHF radio pictures of lightning. J. Geophys. Res. Space Phys. 1971, 76, 1478–1489. [Google Scholar] [CrossRef]
- Proctor, D.E. VHF radio pictures of cloud flashes. J. Geophys. Res. Space Phys. 1981, 86, 4041. [Google Scholar] [CrossRef]
- Proctor, D.E.; Uytenbogaardt, R.; Meredith, B.M. VHF radio pictures of lightning flashes to ground. J. Geophys. Res. Space Phys. 1988, 93, 12683. [Google Scholar] [CrossRef]
- Passi, R.M.; López, R.E. A parametric estimation of systematic errors in networks of magnetic direction finders. J. Geophys. Res. Space Phys. 1989, 94, 13319. [Google Scholar] [CrossRef]
- Thomas, R.J.; Krehbiel, P.R.; Rison, W.; Hunyady, S.J.; Winn, W.P.; Hamlin, T.; Harlin, J. Accuracy of the Lightning Mapping Array. J. Geophys. Res. Space Phys. 2004, 109. [Google Scholar] [CrossRef]
- Cummins, K.L.; Murphy, M.J.; Bardo, E.A.; Hiscox, W.L.; Pyle, R.B.; Pifer, A.E. A Combined TOA/MDF Technology Upgrade of the U.S. National Lightning Detection Network. J. Geophys. Res. Space Phys. 1998, 103, 9035–9044. [Google Scholar] [CrossRef]
- Betz, H.D.; Schmidt, K.; Laroche, P.; Blanchet, P.; Oettinger, W.P.; Defer, E.; Dziewit, Z.; Konarski, J. LINET—An international lightning detection network in Europe. Atmos. Res. 2009, 91, 564–573. [Google Scholar] [CrossRef]
- Lyu, F.; Cummer, S.A.; Solanki, R.; Weinert, J.; McTague, L.; Katko, A.; Barrett, J.; Zigoneanu, L.; Xie, Y.; Wang, W. A low-frequency near-field interferometric-TOA 3-D Lightning Mapping Array. Geophys. Res. Lett. 2014, 41, 7777–7784. [Google Scholar] [CrossRef]
- Moré, J.J. The Levenberg-Marquardt algorithm: Implementation and theory. Universitext 1978, 630, 105–116. [Google Scholar]
- Marquardt, D.W. An Algorithm for Least-Squares Estimation of Nonlinear Parameters. J. Soc. Ind. Appl. Math. 1963, 11, 431–441. [Google Scholar] [CrossRef]
- Levenberg, K. A method for the solution of certain non-linear problems in least squares. Q. Appl. Math. 1944, 2, 164–168. [Google Scholar] [CrossRef]
- Bitzer, P.M.; Christian, H.J.; Stewart, M.; Burchfield, J.; Podgorny, S.; Corredor, D.; Kuznetsov, E.; Franklin, V.; Hall, J. Characterization and applications of VLF/LF source locations from lightning using the Huntsville Alabama Marx Meter Array. J. Geophys. Res. Atmos. 2013, 118, 3120–3138. [Google Scholar] [CrossRef]
- Koshak, W.J.; Solakiewicz, R.J.; Blakeslee, R.J.; Goodman, S.; Christian, H.J.; Hall, J.M.; Bailey, J.C.; Krider, E.P.; Bateman, M.G.; Boccippio, D.J.; et al. North Alabama Lightning Mapping Array (LMA): VHF Source Retrieval Algorithm and Error Analyses. J. Atmos. Ocean. Technol. 2004, 21, 543–558. [Google Scholar] [CrossRef]
- Rodger, C.J.; Brundell, J.B.; Dowden, R.L. Location accuracy of VLF World-Wide Lightning Location (WWLL) network: Post-algorithm upgrade. Ann. Geophys. 2005, 23, 277–290. [Google Scholar] [CrossRef]
- Rodger, C.J.; Brundell, J.B.; Dowden, R.L.; Thomson, N.R. Location accuracy of long distance VLF lightning locationnetwork. Ann. Geophys. 2004, 22, 747–758. [Google Scholar] [CrossRef]
- Smith, D.A.; Heavner, M.; Jacobson, A.R.; Shao, X.M.; Massey, R.S.; Sheldon, R.J.; Wiens, K.C. A method for determining intracloud lightning and ionospheric heights from VLF/LF electric field records. Radio Sci. 2004, 39, 1–11. [Google Scholar] [CrossRef]
- Liu, F.F.; Qin, Z.L.; Zhu, B.Y.; Ma, M.; Chen, M.L.; Shen, P. Observations of ionospheric D layer fluctuations during sunrise and sunset by using time domain waveforms of lightning narrow bipolar events. Chin. J. Geophys. Chin. Ed. 2018, 61, 484–493. [Google Scholar] [CrossRef]
- Lay, E.H. WWLL global lightning detection system: Regional validation study in Brazil. Geophys. Res. Lett. 2004, 31. [Google Scholar] [CrossRef]
- Jacobson, A.R.; Holzworth, R.; Harlin, J.; Dowden, R.; Lay, E.H. Performance Assessment of the World Wide Lightning Location Network (WWLLN), Using the Los Alamos Sferic Array (LASA) as Ground Truth. J. Atmos. Ocean. Technol. 2006, 23, 1082–1092. [Google Scholar] [CrossRef]
- Rodger, C.J.; Werner, S.; Brundell, J.B.; Lay, E.H.; Thomson, N.R.; Holzworth, R.H.; Dowden, R.L. Detection efficiency of the VLF World-Wide Lightning Location Network (WWLLN): Initial case study. Ann. Geophys. 2006, 24, 3197–3214. [Google Scholar] [CrossRef]
- Abreu, D.; Chandan, D.; Holzworth, R.H.; Strong, K. A performance assessment of the World Wide Lightning Location Network (WWLLN) via comparison with the Canadian Lightning Detection Network (CLDN). Atmos. Meas. Tech. 2010, 3, 1143–1153. [Google Scholar] [CrossRef]
© 2020 by the authors. Licensee MDPI, Basel, Switzerland. This article is an open access article distributed under the terms and conditions of the Creative Commons Attribution (CC BY) license (http://creativecommons.org/licenses/by/4.0/).