Article

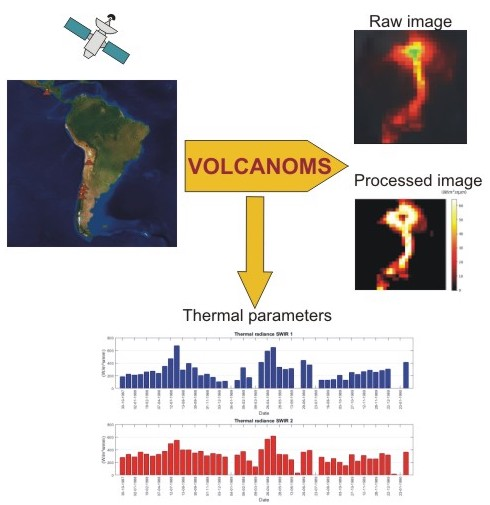
Volcanic Anomalies Monitoring System (VOLCANOMS), a Low-Cost Volcanic Monitoring System Based on Landsat Images

1
Programa de Doctorado en Ciencias mención Geología, Universidad Católica del Norte, Avenida Angamos 0610, Antofagasta 1270709, Chile
2
Núcleo de Investigación en Riesgo Volcánico–Ckelar Volcanes, Universidad Católica del Norte, Avenida Angamos 0610, Antofagasta 1270709, Chile
3
Centro de Investigación para la Gestión Integrada del Riesgo de Desastres (CIGIDEN), Av. Vicuña Mackenna 4860, Santiago 7810000, Chile
4
Departamento de Ciencias Geológicas, Universidad Católica del Norte, Avenida Angamos 0610, Antofagasta 1270709, Chile
5
Departamento de Ingeniería de Sistemas y Computación, Universidad Católica del Norte, Avenida Angamos 0610, Antofagasta 1270709, Chile
6
Departamento de Geofísica, Universidad de Concepción, Avenida Esteban Urra s/n–Barrio Universitario, Concepción 4070386, Chile
*
Author to whom correspondence should be addressed.
Remote Sens. 2020, 12(10), 1589; https://doi.org/10.3390/rs12101589
Submission received: 15 April 2020 / Revised: 14 May 2020 / Accepted: 14 May 2020 / Published: 16 May 2020
(This article belongs to the Section Remote Sensing Image Processing)

Abstract

:
The practice of monitoring active volcanoes, includes several techniques using either direct or remote measurements, the latter being more important for volcanoes with limited accessibility. We present the Volcanic Anomalies Monitoring System (VOLCANOMS), a new, online, low-cost and semiautomatic system based on Landsat imagery. This system can detect permanent and/or temporal thermal anomalies in near-infrared (NIR), short-wave infrared (SWIR), and thermal infrared (TIR) bands. VOLCANOMS allows researchers to calculate several thermal parameters, such as thermal radiance, effective temperature, anomaly area, radiative, gas, convective, and total heat, and mass fluxes. We study the eruptive activity of five volcanoes including Krakatau, Stromboli, Fuego, Villarrica and Lascar volcanoes, comparing field and eruptive data with thermal radiance. In the case of Villarrica and Lascar volcanoes, we also compare the thermal radiance and eruptive activity with seismic data. The thermal radiance shows a concordance with the eruptive activity in all cases, whereas a correlation is observed between thermal and seismic data both, in Villarrica and Lascar volcanoes, especially in the case of long-period seismicity. VOLCANOMS is a new and powerful tool that, combined with other techniques, generates robust information for volcanic monitoring.

Graphical Abstract

1. Introduction

Monitoring of active and/or potentially active volcanoes requires several techniques and instruments, such as seismometers, inclinometers, gravimeters, gas spectrometers, direct gas sampling, and video surveillance, among others. However, some of these techniques are not completely useful during eruptive processes, due to the high ash content, which prevents accurate measurement of SO2 with ground-based techniques, such as UV cameras or spectrometers [1,2], and because it is impossible to access fumarolic vents for direct sampling. Some of the monitoring equipment is also expensive, resulting in budget dependence for a good quality-monitoring network. Further, several volcanoes are located in remote areas, and thus, they are not prioritized for monitoring because they do not represent hazardous centers for population and/or infrastructure. Such remote locations also make the installation of monitoring networks difficult because of poor access and the high expense. One of the most useful and, in several cases, easiest low-cost implementations for volcanic monitoring is the use of satellite images [3,4,5,6,7]. This technique includes a wide spectrum of satellites and images at several spatial, spectral, temporal, and radiometric resolutions, providing easy and free access in some cases [8,9,10].
The use of satellite images in volcanology started during the 1960s, when High-Resolution Infrared Radiometer (HRIR) sensors were used to compare the thermal radiance of the Manua Loa and Kilauea volcanoes [11]. Since then, the use of satellite images has been considered an option for studying active volcanoes, being mainly utilized to detect hot spots related to volcanic activity, eruption chronology, time series studies, and heat and mass flux studies [12]. According to Ramsey and Harris [13], 2000 was the pivotal year for volcanology based on satellite images, mainly in terms of the appearance and development of online and automated hot-spot detection. One of the most used automated systems is MODVOLC [14], which is based on low spatial-resolution infrared images from a Moderate-resolution Imaging Spectroradiometer (MODIS). MODVOLC is an algorithm that allows researchers to detect volcanic thermal anomalies in near-real time, releasing information, such as location and emitted spectral radiance, as well as time for both persistent and sporadically active volcanoes [14]. Currently, MODVOLC is used to monitor volcanoes around the world, and it is utilized as a complementary tool in several volcanic observatories [15]. Labazuy et al. [16] introduced a new system, HVOS (HotVolc Observing System), based on a SEVIRI sensor (Meteosat Second Generation satellite), which provides images every 15 minutes and allows researchers to determinate metrical (ash cloud top height) and positional (location of ash plume) parameters of ash plumes in near-real time. Gouhier et al. [17] presented an update of HVOS, currently named HOTVOLC, which added images from MTSAT and GOES satellites. The HOTVOLC system allows researchers to monitor effusive activity, providing quantitative information such as lava flow volumes and discharge rates. A new algorithm for a satellite image-based monitoring system is MIROVA (Middle InfraRed Observation of Volcanic Activity), in which hot-spot detection is carried out using MODIS satellite images [18]. The system combines qualitative and quantitative characteristics, such as variations in thermal output related to volcanic activity. This helps researchers identify, estimate, and track the discharge of lava flows and their discharge rates and to determine the cooling process of lava bodies. A common characteristic of these systems is the use of high temporal-resolution (several images per day) but low spatial-resolution (pixel size >1 km) images. MOUNTS (Monitoring Unrest from Space), the most recent platform, is based on a multi-satellite processing system using Sentinel-1 (SAR), Sentinel-2 and Sentinel-5P (TROPOMI) data. MOUNTS combines Sentinel satellite data, as well as seismic information from GEOFON and an earthquake catalog available from the global network of the US Geological Survey (USGS), all processed with artificial intelligence. The parameters obtained are ground deformation, heat anomalies, SO2 emission rates, and local seismicity [9]. Vhub (http://vhub.org; [19]), an online system, is a platform created with the objective to produce collaborative work in volcanology. It has several purposes, such as code development, field research, education and hazard mitigation, also host processing codes for satellite images (e.g., Ozone Monitoring Instrument - OMI).
Single satellites have also been used for decades for volcanic monitoring, not necessarily based on automated and online systems. One of the most successful satellites used for volcanic surveillance corresponds to the Advanced Spaceborne Thermal Emission and Reflection Radiometer (ASTER). Characterized by its high spatial resolution, ASTER has been widely used to study crater lake dynamics [20], pre-eruptive and eruptive processes [21,22], and combined with MODIS, in order to better detect thermal anomalies [23,24], amongst other applications. Another satellite system able to detect volcanic activity with high spatial resolution is the Landsat platform (e.g., [25,26,27]), which has a wide inventory of images taken since 1972, as well as images of currently active volcanoes. Access is free and images are downloadable from https://earthexplorer.usgs.gov or https://www.landsatlook.usgs.gov. Landsat has four sensors aboard seven satellites corresponding to the Multispectral Scanning System (MSS), Thematic Mapper (TM), Enhanced Thematic Mapper Plus (ETM+), and Operational Land Imager (OLI), with pixel sizes varying from 15 m to 120 m and bands that use visible (VIS), near-infrared (NIR), short-wave infrared (SWIR), and thermal infrared (TIR) electromagnetic spectra. The radiometric resolution varies between 8 (TM and ETM+) and 16 bits (OLI), the last is an improvement that reduces the probability of pixel saturation, and consequently, avoids the reset to zero value of the pixel. Additionally, the revisit period is 16 days for each satellite, but the image acquisition frequency has increased since April 1999 when TM and ETM+ sensors operated simultaneously. Although the TM sensor was deactivated on June 2013, the acquisition frequency remained constant, since in February 2013 the ETM+ and OLI sensors operated at the same time. Several works related with volcanic monitoring based on Landsat imagery have been carried out, mainly focused on eruptive activity [28], determine heat and mass fluxes [29], lava flows and domes dynamics [30,31,32], among others. The most recent algorithm focused on mapping of volcanic thermal anomalies, corresponding to Normalized Hotspot Indices (NHI), which is able to detect both, subtle and intense anomalies, even under cloudy/volcanic plume and daylight conditions [33].
In this work, we introduce a new volcanic monitoring platform, named Volcanic Anomalies Monitoring System (VOLCANOMS), which is a low-cost, and semiautomatic system, based on the use of Landsat TM, ETM+, and OLI images to detect permanent and/or transient thermal anomalies related to volcanic activity, using a database which is available from December 1984. This system can calculate thermal radiance, thermal anomaly area, brightness and effective temperatures, radiative fluxes, convective fluxes, and total heat and mass fluxes. In this paper, we present the physical parameters that govern the VOLCANOMS system, the software for image processing, and the online platform for data visualization. Additionally, we present data from five case studies, corresponding to the Krakatau, Stromboli, Fuego, Villarrica and Lascar volcanoes. In the cases of Villarrica and Lascar volcanoes, a detailed study is presented, combining thermal parameters with seismic data. The aim of this work is to validate the system at different volcanoes around the world, tracking and quantifying thermal parameters related to the eruptive activity of each study case.

2. Physical Parameters for Detecting and Quantifying Thermal Anomalies Using Landsat Images

2.1. Calculating Thermal Radiance

The original information received by a satellite corresponds to the spectral radiance, which is a combination of thermal radiance (radiance emitted from a volcanic anomaly), non-thermal radiance (radiance emitted from non-thermal feature), and upwelling radiance (radiance dispersed through the atmospheric column over a single surface). Spectral radiance is expressed as follows [34],
R λ = τ λ ε λ L ( λ , T ) + τ λ ρ λ R λ , D + R λ , U
which can be rearranged as,
R λ , t h e r m a l = R λ ( R λ , n o n t h e r m a l + R λ , U )
where,
  • R λ = Spectral radiance recorded by a satellite in a specific wavelength ( W / m 2 s r μ m ) .
  • τ λ = Transmisivity or atmospheric spectral transmission coefficient
  • ε λ = Spectral emissivity
  • L ( λ , T ) = Distribution Planck’s function
  • ρ λ = Spectral reflectivity
  • R λ , D = Downwelling spectral radiance (radiation reflected by a surface; W / m 2 s r μ m )
  • R λ , U = Upwelling spectral radiance ( W m 2 s r μ m )
The distribution Planck´s function is defined as follows,
L ( λ , T ) = c 1 π λ 5 [ e ( C 2 / λ T ) 1 ]
where:
  • T = temperature of a body surface in Kelvin (K)
  • C 1 = 3.74 × 10 8   W μ m 4 / m 2
  • C 2 = 1.44 × 10 4   μ mK
  • λ = wavelength μ m
In the case of Landsat images, the total spectral radiance captured by the sensor can be calculated from the digital number of each pixel in a specific wavelength (DNλ) using the following equation [35]:
R λ = G λ D N λ + B λ
where,
  • G = Band-specific rescaling gain factor ( W / m 2 s r μ m ) / D N
  • B = Band-specific rescaling bias factor W / m 2 s r μ m
In the case of Landsat OLI, G is equivalent to ML and B to AL, corresponding to multiplicative and additive rescaling factors, respectively. An alternative option for calculating the spectral radiance is [35],
R λ = L M I N λ + ( L M A X λ L M I N λ D N λ M A X ) D N λ
where,
  • L M I N λ = Spectral radiance for DN = 0 in a specific wavelength ( W / m 2 s r μ m )
  • L M A X λ = Spectral radiance for maximum DN in a specific wavelength ( W / m 2 s r μ m )
  • D N M A X = 255 for TM and ETM+ and 65,535 for OLI
LMIN and LMAX represent the spectral radiance for each band and type of image, corresponding to the radiometric calibration coefficient available for each Landsat sensor [35]. Both radiance calculation methods are equivalent, where Bλ corresponds to LMINλ and Gλ corresponds to (LMAXλ − LMINλ)/QcalmaxQcalmin, where Q is the minimum quantized calibrated pixel value corresponding to LMAXλ and LMINλ, respectively [35].
The bands used to detect thermal anomalies, and consequently, the thermal radiance are bands 5, 6, and 7 in the case of Landsat TM and ETM+ and bands 6, 7, and 10 for Landsat OLI because of their capacity to detect thermal features in the infrared spectrum at temperatures that range from −134 to 440 °C [26]. In some cases, volcanic features have temperatures >500 °C, which can be detected with bands 4 and 5 for Landsat TM/ETM+ and OLI, respectively.
According to Equation (1), the total radiance captured by the sensor is also affected by downwelling and upwelling spectral radiances. However, downwelling spectral radiance does not contribute significantly to the TIR bands (6 in Landsat TM, 6.1 and 6.2 in Landsat ETM+, and 10 in OLI), whereas the upwelling spectral radiance does not affect the SWIR bands (5, 7 in TM/ETM+ and 6, 7 in OLI) [36]. Consequently, the respective equations to calculate the thermal radiances for the TIR and SWIR bands are,
R T I R , t h e r m a l = R T I R R T I R , U
and
R S W I R , t h e r m a l = R S W I R R S W I R , n o t h e r m a l

2.2. Corrections

Prior to calculating thermal radiance, several corrections need to be applied to avoid sensor noises and atmospheric effects, and to better identify thermal anomalies. These corrections are only applied to SWIR bands; the processing of TIR bands will be explained in the Section 2.5.
The first correction corresponds to the sensor noise (correcting for discrepancies in SWIR band calibrations), where 3 and 5 units in each pixel DN must be subtracted from the original pixel DN for bands 5, and 7, respectively (this is only applied to Landsat TM and ETM+ images; this is not necessary for Landsat OLI images). However, when the pixel is saturated (DN = 255), this correction is not applied because it represents the maximum energy captured by the sensor.
To better identify thermal anomalies from the background and remove solar/atmospheric effects, Oppenheimer et al. [34] established the pixel-by-pixel method. This method consists of using a single band that is not affected by the thermal anomaly, usually NIR bands, which is band 4 for Landsat TM/ETM+ and 5 for Landsat OLI. In this case, the NIR band is compared with SWIR bands affected by the thermal anomaly (bands 5 and 7 for Landsat TM/ETM+, bands 6 and 7 for Landsat OLI):
D N S W I R 1 , t h e r m a l = D N S W I R 1 a n o m a l o u s D N N I R a n o m a l o u s ( D N S W I R 1 D N N I R ) a v e r a g e n o n a n o m a l o u s
D N S W I R 2 , t h e r m a l = D N S W I R 2 a n o m a l o u s D N N I R a n o m a l o u s ( D N S W I R 2 D N N I R ) a v e r a g e n o n a n o m a l o u s .
In cases where thermal anomalies are also detected in bands 4 (Landsat TM/ETM+) and 5 (Landsat OLI), the comparison must be done with bands 3 and 4 for Landsat TM/ETM+ and OLI, respectively. One of the problems with the pixel-by-pixel method is the selection of anomalous and non-anomalous pixels, which is carried out subjectively by the user according to anomalies identified from SWIR bands. Once the pixel-by-pixel method is applied, in order to avoid subjectivity, it is necessary to apply the Wooster and Rothery [37] method, where a thermal pixel threshold (all pixels related to the thermal anomaly) is calculated using the mean (μ) and standard deviation (σ) from non-thermal DN pixels using the following equation:
D N t h r e s h o l d = μ n o n t h e r m a l + 3 σ n o n t h e r m a l .
Consequently, once all the corrections are applied, each DNDNthreshold can be considered a thermal pixel.

2.3. Three Bands and Three Components Method

The Three Bands and Three Components Method (TBTCM) proposed by Harris et al. [38,39] allows researchers to determine a series of thermal parameters. This method is based in the premise that a fraction of a pixel is occupied by a cold crust (Pc) with a cold temperature (Tc), whereas another fraction is occupied by hot fractures, hot cracks, or fumaroles (Ph) with a hot temperature (Th). Part of the pixel, which includes the thermal fraction, is not only occupied by those two components but also a third component is present, corresponding to a portion of the pixel with no thermal anomaly (background), which covers an area Pb with a temperature Tb. All these elements can be related in a series of three equations to calculate the thermal radiance in the TIR band (bands 6 and 10 for TM/ETM+ and OLI, respectively), the integrated radiance for the SWIR1 band (bands 5 and 6 for TM/ETM+ and OLI, respectively), and the SWIR2 band (band 7 for TM/ETM+ and OLI), which are expressed as follows:
R T I R = τ T I R ε T I R [ P b L ( λ T I R , T b ) + P h L ( λ T I R , T h ) + ( 1 P b P h ) L ( λ T I R , T c ) ]
R S W I R 1 i n t . = τ S W I R 1 ε S W I R 1 [ P b L ( λ S W I R 1 , T b ) + P h L ( λ S W I R 1 , T h ) + ( 1 P b P h ) L ( λ S W I R 1 , T c ) ]
R S W I R 2 = τ S W I R 2 ε S W I R 2 [ P b L ( λ S W I R 2 , T b ) + P h L ( λ S W I R 2 , T h ) + ( 1 P b P h ) L ( λ S W I R 2 , T c ) ]
As the background (or ambient) area Pb is the same in all bands, equation 11 can be rearranged as follows:
P b = [ R T I R τ T I R ε T I R L ( λ T I R , T T I R ) + P h L ( λ T I R , T c ) P h L ( λ T I R , T h ) L ( λ T I R , T b ) L ( λ T I R , T c ) ]
where
  • A x = L x ( T b ) L x ( T c )
  • B x = L x ( T h ) L x ( T c )
  • C x = R x , t e r m a l τ x ε x L x ( T c )
To solve the series formed by Equations (11)–(13), Equation (14) replaces Equations (12) and (13). To simplify the solution of the equations, all the elements involved are expressed as follows:
C T I R P h B T I R A T I R = C S W I R 1 P h B S W I R 1 A S W I R 1
C T I R A T I R P h ( B T I R A T I R ) = C S W I R 1 A S W I R 1 P h ( B S W I R 1 A S W I R 1 )
P h ( B S W I R 1 A S W I R 1 ) P h ( B T I R A T I R ) = C S W I R 1 A S W I R 1 C T I R A T I R
P h ( B S W I R 1 A S W I R 1 B T I R A T I R ) = C S W I R 1 A S W I R 1 C T I R A T I R
P h = C S W I R 1 A T I R C T I R A S W I R 1 A S W I R 1 A T I R A S W I R 1 A T I R B S W I R 1 A T I R B T I R A S W I R 1
P h = C S W I R 1 A T I R C T I R A S W I R 1 B S W I R 1 A T I R B T I R A S W I R 1 / A T I R / A T I R
P h = C S W I R 1 A S W I R 1 ( C T I R A T I R ) B S W I R 1 A S W I R 1 ( B T I R A T I R )
The term-integrated radiance of Equations (12) and (13) stems from the differences of pixel size between the TIR and SWIR bands, where one pixel of a TIR band (120 and 60 m pixel size for TM and ETM+, respectively) corresponds (is equivalent) to 16 and 4 pixels in the SWIR bands for TM and ETM+ sensors, respectively. Consequently, the most radiant pixel of the TIR band contains the most radiant pixels of the SWIR bands [38]. It is then necessary integrate the radiance of all pixels from the SWIR bands contained in one pixel of TIR band 6, which can be calculated as follows,
R x , i n t = i = 1 n ( 1 n R x , t h e r m a l )
where n is the number of pixels (SWIR bands) within one anomalous pixel of a TIR band. In the case of OLI images, the pixel size of TIR bands is 100 m, and it has no equivalence with SWIR band pixels. The procedure for applying TBTCM to OLI images is explained in Section 2.6.
Once the previous equations are solved, the thermally radiant or thermally anomalous areas ( A l a v a o r A f ) can be calculated as follows,
A l a v a = ( 1 P b ) A p i x e l
where Apixel is the area (m2) occupied by the thermally anomalous pixel of the TIR band.
The effective temperature (Te) emitted by a thermally radiant body ( A l a v a o r A f ) with respect to the radiant temperature (°C) from cold crust and hot cracks (Tc and Th, respectively) in a single pixel can be expressed as follows:
T e = [ f h T h 4 + ( 1 f h ) T c 4 ] 0.25
where f h is the fraction occupied by the melt or hot portion of the anomaly at high temperature, which is calculated as follows:
f h = P h / ( P c + P h ) .

2.4. Heat and Mass Fluxes

The total heat flux (Qtot) emitted from a single active volcano is the sum of three types of fluxes: radiative (Qrad), convective (Qconv), and gas (Qgas) fluxes:
Q t o t = Q r a d + Q c o n v + Q g a s .
Radiative flux (MW) is calculated as follows,
Q r a d = σ ε A f T e 4
where
  • σ = Stefan–Boltzman constant, 5.67 × 10⁻⁸ W/m2K4
  • ε = emissivity
The convective flux (MW) is related to magma movement in an open vent. Consequently, its value is zero when the calculations are derived from lava domes or fumarolic fields. Qconv can be calculated as follows,
Q c o n v = 0.14 A f k a i r ( g α a i r ρ a i r μ a i r β a i r ) 1 3 ( T e T a i r ) 4 3
where
  • g = acceleration constant (m/s2)
  • k a i r = thermal conductivity air (W/mK)
  • α a i r = cubic expansivity air (1/K)
  • ρ a i r = density air (kg/m3)
  • μ a i r = viscosity air (kg/ms)
  • β a i r = thermal expansivity air (m2/s)
These parameters can be obtained using the standard thermal properties of air [40,41], whereas Tair corresponds to the ambient temperature of the air (K). The gas flux (MW) represents the heat transported by the gas phase, which cannot be estimated with TBTCM. Instead, the parameters have to be acquired in the field and calculated from the following equation,
Q g a s = F g a s c g a s ( T m a g m a T a i r ) + F H 2 O L V
where
  • F g a s = total flux gas (kg/s)
  • c g a s = specific heat capacity of gas (J/kgK)
  • T m a g m a = magma temperature (K)
  • F H 2 O = water flux (kg/s)
  • L V = latent heat of condensation (2.26 × 10⁶ J/kg)
The total gas ( F g a s ) and water ( F H 2 O ) fluxes can be obtained by a combination of direct and remote techniques, including direct gas sampling, MultiGas, filter pack, UV camera, or Differential Optical Absorption Spectrometer (DOAS). However, in case neither parameter is available, Harris et al. [38] proposed to calculate it using the data published by Anderson [42] and Gerlach [43] for basaltic and andesitic lavas, estimating the ratios F S O 2 : F g a s to be between 1:3 and 1:77, whereas F S O 2 : F H 2 O is from 1:1.1 to 1:72.
Heat fluxes allow researchers to estimate the heat lost at the surface of an active crater. Using those parameters, it is then possible calculate the mass flux necessary to retain the heat flux. The mass flux is calculated as follows:
M = [ Q r a d + Q c o n v ] / [ C L Δ f + C m a g m a Δ T m a g m a ]
where
  • M = mass flux (kg/s)
  • C L = latent heat crystallization (J/kg)
  • Δ f = crystallized mass fraction
  • C m a g m a = specific heat capacity of the magma (J/kg)
  • Δ T m a g m a = magma cooling from liquidus at the temperature of the thermal feature

2.5. Thermal Radiance, Brightness Temperature, and Radiative Flux Using TIR Bands

Blackett [27] proposed a method to isolate thermal anomalies and to determine thermal radiance, brightness temperature, and radiative flux using TIR bands from the Landsat 8 satellite (OLI sensor). Here, we present the use of the same methodology for TIR bands in all Landsat sensors (TM, ETM+, and OLI).
The spectral radiance for the TM and ETM+ TIR bands can be calculated using Equation (4), whereas for the OLI sensor, although the equation is the same, the terms used are different.
L T O A = M L Q c a l + A L
where
  • L T O A = top of atmosphere radiance ( W / m 2 s r μ m )
  • M L = rescaling factor ( W / m 2 s r μ m /DN)
  • Q c a l = pixel digital number (DN)
  • A L = rescaling factor ( W / m 2 s r μ m )
To avoid differences caused by the calibration of band 10 (TIR band in OLI sensor), it is necessary to subtract 0.29 W/m2srµmto the equation from Equation (31) [27]. As mentioned above, Equation (6) allows researchers to determine the thermal radiance, which can be rewritten as follows in order to include the emissivity (ε) and transmissivity (τ):
R T I R , t h e r m a l = ( R T I R R T I R , U ) / ( ε × τ )
To isolate the thermal anomaly, Blackett [27] proposed that the thermal pixel threshold (all pixels related to the thermal anomaly) can be calculated using the mean (μ) and standard deviation (σ) from non-thermal DN pixels using the following equation:
D N t h r e s h o l d = μ n o n t h e r m a l + 2 σ n o n t h e r m a l
Once the thermal anomaly is defined, the brightness temperature can be calculated for each thermal pixel using the inverse of the distribution Planck´s function, which is expressed as follows:
T = C 2 λ l n ( C 1 L λ λ 5 + 1 )
where T is the brightness temperature in Kelvin (K) and λ is the central bandpass (µm) of the TIR band. The brightness temperature can be also obtained directly from the following equation:
T = K 2 l n ( K 1 L λ + 1 )
where K1 and K2 are the thermal conversion constants, 607.76 W/m2srµm and 1260.56 K, respectively. Finally, the total radiative flux from each pixel of a TIR band can be calculated as follows:
Q = σ ε T 2 A
where,
  • A = Pixel area (m2)
  • σ = Stefan–Boltzmann constant
  • ε = emissivity
  • T = brightness temperature (K)

2.6. Errors and Uncertainties

According to Gonzalez et al. [29], five error sources can be identified during the estimation of thermal radiance and the TBTCM: i) parameters used for the atmospheric correction [38]; ii) results from the surface reflectivity correction for day images [38], which can produce a maximum error of 4%; iii) pixel resampling [34], where images processed for level 1 using the nearest-neighbor method produce fewer errors than the convolution cubic method; iv) established assumed values for Tc and Th [25,34]; and v) elevated gas emission rates from a specific volcano can produce problems in the atmospheric transmission values used during the processing (Figure 1A; [44]). As the Landsat images available from the USGS are resampled for TIR bands, where the pixel size is transformed from 120, 60, and 100 m to 30 m for TM, ETM+, and OLI sensors, respectively, we resampled the TIR bands to reconstruct and standardize the pixel size for all sensors to 60 m, producing a maximum error of ±5%. This error was calculated comparing the original pixel DN from a non-resampled image with the new pixel DN generated by the resampling to standardize the pixel size. In this case, the image pairs, from the same site and the same date, were used. An additional error corresponds to the presence of black stripes in Landsat ETM+ images, which appear in images collected after May 31, 2003, caused by the Scan Line Corrector (SLC) failure (Figure 1B). Occasionally, the strips partially or completely cover the thermal anomaly, producing an underestimation or preventing calculation of the thermal parameters. The main uncertainty corresponds to the saturation and consequently to the reset of the saturated pixel, thus producing zero values (Figure 1C), resulting in lower thermal radiance values. In order to “rebuild” the original pixel, the original saturated value should be assigned for the pixel, corresponding to 255 for TM and ETM+ images and 65,536 for OLI images.

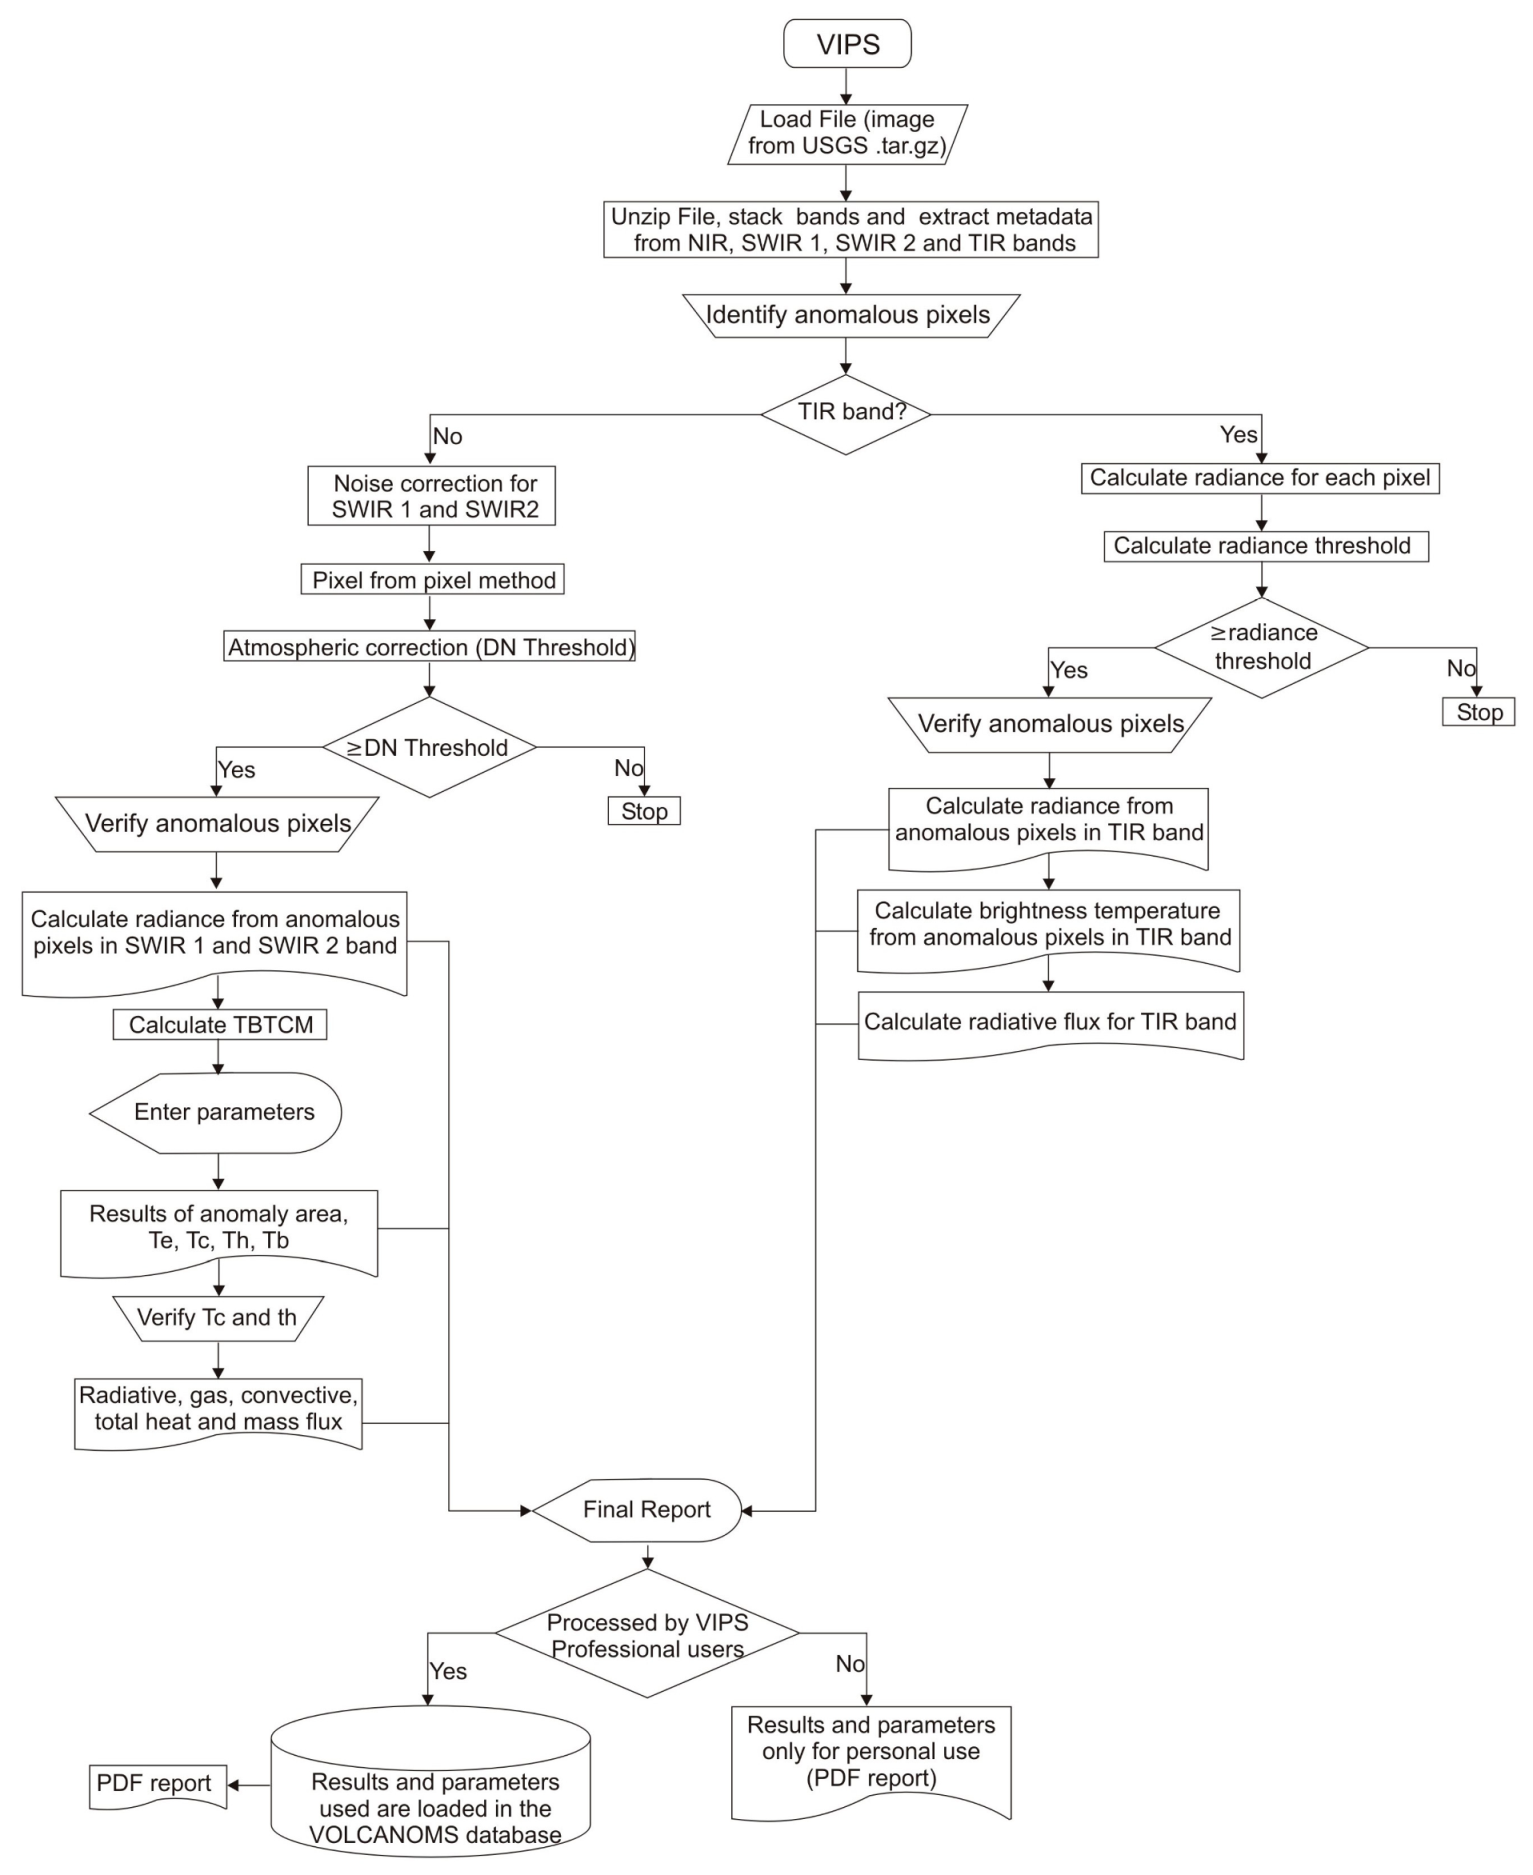
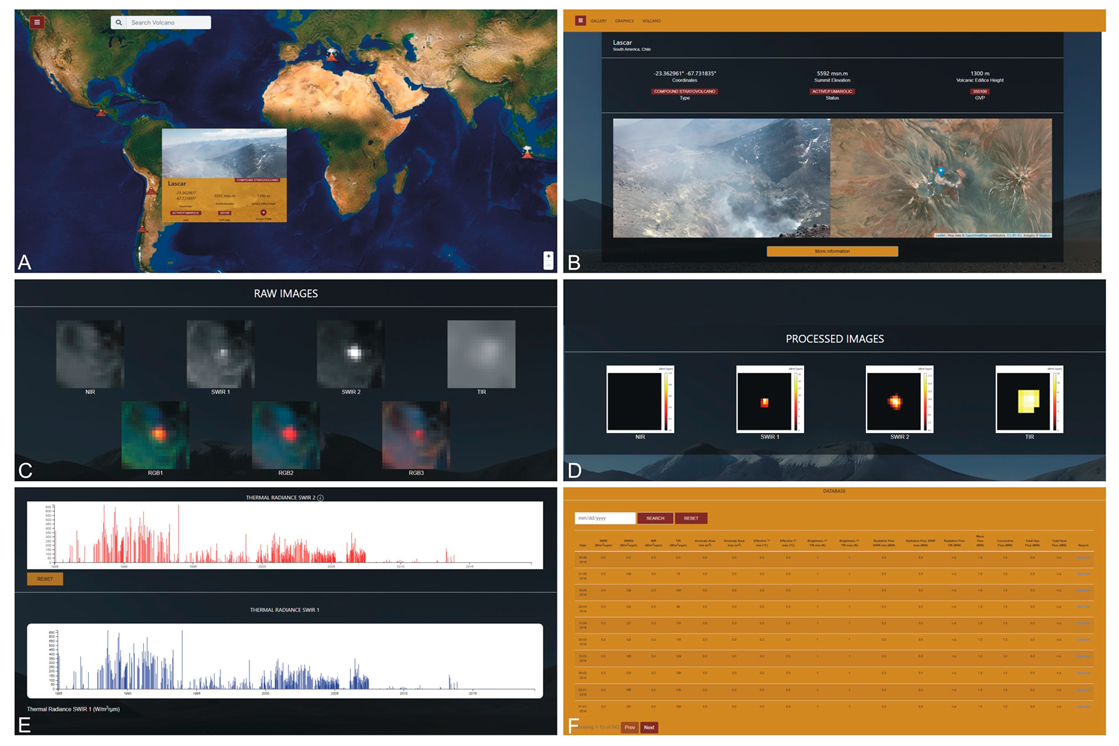
3. Volcanic Anomalies Monitoring System

3.1. Volcanic Imagery Processing Software: The Online Software Used to Process Landsat Images

VOLCANOMS was created using the open-source programming language PythonTM. In VOLCANOMS, users can interact in three different ways (three types of users, all free access; details in Section 3.3), and it can be accessed from http://volcanoms.ckelar.org. This system was initially tested with the complete Landsat database of the Lascar Volcano because it has a permanent thermal anomaly and is a good example for demonstrating how Landsat images can be a sensitive tool for detecting changes in volcanic activity.
The online software used to process the Landsat images (Volcanic Imagery Processing Software-VIPS) has a logical processing sequence (Figure 2). Landsat image processing starts with the uploading of the tar.gz file, which must be uploaded using the same codification as the USGS database (e.g., LC08_L1TP_233075_20191107_20191115_01_T1.tar.gz; SENSOR_PROCESSING LEVEL_PATHROW_ACQUISITIONDATE_UPLOADINGDATE). This file can be accessed from https://earthexplorer.usgs.gov or https://www.landsatlook.usgs.gov. The uploading of a complete Landsat scene allows the users to process any volcano available in that scene. Once the file is uploaded to or selected from the VOLCANOMS database, the software automatically decompresses the file, the bands are stacked, and the .met file is immediately read to obtain the sensor parameters. A preview of the Landsat scene can also be displayed in order to have a general overview and dismiss scenes with problems (e.g., excessive clouds). Subsequently, a workspace is opened (Figure 3), the stacked image is shown in a standard RGB false color composite (band 4-3-2; red, green, blue) combination, corresponding to NIR, red, and green (band 4-3-2 for Landsat TM and ETM+ images and band 5-4-3 for OLI images). The image can be visualized in several RGB combinations, which can be changed using the BANDS toolbar. In order to better detect the thermal anomalies, from low temperatures and small anomalies to high temperatures and large anomalies, the main combinations suggested in RGB false color composite are band 7-4-2, 5-4-2, and 7-5-4 for Landsat TM and ETM+ and band 7-5-3, 6-5-3, and 7-6-5 for Landsat OLI. The image displayed represents the largest area (a complete Landsat scene; 170 km N-S and 183 km E-W). Therefore, to process data from a specific volcano, it is necessary identify the working area and to zoom in and select the region of interest (ROI), which will represent the zone that contains the thermal anomaly and the background (the area surrounding the anomaly), corresponding to fumarolic fields, lava domes, lava flows, lava lakes, or acid lakes. The ROI can be selected manually or by entering the coordinates in the COORDINATES toolbar (Figure 3A), which are referenced to the matrix system (number of pixels in the x and y axes) and not to a geographic or UTM coordinate system. Once the ROI is set up, a subset is created in order to establish the specific area to be processed. The raw subset appears in several images, including the NIR, SWIR1, SWIR2, and TIR bands, and in three combined images in RGB, corresponding to SWIR2-NIR-Green, SWIR1-NIR-Green, and SWIR2-SWIR1-NIR (Figure 3).
In the IDENTIFY ANOMALY toolbar, the anomalous pixels must be selected according to the user criteria based on the comparison between the subset image (ROI) and the DN matrix (Figure 3B); this must be done for each band (NIR, SWIR1, SWIR2, and TIR). Once the anomalous pixel selection is done, the emissivity and transmissivity parameters must be entered to start the processing and to isolate the thermal anomaly area, which can be verified from the PARAMETERS toolbar (Figure 3D). Several volcanoes appear in the volcano list, where all thermal parameters can be accessed and can be modified manually. In the case of a single volcano that is not on the list, the thermal parameters can be added by the user. We recommend using the emissivity of a specific volcano using the ASTER 05 surface emissivity satellite image (https://search.earthdata.nasa.gov/search?fi=ASTER). The transmissivity for a single volcano can be obtained for a specific day and time using the Atmospheric Correction Parameter Calculator of NASA (https://atmcorr.gsfc.nasa.gov/). This processing retrieves the DNthreshold for each band processed according to Equation (10) (NIR and SWIR bands) and 33 (TIR band), the results of which are reported in the workspace (Figure 3). Immediately after identifying the thermal anomaly, the system automatically runs two processing sequences simultaneously for both the SWIR and TIR bands. In the case of the SWIR bands, the sequence is (Section 2.2; Figure 2) (1) sensor noise correction; (2) pixel-by-pixel method (Equations (8) and (9)) and; (3) thermal pixel threshold (atmospheric correction; Equation (10)). In the case of the TIR band, the sequence is (Section 2.5) (1) spectral radiance calculation (Equation (31)); (2) thermal radiance calculation (Equation (32)); and (3) thermal pixel threshold (Equation (33)). Both sequences allow the user to isolate the thermally anomalous pixels and to obtain the thermal radiance. To avoid including false thermal anomalous pixels, related to the presence of pixels with high reflectivity (generating DN over DNthreshold), which are normally caused by high solar radiation, the presence of abundant sulfur, and the presence of strongly altered rocks, among others, the VERIFY ANOMALY toolbar was created to deselect these pixels and to constrain the total thermal radiance. The deselecting of pixels can be done manually by the user in the available screen, where each single band and its respective processed matrix are shown (Figure 3C). After verification, the thermal radiance and the thermally anomalous area are reported in the processing screen, and the processed images (NIR, SWIR1, SWIR2, and TIR bands) with the thermally anomalous pixels isolated are also shown (Figure 3G).
Once the thermal radiance is obtained, TBTCM can be run, entering the several parameters needed to process this method and subsequently calculate the heat and mass fluxes. The parameters requested in the modal dialog (Figure 3D) are; (1) total gas flux (kg/s); (2) specific heat capacity of gas (J/kgK); (3) magma temperature (K); (4) air temperature (K); (5) H2O flux (kg/s); (6) latent heat of H2O condensation (J/kg); (7) latent crystallization heat (J/kgK); (8) crystallization mass fraction; (9) magma specific heat capacity (J/kg); and (10) magma temperature difference. As mentioned previously, the parameters can be fixed for a specific volcano and modified manually. The use of the TBTCM toolbar corresponds to a sequence that includes the extraction of the DNnon thermal pixels from Equation (10) for the SWIR1 and SWIR2 bands and from Equation (33) for the TIR band and then calculating the non-thermal radiance using Equations (4) and (31). Integrated radiance is calculated from the thermal radiance calculated previously by each thermally anomalous pixel using Equation (22). Calculating Equations (11)–(13) (Section 2.3) allows the user to determine all the variables involved in TBTCM, including the background, cold, and hot temperatures (Tb, Tc, and Th, respectively) and the background, cold, and hot portions (Pb, Pc, and Ph, respectively; Figure 2). The flow area is then calculated, corresponding to the thermally radiant or thermally anomalous areas (Alava or Af; Equation (23)), effective temperature (Te; Equation (24)), and the fraction occupied by melt or hot portions of the anomaly at high temperatures (fh; Equation (25); Figure 2). A new modal dialog appears in order to show the results related to the automatic iteration to solve Equations (11)–(13) (Figure 3F). A manual iteration can be done by the user, changing the variables corresponding to cold and hot temperatures (Tc and Th, respectively), which makes it possible to fix the minimum and maximum values for both variables (Figure 3F). To verify that the manual iteration is correctly done, the ratio phSWIR2/phSWIR1 is reported, which must be ~1 because the hot area in both SWIR bands occupies the same portion. The flow area and effective temperature are also reported (Figure 3F). By applying TBTCM, VIPS automatically retrieves the heat and mass fluxes and calculates the SWIR radiative, convective, gas, total heat, and mass fluxes (Equations (26)–(30), respectively) and the brightness temperature and radiative flux for the TIR band (Equations (34) and (35); Figure 2). In cases of thermal anomalies related to lava domes or fumarolic fields, convective flux cannot be calculated as the convective flux is related to magma movement in an open vent. Consequently, in the PARAMETRS results modal dialog, a box is available to activate the option to not calculate the convective flux (Figure 3D).
The workspace has an option to report problems related to the original raw satellite image, external factors, or processing routine, which include excessive clouds over the anomaly, excessive volcanic gas over the anomaly, and black strips over the thermal anomaly in the ETM+ sensor, among others (Figure 3E). The final results toolbar produces a report with the values obtained from the entire process described previously (Supplementary Material PDF file S1): (1) Pre-processing information, corresponding to a basic information related to the metadata; (2) parameters, details about the physical parameters used for processing data, including default and manually entered data; (3) raw data, which includes the original images from the ROI and its surrounding area and the ROI shown for single bands (NIR, SWIR1, SWIR2, and TIR) and three RGB combined images (SWIR2-SWIR1-NIR; SWIR2-NIR-Green; SWIR1-NIR-Green); (4) thermal radiance, showing a table with the thermal radiance (W/m2srµm) of NIR, SWIR1, SWIR2, and TIR bands and their processed images (thermally anomalous pixels); (5) thermal parameters for the TIR band, including a table with the brightness temperature (K), radiative flux (MW), and its processed images (thermally anomalous pixels); and (6) TBTCM. This section shows the results of the thermally radiant area, effective temperature, radiative, convective, gas and total heat fluxes, and mass flux.

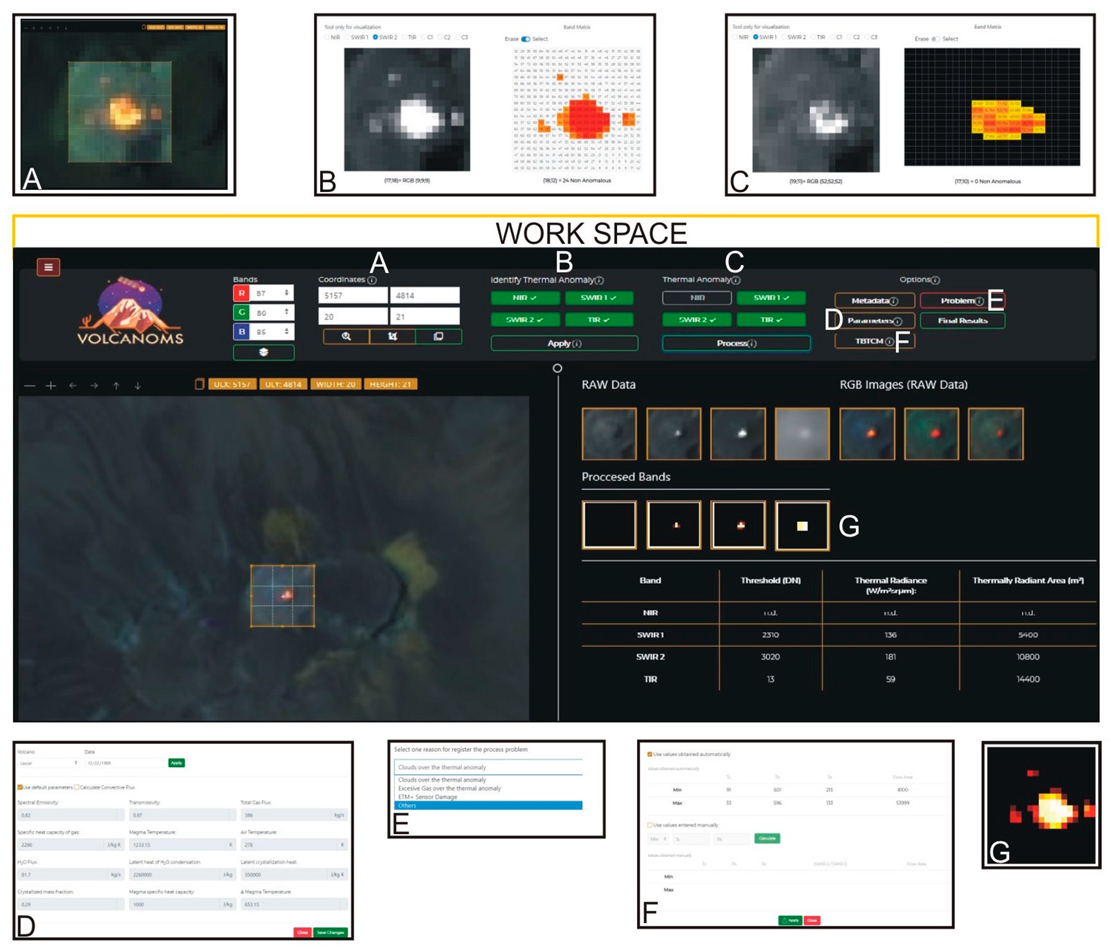
3.2. The Online Platform

VOLCANOMS is a public platform where data related to thermal anomalies from several volcanoes are reported. The Home Page shows a map of the world, where active volcanoes in the VOLCANOMS database are shown (Figure 4A). According to the type of activity, active volcanoes (including fumarolic, lava lake, acid lakes, lava domes, and flows) and unrest/ongoing eruption volcanoes can be identified in this map by different icons. Each volcano has an informative window where information of the volcano type, its geographic coordinates, type of activity, summit altitude, edifice height, and the volcano number from the Global Volcanism Program are presented (Figure 4A). From this window or from the browser, a specific volcano can be accessed with the complete database of the images processed using VIPS. This information; includes (1) Geological and historical eruptive information (Figure 4B); (2) location map (Figure 4B); (3) photo gallery (Figure 4B); (4) raw and processed images from the ROI (Figure 4C,D); (5) a series of graphs with information of thermal radiances, thermal anomaly areas, effective and brightness temperatures, and radiative, convective, gas, total heat, and mass fluxes (Figure 4E); and (6) a table with the complete database, which includes all the thermal parameters (Figure 4F). The images presented are the most recently available/processed image, whereas the graphs and the database table show the historical data, from 1984 until present. However, a specific period or date can also show interactive graphs using an interactive brush or searching directly from the database table (by use of the interactive calendar). The report (free access) for a specific date can be downloaded directly from the database table (Supplementary Material PDF file S1).

3.3. Accessibility

VOLCANOMS is available for three type of users, with different levels of accessibility: (1) a non-specialist audience, i.e., users with free access to the online platform who are able to interact with the public data and download the public reports. (2) Standard VIPS users, who are authorized to upload Landsat images, process data using online VIPS, and generate a report for a specific volcano; however, this information is not added to the VOLCANOMS database. This user is authorized via online request after registration in the VIPS section. (3) Professional VIPS users, who can upload Landsat images, process data, generate reports for existing volcanoes in the VOLCANOMS database, and/or contribute to the results for a new volcano, which are added to the database. Professional users are authorized after a training process for VIPS software and the VOLCANOMS platform, which can be requested after registration in the VIPS section. This type of user includes researchers from universities and research centers and/or personnel from volcanic observatories.

4. Volcanic Monitoring Using VOLCANOMS

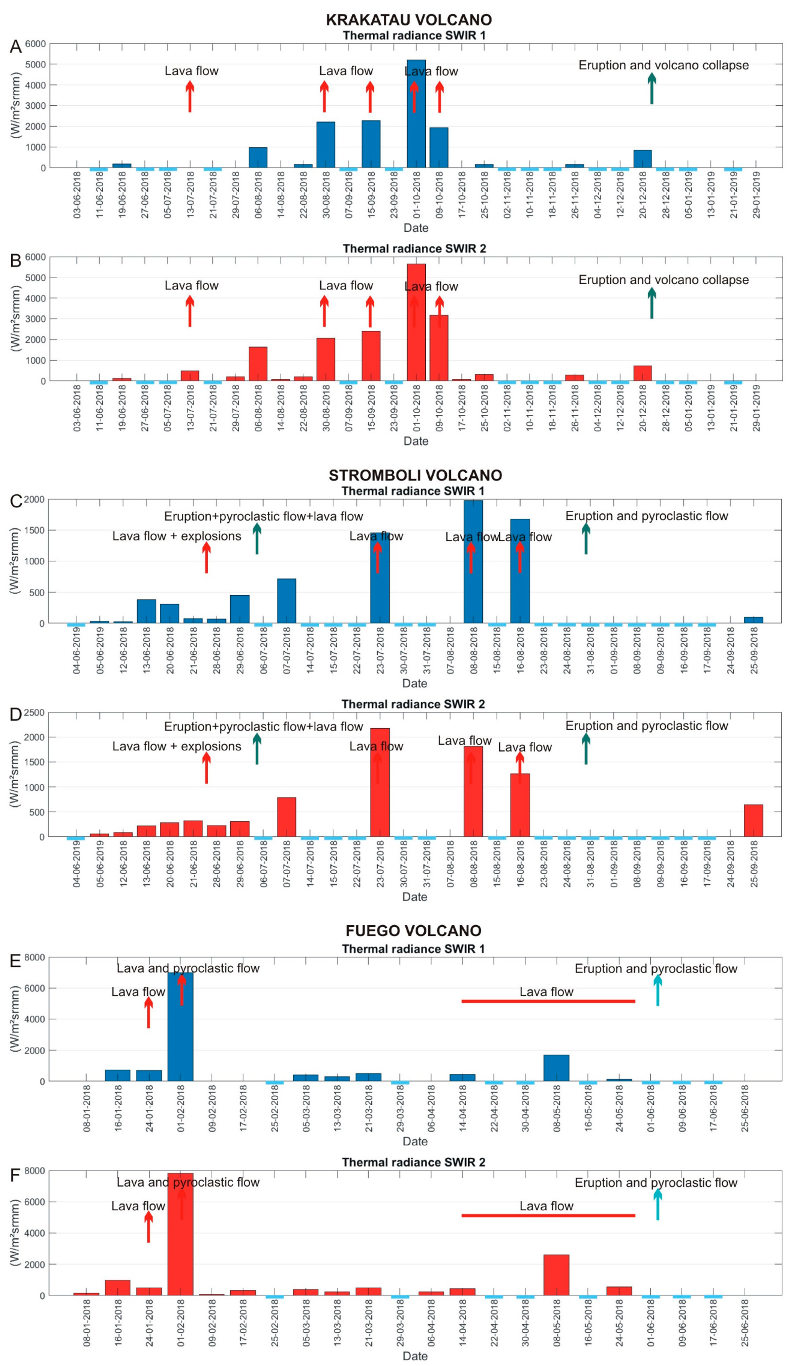
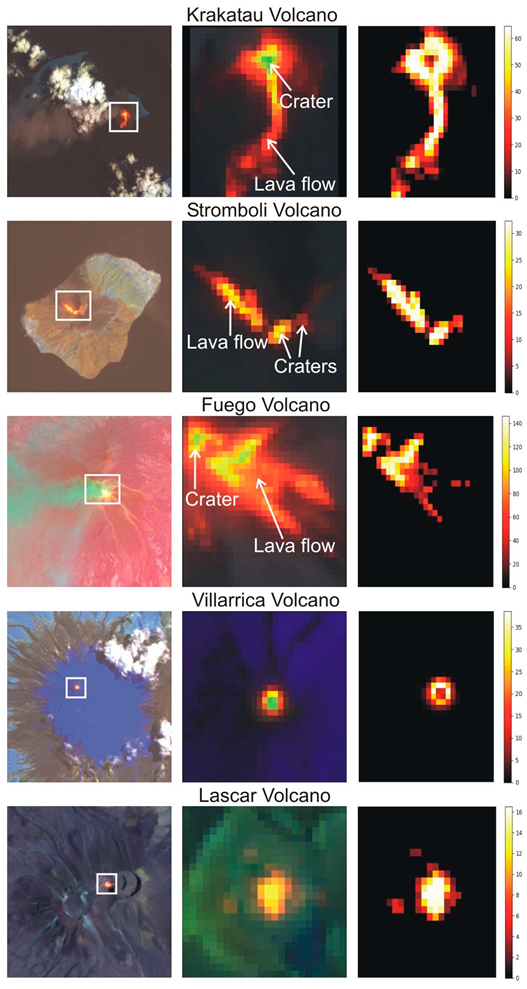
4.1. Krakatau Volcano

Krakatau Volcano (155 m asl.; 6°6′7.2″S/105°25′22.8″W) is part of an ancient 7-km-wide caldera, which emitted several eruptive products with compositions that vary from basalts to dacites [45]. The 1883 catastrophic eruption destroyed the original Krakatau island, which rebuilt a new volcano (so-called Anak Krakatau), erupting several times since 1927. On December 2018 a catastrophic eruption produced the collapse of the Anak Krakatau volcanic edifice, activity that was preceded by the emission of several lava flows during the previous months. In this section we explore the correspondence between the thermal activity with the eruptive cycle between June 2018 and January 2019, using a database of 31 Landsat ETM+ and OLI images.
In mid-June 2018, a renewed activity started at Krakatau Volcano after 15 months of quiescence, with the emission of ash columns, Strombolian activity and increasing of seismicity, which remained almost constant until December 2018 [46]. This activity was accompanied by the emission of several lava flows since July 2018 and lasting up to December 2018 [46]. On December 22, 2018, effusive and explosive activity was followed by the partial collapse of the Anak Krakatau edifice, producing a tsunami that hit the coasts of Sumatra and Java [47]. After collapse, the eruptive activity continued with several Surtseyan explosions [47]. The first image available for this eruptive cycle was on June 3, 2018, showing no anomalies both in SWIR1 and SWIR 2 bands (Figure 5A,B). The first anomaly during this cycle was detected on June 19, 2018, with radiances of 192 and 122 W/m2srµm for SWIR1, and SWIR 2, respectively. This anomaly seems to be related to the Strombolian activity initiated in mid-June 2018. After of a couple images where Krakatau was covered by clouds, steam and ash, the first lava flow was observed on 13 July 2018, where radiance was only measured for SWIR2 (484 W/m2srµm), due to the presence of clouds over the volcanic edifice. These clouds could be causing underestimation of the radiance and preventing detection of the anomaly for SWIR1. Lava flows were also observed on August 30 and September 15, 2018, with values of thermal radiance of 2218 and 2050 W/m2srµm (for SWIR1 and SWIR2) and, 2267 and 2396 W/m2srµm (for SWIR1 and SWIR2), respectively. The peak of the thermal activity was reached on October 1, 2018, when a new lava flow was detected, with measured thermal radiances of 5195 and 5639 W/m2srµm for SWIR1, and SWIR2, respectively (Figure 5A,B and Figure 6). The subsequent activity was characterized by diminishing of the thermal radiance, probably related to the emission of short-lived lava flows and/or cooling of those flows. A renewed increasing of the thermal radiance was observed on 20 December 2018, only two days before the collapse; increasing could be related to the intense explosive activity and/or the emission of a lava flow. Most of the following images present clouds that cover the Krakatau Volcano, except on 13 and 29 January 2019, where no anomalies were detected, thereby corresponding to the days where no eruptive activity was observed [47].

4.2. Stromboli Volcano

Stromboli (924 m asl.; 38°47′20.4″S/15°12′46.8″W) is the northeastern most volcano of the Aeolian Islands, Italy. Stromboli has been active since at least 13 ka and emitted eruptive products that vary from high-K calcalkaline basalts to andesites and trachyandesites [48]. The historical eruptive activity is characterized by frequently minor strombolian eruptions, emission of lava flows and sporadic paroxysmal eruptions [49]. The most recent eruptive activity occurred between July and August 2019, when pyroclastic flows and lava flows were emitted. We have used 30 Landsat ETM+ and OLI images between June and September 2019 to correlate the thermal radiance with the eruptive activity.
During the period between March and early June 2019, the eruptive activity of Stromboli Volcano was characterized by the occurrence of the typical low energy Strombolian eruptions [50]. On 25 June 2019, a high energy explosion and a lava flow were recorded, and on 3 July 2019, a powerful explosion generated a 9.1 km height ash column, which collapsed and produced a pyroclastic flow [50]. This activity was followed by the emission of several lava flows during almost seven weeks, which were frequently accompanied by low energy Strombolian explosions, and completed with a strong explosion, which produced pyroclastic and lava flows [50]. After this eruption, the activity returned to the typical low energy strombolian explosions. On 5 June 2019, the thermal radiance measured was relatively low (35 and 54 W/m2srµm for SWIR1 and SWIR2, respectively) and increased progressively during June 2019, which is correlated directly with the increasing of the eruptive activity and the emission of lava flows in late-June (Figure 5C,D). The thermal radiance still increased after the eruption on 3 July 2019, which is directly related to the emission of several lava flows during July and August (Figure 6). In fact, during this period the thermal radiance reached its higher values, corresponding to 1974 W/m2srµm for SWIR1 on 8 August 2019, and 2174 W/m2srµm for SWIR2 on 23 July 2019 (Figure 5A,B). In the period between late-August and late-September, all images were covered by clouds, and consequently, the eruptive activity cannot be tracked, especially after the eruption on 28 August 2019. However, the only image available for this period, from 25 September 2019, shows low values of thermal radiance (98 and 644 W/m2srµm for SWIR1, and SWIR 2, respectively; Figure 5A,B), which correlates with the diminishing of the eruptive activity.

4.3. Fuego Volcano

Fuego Volcano, which is located in Guatemala (3763 m asl.; 14°28′22.8″S/90°52′48″W), corresponds to a composite stratovolcano that is part of the Fuego-Meseta-Acatenango complex. This complex has been active since at least 230 ka, and has emitted mainly basaltic-to-andesitic eruptive products [51,52]. Historical eruptive activity has only been recorded at Acatenango and Fuego volcanoes, twice in the case of Acatenango (1924–27 and 1972), whereas Fuego has erupted more than 60 times between 1524 and present, characterized by the emission of lava and pyroclastic flows, and lahars [52]. During the first half of 2018, intense eruptive activity was recorded on Fuego Volcano, including lava flows, ash plumes, lahars and pyroclastic flows, the last producing more than 100 fatalities on 3 June [53]. 22 Landsat ETM+ and OLI images were used to track the eruptive activity on Fuego Volcano for the period January–June 2018.
The eruptive activity of Fuego Volcano during 2018 started with the emission of several lava flows, emission of ash plumes and pyroclastic flows between 31 January and 1 February 2018 [53]. During April and May several ash explosions and lahars were recorded, and from 14 April 2018 until late-May, lava flows were also observed [53]. A few days before the paroxysmal eruption on 3–5 June 2018, an explosion that generated a column of 15.2 km and several pyroclastic flows, the thermal activity recorded by MODIS decreased drastically, and during June 2018, several minor ash explosions and lahars were recorded [53]. The thermal anomaly during January 2018 presented relatively high values, reaching up to 727 and 976 W/m2srµm for SWIR1, and SWIR 2, respectively (Figure 5E,F), which is explained by the occurrence of several ash explosions, ash flows and minor pyroclastic flows. The thermal anomaly reached extremely high values on 1 February 2018 (6980 and 7824 W/m2srµm for SWIR1, and SWIR 2, respectively; Figure 5E,F), corresponding to the emission of four lava flows and pyroclastic flows between 31 January and 1 February 2018 (Figure 6; [53]). Between February and May 2018, a high variability of the thermal radiance is observed (8-1687 and 80-2591 W/m2srµm for SWIR1, and SWIR 2, respectively; Figure 5E,F), which could be related to the variable activity, including minor ash explosions and lava flows. In fact, the higher radiances on May 8, 2018 are concordant with the period when several lava flows were emitted [53]. A few days before of the paroxysm on 3–5 June 2018, the thermal radiance decreased, reaching up to 124 and 563 W/m2srµm for SWIR1, and SWIR 2, respectively (24 May 2018; Figure 5E,F). During June 2018, several images were covered by clouds, making it impossible to track the thermal activity immediately after the paroxysm. However, the last image on 25 June 2018, where no thermal anomalies were detected, is concordant with the decreasing of eruptive activity, characterized by sporadic minor ash explosions [53].

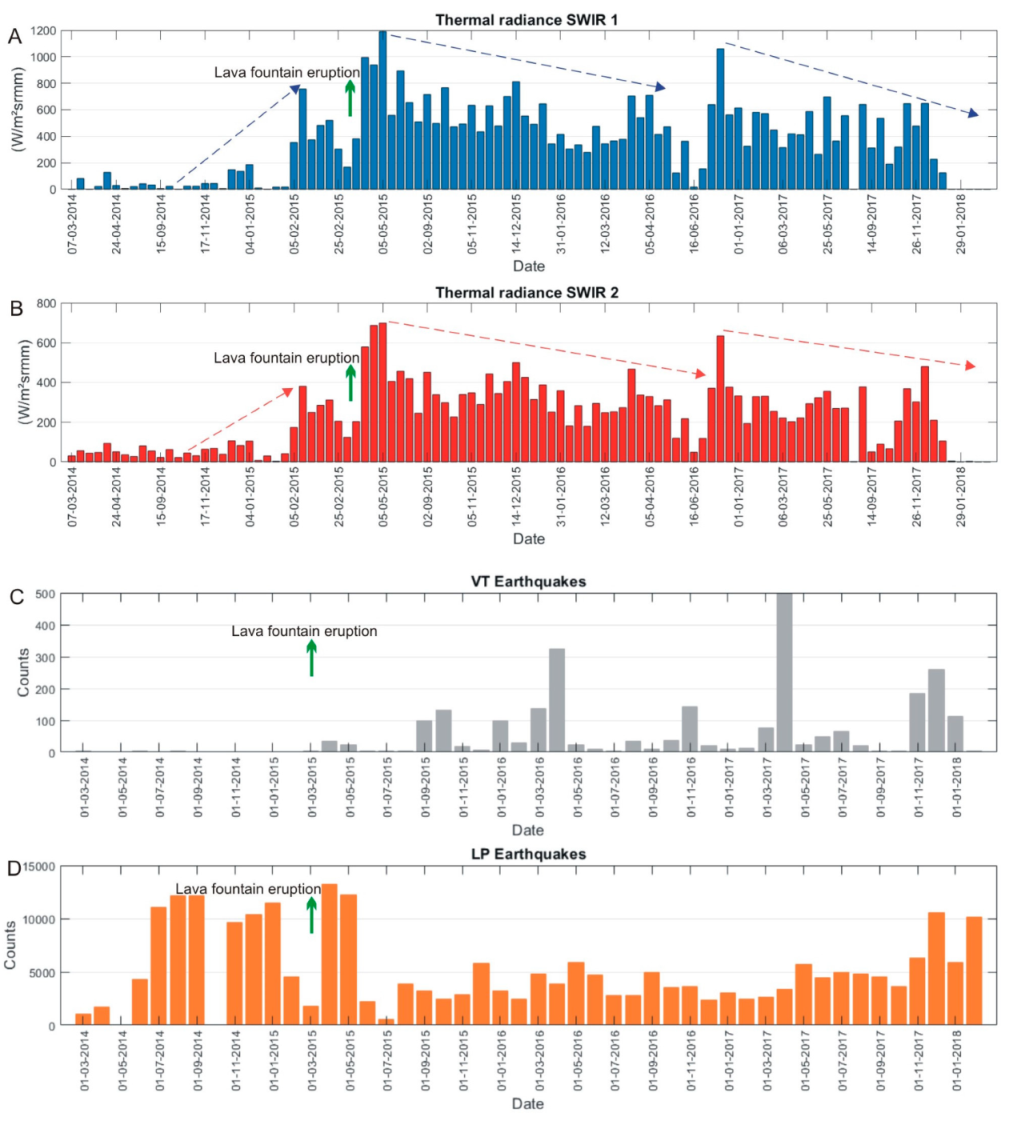
4.4. Villarrica Volcano
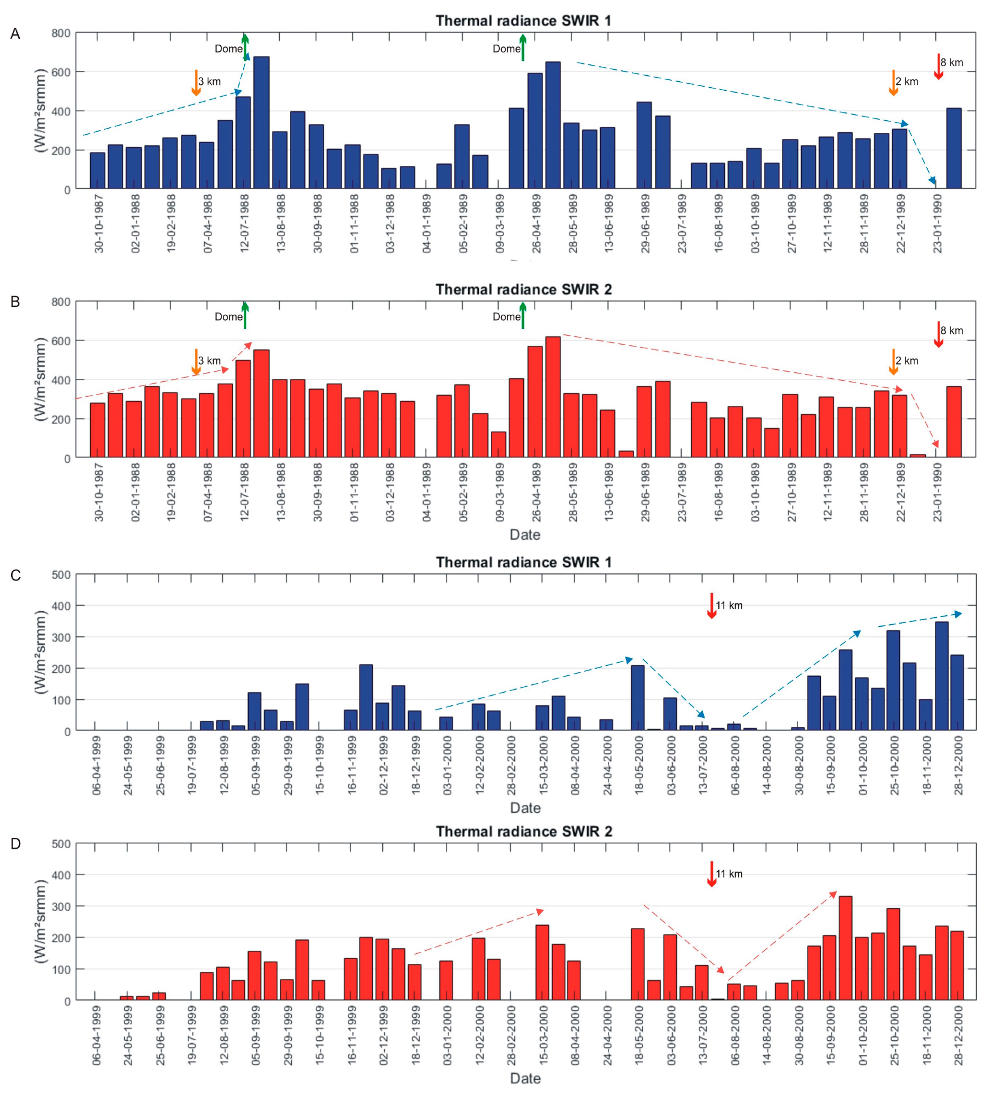
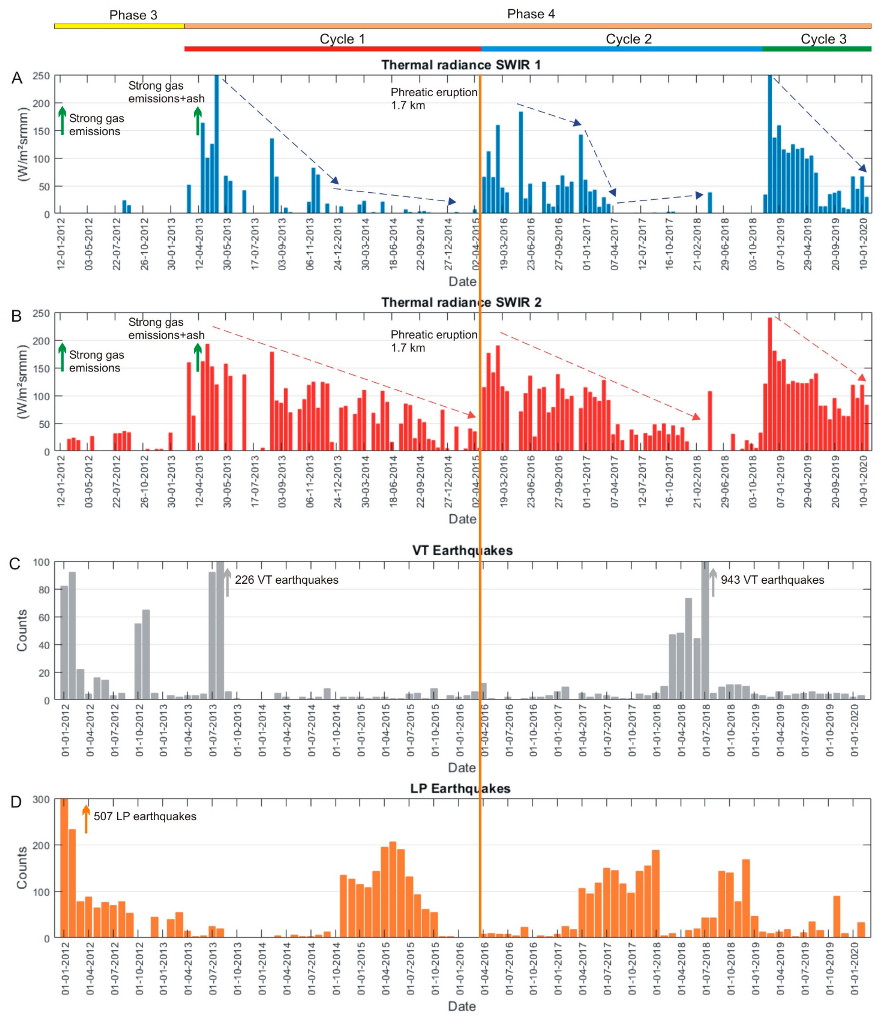
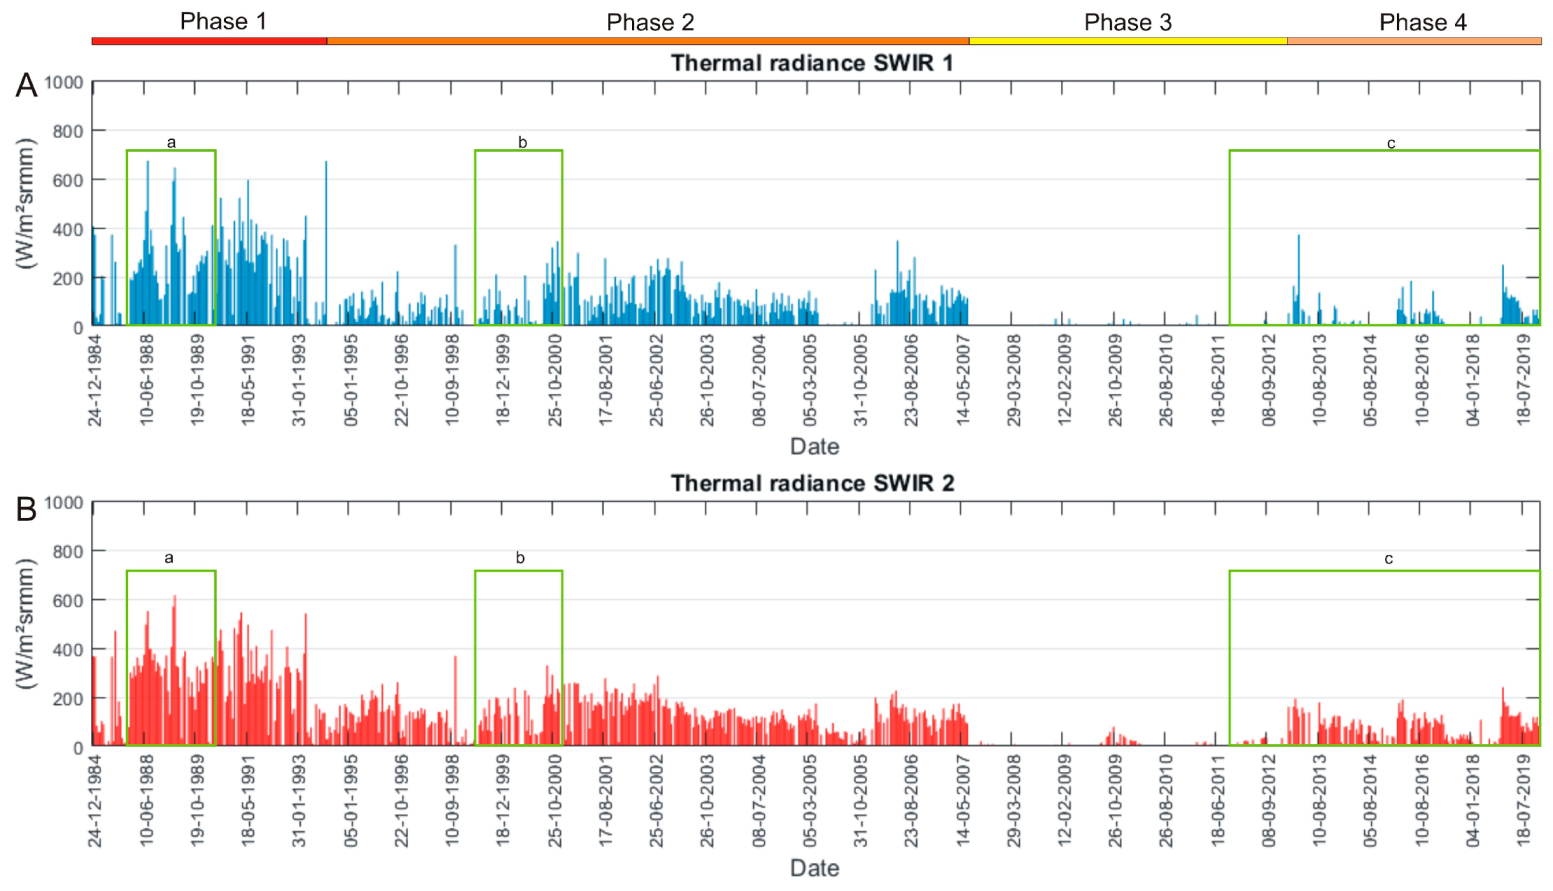
Villarrica Volcano (2847 m asl.; 39°25′12.36″S/71°56′22.92″W) is the most active volcano in Chile and is located in the Southern Andean Volcanic Zone (SAVZ). Villarrica is a composite stratovolcano, which has evolved in three eruptive stages, from the collapse of a caldera (Villarrica 1; 100–14 ka) to the building of the current composite cone (Villarrica 2 and 3; 14 ka–present) [54]. Since 1558, at least 49 eruptions have been recorded, corresponding to hawaiian, strombolian, phreatomagmatic and vulcanian eruptions, which have emitted lava and pyroclastic flows and frequently produced lahars [55]. The last eruptive activity was recorded on 3 March 2015, a short-lived hawaiian eruption, which produced several lahars. Here, we present a time-series that includes 113 Landsat ETM+ and OLI images, for a period between March 2014 and February 2018, which covers the quiescence period before the eruption and the lava lake dynamics after this activity.
The activity of the Villarrica Volcano during 2014 was characterized by the very sporadic presence of the lava lake inside of the summit crater [56]. On 9–12 December 2014, the first eruptive activity for more than one year was recorded, corresponding to small gas explosions and the presence of the lava lake [56]. On 4 February 2015, a first minor Strombolian explosion was observed, which continued on 5, 6, 9 and 10 February 2015, with a high frequency of minor Strombolian explosions, and on 28 February 2015, stronger Strombolian explosions occurred [56]. The main eruptive activity occurred on 3 March 2015, when a lava fountain (Hawaiian eruption) of 1.5 km height was emitted, which produced several lahars. Almost immediately after the eruption, the vent was obstructed by a spatter cone, but then was destroyed and reopened few days after, being the lava lake exposed, which had a temperature that reached up to 1000 °C [56]. During April 2015, the activity was characterized by several Strombolian explosions and the emission of ash plumes, whereas the building and destruction of a spatter cone inside the active crater occurred. The eruptive activity decreased during May and June 2015, occurring minor and very sporadic Strombolian explosion, whereas the lava lake temperature decreased up to 850 °C [56]. After a relative long period without relevant activity, on 20 October 2016 an ash plume of 3.7 km height was emitted, followed by the variations of the lava lake level, formation and collapse of a spatter cone inside the active crater and the occurrence of minor Strombolian explosions, activity that lasted up to late-May 2017 [57]. Since June 2017 the activity starts to decrease progressively, the lava lake level also decreases, occasionally not observable from the crater rim. On November 2017, were observed minor explosions, but in December, the volcano return to the previous quiescent state, which lasted up to February 2018 [58].
To better understand the thermal activity between March 2014 and February 2018, we compared our data with the seismic information from the Geological and Mining National Survey of Chile (SERNAGEOMIN). The thermal radiance from March to early-December 2014 was relative constant (23–81 and 0–127 W/m2srµm for SWIR1, and SWIR2, respectively), which increased shortly between 11 December 2014 and 4 January 2015 (up to 106 and 187 W/m2srµm for SWIR1, and SWIR2, respectively), returning to low radiances until 28 January 2015 (Figure 7A,B). Low radiances are directly related to the quiescence period and the low level of the lava lake, whilst the short increases in radiance are coincident, with increasing levels of the lava lake and the occurrence of the small gas explosions. The seismic activity during 2014 was characterized by the near absence of volcano-tectonic (VT) earthquakes (up to 5 earthquakes/month on March 2014) but abundant long-period (LP) seismicity, which increased rapidly on July 2014, reaching a peak on September 2014, with a rate of 12,112 earthquakes/month, which lasted up to January 2015 (Figure 7C,D). We interpreted this activity as the progressive magma uprising to the surface (LP seismicity), which produced the first gas explosions on December 2014, the renewed presence of the lava lake and the increasing of the thermal anomaly. On February 5, 2015 the thermal radiance increased rapidly, reaching a peak on 6 February 2015 (757 and 381 W/m2srµm for SWIR1, and SWIR2, respectively; Figure 6) and then decreased again during February 2015 (Figure 7A,B). The eruptive activity on February 2015 was characterized by the occurrence of several Strombolian explosions, which could explain the increase in thermal activity. However, the LP seismicity decreased up to 4560 earthquakes/month, whereas the VT seismicity was not detected. After the paroxysm on 3 March 2015, the thermal anomalies increased rapidly, reaching the highest radiance on 5 May 2015 (1191 and 699 W/m2srµm for SWIR1 and SWIR2, respectively; Figure 7A,B), which is coincident with the highest temperature measured in the lava lake and the highest LP seismicity rate (13,176 earthquakes/month; Figure 7D). Between mid-April and mid-May 2015, Delgado et al. [59] detected a persistent uplift signal located 5 km SE from the crater, 4.2 km below sea level, with maximum amplitudes between 4 and 6 cm. Those authors suggested two mechanisms for that deformation: (i) a refilling of the Villarrica magma chamber after the area was evacuated by the eruption; or (ii) a pressurization of the magma chamber, caused by devolatilization, driven by the expulsion of magma in the eruption. The first mechanism is consistent with the presence of the lava lake during its highest level of activity, and consequently the highest thermal radiance for the period studied. Since June 2015, the thermal radiances start to decrease, reaching the lowest thermal radiances on 16 June 2016 (17 and 49 W/m2srµm for SWIR1, and SWIR2, respectively; Figure 7A,B), which correlates with the decreasing of the frequency and magnitude of the Strombolian explosions, and the decreasing of the temperature of the lava lake. The LP seismicity remained more or less constant, whereas VT seismicity increased for several months, reaching a peak in April 2016, with 325 earthquakes/month (Figure 7C). The thermal anomaly increased rapidly again on October 6, 2016 (1061 and 634 W/m2srµm for SWIR1, and SWIR2, respectively; Figure 7A,B), but started to decrease almost immediately, reaching its lowest values on January 2018, when thermal radiances were 0 W/m2srµm for SWIR1 and SWIR2 (Figure 7A,B). This period was characterized by the emission of a 3.7 km height ash plume on 20 October 2016 and discrete occurrence of minor Strombolian explosions. LP seismicity remained constant, with an increase to over 10000 earthquakes/month in December 2017 and February 2018 (Figure 7D), whereas VT seismicity showed two peaks on April 2017 and December 2017 (498 and 259 earthquakes/month, respectively; Figure 7C).

4.5. Lascar Volcano

The Lascar Volcano, which is located in northern Chile (5,592 m asl.; 23°21′35.38″S/67°43′57.23″W), is considered the most active volcano in the Central Andean Volcanic Zone (CAVZ) and its evolution has been summarized in four stages [60]. Lascar 1 (240–110 ka), Lascar 2 (100–19.22 ka), the biggest eruption occurred in this stage (Soncor plinian eruption; 10–15 km3 volume; 26.45 ka; [61]). Lascar 3 (19.2–9.25 ka) and Lascar 4 (7.1 ka–present). Since 1848, there have been records of degassing and eruptive activity [62], which can be summarized as seven phreatomagmatic-to-vulcanian eruptions up to 1984, when a thermal anomaly was detected by a Landsat TM sensor [63,64]. Afterwards, a dome growth-and-collapse cycle occurred between 1984 (an uncertain date due unavailability of field data) and 1993, when three domes were emitted and 16 eruptions were recorded, which were characterized as phreatomagmatic and vulcanian eruptions. On 19–20 April 1993, the largest eruption during historical times was recorded, a subplinian eruption, which produced an eruptive column 23 km high and pyroclastic flows up to 8 km in length; it also emitted 0.1 km3 of magma [65]. Between 1994 and 2015, 13 phreatic-to-vulcanian eruptions were recorded, related to a constant degassing period. Here, we present the thermal activity of Lascar volcano, which database includes 854 Landsat TM, ETM+, and OLI images for a period between December 1984 and February 2020, thus covering 35 years of activity.
According to over 35 years of monitoring data from VOLCANOMS, it is possible to distinguish four phases of thermal activity, which are in good agreement with the eruptive and degassing activity. These Phases are (1) Phase 1: December 1984–December 1993; (2) Phase 2: January 1994–June 2007; (3) Phase 3: July 2007–March 2013; and (4) Phase 4: April 2013–present (Figure 8).
In Phase 1 (Figure 8), the thermal radiance parameter responses with high values when the dome growth-and-collapse cycle occurs. During this phase, the highest thermal radiance values in the 35 years of Lascar Volcano monitoring were detected, which are related to growth of the lava dome and the period immediately after the destruction of the collapsed dome, which produced the opening of the active crater. The highest thermal radiance reached up to 673 W/m2srµm for SWIR1 on 28 July 1988, and 614 W/m2srµm for SWIR2 in 20 May 1989. In both cases, the lava dome was present. However, a decrease in thermal radiance frequently precedes major eruptions (vulcanian eruptions with eruptive columns >8 km); it may also be related to the cooling, subsidence, and collapse of lava domes. Matthews et al. [65] defined four dome growth-and-collapse cycles based in records of eruptive activity and field observations. Despite the concordance between these cycles and our satellite data, the latter can be used to better define it. Cycle 2 is the period that best responds to changes in the thermal radiance. Matthews et al. [65] did not specify a starting date for cycle 2, but the authors did indicate as the first evidence of this new cycle the presence of a lava dome between February and April 1989 (200 m diameter; 50 m height; 1.5 × 10⁶ m3). Our satellite data showed a relatively sustained increase in thermal radiance at least since October 1987, reaching its first peak on 28 July 1988 (672 and 550 W/m2srµm for the SWIR1, and SWIR2 bands, respectively; Figure 9A,B). We correlated the increase of the thermal radiance with the uprising of the lava dome in the Lascar feeder system, which started at least in October 1987. This is consistent with the field observations of Oppenheimer et al. [34], who confirmed the absence of a lava dome in January and April 1987. In the case of the thermal radiance peak, this agrees with observations of the emplacement of a lava dome in the active conduit between 13 and 15 July 1988 [62,66]. The thermal radiance decreased progressively until 9 March 1989 (0 and 129 W/m2srµm for SWIR1, and SWIR2, respectively) and then increased again, reaching a second peak on 20 May 1989 (645 and 614 W/m2srµm for SWIR1, and SWIR2, respectively; Figure 9A,B). This variability seems to be initially related to the cooling of the lava dome and/or the inhibition of the degassing because of lava dome subsidence, and the subsequent introduction of a new supply of magma into the conduit system, resulting in increased thermal energy. The input of new magma is consistent with the growth of a lava dome observed at late March–early April 1989, which was accompanied by rumbling, local earthquakes, and night glow over the crater [67,68]. The maximum growth of the lava dome was reached in May 1989. Following this activity, the thermal radiance started to decrease again up to 19 October 1989 (132 and 149 W/m2srµm for SWIR1, and SWIR2, respectively; Figure 9A,B) before increasing until 14 December 1989 (283 and 342 W/m2srµm for SWIR1 and SWIR2, respectively; Figure 6) and 22 December 1989 (306 and 316 W/m2srµm for SWIR1, and SWIR2, respectively; Figure 9A,B). The first part is related to the cooling and moderate subsidence of the lava dome, as observed on 10 October 1989 [62,69,70], whereas the last part is related to the input of a small amount of new magma in the southern edge of the dome, which was accompanied by strong steam explosions on 17 and 21 December, generating columns up to 2 km high over the crater [62]. After this explosive activity, a dramatic decrease of thermal activity was observed, reaching the lowest thermal radiance values, 0 and 17 W/m2srµm for the SWIR1 and SWIR2 bands, respectively, on 7 January 1990, and 0 W/m2srµm for the SWIR1 and SWIR2 bands on 23 January 1990 (Figure 9A,B). On 20 February 1990, a major vulcanian eruption occurred (eruptive column of 8–14 km), almost completely destroying the lava dome. Four days after the eruption, the thermal radiance increased significantly, reaching values of 409 and 363 W/m2srµm for the SWIR1 and SWIR2 bands, respectively (Figure 9A,B). The decrease of the thermal radiance previous to the vulcanian eruption seems to be related to fast subsidence of the dome and the almost complete inhibition of degassing, whereas the recovery of high thermal radiance values is related to the re-opening of the active crater and resumption of the intense degassing. Oppenheimer et al. [34], Wooster and Rothery [37], and Wooster [71] also reported diminished thermal radiance prior to explosive eruptions in the Lascar Volcano for the same period. Matthews et al. [65] provided a dome collapse model that allows us to correlate it with the fast decrease of the thermal radiance prior to the vulcanian eruptions. The subsidence of the lava dome inhibits degassing because subsidence closes the inward-dipping fracture system, increasing the magma pressure. An additional increase of internal pressure is produced by precipitation of hydrothermal minerals along this fracture system, reducing the gas flow to the surface. The increasing internal pressure finally triggers a major vulcanian eruption. The diminished gas flow to the surface, combined with cooling and subsidence of the lava dome, reduces the thermal energy released to the surface and decreases the thermal anomaly area, which could reach zero in both cases.
Phase 2 (January 1994–June 2007; Figure 8) corresponds to the period immediately after the third and last dome growth-and-collapse cycle, which ended after the 17 December 1993, vulcanian eruption (eruptive column 10 km in height), when the last lava dome was destroyed. After this eruption, the eruptive behavior of the Lascar Volcano became less coherent; no lava dome was recognized and several phreatomagmatic-to-vulcanian eruptions occurred (12 explosions were recorded during this phase), which emitted eruptive columns between 2.5 and 11 km in height (e.g., [65,72,73,74]). The thermal radiance decreased substantially during this phase, reaching zero several times for the SWIR1 and SWIR2 bands, whereas maximum radiance values were detected on June 26, 2006, for the SWIR1 band (347 W/m2srµm) and on 28 October 1998, for the SWIR2 band (367 W/m2srµm). Although, no lava domes were observed during this phase, similar behavior to the thermal radiance described in the 20 February 1990, eruption was observed in the period between April 1999 and September 2000 (Figure 9A,B). Since at least April 1999, the thermal radiance started to increase progressively after 6 months of low radiance in both the SWIR1 and SWIR2 bands. The increase in thermal radiance values was relatively constant until March 2000. After that, the radiance started to decrease (Figure 9A,B). On 20 July 2000, a new, short-lived vulcanian eruption was recorded, generating an eruptive column 11 km high [72]. Local witnesses observed decreased degassing since May 2000, which corresponds with the diminishing thermal anomaly (Figure 7B). Very low radiances were measured after the eruption until early September 2000, when the thermal anomaly increased over several months (Figure 9A,B). We interpreted this behavior to be a response to the temporal inhibition of the degassing in the active crater as a consequence of the continuous subsidence of the crater [75], diminishing the thermal anomaly.
Phase 3 (Figure 8), between July 2007 and March 2013, can be characterized as a quiet phase according to the volcanic activity; no eruptions were recorded. This is in accordance with the very low radiance values measured during this period, being zero in most of the images processed. The maximum radiance values measured were 45 W/m2srµm (6 March 2011) and 79 W/m2srµm (26 October 2009) for the SWIR1, and SWIR2 bands, respectively.
Phase 4 (April 2013–February 2020; Figure 8) is characterized by renewed thermal activity and few eruptions. The thermal activity presented cyclic behavior, characterized by a fast increase in the thermal radiance and then a slow decrease, reaching radiance values equal to zero in the SWIR1 and SWIR2 bands. Three cycles have been recognized during this phase: Cycle 1 between April 2013 and December 2015, cycle 2 from January 2016 to October 2018, and cycle 3, which started on November 2018 and is still ongoing (Figure 10A,B). Similarly than Villarrica Volcano, we compared our data with the seismic information from SERNAGEOMIN, which started permanent seismic monitoring of the Lascar Volcano in late 2010. The beginning of cycle 1 was preceded by a long period (5 years and 8 months) of very low thermal activity (Phase 3). However, between January and February 2012, seismic swarms (over 900 earthquakes, including VT and LP seismicity; Figure 10C,D) and pulsating gas columns were detected. Despite progressively decreasing seismic activity, a new but more restricted seismic swarm occurred in October and November 2012 (55 and 65 earthquakes, respectively), only involving VT seismicity (Figure 10C). In 2012, thermal activity remained low, with radiances of 32 and 24 W/m2srµm for the SWIR1 and SWIR2 bands, respectively, on 23 August 2012. The start of cycle 1 in April 2013 was coincident with a poor-ash-content plume emitted on April 3, 2013 [76]. The cycle rapidly reached peak thermal radiance on 28 April 2013, and 14 May 2013, for the SWIR1 (372 W/m2srµm) and SWIR2 (193 W/m2srµm) bands, respectively (Figure 10A,B). Immediately after, the thermal radiance decreased progressively, reaching zero permanently on 2 April and 18 April 2015, for the SWIR1, and SWIR2 bands, respectively (Figure 10A,B). The seismic activity during this cycle was mostly discrete, but there was a small seismic swarm in July–August 2013 (a total of 318 VT earthquakes) and increased seismic activity between November 2014 and October 2015; a peak number of 206 LP earthquakes were recorded in May 2015 (Figure 10C,D). This period of a high number of LP earthquakes finished with a phreatic eruption on October 30, 2015 (eruptive column 1.5 km high; [77,78]), only two months before of the ending of cycle 1, which coincides with the lowest radiance values for this cycle (Figure 10A,B). After the eruption, the LP seismicity decreased, with three and two earthquakes in November, and December 2015, respectively (Figure 10C,D). Cycle 2 started in January 2016, reaching peaks of thermal radiance on 22 May (183 W/m2srµm) and 3 March 2016 (190 W/m2srµm), for the SWIR1, and SWIR2 bands, respectively. Similar to cycle 1, the thermal radiance started to rapidly decrease, reaching its lowest values in February 2018 (0 W/m2srµm for SWIR1 and SWIR2; Figure 10A,B). The seismic activity was very discrete during the first half of cycle 2. However, in April 2017, renewed seismic activity started with a sustained increase in the number of LP earthquakes, which reached a peak in January 2018, with 187 LP earthquakes/month (Figure 10D). In February 2018, the number LP earthquakes decreased to 5 LP earthquakes/month, whereas in March 2018, a seismic swarm started, reaching a peak number of eruptions in July 2018, with 943 earthquakes/month and involving exclusively VT earthquakes (Figure 10C). This activity agrees with the appearance of a thermal anomaly on 10 April 2018. Although, the thermal anomaly returned to zero immediately after except in some images since July 2018 (Figure 10A,B). No eruptive activity was recorded during cycle 2. Cycle 3 started in November 2018, and its behavior was similar to that of the other two cycles, rapidly reaching peak thermal radiance (6 December 2019, 249 and 240 W/m2srµm for the SWIR1, and SWIR2 bands, respectively) and subsequently progressively descending, although zero values have not been reached yet. No eruptive activity has been recorded during cycle 3 and VT seismicity remains low, varying from 2 to 11 earthquakes/month (Figure 10C). However, since May 2018, a sustained increasing of LP seismicity has been detected, with a peak during December 2018 (168 earthquakes/month) and a subsequent rapid descent, reaching low seismicity in February 2019 (Figure 10D). A new peak of LP earthquakes was observed in November 2019, with 90 earthquakes in one month (Figure 10D).
A common pattern between these three cycles is the behavior of the thermal radiance and the increase in LP seismicity prior to the beginning of a new cycle (or end of a cycle). This pattern can provide insights about the activity in Phase 4 of the Lascar Volcano. If we consider this behavior related to deep processes, combining LP and VT seismicity could be related initially to an increase of magma and/or volatiles (LP seismicity) and rock failure related to magma movement (VT seismicity). However, only a minor portion of fluids is released to the surface, producing a discrete increase in degassing accompanied by very minor explosive activity (as observed on 3 April 2013) or not accompanied by explosive eruptions and consequently by an increase of the thermal anomaly. This behavior was clearly observed prior to cycles 1 and 3, but the seismic activity was followed immediately by a phreatic eruption, prior to cycle 2. Before the eruption on 30 October 2015, 11 months of relative intense LP seismicity was recorded, which seems to be related to the uprising of fluids to the surface, finishing with explosive activity. The absence of eruptive activity prior to the beginning of cycles 1 and 3 could be explained by the occurrence of seismic swarms (VT seismicity), which could be related to magma intrusion or increasing fluid circulation (e.g., [79]), resulting in the “failure” of an eruptive process. Gaete et al. [78] argued that explosive activity on 30 October 2015, was related to external factors (precipitation), which influenced the shallow degassing process, inhibiting degassing, resulting in overpressure of the system and consequently in a phreatic eruption. In this case, LP seismicity could be related to the overheating of meteoric fluids, circulating in the shallow parts of the volcanic conduit, which is consistent with the increased LP seismicity in the months prior to the eruption. Inhibition of the degassing explains the decreased thermal anomaly (Figure 10A,B). In the case of the periods prior to the beginning of cycles 1 and 3, if the precipitation process is considered the main factor that influences the degassing activity in the very shallow volcanic system, the occurrence of VT seismicity could be related to the reactivation of cracks and/or increasing fluids circulation. However, it is not possible to determine its sources, which would determine whether the recorded seismicity was related to deep or shallow processes, due to the lack of information related to the location and magnitude of seismicity.

5. Conclusions, Perspectives and Future Work

In this paper, we have presented a novel, low-cost, and semiautomatic system to process Landsat TM, ETM+, and OLI images to monitor volcanic activity at volcanoes that produce thermal anomalies from different styles of activity, such as lava lakes, lava flows, lava domes, fumarolic fields, and acid lakes. The Volcanic Anomalies Monitoring System (VOLCANOMS) is a public platform where several thermal parameters, including thermal radiance (for SWIR and TIR bands), anomaly area, cold crust temperature, hot crack temperature, effective temperature, TIR brightness temperature, and radiative (for SIWR and TIR bands), gas, convective, and total heat fluxes, are presented, accompanied by raw and processed images. The processing is done online using Python™-based code called Volcanic Imagery Processing System (VIPS), which follows a semiautomatic routine based on the Three Band and Three Components Method (TBTCM) proposed by Harris et al. [38,39] and the OLI-TIRS band processing method of Blackett [27]. Five volcanoes were tested using VOLCANOMS, namely Krakatau, Stromboli, Fuego, Villarrica and Lascar volcanoes, which have different eruptive styles and products emitted, including lava flows, lava domes, lava lakes and pyroclastic flows. There was a concordance between the volcanic-eruptive activity and thermal radiance, similarly in the cases where seismic information was used (Villarrica and Lascar volcanoes).
Our future work will focus on generating and extending the database for VOLCANOMS, which will initially include the Peteroa, Nevados de Chillán, Copahue, Llaima, and Chaitén volcanoes in Chile, which have permanent and sporadic thermal anomalies and several activity styles, such as crater lakes, lava domes, lava flows, open vents, and lava lakes. Subsequently, more active volcanoes from other volcanic areas will be also added. The system will be fed by the information generated from professional users from several Chilean institutions and the authors of this paper. Our main goal is to generate a local, and subsequently, worldwide network for Landsat satellite image-based volcanic monitoring in order to provide satellite surveillance of active volcanoes around the world for research centers, volcanic observatories, and educative institutions.

Supplementary Materials

The following are available online at https://www.mdpi.com/2072-4292/12/10/1589/s1, PDF file S1: Example of a PDF report from VIPS software (14 December 1989) showing (1) pre-processing information, (2) parameters, (3) raw data, (4) thermal radiance, (5) thermal parameters for TIR band, and (6) three bands and three components method results.

Author Contributions

S.L. wrote, reviewed, and edited the manuscript, completed the mathematic structure of VOLCANOMS, and generated all images of this paper; F.A. wrote, reviewed, and edited the draft and supervised the construction of the software; G.R. programmed the code in Python; Á.V. provided data acquisition and image processing; P.S. contributed to the code programming; J.Q. constructed and designed the public web page; P.U. contributed to the code programming; D.U. set up the server and supervised the construction of the software. All authors have read and agreed to the published version of the manuscript.

Funding

This research was funded by the Antofagasta Regional Government, FIC-R project, code BIP Nº30488832-0 and by Research Center for Integrated Disaster Risk Management (CIGIDEN), ANID/FONDAP/15110017; S.L. is funded by CONICYT-PCHA Doctorado Nacional 2016-21160276 fellowship.

Acknowledgments

The authors acknowledge Estefanía Flores and Angelo Araya (Departamento de Ingeniería de sistemas y computación, Universidad Católica del Norte, Chile) for their contribution to the VOLCANOMS System. The authors acknowledge Pietro Tizzani (academic editor) and two anonymous reviewers for the improvement on the original manuscript.

Conflicts of Interest

The authors declare no conflict of interest.

References

  1. Novak, M.A.; Watson, I.M.; Delgado-Granados, H.; Rose, W.I.; Cárdenas-González, L.; Realmuto, V.K. Volcanic emissions from Popocatépetl volcano, Mexico, quantified using Moderate Resolution Imaging Spectroradiometer (MODIS) infrared data: A case study of the December 2000–January 2001 emissions. J. Volcanol. Geoth. Res. 2008, 170, 76–85. [Google Scholar] [CrossRef]
  2. Nadeau, P.; Palma, J.L.; Waite, G. Linking volcanic tremor, degassing and eruption dynamics via SO2 imaging. Geophys. Res. Lett. 2011, 38, L01304. [Google Scholar] [CrossRef]
  3. Dehn, J.; Dean, K.; Engle, K. Thermal monitoring of North Pacific volcanoes from space. Geology 2000, 28, 755–758. [Google Scholar] [CrossRef]
  4. Schneider, D.J.; Dean, K.G.; Dehn, J.; Miller, T.P.; Kirianov, V.Y. Monitoring and analyses of volcanic activity using remote sensing data at the Alaska Volcano Observatory: Case study fro Kamchatka, Rusia, December 1997. In Remote Sensing of Active Volcanism; Mouginis-Mark, P.K., Crisp, J.A., Fink, J.H., Eds.; American Geophysical Union: Washington, DC, USA, 2000; Volume 116, pp. 65–85. [Google Scholar]
  5. Neal, C.; Herrick, J.A.; Girina, O.A.; Chibisova, M.V.; Rybin, A.V.; McGimsey, R.; Dixon, J. 2010 Volcanic activity in Alaska, Kamchatka, and the Kurile Islands: Summary of events and response of the Alaska Volcano Observatory. In U.S. Geological Survey Scientific Investigations Report; United States Geological Survey: Reston, VA, USA, 2014; Volume 5034, pp. 17–62. [Google Scholar]
  6. Patrick, M.R.; Kauahikaua, J.; Orr, T.; Davies, A.; Ramsey, M. Operational thermal remote sensing and lava flow monitoring at the Hawaiian Volcano Observatory. Geol. Soc. Spec. Publ. 2016, 426, 489–503. [Google Scholar] [CrossRef]
  7. Parker, A. In Frontiersi, An Investigation of International Volcano Monitoring Techniques: To Provide an Evidence Base for Future Support of the Rabaul Volcano Observatory by the Australian Government. 2018. Available online: https://frontiersi.com.au/wp-content/uploads/2019/02/FrontierSI-Investigation-of-International-Volcano-Monitoring-Report.pdf (accessed on 15 May 2020).
  8. Wright, R. MODVOLC: 14 years of autonomous observations of effusive volcanism from space. Geol. Soc. Spec. Publ. 2015, 426, 23–53. [Google Scholar] [CrossRef] [Green Version]
  9. Valade, S.; Ley, A.; Massimetti, F.; D’Hondt, O.; Laiolo, M.; Coppola, D.; Loibi, D.; Hellwich, O.; Walter, T. Towards global volcano monitoring using multisensor Sentinel Missions and artifical Intelligence: The MOUNTS monitoring system. Remote Sens. 2019, 11, 1528. [Google Scholar] [CrossRef] [Green Version]
  10. Coppola, D.; Laiolo, M.; Cigolini, C.; Massimetti, F.; Delle Donne, D.; Ripepe, M.; Arias, H.; Barsotti, S.; Bucarey, C.; Centeno, R.; et al. Thermal remote sensing for global volcano monitoring: Experiences from the MIROVA system. Front. Earth Sci. 2020, 7, 362. [Google Scholar] [CrossRef] [Green Version]
  11. Gawarecki, S.J.; Lyon, R.J.P.; Nordberg, W. Infrared spectral returns and imagery of the Earth from space and their application to geological problems. In Scientific Experiments for Manned Orbital Flight; Badgley, P.C., Ed.; American Astronautical Society: San Diego, CA, USA, 1965; Volume 4, pp. 13–133. [Google Scholar]
  12. Harris, A. Thermal Remote Sensing of Active Volcanoes: A User’s Manual; Cambridge University Press: Cambridge, UK, 2013; p. 450. [Google Scholar]
  13. Ramsey, M.S.; Harris, A.J.L. Volcanology 2020: How will thermal remote sensing of volcanic surface activity evolve over the next decade? J. Volcanol. Geotherm. Res. 2013, 249, 217–233. [Google Scholar] [CrossRef]
  14. Wright, R.; Flynn, L.P.; Garbeil, H.; Harris, A.J.; Pilger, E. MODVOLC: Near-real-time thermal monitoring of global volcanism. J. Volcanol. Geotherm. Res. 2004, 135, 29–49. [Google Scholar] [CrossRef]
  15. Wright, R.; Flynn, L.; Garbeil, H.; Harris, A.; Pilger, E. Automated volcanic eruption detection using MODIS. Remote Sens. Environ. 2002, 82, 135–155. [Google Scholar] [CrossRef] [Green Version]
  16. Labazuy, P.; Gouhier, M.; Harris, A.; Guéhenneux, Y.; Hervo, M.; Bergès, J.C.; Fréville, P.; Cacault, P.; Rivet, S. l-time monitoring of the April–May 2010 Eyjafjallajökull ash cloud: An example of a web-based, satellite data-driven, reporting system. Int. J. Environ. Pollut. 2012, 48, 262–272. [Google Scholar] [CrossRef]
  17. Gouhier, M.; Guéhenneux, Y.; Labazuy, P.; Cacault, P.; Decriem, J.; Rivet, S. HOTVOLC: A web-based monitoring system for volcanic hot spots. Geol. Soc. Spec. Publ. 2016, 426, 223–241. [Google Scholar] [CrossRef]
  18. Coppola, D.; Laiolo, M.; Gigolini, C.; Delle Donne, D.; Ripepe, M. Enhanced volcanic hot-spot detection using MODIS IR data: Results from the Mirova system. Geol. Soc. Spec. Publ. 2015, 426, 181–205. [Google Scholar] [CrossRef]
  19. Palma, J.L.; Courtland, L.; Charbonnier, S.; Tortini, R.; Valentine, G. Vhub: A knowledge management system to facilitate online collaborative volcano modeling and research. J. Appl. Volcanol. 2014, 3, 2. [Google Scholar] [CrossRef] [Green Version]
  20. Trunk, L.; Bernard, A. Investigating crater lake warming using ASTER thermal imagery: Case studies at Ruapehu, Poás, Kawah Ijen, and Copahue Volcanoes. J. Volcanol. Geotherm. Res. 2018, 178, 259–270. [Google Scholar] [CrossRef]
  21. Pieri, D.; Abrams, M. ASTER observations of thermal anomalies preceding the April 2003 eruption of Chikurachki volcano, Kurile Islands, Russia. Remote Sens. Environ. 2005, 99, 84–94. [Google Scholar] [CrossRef]
  22. Rose, S.; Ramsey, M. The 2005 eruption of Kliuchevskoi volcano: Chronology and processes derived from ASTER spaceborne and field-based data. J. Volcanol. Geotherm. Res. 2009, 184, 367–380. [Google Scholar] [CrossRef]
  23. Jay, J.A.; Welch, M.; Pritchard, M.E.; Mares, P.J.; Mnich, M.E.; Melkonian, A.K.; Aguilera, F.; Naranjo, J.A.; Sunagua, M.; Clavero, J. Volcanic hotspots of the central and southern Andes as seen from space by ASTER and MODVOLC between the years 2000 and 2010. Geol. Soc. Spec. Publ. 2013, 380, 161–185. [Google Scholar] [CrossRef]
  24. Murphy, S.W.; Wright, R.; Oppenheimer, C.; Souza Filho, C.R. MODIS and ASTER synergy for characterizing thermal volcanic activity. Remote Sens. Environ. 2013, 131, 195–205. [Google Scholar] [CrossRef]
  25. Rothery, D.A.; Francis, P.W.; Wood, C.A. Volcano monitoring using short wavelength infrared data from satellites. J. Geophys. Res. 1988, 93, 7993. [Google Scholar] [CrossRef]
  26. Flynn, L.P.; Harris, A.J.L.; Wright, R. Improved identification of volcanic features using Landsat 7 ETM+. Remote Sens. Environ. 2001, 78, 180–193. [Google Scholar] [CrossRef]
  27. Blackett, M. Early analysis of Landsat-8 thermal infrared sensor imagery of volcanic activity. Remote Sens. 2014, 6, 2282–2295. [Google Scholar] [CrossRef] [Green Version]
  28. Urai, M. Volcano monitoring with Landsat TM short-wave infrared bands: The 1990-1994 eruption of Unzen Volcano, Japan. Int. J. Remote Sens. 2010, 21, 861–872. [Google Scholar] [CrossRef]
  29. González, C.; Inostroza, M.; Aguilera, F.; González, R.; Viramonte, J.; Menzies, A. Heat and mass flux measurements using Landsat images from the 2000-2004 period, Lascar volcano, northern Chile. J. Volcanol. Geotherm. Res. 2015, 301, 277–292. [Google Scholar] [CrossRef]
  30. Harris, A.; Flynn, L.; Keszthelyi, L.; Mouginis-Mark, P.; Rowland, S.; Resing, J. Calculation of lava effusion rates from Landsat TM data. Bull. Volcanol. 1998, 60, 52–71. [Google Scholar] [CrossRef]
  31. Wright, R.; Flynn, L.; Harris, A. Evolution of lava flow-fields at Mount Etna, 27–28 October 1999, observed by Landsat 7 ETM+. Bull. Volcanol. 2001, 63, 1–7. [Google Scholar] [CrossRef]
  32. Harris, A.; Rose, W.; Flynn, L. Temporal trends in lava dome extrusion at Santiaguito 1922-2000. Bull. Volcanol. 2003, 65, 77–89. [Google Scholar] [CrossRef] [Green Version]
  33. Marchese, F.; Genzano, N.; Neri, M.; Falconieri, A.; Mazzeo, G.; Pergola, N. A multi-channel algorithm for mapping volcanic thermal anomalies by Means of Sentinel-2 MSI and Landsat-8 OLI data. Remote Sens. 2019, 11, 2876. [Google Scholar] [CrossRef] [Green Version]
  34. Oppenheimer, C.; Francis, P.W.; Rothery, D.A.; Carlton, R.W.T.; Glaze, L.S. Infrared image analysis of volcanic thermal features: Láscar volcano, Chile, 1984–1992. J. Geophys. Res. 1993, 98, 4269. [Google Scholar] [CrossRef]
  35. Chander, G.; Markham, B.; Herlder, D. Summary of current radiometric calibration coefficients for Landsat MSS, TM, ETM+, and EO-1 ALI sensors. Remote Sens. Environ. 2009, 113, 893–903. [Google Scholar] [CrossRef]
  36. Harris, A.; Stevenson, D. Magma budgets and steady-state activity of Vulcano and Stromboli. Geophys. Res. Lett. 1997, 24, 1043–1046. [Google Scholar] [CrossRef]
  37. Wooster, M.J.; Rothery, D.A. Time-series analysis of effusive volcanic activity using the ERS along track scanning radiometer: The 1995 eruption of Fernandina volcano, Galápagos Islands. Remote Sens. Environ. 1997, 62, 109–117. [Google Scholar] [CrossRef]
  38. Harris, A.; Flynn, L.; Rothery, D.; Oppenheimer, C.; Sherman, S. Mass flux measurements at active lava lakes: Implications for magma recycling. J. Geophys. Res. 1999, 104, 7117–7136. [Google Scholar] [CrossRef]
  39. Harris, A.; Wright, R.; Flynn, L. Remote monitoring of Mount Erebus volcano, Antarctica, using Polar Orbiters: Progress and Prospects. Remote Sens. 1999, 20, 3051–3071. [Google Scholar] [CrossRef] [Green Version]
  40. Kays, W.; Crawford, M. Convective Heat and Mass Transfer, 2nd ed.; McGraw-Hill Ryerson: New York, NY, USA, 1980; p. 420. [Google Scholar]
  41. Incropera, F.; DeWitt, D. Fundamentals of Heat and Mass Transfer, 4th ed.; John Wiley and Sons: New York, NY, USA, 1996; p. 886. [Google Scholar]
  42. Anderson, A.T. Some basaltic and andesitic gases. Rev. Geophys. 1975, 13, 37–55. [Google Scholar] [CrossRef]
  43. Gerlach, T.M. Interpretation of volcanic gas data from tholeiitic and Alkaline Mafic Lavas. Bull. Volcanol. 1982, 45, 235–244. [Google Scholar] [CrossRef] [Green Version]
  44. Oppenheimer, C. Lava flow cooling estimated from Landsat Thermal Mapper infrared data: The Lonquimay eruption (Chile, 1989). J. Geophys. Res. 1991, 96, 21865–21878. [Google Scholar] [CrossRef]
  45. Camus, G.; Gourgaud, A.; Vincent, P.M. Petrologic evolution of Krakatau (Indonesia): Implications for a future activity. J. Volcanol. Geotherm. Res. 1987, 33, 299–316. [Google Scholar] [CrossRef]
  46. Global Volcanism Program. In Global Volcanism Program, Krakatau (Indonesia) Strombolian, Lava Flow, and Explosive Activities Resume, June–October 2018. 2018. Available online: https://volcano.si.edu/showreport.cfm?doi=10.5479/si.GVP.BGVN201810-262000 (accessed on 16 May 2020).
  47. Global Volcanism Program. In Global Volcanism Program, Krakatau (Indonesia) Ash Plumes, Balistic Ejecta, and Lava Extrusion during October-December; Partial Collapse and Tsunami in Late December; Surtseyan Activity in December-January 2019. 2019. Available online: https://volcano.si.edu/showreport.cfm?doi=10.5479/si.GVP.BGVN201903-262000 (accessed on 16 May 2020).
  48. Speranza, F.; Pompilio, M.; D’Ajello Caracciolo, F.; Sagnotti, L. Holocene eruptive history of the Stromboli volcano: Constraints from paleomagnetic dating. J. Geophys. Res. 2008, 113, B09101. [Google Scholar] [CrossRef]
  49. Calvari, S.; Spampinato, L.; Lodato, L. The 5 April 2003 vulcanian paroxysmal explosion at Stromboli Volcano (Italy) from field observations and thermal data. J. Volcanol. Geotherm. Res. 2005, 149, 160–175. [Google Scholar] [CrossRef]
  50. Global Volcanism Program. Stromboli (Italy). In Global Volcanism Program, Major Explosions on 3 July and 28 August 2019; Hiker Killed by Ejecta. 2019. Available online: https://volcano.si.edu/showreport.cfm?doi=10.5479/si.GVP.BGVN201909-211040 (accessed on 16 May 2020).
  51. Chesner, C.A.; Rose, W. Geochemistry and evolution of the Fuego Volcanic Complex, Guatemala. J. Volcanol. Geotherm. Res. 1984, 21, 25–44. [Google Scholar] [CrossRef]
  52. Vallance, J.W.; Schilling, S.P.; Matías, O.; Rose, W.; Howell, M.M. Volcano hazards at Fuego and Acatenango, Guatemala; United States Geological Survey: Reston, VA, USA, 2001; p. 24. [Google Scholar]
  53. Global Volcanism Program. In Global Volcanism Program, Fuego (Guatemala) Pyroclastic Flows on 3 June 2018 Cause at Least 110 Fatalities, 197, Missing, and Extensive Damage; Ongoing Ash Explosions, Pyroclastic Flows, and Lahars. 2018. Available online: https://volcano.si.edu/showreport.cfm?doi=10.5479/si.GVP.BGVN201808-342090 (accessed on 16 May 2020).
  54. Clavero, J.; Moreno, H. Evolution of Villarrica volcano (39.5° S), southern Andes, Chile. In Villarrica Volcano (39.5° S), Southern Andes, Chile; Lara, L., Clavero, J., Eds.; Servicio Nacional de Geología y Minería: Santiago, Chile, 2004; Volume 61, pp. 17–27. [Google Scholar]
  55. Lara, L. Overview of Villarrica Volcano. In Villarrica Volcano (39.5° S), Southern Andes, Chile; Lara, L., Clavero, J., Eds.; Servicio Nacional de Geología y Minería: Santiago, Chile, 2004; Volume 61, pp. 5–12. [Google Scholar]
  56. Global Volcanism Program. In Global Volcanism Program, Villarrica (Chile) Lava Lake Reappears in February 2015 and Is Ongoing; Large Ash Explosion on 3 March 2015. 2016. Available online: https://volcano.si.edu/showreport.cfm?doi=10.5479/si.GVP.BGVN201611-357120 (accessed on 16 May 2020).
  57. Global Volcanism Program. In Global Volcanism Program, Villarrica (Chile) Lava Lake Level Fluctuates and Strombolian Activity Persists during October 2016–November 2017. 2017. Available online: https://volcano.si.edu/showreport.cfm?doi=10.5479/si.GVP.BGVN201712-357120. (accessed on 16 May 2020).
  58. Global Volcanism Program. In Global Volcanism Program, Villarrica (Chile) Thermal Activity Increases November-December 2017 and July–August 2018; Intermittent Incandescence and Ash. 2018. Available online: https://volcano.si.edu/showreport.cfm?doi=10.5479/si.GVP.BGVN201810-357120 (accessed on 16 May 2020).
  59. Delgado, F.; Pritchard, M.; Ebmeier, S.; González, P.; Lara, L. Recent unrest (2002-2015) imaged by space geodesy at the highest risk Chilean volcanoes: Villarrica, Llaima, and Calbuco (Southern andes). J. Volcanol. Geotherm. Res. 2017, 344, 270–288. [Google Scholar] [CrossRef] [Green Version]
  60. Gardeweg, M.; Amigo, A.; Matthews, S.; Sparks, R.; Clavero, J. Geología del volcán Lascar, Región de Antofagasta; Servicio Nacional de Geología y Minería: Santiago, Chile, 2011; p. 40.
  61. Calder, E.; Sparks, R.S.J.; Gardeweg, M. Erosion, transport and segregation of pumice and lithic clasts in pyroclastic flows inferred from ignimbrite at Lascar Volcano, Chile. J. Volcanol. Geotherm. Res. 2000, 104, 201–235. [Google Scholar] [CrossRef]
  62. González-Ferrán, O. Volcanes de Chile, 1st ed.; Instituto Geográfico Militar: Santiago, Chile, 1995; p. 635. [Google Scholar]
  63. Francis, P.W.; Rothery, D.A. Using the Landsat Thematic Mapper to detect and monitor active volcanoes: An example from Lascar volcano, Northern Chile. Geology 1987, 15, 614–617. [Google Scholar] [CrossRef]
  64. Glaze, L.; Francis, P.W.; Rothery, D.A. Measuring thermal budgets of active volcanoes by satellite remote sensing. Nature 1989, 338, 144–146. [Google Scholar] [CrossRef]
  65. Matthews, S.; Gardeweg, M.; Sparks, R. The 1984 to 1996 cyclic activity of Lascar Volcano, northern Chile: Cycles of dome growth, dome subsidence, degassing and explosive eruptions. Bull. Volcanol. 1997, 59, 72–82. [Google Scholar] [CrossRef]
  66. Gardeweg, M.; Foot, S.; Gaze, L.; Self, S.; Francis, P.; de Silva, S.; Rose, W.; Andres, R. Informe preliminar sobre la evolución de la erupción del volcán Lascar (II Región), noviembre 1989; Servicio Nacional de Geología y Minería: Santiago, Chile, 1989; p. 27.
  67. Global Volcanism Program. Lascar (Chile) Apparent New Lava Dome; Gas and Ash Emission. 1989. Available online: https://volcano.si.edu/showreport.cfm?doi=10.5479/si.GVP.BGVN198903-355100 (accessed on 16 May 2020).
  68. Global Volcanism Program. In Global Volcanism Program, Lascar (Chile) Continued Lava Dome Growth. 1989. Available online: https://volcano.si.edu/showreport.cfm?doi=10.5479/si.GVP.BGVN198906-355100 (accessed on 16 May 2020).
  69. Gardeweg, M. La actividad eruptiva 1986–1990 del volcán Lascar, Región de Antofagasta, Chile. In Proceedings of the 6th Chilean Geological Congress, Viña del Mar, Chile, 5–9 August 1991. [Google Scholar]
  70. Gardeweg, M. Ciclo eruptivo 1985–1993 del volcán Lascar, N. de Chile. In Proceedings of the Cuarta Reunión Internacional volcán de Colima, Colima, Mexico, 22–25 January 1994. [Google Scholar]
  71. Wooster, M. Long-term infrared surveillance of Lascar Volcano: Contrasting activity cycles and cooling pyroclastics. Geophys. Res. Lett. 2001, 28, 847–850. [Google Scholar] [CrossRef]
  72. Aguilera, F.; Martínez, C.; Tassi, F.; Viramonte, J.; Medina, E.; Vargas, H. Actividad del Volcán Lascar en el periodo 2000–2002. In Proceedings of the 10th Chilean Geological Congress, Concepción, Chile, 6–10 October 2003. [Google Scholar]
  73. Aguilera, F.; Viramonte, J.; Medina, E.; Guzmán, K.; Becchio, R.; Delgado, H.; Arnosio, M. Eruptive activity from Lascar Volcano (2003–2005). In Proceedings of the 11th Chilean Geological Congress, Antofagasta, Chile, 7–11 August 2006. [Google Scholar]
  74. Aguilera, F.; Viramonte, J.; Medina, E.; Guzmán, K.; Becchio, R.; Delgado, H.; Arnosio, M. Recent eruptive activity from Lascar volcano (2006). In Proceedings of the 11th Chilean Geological Congress, Antofagasta, Chile, 7–11 August 2006. [Google Scholar]
  75. Global Volcanism Program. In Global Volcanism Program, Lascar (Chile) Five-Day Eruption Sequence in April 2006; Plume Seen 220 km Away. 2006. Available online: https://volcano.si.edu/showreport.cfm?doi=10.5479/si.GVP.BGVN200604-355100 (accessed on 16 May 2020).
  76. Global Volcanism Program. In Global Volcanism Program, Lascar (Chile) Seismicity, Glow, Gray Plumes, and Other Anomalies Suggest April 2013 Eruption. 2013. Available online: https://volcano.si.edu/showreport.cfm?doi=10.5479/si.GVP.BGVN201307-355100 (accessed on 16 May 2020).
  77. Global Volcanism Program. In Global Volcanism Program, Lascar (Chile) Ash Plume on 30 October 2015 Rises 2500 m High; Variable Seismicity and Persistent Thermal Anomaly Afterwards. 2016. Available online: https://volcano.si.edu/showreport.cfm?doi=10.5479/si.GVP.BGVN201607-355100 (accessed on 16 May 2020).
  78. Gaete, A.; Walter, T.; Bredemeyer, S.; Zimmer, M.; Kujawa, C.; Franco, L.; San Martin, J.; Bucarey, C. Processes culminating in the 2015 phreatic explosion at Lascar volcano, Chile, evidenced by multiparametric data. Nat. Hazards Earth Syst. Sci. 2020, 20, 377–397. [Google Scholar] [CrossRef] [Green Version]
  79. Roman, D.C.; Power, J.A. Mechanism of the 1996–97 non-eruptive volcano-tectonic earthquake swarm at Iliamna Volcano. Bull. Volcanol. 2011, 73, 143–153. [Google Scholar] [CrossRef]
Figure 1. (A) Landsat ETM+ image RGB false color composite (band 4-3-2) of the Krakatau Volcano, 9 October 2018, showing an excess of gas and stema produced by intense degasification. (B) Landsat ETM+ image RGB false color composite (band 7-5-4) of the Krakatau Volcano, 9 October 2018, showing the black stripes caused by the SLC failure. (C) Landsat OLI band 7 of the Krakatoa volcano, 4 May 2015, showing the reset (value zero) of saturated pixels in the center of active lava flow.
Remotesensing 12 01589 g001
Figure 2. Flow diagram illustrating the mathematical and computing routines of the Volcanic Imagery Processing System (VIPS) software.
Remotesensing 12 01589 g002
Figure 3. The Volcanic Imagery Processing System (VIPS) workspace. (A) Subset from an ROI. (B) Modal dialog to select the thermally anomalous pixels. (C) Modal dialog to verify the thermally anomalous pixels. (D) Modal dialog to enter thermal parameters. (E) Modal dialog to report problems/errors from the original image. (F) Modal dialog to verify and to iterate manually TBTCM. (G) An example of a processed band.
Remotesensing 12 01589 g003
Figure 4. The Volcanic Anomalies Monitoring System (VOLCANOMS) public web page. (A) Home page and the volcano informative window. (B) Volcano general information. (C) Raw images section. (D) Processed images section. (E) Graphics section. (F) Database section.
Remotesensing 12 01589 g004
Figure 5. Thermal radiance vs. date graphics, showing the most relevant volcanic activity in Krakatau (A,B), Stromboli (C,D) and Fuego (E,F) volcanoes. Red and blue upward arrows show major eruptive activity as lava flows, pyroclastic flows, among others. Red horizontal bar shows a long period of lava flows emission. Light blue horizontal bars show dates where images were covered by clouds. Zero values correspond to absence of thermal anomaly.
Remotesensing 12 01589 g005
Figure 6. Krakatau Volcano: Landsat OLI image of (1 October 2018), RGB false color composite band 7-6-5 and processed SWIR2 band, respectively. Stromboli Volcano: Landsat OLI image (8 August 2019), RGB false color composite band 7-6-5 and processed SWIR2 band, respectively. Fuego Volcano: Landsat OLI image (1 February 2018), RGB false color composite band 7-6-5 and processed SWIR2 band, respectively. Villarrica Volcano: Landsat OLI image (6 February 2015), RGB false color composite band 7-6-5 and processed SWIR2 band, respectively. Lascar Volcano: Landsat TM image (14 December 1989), RGB false color composite band 7-5-4 and processed SWIR2 band, respectively. White boxes indicate the area shown in the second and third rows.
Remotesensing 12 01589 g006
Figure 7. Villarrica Volcano (A) Thermal radiance of SWIR1 band vs. date for the period March 2014–February 2018. (B) Thermal radiance of SWIR2 band vs. date for the period March 2014–February 2018. (C) VT seismicity vs. date for the period March 2014–February 2018. (D) LP seismicity vs. date for the period March 2014–February 2018. The upward arrows show the occurrence of the March 3, 2015, Hawaiian eruption.
Remotesensing 12 01589 g007
Figure 8. Lascar Volcano. Thermal radiance vs. date graphics, showing the four phases defined by the correlation between thermal radiance and volcanic activity. The a, b, and c squares indicate the periods considered in Figure 9 and Figure 10. (A) Thermal radiance of SWIR1 band. (B) Thermal radiance of SWIR2 band.
Remotesensing 12 01589 g008
Figure 9. Lascar Volcano. Thermal radiance versus date graphics, showing the most relevant volcanic activity. Red and orange downward arrows show major and minor eruptive activity, respectively, whereas green upward arrows show records of lava domes. Zero values correspond to absence of thermal anomaly. (A) Thermal radiance of SWIR1 band for lava dome-and-growth cycle 2 during phase 1. (B) Thermal radiance of SWIR2 band for lava dome-and-growth cycle 2 during phase 1. (C) Thermal radiance of SWIR1 band for the period April 1999–December 2000 during phase 2. (D) Thermal radiance of SWIR2 band for the period April 1999–December 2000 during phase 2.
Remotesensing 12 01589 g009
Figure 10. Lascar Volcano. (A) Thermal radiance of SWIR1 band vs. date for the period January 2012–February 2020. (B) Thermal radiance of SWIR2 band vs. date for the period January 2012–February 2020. (C) VT seismicity vs. date for the period January 2012–February 2020. (D) LP seismicity vs. date for the period January 2012–February 2020. The upper part shows phases 3 and 4, and the three cycles defined by the correlation between thermal radiance and volcanic activity in phase 4. The orange line indicates the occurrence of the 30 October 2015, phreatic eruption and the upward green arrows indicate strong gas emissions.
Remotesensing 12 01589 g010

