Article

Airborne Electromagnetic, Magnetic, and Radiometric Surveys at the German North Sea Coast Applied to Groundwater and Soil Investigations

1
Federal Institute for Geosciences and Natural Resources (BGR), 30655 Hannover, Germany
2
State Authority for Mining, Energy and Geology (LBEG), 30655 Hannover, Germany
3
Leibniz Institute for Applied Geophysics (LIAG), 30655 Hannover, Germany
*
Author to whom correspondence should be addressed.
Remote Sens. 2020, 12(10), 1629; https://doi.org/10.3390/rs12101629 (registering DOI)
Submission received: 29 April 2020 / Revised: 15 May 2020 / Accepted: 18 May 2020 / Published: 19 May 2020
(This article belongs to the Special Issue Airborne Electromagnetic Surveys)

Abstract

:
The knowledge of the subsurface down to about one hundred meters is fundamental for a variety of economic, ecological, and geoscientific tasks, particularly in coastal zones. Marine and terrestrial processes influence coastal zones and both seawater intrusion and submarine freshwater discharges may occur. The Federal Institute for Geosciences and Natural Resources (BGR) conducted airborne geophysical surveys in the coastal region of the German Bight between 2000 and 2014. The helicopter-borne system used simultaneously collected electromagnetic (HEM), magnetic (HMG), and radiometric (HRD) data. An area of about 5900 km2 was covered with parallel flight lines at 250 m line separation and additional tie-lines at larger separations. In total, about 25,000 km of data at sampling distances of 4 m (HEM, HMG) and 40 m (HRD) were acquired. The electrical resistivity (HEM), the anomalies of the magnetic field (HMG), and the exposure rate (HRD) are the resulting geophysical parameters derived from the data. The results are displayed as maps of the geophysical parameters as well as vertical resistivity sections (only HEM). Both data and products are publicly available via BGR’s product center. The airborne geophysical results helped to outline the fresh–saline groundwater interface, freshwater lenses on islands, submarine groundwater discharges, buried tunnel valleys, mires, and ancient landscapes.

Graphical Abstract

1. Introduction

Coastal zones are influenced by both marine and terrestrial processes that are highly dynamic and continually change in time. The management of groundwater resources in coastal areas is a difficult task because the hydrological processes are complex and the lack of observational data often prevents a sufficient understanding of that resource [1]. Furthermore, the knowledge of the subsurface is fundamental for an increased understanding to solve a variety of economic, ecological, and geoscientific tasks. In order to investigate the physical properties of the subsurface in situ, ground-based or airborne geophysical measurements are necessary (e.g., [2,3,4]).
In Germany, mapping was usually carried out on a local to regional scale using ground-based methods, but only where this was required by law or where specific geoscientific studies were performed. Such ground-based surveys are inefficient to map large areas. Airborne surveys help to overcome this difficulty, as demonstrated in other countries with national survey campaigns, e.g., in Finland [5] and Ireland [6]. Furthermore, airborne surveys are able to provide spatial data sets, which could be linked to other spatial data sets. For example, displaying airborne geophysical results with respect to high-resolution elevation models enables us to link surface data with spatial geophysical data of the subsurface. The upper one hundred meters of the subsurface are of particular importance, because the fundamental exchange and transport processes are taking place here, e.g., for salts and other minerals, fertilizers, and pollutants.
Before 2000, high-resolution airborne geophysical surveys were applied in Germany only for certain isolated areas. Then, the Federal Institute for Geosciences and Natural Resources (BGR) began to use their helicopter system to survey some areas at the north German coast [7]. Within the in-house project “Airborne Geophysical Surveys for Mapping the Shallow Subsurface in Germany – D-AERO” [8], which started in 2007, BGR conducted complementing surveys and gradually merged the survey areas [9]. Besides standard mapping, BGR—together with state geological surveys and research institutes—tested airborne geophysics for new applications and thematic mapping.
The helicopter-borne geophysical system used for these surveys consisted of three simultaneously applied methods: frequency-domain electromagnetics (HEM), total field magnetics (HMG), and 256-channel gamma-ray spectrometry (HRD). HEM is suitable to reveal electrical conductivities within the upper hundred meters of the subsurface and provides useful information for hydrogeological and geological interpretation (e.g., [10,11]). HMG helps to investigate rocks of different magnetization, indicating regional fault systems, mineral resources, or bedrock depths (e.g., [12,13]), as well as near-surface disposal sites [14]. HRD measures the natural gamma radiation of the surface and can be used to distinguish different types of soil (e.g., [15,16]). Particularly, the combination of these methods [17] are suitable for any kind of geological or hydrogeological interpretation.
This paper presents an overview of the airborne geophysical data available along the coastal area of northwest Germany. The general results of the entire survey area as well as a number of specific applications are shown.

2. Study Area German North Sea Coast

The coastal region of the German Bight containing the East Frisian Islands, the tidal flats, and the marshes are the youngest landscape elements in Lower Saxony (Figure 1). Most of the sediments in this area have been deposited during the Quaternary and the accumulation is still continuing. During the last 2.6 million years, the coastal region was formed due to climate changes with at least three glacial periods, which were interrupted by two interglacials (Holsteinian and Eemian), related fluctuations in sea level, and resulting depositional conditions [18]. These valleys were filled with meltwater sediments consisting of till material, gravel, sand, silt, and clay. In particular, the advances of inland ice masses from Scandinavia and the British/Scottish highlands during the Elsterian as well as the Saalian glacial stages left striking, still distinguishable traces, such as terminal moraines, in parts of the North Sea basin [19]. In the Elsterian glacial period, the first ice age, which covered northern Europe with a few-kilometer-thick ice shield, meltwater deposits and glacial till were deposited in different thicknesses [20]. Up to 500-m-deep, north–south- or northwest–southeast-oriented subglacial valleys were formed by meltwater incision [18].
At the end of the Elsterian glaciation, the climate heated up and the Lauenburg clay, an important glaciolacustrine stratigraphic marker, was deposited on top of the subglacial valleys. The sediments of the Lauenburg clay are clayey to silty, sometimes fine sandy, calcareous basin deposits, which occur in different thicknesses and depths [21]. The Saalian glaciation is characterized by several changes of warm and cold periods [22]. Northern Germany was affected by two Saalian main ice advances, the “Drenthe” and the “Warthe” advance. During the interglacial stages of the Holsteinian and Eemian, which followed the Elsterian and the Saalian glaciations, respectively, typical marine-brackish coastal sediments were deposited. With the exception of some deep embayments into the mainland, the spatial distribution of these sediments is nearly coincident with the recent southern North Sea coastline [23]. In the Weichselian glaciation, the global sea level decreases rapidly by approximately 110–130 m [24]. The entire North Sea area was exposed, the coastline was shifted approximately 600 km to the west, and periglacial processes left their traces in the deposits [19]. After the Weichselian glaciation, the inland ice shields began to melt down and the sea level rose and reached the southern North Sea during the Holocene. The characteristic landscape with the East Frisian Islands, the tidal flats, and the marshland developed in the past 8500 years [25]. During this period, tidal currents and waves penetrated further into the hinterland and eroded the exposed higher parts of the former submerged Pleistocene landscape. Large quantities of reworked sediment were shifted landward, building up a wedge-shaped body of Holocene marine and brackish deposits [23]. On top of this cohesive sediment body, the coastal zone was formed by salt marshes, tidal flat deposits, and in parts by barrier islands (East Frisian Islands) with dunes of a height of up to 30 m [23].
Following the sea level, the groundwater table also rose, resulting in wide-ranging water logging and the formation of peat bogs. Although frequently eroded by the transgressing sea, these basal peat layers often mark the beginning of the Holocene depositional history of an area [26]. The characteristic series of Holocene deposits consist of strata of fine-grained sand, silt, clay, and intercalated layers of peat [26]. After the Weichselian glaciation (Elsterian, Saalian, and Weichselian), the inland ice shields began to melt down and the sea level rose. The characteristic series of Holocene deposits consist of strata of fine-grained sand, silt, clay, and intercalated layers of peat [26].
The main challenge in the study of coastal aquifers in northern Germany is the fresh–saline groundwater boundary. Intrusion of seawater is a global challenge that is affected by sea level rise, changes in recharge, and anthropogenic effects such as groundwater extraction or surface drainage and canalization [27]. The coastal regions in Lower Saxony are characterized by low groundwater recharge rates in the marshland—interpreted on the basis of widespread Holocene brackish and marine cohesive sediments—and higher recharge rates in the moraine areas (Figure 1). The groundwater table is located very close to the surface and the upper aquifer system is between 50 and 200 m thick [28]. The main aquifer consists of Pliocene to Saalian medium to coarse sands, in which low permeability layers are enclosed.

3. Airborne Geophysical Data

BGR operated helicopter-borne geophysical survey systems used to map large parts of the German North Sea coastal region over the past two decades [9]. The raw and processed data sets as well as the resulting products of these airborne surveys are publicly available via BGR’s product center.

3.1. Survey Systems

The helicopter-borne geophysical survey systems simultaneously recorded electromagnetic, magnetic, radiometric, as well as position data (Figure 2, Table 1). While the gamma-ray spectrometer and the navigation systems were mounted on a helicopter (Sikorsky S-76B), all other systems (electromagnetic device, cesium magnetometer, laser altimeter, global positioning system (GPS) receiver) were installed in a tube, the bird, which was towed about 40 m beneath the helicopter and 30–60 m above the ground. Most of the data sets were sampled at 10 Hz, except the radiometric data, which was sampled at 1 Hz, resulting in sample distances of 4 and 40 m, respectively.
Helicopter-borne frequency-domain electromagnetics (HEM) is an active method which uses transmitters (coils) to generate time-varying magnetic dipole fields (primary fields) in order to induce eddy currents in an electrically conductive subsurface. In turn, these eddy currents generate secondary magnetic fields, which are detected by receivers (coils). The ratios of secondary and primary fields (measured in ppm) are used to reveal the subsurface electrical conductivity distribution. Helicopter-borne magnetics (HMG) records the magnetic field, which is caused by the main field of the Earth, the diurnal variations, and sources located in the subsurface. Helicopter-borne radiometrics (HRD) is a passive method that measures the natural radioactivity of the shallow subsurface. Gamma-ray spectrometers detect the radiation from the three naturally occurring radioelements: potassium, uranium, and thorium in the soil.
The surveys started in 2000 with a system that consisted of an analog five-frequency (5F) HEM bird including a Cs magnetometer and a 256-channal gamma-ray spectrometer with four sodium iodide (NaI) crystals (Table 1, system 1). The HEM bird (DighemBGR), especially designed for BGR, used five horizontal-coplanar (HCP) rectangular coil systems with transmitter-receiver (T-R) distances of about 6 m [14]. Since 2004, two similar Resolve birds (manufactured at the time by Fugro Airborne Surveys) have been used. These birds consisted of five horizontal-coplanar circular coils systems with T-R distances of about 8 m (Table 1, systems 2 and 3). The operating frequencies of these birds were similar (f = 0.4, 1.8, 8.4, 41, and 130 kHz), but not identical (the frequencies of the first two systems were somewhat higher in general, particularly the highest frequency of system 1: f = 193 kHz). The latest versions of both Resolve birds, updated in 2007 [10], have an additional vertical-coaxial (VCX) coil system with a T-R distance of about 9 m (operating frequency: f = 5.5 kHz). While the Cs magnetometers (Geometrics G-822A) installed in the HEM birds remained unchanged, the spectrometer (Exploranium GR-820) was first upgraded with an upward-looking crystal in 2004 and then replaced by a modern one (Radiation Solution RS-500) in 2013.

3.2. Survey Areas

The airborne surveys took place between 2000 and 2014 (Table 2) using various airborne geophysical systems (Table 1). With 13 surveys, a total survey area of about 5900 km2 was covered. The nominal line separation was 250 m, but the separation of the tie-lines varied (500, 1000, 2000, 2500 m) depending on the size of the survey area. In total, about 25,000 line-km were achieved. The surveys extended over an area beginning at the city of Hamburg in the east—over the cities of Cuxhaven, Bremerhaven, and Wilhelmshaven in the center—to the city of Aurich in the west and included the East Frisian Islands of Borkum, Baltrum, Langeoog, and the western half of Spiekeroog. Some surveys also covered portions of the Wadden Sea (Figure 1).

3.3. Data Processing

The general aim of data processing is to derive physical parameters from the raw data that are useful for the interpretation of subsurface structures. This implies the elimination of those portions in the data affected by influences not belonging to the subsurface (noise, drift, anthropogenic effects), applying filters, leveling, and semi-automatic deselections. We processed the airborne data using in-house software tools [16,33] and Geosoft’s software package Oasis montaj [34], suitable for processing and visualization of airborne and other large data sets. All maps presented here are based on minimum curvature grids [35,36] of cell size 50 m, 50 m search radius, 200 m blanking distance, 100 m extrapolation and tension 1.

3.3.1. Position Data

A GPS and laser altimeter installed in the bird (Figure 2) recorded bird position and altitude data, respectively. These data sets were used to calculate the surface elevation. We compared this elevation with digital elevation models (DEM) [29] in order to identify and, to a certain degree, to correct errors of the position data, such as GPS drifts and jumps or tree canopy and attitude effects.

3.3.2. Electromagnetic Data

HEM data processing included calibration, baseline leveling, correction of anthropogenic effects, and 1D inversion. Calibration compares measured data with known quantities. Initial calibration factors provided by the manufacturer were adjusted using flights over highly conductive North Sea water and repeated flights over onshore calibration lines. Baseline leveling is necessary, because temperature variations affect the system electronics. Level errors were detected and corrected using high-altitude data (baseline picking) and spatial filters (baseline adjustment) [37]. As the HEM system is not only sensitive to the subsurface conductivity distribution, but also to metallic installations at the surface, these anthropogenic effects (also known as man-made effects or cultural noise) were detected and removed from the data [33].
The complex amplitudes of the HEM data, the relative secondary magnetic fields, depend on system frequency and altitude as well as on physical parameters of the subsurface, predominately the resistivity ρ (inverse of electrical conductivity). In order to reveal the subsurface parameters, the HEM data have to be inverted. Inversion tries to find a model that explains the data. We used two principal models, the homogeneous half-space and the layered half-space. The homogeneous half-space inversion uses single-frequency data and provides two model parameters, apparent resistivity ρa (half-space resistivity) and apparent distance Da of the HEM sensor to the top of the half-space (air-layer thickness). From both, a centroid depth z* = Da – h + 251 (ρa/f)1/2 [38], with h = laser altitude, is derived, which is regarded as the center of current flow in a homogeneous half-space [39]. This measure for the mean depth of investigation demonstrates that deeper regions are revealed by lower frequencies and higher resistivities. The model of an M-layered half-space (1D model) is used to invert the data of all Nf frequencies available together. This kind of model, which consists of M layer resistivities and M-1 layer thicknesses, is particularly important to reveal the dominant layers or interfaces of a subsurface. We applied a Levenberg–Marquardt single-site inversion approach, i.e., without lateral constraints, using starting models derived from ρa–z* sounding curves [10,40]. Smooth models can be achieved increasing the number of layers and the strength of regularization [41,42].

3.3.3. Magnetic Data

Magnetic signals measured by total field magnetometer is a scalar quantity T that include the superposition of the geomagnetic main field of the Earth, the diurnal variations, and local components. The sources of the latter can be located within the Earth (magnetization within the crust), at or close to the surface of the Earth (infrastructure containing iron), or in the air (helicopter). Main field and diurnal variations can be removed using the International Geomagnetic Reference Field (IGRF) and base station data, respectively. The IGRF describes the large-scale structure of the Earth’s main magnetic field and its secular variation by a mathematical model, which is updated every five years [43]. We used the set of spherical harmonic coefficients of 2010. The base stations located close to the individual survey areas recorded the changes of the magnetic field with time. The influences of the anthropogenic sources have to be identified and corrected to extract the geogenic anomalies of the magnetic field ΔT. Maps of magnetic anomalies are often dominated by long-wavelength signatures originating from deeper sections of the crust and by short-wavelength anomalies of varying magnitude originating from anthropogenic sources, mostly settlements, streets, power lines etc. In order to reveal also weak magnetic structures originating from geogenic sources in the uppermost crust, the anomaly maps have to be free from anthropogenic anomalies and to be filtered in the space domain.
For the removal of anthropogenic anomalies, a number of processes were applied to the grid and trace data. Grid operations included the morphological operators dilatation and erosion, explained, e.g., in [44]. The first step was to create a binary raster map (pixel size 25 m) of the area that contained all the infrastructure elements of the official topographic maps [45]. In order to widen the elements in the map by about 50 m in all directions, a 3 × 3 dilatation operator was applied to the binary image twice. The resulting image served to mask the ΔT traces and a new ΔT grid, which was clear of a large part of disturbances, was produced. Remaining short-wavelength anomalies of relatively high amplitude were attributed to anthropogenic sources not recorded on the topographic maps. These type of signals are strongly enhanced in maps of the analytic signal (AS), which is defined as the Euclidian norm of the three spatial gradients of the magnetic field. An AS grid was produced for the ΔT grid and a threshold of 0.05 nT/m was applied to it, followed by a three-fold erosion and a two-fold dilatation operator, each of size 3 x 3. The resulting grid represented a clean raster map of undisturbed areas and was used for masking the ΔT data once again. The grid of the final cleaned ΔT data was virtually free of short-wavelength-high-amplitude anomalies and therefore considered as free from anthropogenic disturbances. Ultimately, however, it could not be excluded that anthropogenic anomalies were still present in the data and that geogenic anomalies had been removed from the data.
In order to reveal local small-scale anomalies in the cleaned ΔT data, the grid was bandpass-filtered in the wavelength range of 500 to 5000 m. The reduction to the pole method (RTP, [46]) was applied to the filtered grid in order to correct the positions of the magnetic anomalies according to the inclination and declination of the Earth’s magnetic field vector in the region. Since the single surveys in the region had been carried out in different years, mean values for inclination and declination of the field vector were formed and used for the reduction (inclination = 68°, declination = 1°).

3.3.4. Radiometric Data

The airborne gamma-ray spectra recorded by the spectrometer require a number of processing steps in order to correct effects caused by interaction and attenuation of the gamma rays when travelling from the source through the air to the detector in the helicopter. We largely used standard procedures described in the recommendations of the International Atomic Energy Agency [47]. After a gain stabilization, the so-called window method was applied to the spectra. This method is based on energy windows within the gamma spectrum that are associated to the three naturally occurring radioelements: potassium (K), uranium (U), and thorium (Th). The windows are located around the 1460 keV peak of K-40, the most prominent gamma peak in the U-238 decay chain (1765 keV of Bi-214) and the most prominent peak in the Th-232 decay chain (2614 keV of Tl-208). The integral count rate within each window is related to the abundance of the associated radioelement, assuming that the decay products Bi-214 and Tl-208 are in equilibrium with their parent elements. Various correction and processing steps were applied to the window count rates using system specific calibration parameters. These included background, stripping and height attenuation corrections, low-pass filtering, and the application of sensitivity factors leading to (in case of U and Th, equivalent) ground concentrations of the three elements as well as the calculation of the exposure rate:
E [µR/h] = 1.505 K [%] + 0.653 eU [ppm] + 0.287 eTh [ppm].
A grid-based median filter of radius 50 m (one grid cell) was applied to the final data in the grid domain to lower the high noise portion resulting from the statistical properties of radioactive decay.

4. Results

We start with the presentation of the general results of the three airborne geophysical methods achieved for the entire survey area and then show some specific local features. The data of the 13 survey areas were individually processed and combined to three databases (one per method) from which the maps of the entire survey area were derived.

4.1. General Results

4.1.1. Results of Electromagnetics

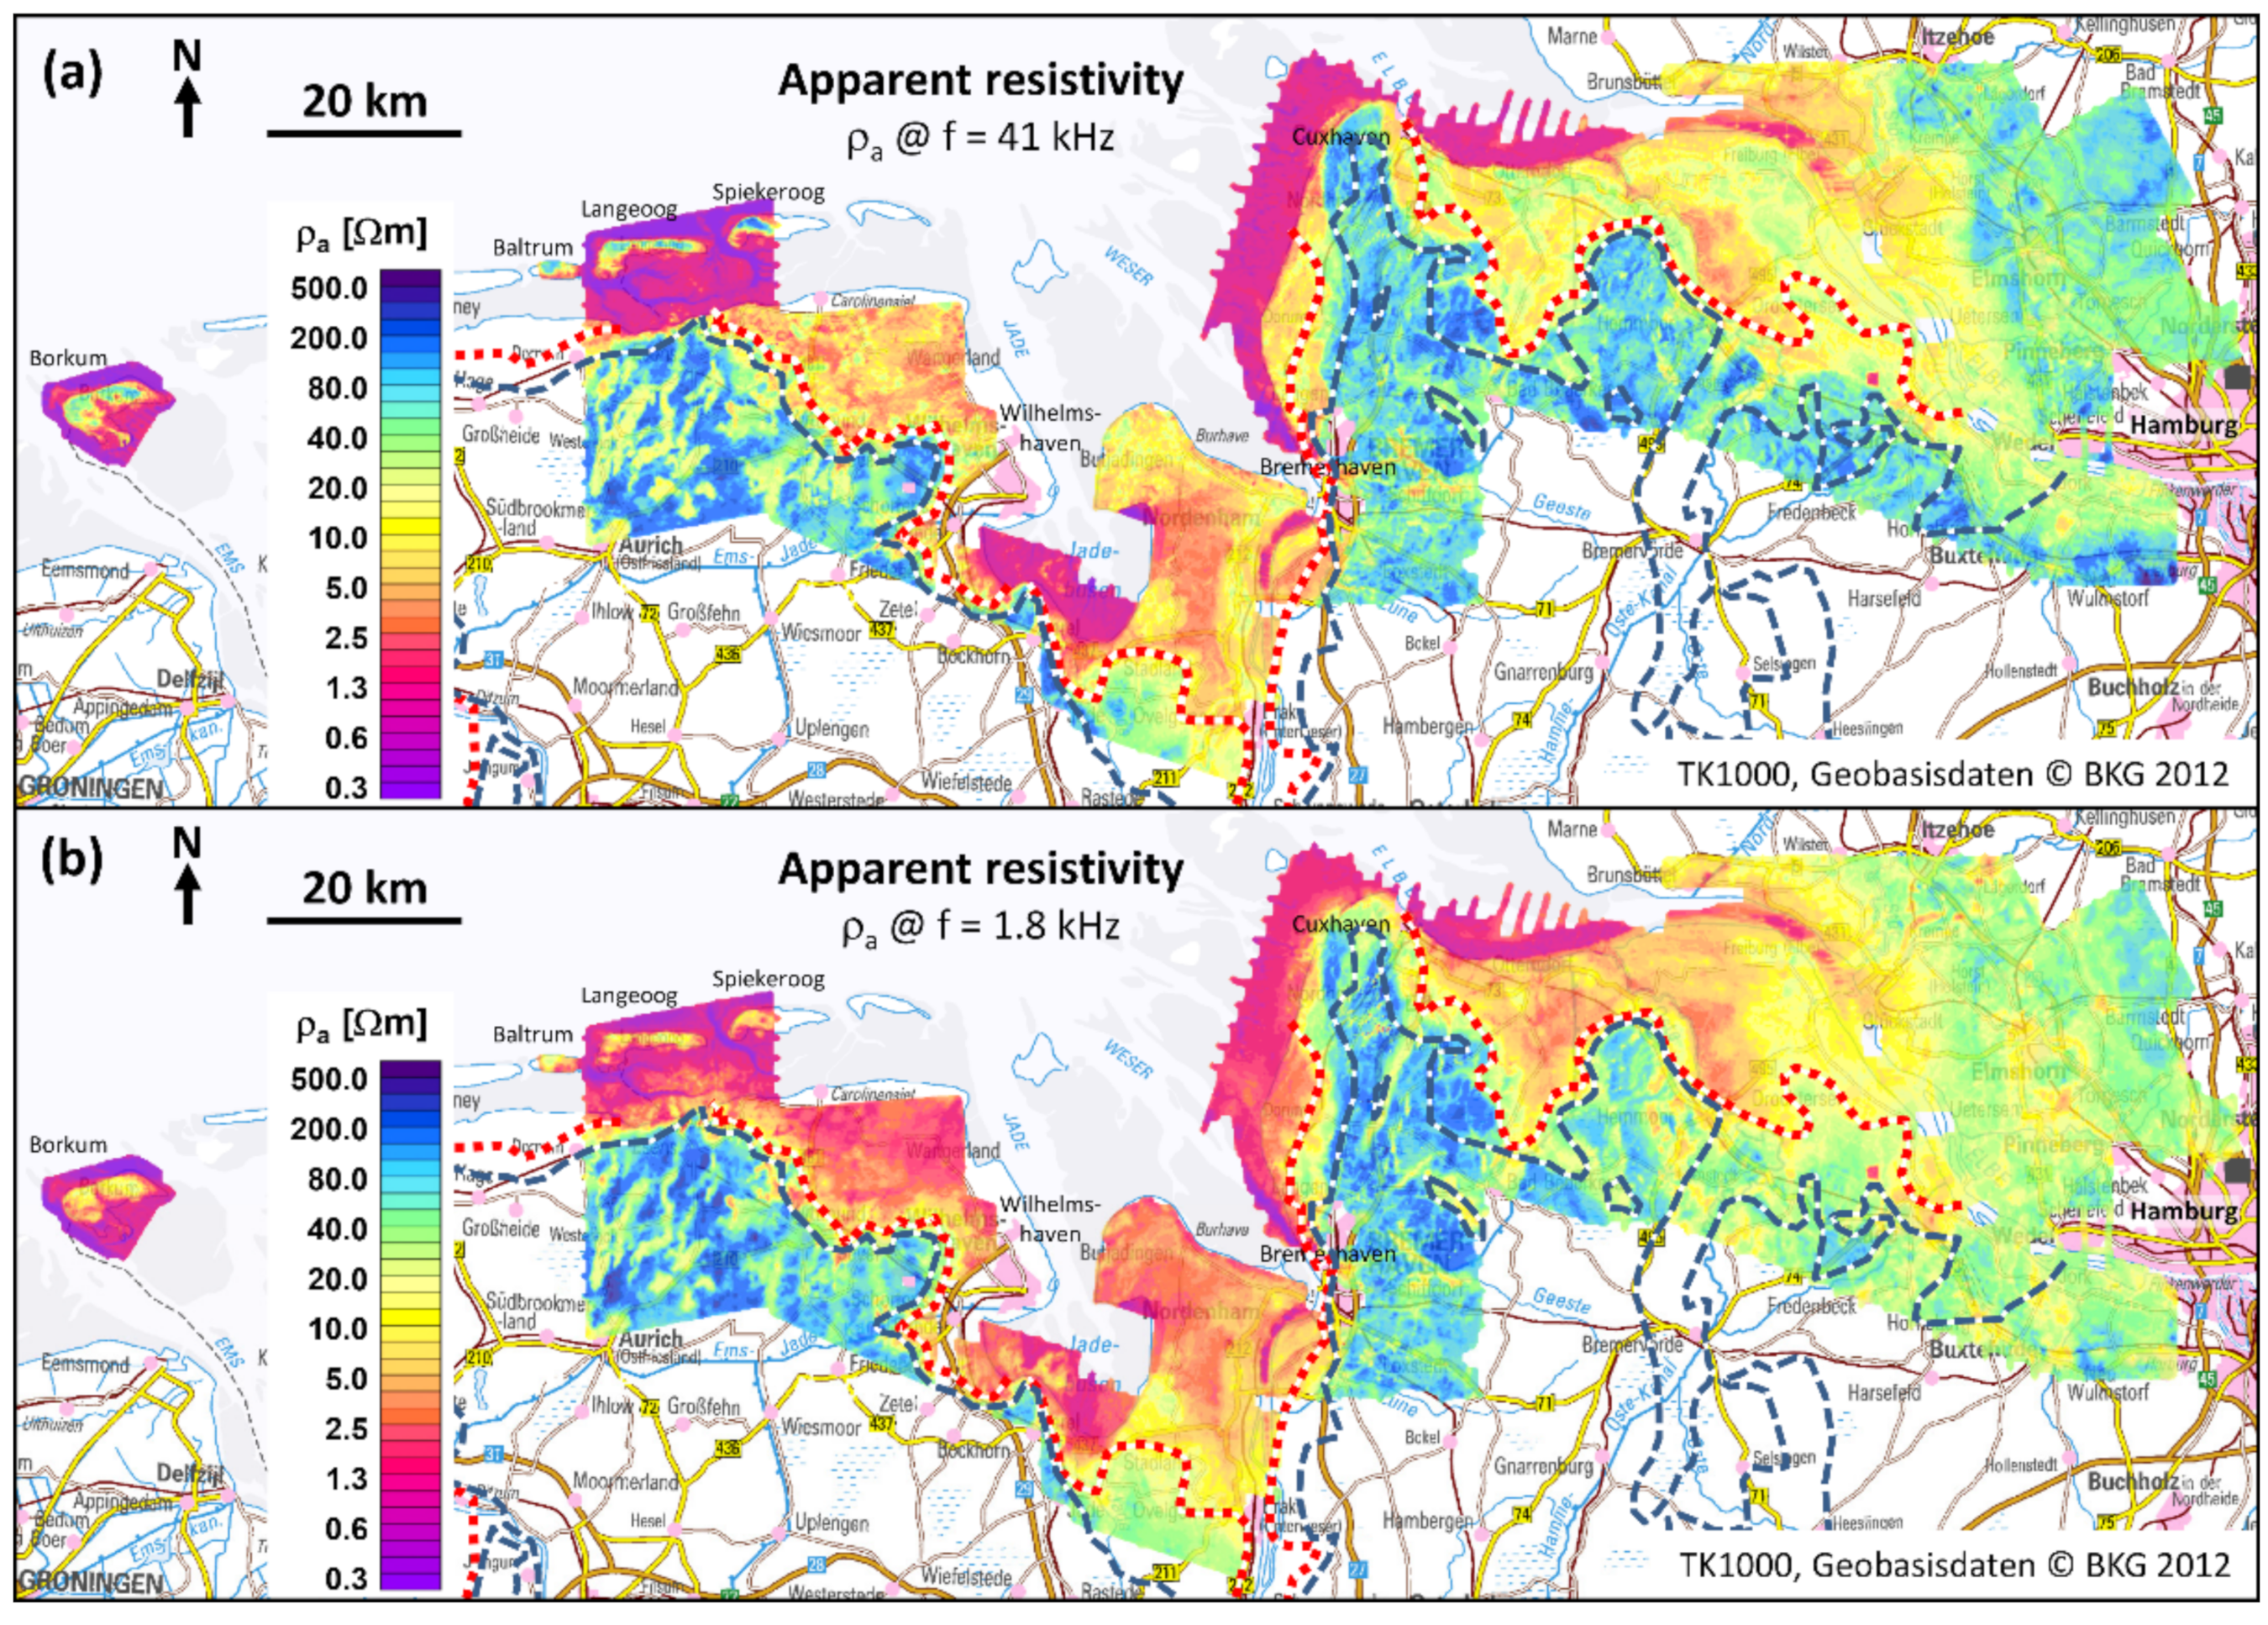
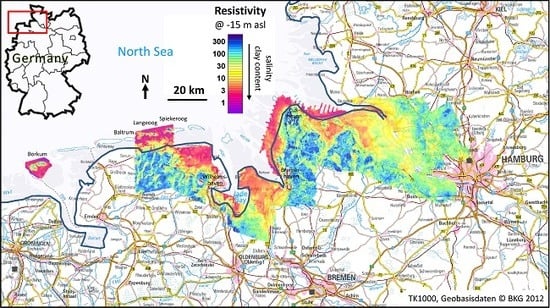
In general, HEM results are displayed as resistivity maps derived from single-frequency evaluation (apparent resistivity at a certain frequency) or 1D inversion (resistivity at a certain depth). Figure 3 shows, for example, two apparent resistivity maps at the second highest (f = 41 kHz) and second lowest (f = 1.8 kHz) frequency revealing conductive and resistive structures at lower and greater depth, respectively.
Red colors indicate conductive subsurface structures (low apparent resistivities) and blue colors highlight the resistive ones (high apparent resistivities). Water salinity and clay content mainly cause the variety of the resistivities and their values increase with decreasing salinity and clay content (e.g., [2,49]). Therefore, saline and fresh groundwater can be distinguished by red (ρa = 0.5–3 Ωm) and green to blue colors (ρa > 30 Ωm), respectively. The highly conductive seawater appears in purple colors (ρa < 0.5 Ωm). Also, freshwater saturated clayey and sandy sediments differ in their resistivities [50] and range from orange to yellow colors (ρa = 3–20 Ωm) indicating clays, to blue colors (ρa > 60 Ωm) indicating sands. The resistivity values between the above-mentioned limits are presumably caused by sediments with medium grain sizes, e.g., silt and till, or by sediments with some clay. On the other hand, sandy sediments saturated with brackish water can also cause resistivities similar to those in the range of pure clays. The interpretation of these lower resistivities, however, is ambiguous and additional information is required for a reliable interpretation.

4.1.2. Results of Magnetics

The anomalies of the magnetic field ΔT are shown in Figure 4. They are dominated by a broad negative anomaly in the center of the area with strong positive values at the eastern edge. Moderately positive values occur at the Jade Bay and at the estuary of the Elbe River as well as at the island of Borkum. The sources of this anomaly pattern are presumably located at greater depth (several kilometers) within the North German Basin and the strong positive anomaly near the city of Hamburg is regarded as a relic of the collision between Baltica and Avalonia the old Scandinavian crust of high magnetization [51].
A number of narrow, high amplitude anomalies (red and blue dots) appear on the ΔT map close to cities and other infrastructures, e.g., harbors, main roads, and railway tracks (Figure 4a). These anomalies are attributed to anthropogenic sources located at or close to the surface. They were removed for further interpretation of the magnetic data (see Section 3.3.3).
After removal of the long-wavelength (>5000 m) regional field and attenuation of very short-wavelength signals (<500 m) using a bandpass (BP) filter, another anomaly pattern becomes visible in the cleaned (anthropogenic effects removed) ΔT grid. Figure 4b shows the positive values of the resulting BP filtered pattern (grey colors) on top of the cleaned ΔT map. Numerous elongated, often north to northwest or east-west trending anomalies appear. The possible sources of these anomalies have been recently discussed [52] and one example will be shown in Section 4.2.4.

4.1.3. Results of Radiometrics

The radiometric pattern, displayed as exposure rate in Figure 5, shows three prevailing features: 1) high radiation (orange colors) in the coastal flatlands, 2) moderate radiation (yellow to green colors) in onshore areas with somewhat higher surface elevation, and 3) low radiation (blue colors) offshore and in some areas onshore. A high radiation is often caused by clay minerals [53], whereas a low radiation occurs where water absorbs the radiation [15]. The histogram of the exposure rate shows that the main features can obviously be separated by two thresholds at about 1.5 and 5.5 µR/h (Figure 5b). The corresponding contours are displayed in Figure 5b on top of the geology map. This comparison demonstrates that the contours help to distinguish the main geologic units: 1) Holocene marshes are indicated by high radiation, 2) Pleistocene sands and tills (Geest) and Holocene mudflats (Wadden sediments) correlate with areas of moderate radiation, and 3) Holocene mires (bogs and fens) and open waters (North Sea and rivers) show only a low radiation. It is worth noting that the radiation measured mainly stems from the upper few decimeters of the subsurface, i.e., the indicated geologic units below a cover, e.g., Pleistocene clay, may not be revealed by the radiometric data.

4.2. Specific Aspects

After the presentation of the general results of the airborne geophysical data, some specific results will be shown.

4.2.1. Freshwater Lenses on Islands

Freshwater lenses generally arise from water being trapped [54]. In particular, the freshwater lenses belonging to islands are charged by rainwater and the seepage of this fresh groundwater is prevented by the subjacent saline water, i.e., the somewhat lighter fresh groundwater floats on top of the saline groundwater and forms a lens-like body. Most of a freshwater lens is located below mean sea level, and the groundwater table is elevated by about 1/40 of the freshwater thickness due to density contrast of fresh and saline water (Ghijben–Herzberg principle, [55,56]). Therefore, the thickness of a freshwater lens depends on the surface elevation and the lateral extent of an island, which terminate the maximum elevation of the groundwater table. Outflows from a freshwater lens (stream, submarine groundwater discharge) occur if the storage capacity is exceeded.
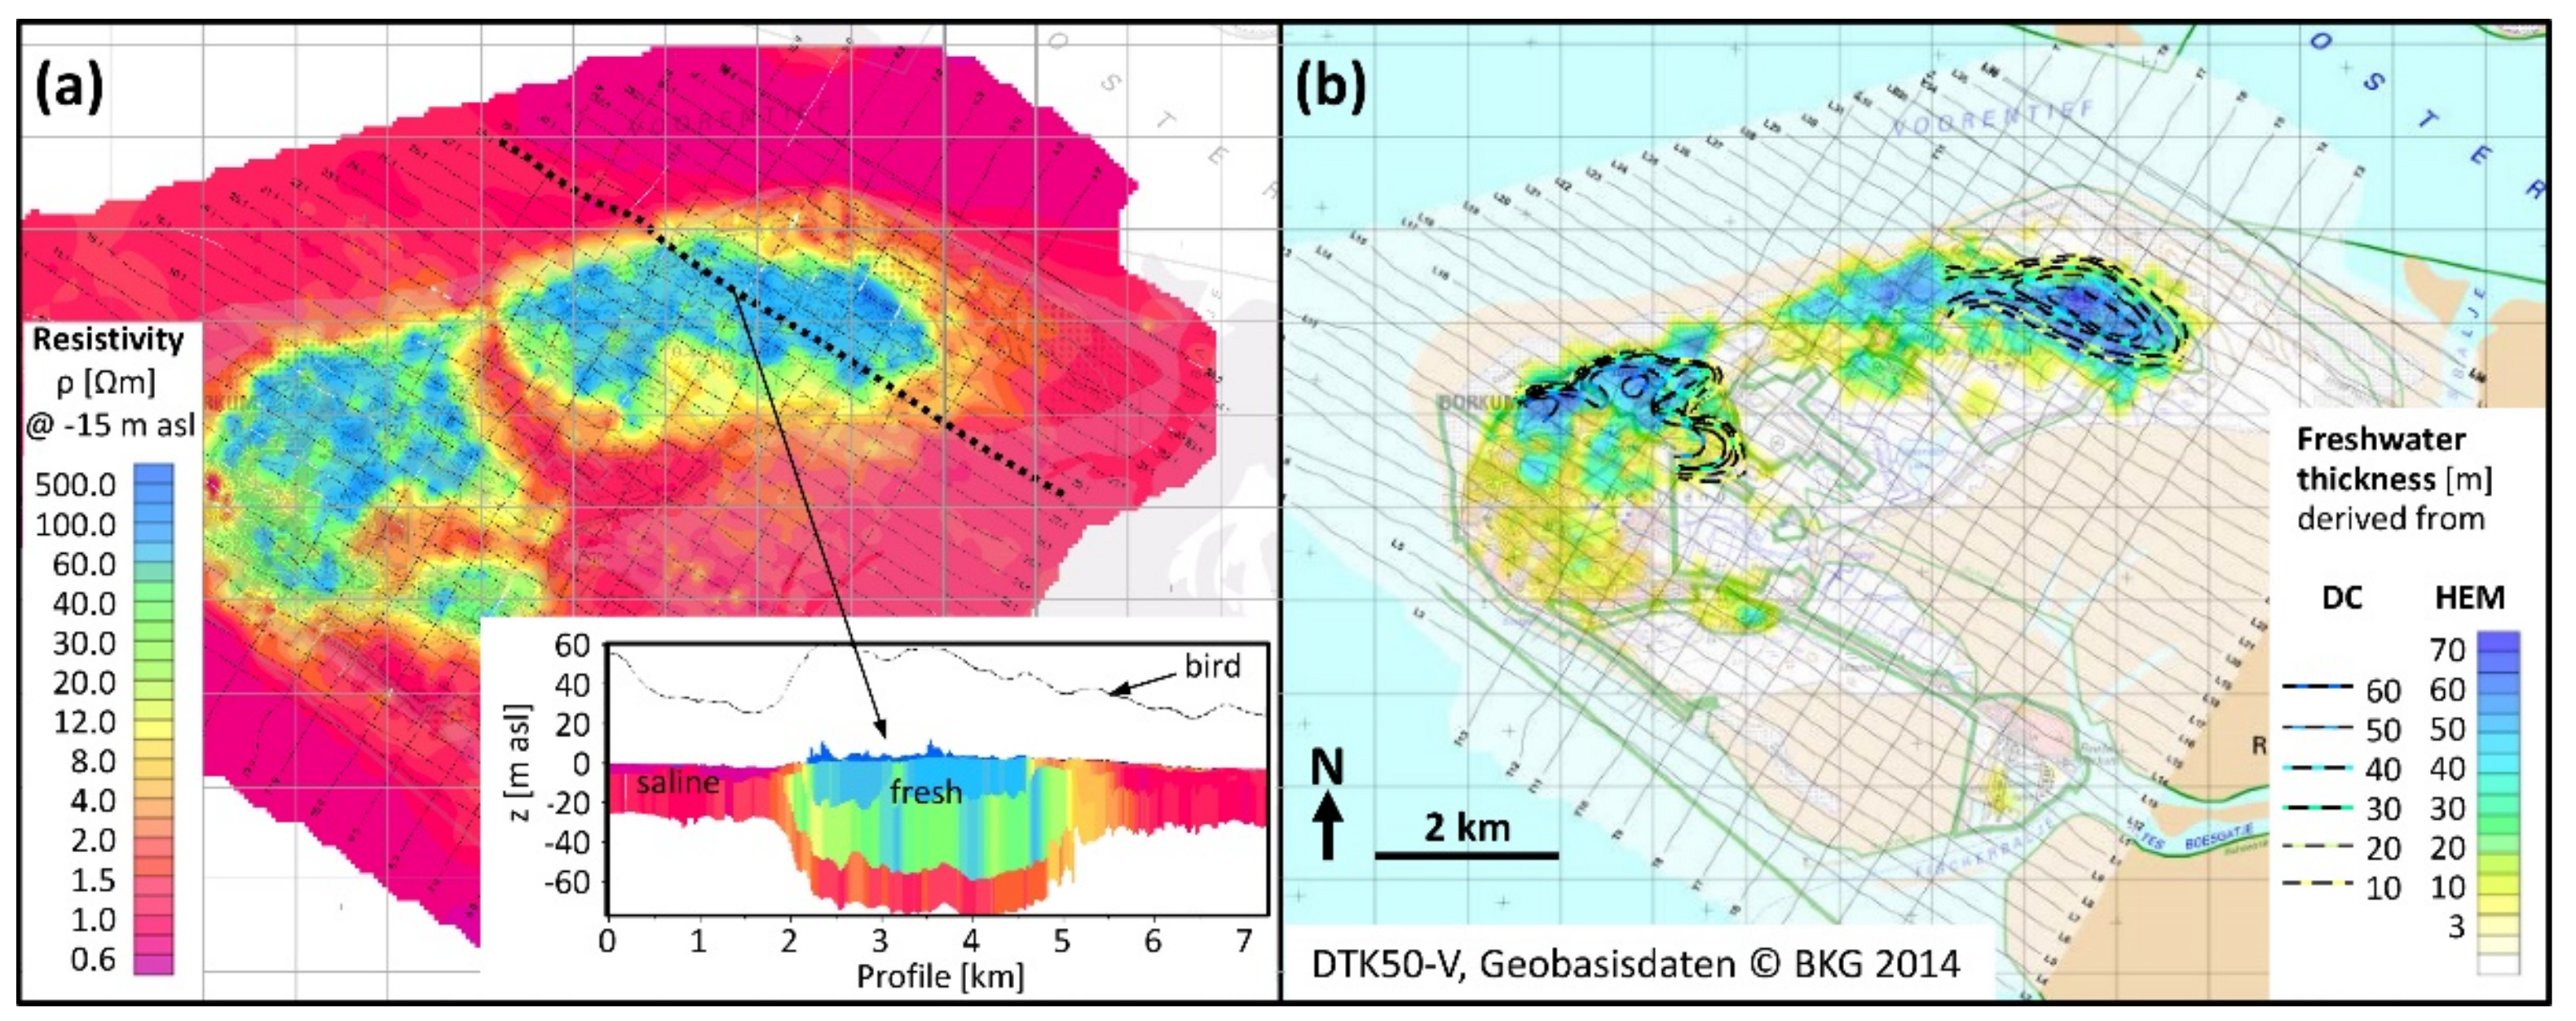
Airborne data exist for the East Frisian Islands of Borkum, Baltrum, Langeoog, and Spiekeroog (western half). For example, Figure 6a shows the extent (map) and depth (cross-section) of the freshwater lenses of the westernmost island of Borkum. The resistivities derived from four-layer inversion of the HEM data successfully reveal the lateral shapes as well as the thicknesses of the freshwater lenses on top of the saline water (Figure 6b). These thicknesses result from an accumulation of all layer thicknesses having resistivities in the range of ρ = 30–500 Ωm. This result, which clearly indicates two separate freshwater lenses, is very similar to old results derived from direct current (DC) geoelectric soundings [10]. In contrast to the ground-based geophysical survey, which focused on the central portion of the freshwater lenses, the airborne results revealed the freshwater resources of the entire island.

4.2.2. Seawater Intrusion

Seawater intrusion occurs in northern Germany, where low-lying marshes exist (see Figure 1). The fresh–saline groundwater interface (FSI) generally increases in depth moving inland. These areas were periodically flooded in historic times due to their low elevation, and seawater remains local and close to the surface, if shallow aquitards exist, preventing downward infiltration. Below these aquitards, freshwater may occur again. Therefore, several fresh–saline groundwater interfaces may exist. As the FSI depth is important information, e.g., for water suppliers, farmers, and drainage organizations, the overview map used in the past [48] was often not sufficient for many problems and an update was necessary.
Figure 6 shows that sediments saturated with saline water appears conductive (red to orange colors). From Figure 3, we therefore attribute the onshore conductive areas to seawater intrusion, which fairly well correlate with the distribution of saline water indicated by green and blue dotted lines for shallow and deep occurrences, respectively. These two contours, however, could not sufficiently describe the vertical gradients of the seawater intrusion.
In order to get a detailed status quo of the fresh–saline groundwater distribution at the coastal region of Lower Saxony (Figure 7), the State Authority for Mining, Energy, and Geology (LBEG) recently generated a model of the lower FSI [58]. Images of vertical resistivity sections derived from HEM 1D inversion models were imported into modeling software (Skua Gocad [59]) to pick the depth of this interface. In Lower Saxony, a chloride threshold of 250 mg/l is used to bound fresh (drinking) water, which corresponds to bulk resistivity of about ρ = 30 Ωm [60]. As the application of resistivity threshold values for this picking was ambiguous, because both brackish groundwater and clayey sediments could cause similar resistivity values, a background geological model was used to distinguish between both. The background model was built using both borehole data and HEM resistivity models [61]. Figure 7 shows the resulting map for the onshore airborne survey areas located in Lower Saxony, i.e., to the west of the Elbe River and without the islands. If the resistivity models provided no clear indication for saline groundwater (often below -100 m asl), the freshwater minimum thickness was estimated together with borehole data (blue colored area with white dots). For comparison, the old contours indicating the extent of shallow and deep saline groundwater were added. These contours often, but not always, bound the strongest vertical gradients of the FSI shown in the new map.

4.2.3. Submarine Groundwater Discharge

HEM resistivity maps outline not only seawater intrusion, but also indicate the opposite effect—submarine groundwater discharge (SGD). The outflows of fresh groundwater occur where sufficiently large hydraulic gradients exist and aquitards preclude an intermixture of fresh and saline water. We found examples for SGD within the Sahlenburg Watt to the west of the city of Cuxhaven [8], within the Jade Bay to the south of the city of Wilhelmshaven [62] and in the Wadden Sea to the south of the island of Langeoog [50]. These SGD locations coincide with areas where no shallow seawater intrusions occur in Figure 7 (no red colors at the coastline), e.g., in Figure 8.
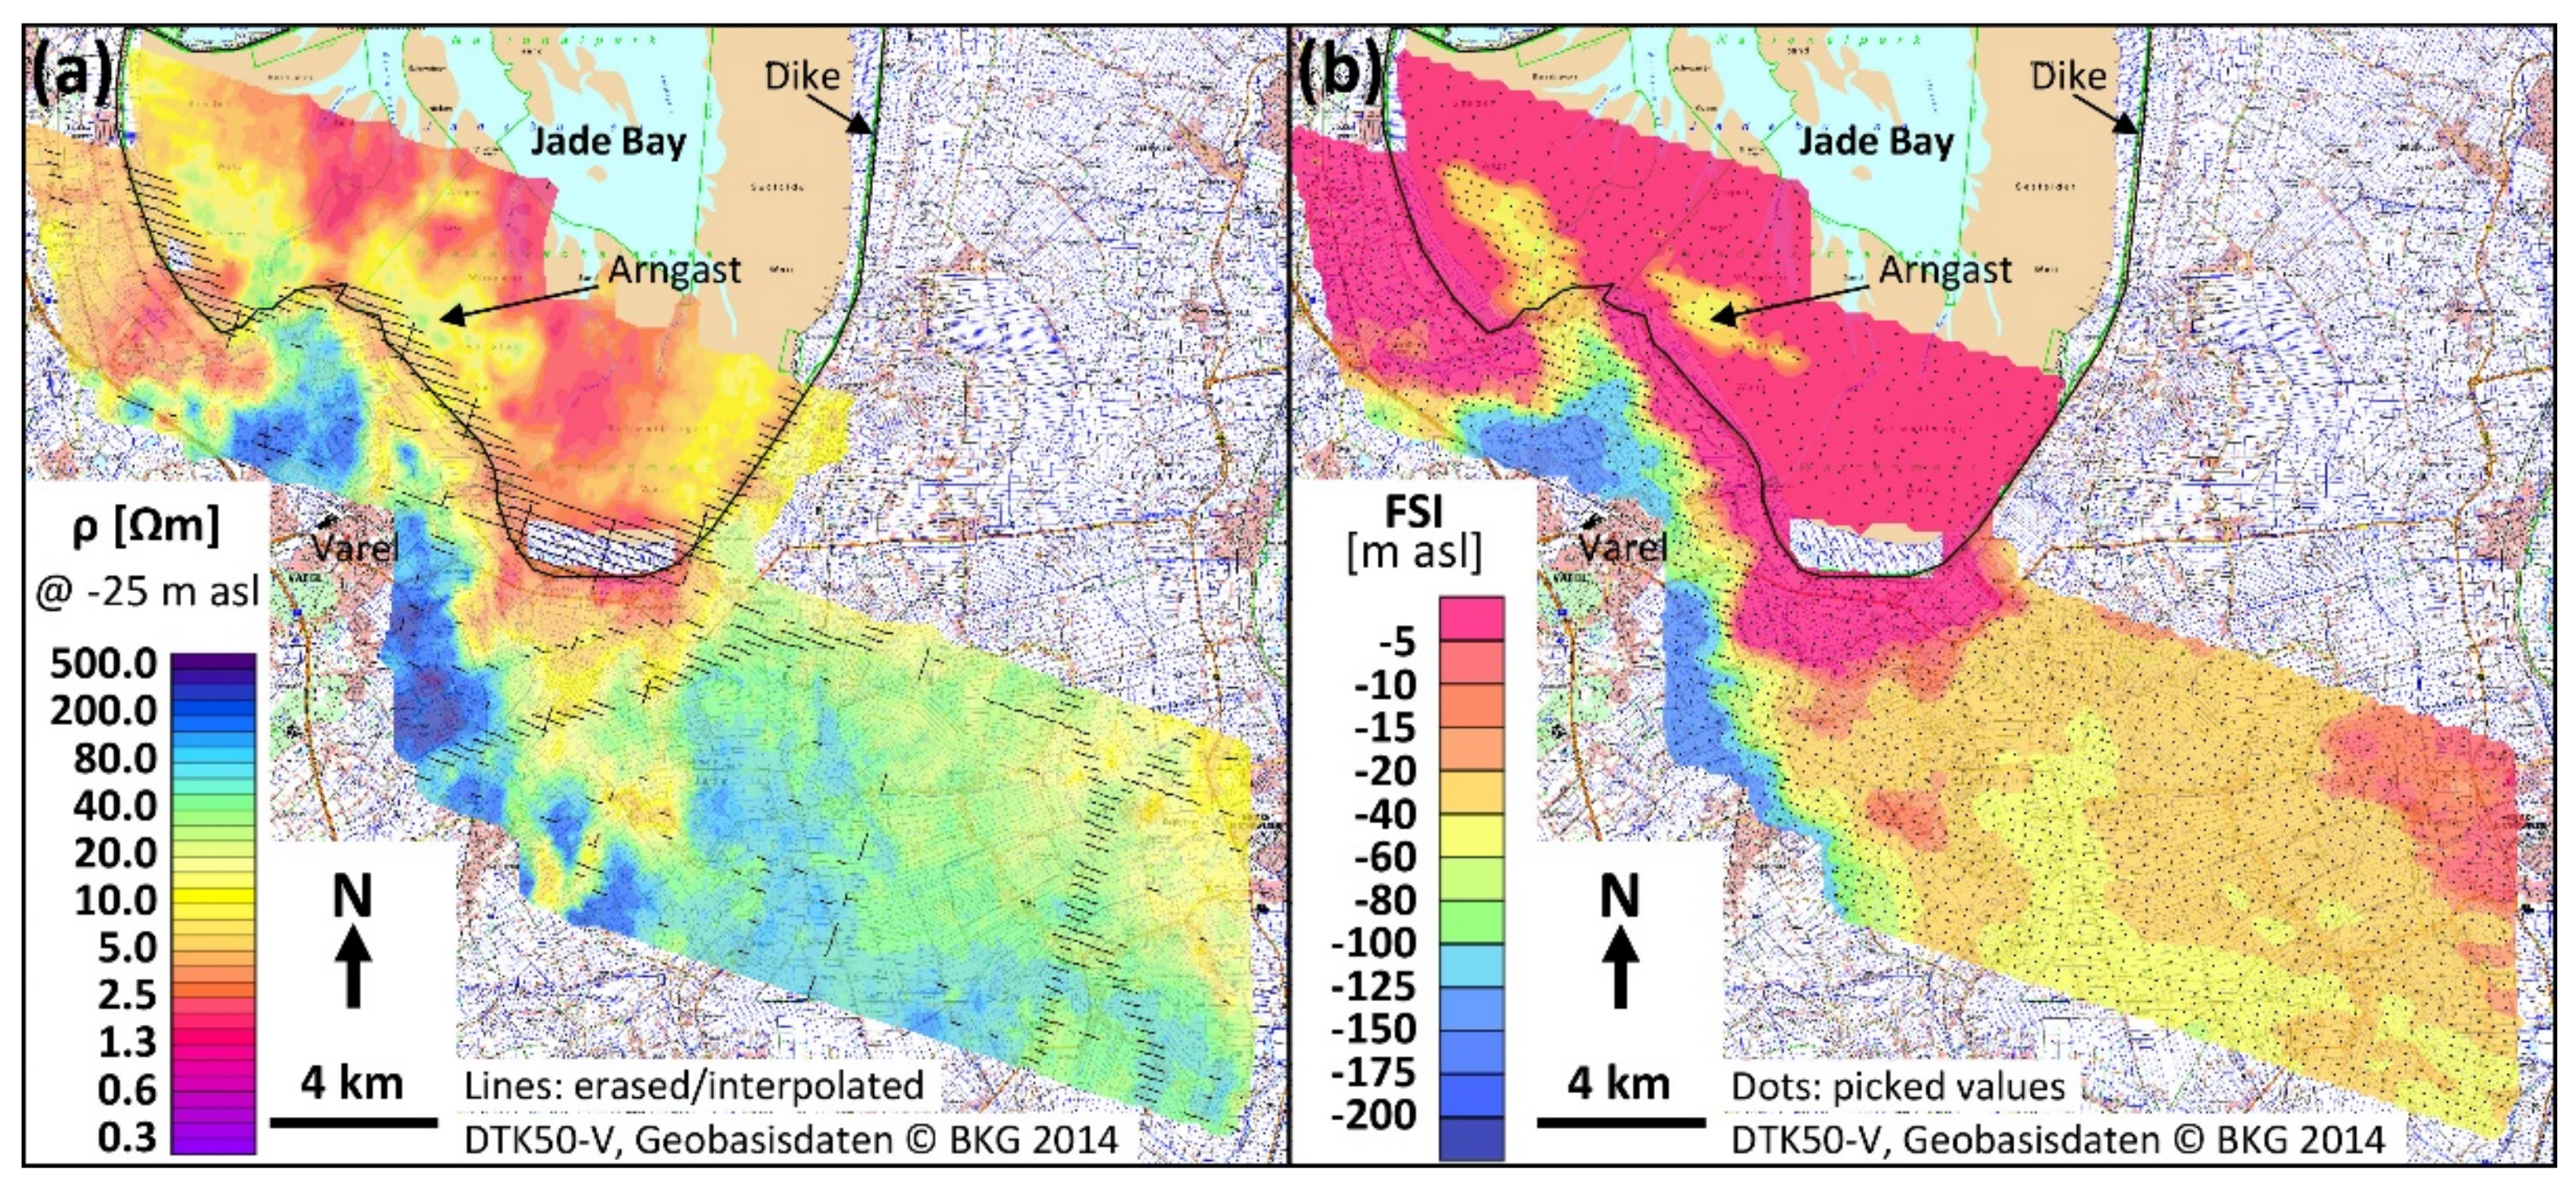
One SGD, represented by a channel-like resistive feature, crosses the coastline of the southwestern Jade Bay (Figure 8). This tidal flat area was investigated during low tides in order to reduce the shielding effect of seawater. Due to regulations of the Wadden Sea National Park (bird breading areas at the coastline), the sensor elevation was increased to 200 m asl crossing the coastline. Figure 8 shows resistivities at z = -25 m asl and elevations of the FSI, both derived from 20-layer inversion results [62]. The Jade Bay area appeared conductive at shallow depth (see Figure 3a), but locally resistive at greater depth (Figure 8a), indicating fresh groundwater below the saline cover in two areas: 1) in extension of the northwestwards trending freshwater zone and 2) to the south of a former island (Arngast). The lower bounds of these features were found below z = -20 m asl (Figure 8b). Borehole results confirmed that a few meters of Holecene silt, fine sand, and peat cover Pleistocene sand in the center of the freshwater channel [63]. Such a shielding cover was not found at the ancient island of Arngast, which finally vanished about a century ago. Therefore, it is not clear why here still freshwater seems to be present in an isolated area.

4.2.4. Buried Valleys

Buried (tunnel) valleys are widespread in northern Germany [64]. These paleo valleys were incised into the subsurface during warming periods of the ice ages by subglacial erosion caused by meltwater. Quaternary sediments refilled and covered these channel structures [65]. HEM is able to detect such channels if the channel fill, often clayey sediments, differs from the host material, often sandy sediments [66].
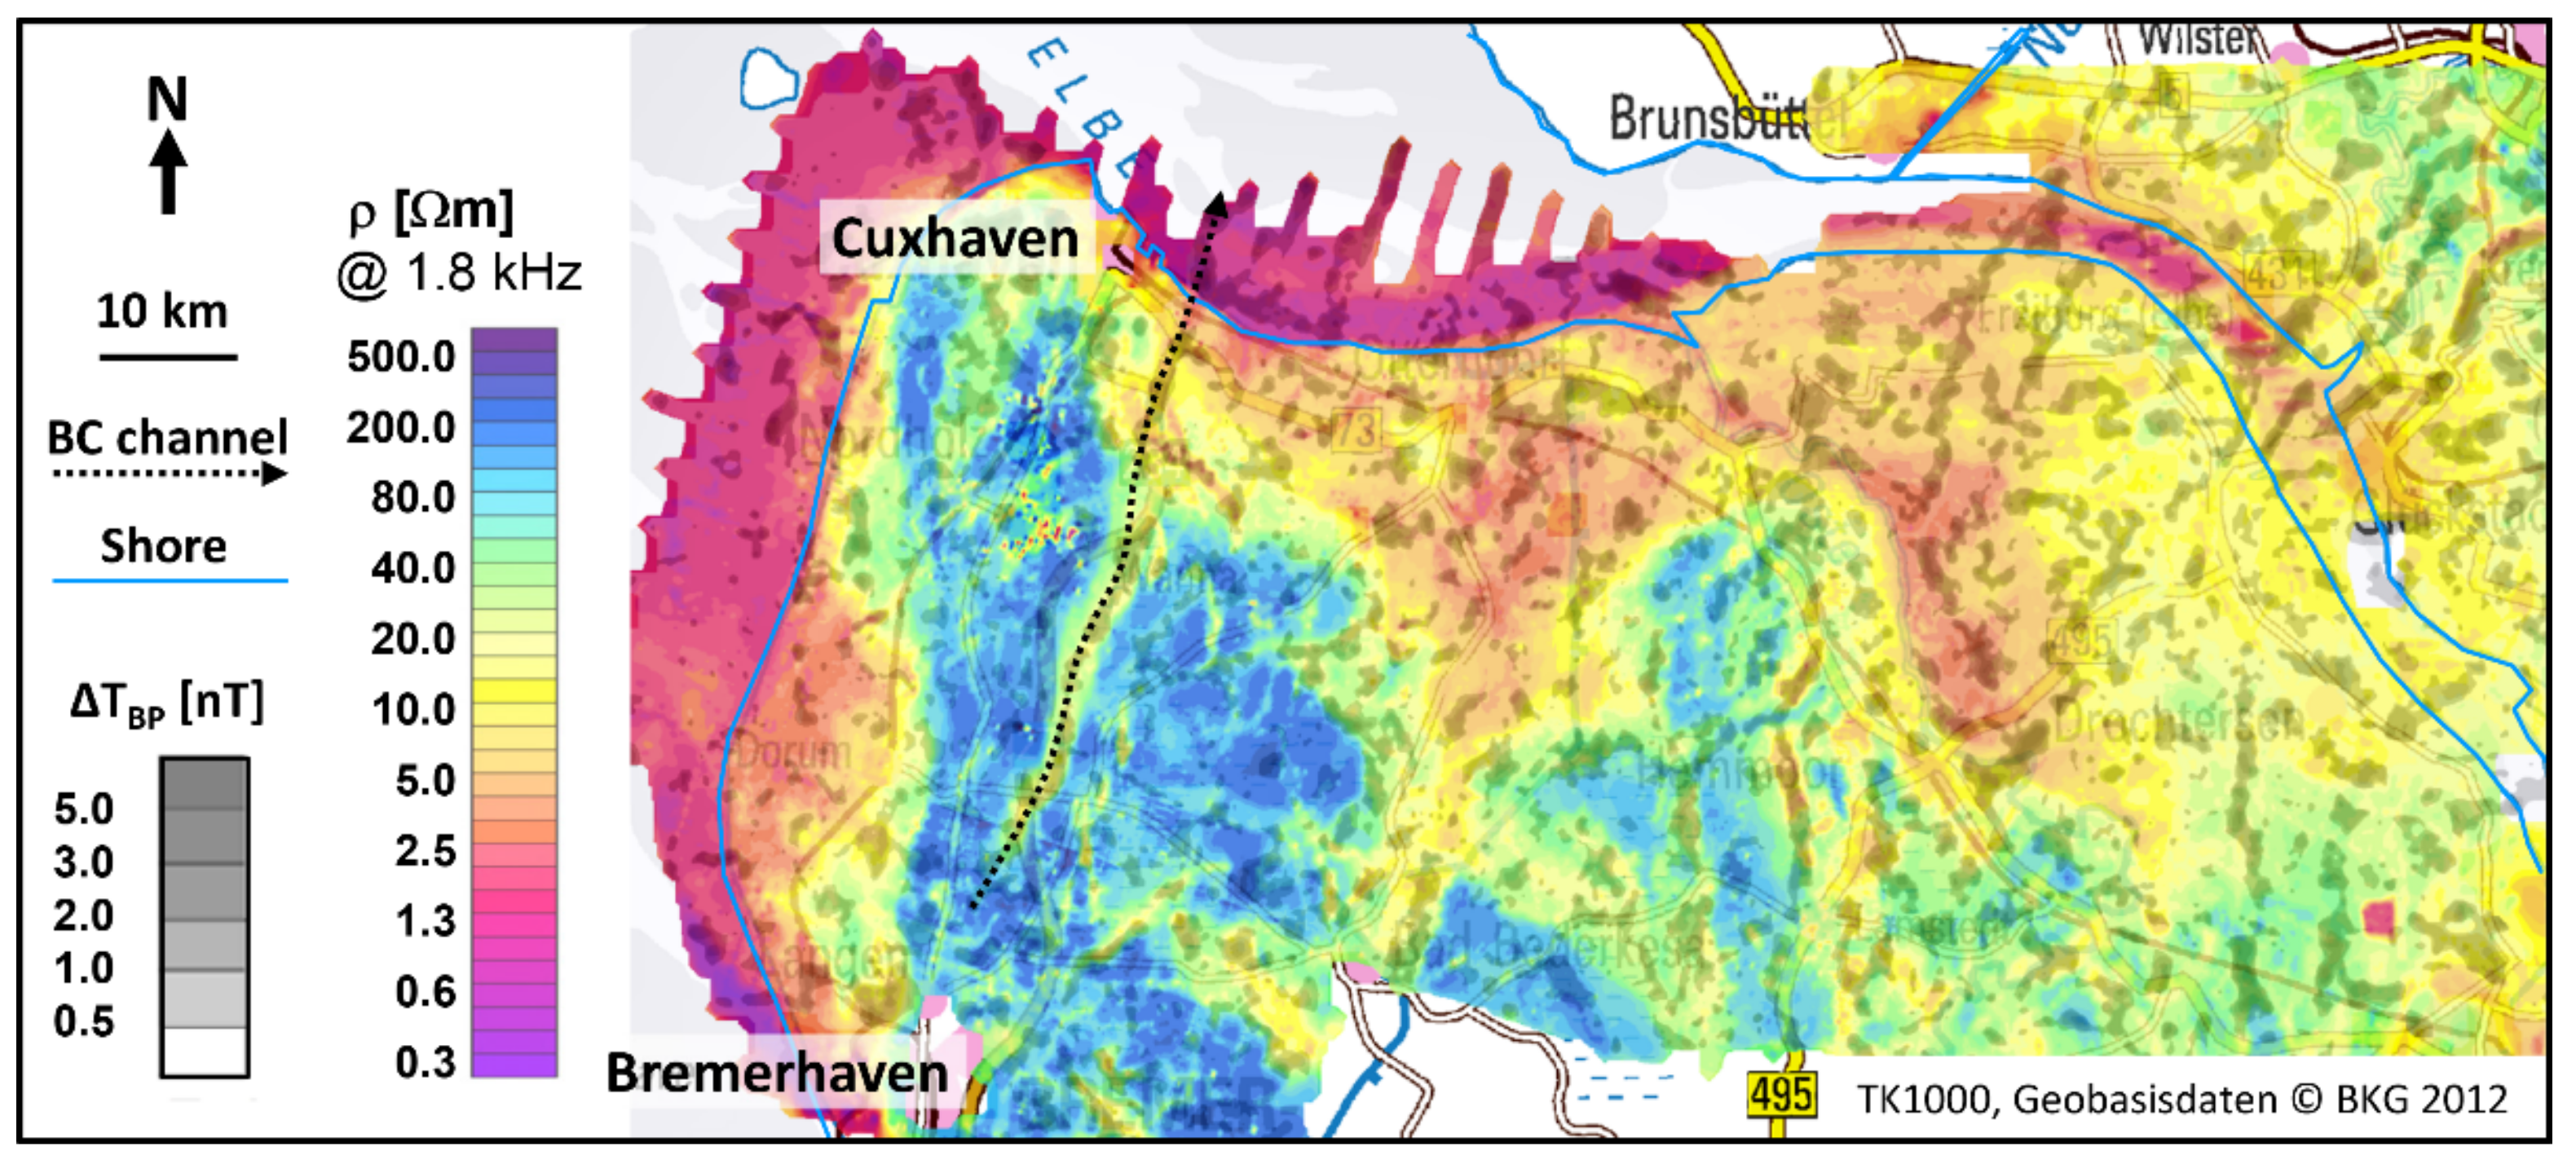
The channel between the cities of Bremerhaven and Cuxhaven (BC channel) is one of best-investigated channels in northern Germany (e.g., [8,67]). The resistivities clearly outline the BC channel due to the high amount of Pleistocene clayey sediments inside and Tertiary sandy sediments outside the channel (Figure 9).
Towards the north and south, however, the clear appearance of the BC channel vanishes on the resistivity map due to an increase of groundwater salinity masking the conductive clay signature and a decrease of clay content, respectively. Here, the magnetic data help to follow the course of the BC channel northwards. Figure 9 shows that the magnetic anomalies (positive bandpass filtered magnetic data (ΔTBP)) correlates with conductive signatures in a wide resistivity range (ρ = 3–60 Ωm) that indicate occurrences of clayey sediments.

4.2.5. Historic Landscapes

Saline groundwater may also be present in coastal regions not affected by current seawater intrusion [1]. Such groundwater salinization may be related to processes in the geological past, when the coastline was located further inland (e.g., [23,68,69]). In addition, high salinities caused by seawater flooding during high tides or storm surges may still persist.
The island of Borkum is one example. This island has two freshwater lenses (Figure 6), because until two centuries ago, Borkum consisted of two islands, Ostland and Westland, separated by a tidal creek. Due to the installation of barriers, both islands merged, but the freshwater lenses are still separated [10]. The marsh areas are further examples (Figure 5b). During a warming period of the Ice Ages, the Eemean Ocean flooded large parts of the lower areas between the rivers Weser and Elbe. Compared to the current coastline, the Eemean coastline of the German Bight was partly shifted to more than 20 km inland [70]. Before land reclamation by enclosure started in the Middle Ages, tidal flats were not protected by dikes and, therefore, seawater flooding by storm surges and sedimentation of marine sediments could take place [71]. These marine sediments correlate with low resistivities (Figure 3) caused by brackish groundwater and fine-grained clayey sediments (Figure 5a).
The ancient Harle Bay to the southeast of the island of Spiekeroog is nowadays an onshore area. In the Middle Ages, however, it was a typical bay area. That is outlined in Figure 10 by a dashed line showing the situation at the end of the 13th century. This dike line was heavily damaged in the 14th century by storm surges and increased seawater flooding penetrated the lowlands creating tidal flats with new shorelines.
The maximum extent of the tidal flats of the Harle Bay area correlates with the boundary between Holocene marshes and the area of Pleistocene sediments (Figure 5b), where the surface elevation is increased (up to a few meters), and higher radiometric exposure rates indicate the marshes there (Figure 5a).
Since the 15th century, successive land reclamations have been taken place [71]. The map in Figure 10 shows the resistivities at -5 m asl in comparison with the ancient shorelines. Low resistivities (ρ < 5 Ωm) indicate areas of remaining seawater intrusion. Higher resistivities (ρ > 30 Ωm) are presumably caused by fresher groundwater. These more or less isolated freshwater occurrences are shallow, because the resistivity decreases at greater depth (see Figure 3). Similar to the freshwater lenses on islands (Figure 6) or comparable areas in the Netherlands [54], they are recharged by rainwater, but no thick lenses could develop due to the lack of storage resulting from low elevation and flat topography. The elevation of fresh–saline groundwater interface is mostly above -5 m asl and it is below -10 m asl at only a few locations (Figure 7).

4.2.6. Peatlands

Peatlands generally contain a high amount of water and organic material, both of which are able to absorb gamma radiation. As this gamma radiation is often very low there, airborne radiometric measurements are suitable to outline peatlands [72]. This is shown in Figure 11, where the outlines of the mires (bogs and fens) fairly well correlate with the threshold of E = 1.5 µR/h for the exposure rate (see Figure 5a). Small mires, however, were often not detected by this single threshold. One reason is that the lateral resolution of airborne radiometric measurements is generally low [73] and radiation from outside may affect the measurements close to the edges of the mires. Therefore, somewhat higher radiation is measured and a different threshold would be necessary.
The discrimination of bogs and fens is also difficult, because the corresponding radiation is very similar. Furthermore, the very low radiation levels are close to that of open waters (lakes, rivers). In order to discriminate these features, additional information is necessary (e.g., digital topographic maps to clip the water areas). Bogs and fens can be often distinguished by their corresponding surface elevation. For example, the definition of an elevation threshold of z = 0.5 m asl, in combination with a slightly reduced radiation threshold of E = 1.0 µR/m [16], helped to outline the bog area of the Ahlen-Falkenberger Moor (AFM, [74]), which is located about 20 km to the south of the Elbe River estuary (red frame in Figure 11).
Besides the lateral extent of a mire, it is also possible to derive the peat thickness from airborne geophysical data, either from electromagnetic models alone [76] or from a combination of electromagnetic and radiometric results [16]. The latter was demonstrated at the AFM by a three-step process. 1) The vertical extent was derived from smooth resistivity models in combination with a steepest gradient approach, which indicated the base of the less resistive peat. 2) The relative peat thicknesses derived from decreasing radiation were scaled using the electromagnetic results as reference to transform the exposure rates (negative log-values) to thicknesses. 3) Both methods were combined by averaging the corresponding thickness values. In order to estimate the elevation of the peat base, the averaged peat thicknesses were finally subtracted from the surface elevation.
Figure 12 shows the estimated bog area and the elevation of the peat base from both airborne and borehole results. The mean difference of airborne results and the results of about 100 boreholes was very small (Δ = 0.1 ± 1.1 m). Although locally some (5%) deviations (>2 m) from the borehole results do occur (double black circles in Figure 12), the airborne approach enables fast peat volume mapping of large areas without the requirement of extensive drilling or core sampling. Furthermore, the HEM inversion models also help to reveal the type of sediments below the peat, i.e., to distinguish between sandy and clayey sediments [16].

5. Discussion

5.1. Accuracy of Airborne Results

The airborne measurements presented in this paper were acquired along flight lines at a nominal line separation of 250 m, i.e., the sampling distance along line (HEM, HMG: 4 m, HRD: 40 m) is smaller than across line. Therefore, the grid cell size (50 m) used for map production is a reasonable compromise of both separations. A smaller cell size does not increase the lateral resolution of airborne geophysical maps, because the footprint, i.e., the area of remarkable influence on a single measurement, is larger (in the order of a few hundred meters depending on the method, system altitude, and subsurface conditions).
The depth of investigation differs for the three methods used and ranges from a few decimeters (HRD) to about a hundred meters (HEM), and even to several kilometers (HMG). While the interpretation of radiometric data is restricted to the near surface, the magnetic data allow distinguishing between shallow (short spatial wavelength) and deep sources (long spatial wavelength). Only the electromagnetic data provide information about a layered subsurface due to the use of several system frequencies corresponding to different penetration depths. The vertical resolution, however, is hard to quantify, because it depends on a variety of influences, such as data quality, system geometry (coil orientation and separation vs. system altitude), complexity of the subsurface, as well as on interpretation procedures (e.g., type of inversion).
Sophisticated processing procedures (filter and leveling techniques) help to reduce data errors, but anthropogenic effects require data erasure or replacement. Both are critical because erasure may delete still meaningful information and replacement may introduce incorrect information. Therefore, we used different strategies for the processing of anthropogenic effects. The HRD data set was not corrected for anthropogenic effects in general, because most of these influences (shielding effect or additional radiation of infrastructure) are often small compared with the geogenic signal and do not notably appear on large-scale maps (Figure 5a). For special cases in areas with low radiation, e.g., the investigation of peatlands (Figure 12), however, a removal and interpolation of the affected data sections was necessary. The procedure applied was similar to that used to clean the HMG data, which were very sensitive to anthropogenic effects (blue and red dots in Figure 4a). Therefore, it had been mandatory to remove such effects automatically before BP filtering could be applied to enhance local geogenic structures on the map displaying the magnetic anomalies (Figure 4b). Unfortunately, this procedure was not able to reduce all the affected HEM data as well, because the anthropogenic influence on the HEM data varies with system frequency, i.e., it is generally weak at high and strong at low frequencies [33]. Therefore, a semi-automatic procedure was applied to optimize the masking of affected data. As this time-consuming procedure was applied only to the newer data sets (acquired after 2006), anthropogenic effects are still visible on the large-scale apparent resistivity maps (e.g., red dots to the south of the city of Cuxhaven in Figure 3b).
System altitude is a very important parameter, because the signals measured often decay exponentially with increased distance of the sensors to the sources. In particular, this causes a reduction of the signal-to-noise ratio, i.e., worse data quality, and small-scale anomalies vanish in a broader background signal causing smeared boundary structures. The nominal altitude of the towed bird of about 30–40 m above ground is therefore a compromise between data quality and safety reasons. The latter were also responsible for the numerous flight-line sections with higher flight altitudes, e.g., flying over trees and power lines or restricted bird breeding zones. The resulting gaps were interpolated (and marked) as long as they did not exceed the given blanking distance; otherwise, the gaps were not closed (e.g., coastal area of the southern Jade Bay, Figure 8a).
Measured data always have errors, even after thorough data processing. Therefore, the derived physical parameters are also biased, particularly if they are the result of an optimization process being prone to over-interpretation, e.g., the inversion of HEM data to resistivity-depth models. Numerous authors have addressed the problem of inversion (e.g., [77]). In principle, it is possible to find extreme models ranging from discrete thin conducting sheets embedded in a resistive host to smoothly varying resistivity-depths functions, which reasonably explain the data of a layered Earth, but both are unrealistic. Comparison studies (e.g., [78]) demonstrated that the majority of models were able to reveal the principle resistivity features, particularly if the true resistivity-depth structure was simple enough and the resistivities above and below a boundary differ sufficiently. A further challenge occurs if the subsurface is strongly inhomogeneous in lateral direction. Then, 1D models may fail to explain the data and 2D/3D modeling or inversion is required. Fortunately, the time and computer source demanding 2D/3D calculations are often not necessary in a sedimentary environment, because the lateral resistivity changes are sufficiently moderate with respect to the HEM footprint. We applied the Levenberg–Marquardt single-site inversion procedure to all our HEM data of this paper using two model set-ups: discrete few-layer models and smooth 19-layer models. Both approaches have advantages and disadvantages. Compared to smooth models, few-layer models better reveal sharp layer boundaries, but they also are more sensitive to data inconsistencies. Therefore, small data variations may cause abrupt model changes, which could be suppressed using constraints. Laterally constrained inversion procedures helping to smooth model variations along line and vertical constraints are necessary to smooth multi-layer inversion models [41]. The resistivity maps at discrete depth levels shown in this paper were derived from few-layer models without using constraints. For some specific interpretation results, e.g., the fresh–saline groundwater interface (Figure 7) or the peat base estimation (Figure 12), we additionally used vertically smoothed resistivity-depth models.

5.2. Estimation of Boundaries from Airborne Data

Airborne data provide smooth images of the subsurface, even if sharp boundaries exist, due to the smoothing effects of the system footprints, which behave like low-pass filters, particularly with increasing distance to the sources (boundaries). On a regional scale, the resulting geophysical parameter maps appear quite sharp (Figure 3, Figure 4 and Figure 5), but the boundaries become indistinct on more detailed maps. In order to derive sharp boundaries, modeling and/or inversion is required. Due to the enormous extra effort, this is only done where appropriate. The final parameter sets shown here were not derived from modeling, except the HEM results, which show the resistivities at a certain frequency (model: homogenous half-space) or depth (model: layered half-space). Instead, we used thresholds to outline the boundary of specific units (Figure 5 and Figure 11). In addition, appropriate color scales help to visually group parameter ranges, which may represent a specific unit.
The use of thresholds and color scales as well as models is, of course, only useful to derive boundaries if a single parameter affects the final product. In practice, however, varieties of source parameters influence the measurements and, thus, the final products. Therefore, we have to accept this uncertainty and that specific geological or hydrogeological units are attributed to overlapping ranges of geophysical values. The reverse case, i.e., the discrimination of diverse source parameters derivable from a single geophysical value, is much more complicated. For example, the electrical resistivity is affected by both the salinity of the pore water and the lithological unit (mainly the clay content). The resistivity ranges introduced in Section 4.1.1 (Figure 3) are based on experience stemming from numerous comparisons with borehole results (e.g., [79,80,81]). As long as the influence of the dominant unit, saline water or clay, is weak, the interpretation with respect to clay content or pore-water salinity is quite straightforward, respectively. On the other hand, if the dominant unit is significant, a sound interpretation requires additional information, typically in situ data, other geophysical data, or certain model assumptions. The structural pattern derived from airborne data may help to reduce ambiguities. An example is shown in Figure 9, where the clay signature of the BC channel derived from HEM vanishes northwards due to the increase of pore-water salinity. There, the signature of the BP filtered HMG data helps to follow the course of the channel towards the North Sea coast. A further example is the estimation of the fresh–saline groundwater interface (Figure 7), where a resistivity threshold (ρ = 30 Ωm) was used to estimate the depth of the FSI. Due to the ambiguity discussed above, a geological model derived from borehole data assisted by HEM vertical resistivity sections helped to outline the clay layers. The use of a geological model helped to reduce, but not to remove, the ambiguity. A further uncertainty has to be regarded, because the FSI (at a chloride value of 250 mg/l) is not a sharp boundary between purely fresh and purely saline groundwater, but a threshold value indicating drinking water. The transition (mixing) zone between fresh and saline groundwater is often several meters thick [54]. The threshold used here is located in the upper transition zone and not in the center of the transition zone. The resistivity models, which are sensitive to strong contrasts, reveal the center of the transition zone, particularly if few-layer models are used. Smooth resistivity-depth models may help to better approximate the true (smooth) transition from fresh to saline groundwater, but the degree of model smoothness depends on the control parameters used for the inversion. Therefore, the uncertainty of the FSI estimation depends on the thickness of the transition zone. Monte Carlo interpretation procedures (e.g., [49,82]) may help to estimate such uncertainties.

5.3. Utilization of Airborne Results

The results of the airborne surveys conducted by BGR at the German North Sea coast are publicly available via BGR’s product center [83]. In addition to the individual survey results, which include downloadable reports, data, maps, and vertical sections (only HEM), results merged for the entire area are attached as Supplementary Materials. The latter are also viewable online via BGR’s geoviewer [84]. Besides the general and specific results presented in this paper, the airborne data, particularly HEM, served as baseline data for a number of scientific projects, funded by the European Union (EU) or the German government, and were further used by universities and stakeholders (e.g., water suppliers).
EU Interreg North Sea Region Programs helped to promote the utilization of airborne results. One project [85] developed methods for the mapping of buried (tunnel) valleys under the aspect of groundwater supply. HEM results were used in several pilot areas, e.g., between the cities of Bremerhaven and Cuxhaven (BC channel) as well as near the metropolitan area of the city of Hamburg (Ellerbek channel). The aim was to deliver knowledge and understanding of the structural and hydrological properties of deeper groundwater resources found in buried valleys. The main target was to differ between permeable and impermeable regions. HEM data were used to model the covering clay layer of the buried valley and, thus, identify the meandering of the valley [86]. In areas where saline or brackish groundwater masked the clear clay appearance on the resistivity maps, weak magnetic signatures could be used to image the BC channel (Figure 9) and many other channels as well as further (elongated) clay occurrences. Large-scale vulnerability maps were compiled for different depth levels using the integrated conductivity derived from HEM models as an indicator for aquifer vulnerability to the north of the city of Hamburg [87] (see Figure 3).
Another EU project [88,89] focused on groundwater dynamics and climate-change effects on coastal groundwater systems, e.g., salinization problems and sustainable groundwater management. In one of the German pilot areas, the North Sea island of Borkum, a numerical density dependent groundwater model was set up [90]. HEM inversion models helped to reveal shape and dimension of the freshwater lenses (Figure 6). Furthermore, HEM results were used to define the initial condition for the constant mass transport boundary at the surface of the aquifer. The present day status of the freshwater lens was simulated starting some hundred years before. In addition, HEM was important for the understanding of the hydrological processes involved in the spatiotemporal evolution of the island’s freshwater lenses, which had to be taken into account for the transient model calibration. At the time of the airborne survey (March 2008), the model matched sufficiently the structures of the freshwater lenses revealed from HEM. This well-calibrated model was then used to simulate future development of the freshwater lenses under climate-change aspects [90].
Further projects [91,92] focused on areas for which the initial conditions for salt concentration were difficult to define, e.g., within the Elbe–Weser triangle [93,94], where the spatial salinity distribution was heterogeneous and not restricted to areas close to the current coastline (Figure 7). One approach linked HEM resistivity models with nearby borehole lithology to derive lithology-resistivity relations for, e.g., clay, silt, and sand. From the sand histogram, a resistivity threshold was used to derive the salt fraction for the area of investigation [95,96]. Another approach derived chloride concentration from the comparison of borehole lithology and HEM resistivity models. This approach used only a fraction of the huge HEM data volume, i.e., close to the boreholes, to calculate the chloride concentration at different depths used for map production [97].
The airborne results at the German North Sea coast were not only used for hydrogeological interpretation, but also for geological modeling and the development advanced modeling techniques [98,99]. One of the challenges is the integration of geophysical models (e.g., [100,101]) into geological models (e.g., [102]), which often require statistical analyses beforehand. Geostatistical techniques (e.g., [80]) and automated analyses may help to better use the full value of multi-parameter airborne geophysical data sets, which are able to provide diverse measurements at the same place and time.

6. Conclusions

Airborne geophysics applies a variety of geophysical measurements, which are often simultaneously conducted. As diverse aircrafts (fixed wing, helicopter, and drones) can be used for carrying geophysical systems, investigation areas range from local-scale (in the order of a square kilometer) to large-scale (in the order of several hundreds of square kilometers). Regional or even nationwide surveys can also be conducted merging individual surveys. This paper has presented an example for a combination of 13 individual helicopter-borne surveys acquired over 15 years.
One of the main advantages of airborne geophysics is spatial mapping, i.e., thematic maps presenting physical parameters at diverse depth levels help to reveal (even covered) subsurface structures. Therefore, airborne geophysical multi-parameter results provide an ideal link between regional surface mapping using remote sensing and local on-surface or in situ measurements.
The helicopter-borne surveys at the German North Sea coast revealed numerous structures, which are important for the understanding of hydrogeological processes of the subsurface. The most prominent one is the interaction of seawater and fresh groundwater. The structural investigation of fresh–saline interfaces, offshore and onshore, help to better understand the dynamics of freshwater lenses of islands, saltwater intrusions, and submarine groundwater discharges both in historical view and forecast. The knowledge on the distribution of sandy and clayey sediments is fundamental to correctly describe and model groundwater aquifers and aquitards, respectively. Airborne electromagnetics is a powerful tool providing information for these groundwater-related tasks. Airborne radiometrics and magnetics acquired simultaneously support these tasks, but they are restricted to specific aspects (e.g., cover-layer lithology, clay in glacial channels). In order to classify the soil cover (including wetlands), radiometrics is mandatory, because that method is able to investigate the upper few decimeters of the subsurface.
This paper has presented several applications of airborne geophysics in the coastal lowlands of northern Germany. The full potential of this airborne data set has not been tapped so far. Although some integrations of airborne results (particularly HEM) into geological or hydrogeological models (e.g., to derive the fresh–saline groundwater interface) have taken place, numerous more applications linking this publicly available airborne geophysical data set with remote sensing results and other spatial data sets would be possible using sophisticated geostatistic interpretation tools.

Supplementary Materials

Data and products are available online: https://produktcenter.bgr.de/.
Merged results:
Maps from helicopter-borne electromagnetic data, BGR 2017; doi: 10.25928/bgr2017hem_sfpb-1064.
Maps from helicopter-borne electromagnetic inversion models, BGR 2017; doi: 10.25928/bgr2017heminv_22v5-bg06.
Maps from helicopter-borne magnetic data, BGR 2017; doi: 10.25928/bgr2017hmg_zd10-c310.
Maps from helicopter-borne radiometric data, BGR 2017; doi: 10.25928/bgr2017hrd_tbtd-d240.

Author Contributions

Conceptualization, B.S.; methodology, B.S. and M.I.-v.S.; software, B.S. and M.I.-v.S.; validation, B.S., M.I.-v.S., A.S., N.D. and H.W.; formal analysis, B.S.; investigation, B.S, M.I.-v.S., A.S., N.D. and H.W.; resources, B.S., M.I.-v.S. and N.D.; data curation, B.S. and M.I.-v.S.;—original draft preparation, B.S.; writing—review and editing, B.S., M.I.-v.S., A.S., N.D. and H.W.; visualization, B.S. and M.I.-v.S.; supervision, B.S. All authors have read and agreed to the published version of the manuscript.

Funding

This research received no external funding.

Acknowledgments

The authors would like to thank all the people who were involved in management, data acquisition and processing as well as both anonymous reviewers for their helpful comments, the Editor and the Remote Sensing editorial team for helping to improve this manuscript and for enabling fast publication.

Conflicts of Interest

The authors declare no conflict of interest.

References

  1. Post, V.E.A.; Eichholz, M.; Brentführer, R. Groundwater Management in Coastal Zones; Bundesanstalt für Geowissenschaften und Rohstoffe (BGR): Hannover, Germany, 2018; pp. 1–107. Available online: https://www.bgr.bund.de/EN/Themen/Wasser/Produkte/Downloads/groundwater_management_in_coastal_zones.pdf?__blob=publicationFile&v=3 (accessed on 19 February 2020).
  2. Kirsch, R. (Ed.) Groundwater Geophysics—A Tool for Hydrogeology, 2nd ed.; Springer: Berlin/Heidelberg, Germany, 2009; pp. 1–548. [Google Scholar] [CrossRef]
  3. Rubin, Y.; Hubbard, S.S. (Eds.) Hydrogeophysics, 1st ed.; Springer: Dordrecht, The Netherlands, 2005; pp. 1–527. [Google Scholar] [CrossRef]
  4. Baranwal, V.C.; Rønning, J.S. Airborne Geophysical Surveys and Their Integrated Interpretation. In Advances in Modeling and Interpretation in Near Surface Geophysics; Biswas, A., Sharma, S., Eds.; Springer Geophysics: Cham, Switzerland, 2020; pp. 377–400. [Google Scholar] [CrossRef]
  5. Airo, M.-L.; Hyvönen, E.; Lerssi, J.; Leväniemi, H.; Ruotsalainen, A. Tips and Tools for the Application of GTK’s Airborne Geophysical Data—Report of Investigation 215; Geological Survey of Finland: Espoo, Finland, 2014; pp. 1–35. Available online: http://tupa.gtk.fi/julkaisu/tutkimusraportti/tr_215.pdf (accessed on 4 October 2019).
  6. Young, M. (Ed.) Unearthed: Impacts of the Tellus Surveys of the North of Ireland; Royal Irish Academy: Dublin, Ireland, 2016; pp. 1–441. Available online: https://www.jstor.org/stable/j.ctt1g69w6r (accessed on 19 March 2020).
  7. Siemon, B.; Eberle, D.G.; Binot, F. Helicopter-borne electromagnetic investigation of coastal aquifers in North-West Germany. Z. Geol. Wiss. 2004, 32, 385–395. [Google Scholar]
  8. D-AERO: Airborne Geophysical Surveys for Mapping the Shallow Subsurface in Germany. Available online: https://www.bgr.bund.de/EN/Themen/GG_Geophysik/Aerogeophysik/Projekte/laufend/D-AERO/deutschlandweite_aerogeophysik_befliegung_D-AERO_en.html?nn=1555610 (accessed on 16 April 2020).
  9. Siemon, B.; Wiederhold, W.; Steuer, A.; Miensopust, M.P.; Voß, W.; Ibs-von Seht, M.; Meyer, U. Helicopter-borne Electromagnetic Surveys in Northern Germany. In Proceedings of the 23rd Salt Water Intrusion Meeting—SWIM 2014, Husum, Germany, 15–22 June 2014; Wiederhold, H., Michaelsen, J., Hinsby, K., Nommensen, B., Eds.; Leibniz Institute for Applied Geophysics: Hannover, Germany, 2014; pp. 375–378. Available online: https://www.academia.edu/25644189/Programme_and_Proceedings_SWIM_2014_23_rd_Salt_Water_Intrusion_Meeting (accessed on 4 October 2019).
  10. Siemon, B.; Christiansen, A.V.; Auken, E. A review of helicopter-borne electromagnetic methods for groundwater exploration. Near Surf. Geoph. 2009, 7, 629–646. [Google Scholar] [CrossRef] [Green Version]
  11. Jordan, H.; Siemon, B. Die Tektonik des nordwestlichen Harzrandes—Ergebnisse der Hubschrauber-Elektromagnetik. Z. Dtsch. Geol. Ges. 2002, 15, 31–50. [Google Scholar]
  12. Eberle, D. Geophysical mapping in Archean greenstone belts of Tanzania as an aid for gold prospecting. First Break 1995, 13, 357–367. [Google Scholar] [CrossRef]
  13. Maus, S.; Sengpiel, K.-P.; Röttger, B.; Siemon, B.; Tordiff, W. Mapping paleochannels of the Omaruru River by space domain spectral analysis of aeromagnetic data. Geophysics 1999, 64, 785–794. [Google Scholar] [CrossRef] [Green Version]
  14. Siemon, B.; Stuntebeck, C.; Sengpiel, K.-P.; Röttger, B.; Rehli, H.-J.; Eberle, D.G. Investigation of hazardous waste sites and their environment using the BGR helicopter-borne geophysical system. J. Environ. Eng. Geophys. 2002, 7, 169–181. [Google Scholar] [CrossRef]
  15. Beamish, D. Gamma ray attenuation in the soils of Northern Ireland, with special reference to peat. J. Environ. Radioact. 2013, 115, 13–27. [Google Scholar] [CrossRef] [Green Version]
  16. Siemon, B.; Ibs-von Seht, M.; Frank, S. Airborne electromagnetic and radiometric peat thickness mapping of a bog in Northwest Germany (Ahlen-Falkenberger Moor). Remote Sens. 2020, 12, 203. [Google Scholar] [CrossRef] [Green Version]
  17. Siemon, B.; Steuer, A.; Ibs-von Seht, M.; Voß, W.; Meyer, U.; Wiederhold, H. Combination of airborne geophysical surveys at the estuaries of the Weser and Elbe rivers in Northern Germany. In Proceedings of the 1st EAGE/GRSG Remote Sensing Workshop, Paris, France, 3–5 September 2012; European Association of Geoscientists & Engineers (EAGE): Houten, The Netherlands, 2012. [Google Scholar] [CrossRef] [Green Version]
  18. Heunisch, C.; Caspers, G.; Elbracht, J.; Langer, A.; Röhling, H.-G.; Schwarz, C.; Streif, H. Erdgeschichte von Niedersachsen—Geologie und Landschaftsentwicklung, GeoBerichte 6; Landesamt für Bergbau, Energie und Geologie: Hannover, Germany, 2017; pp. 1–85. Available online: https://www.lbeg.niedersachsen.de/karten_daten_publikationen/publikationen/geoberichte/geoberichte_6/geoberichte-6-819.html (accessed on 17 March 2020).
  19. Streif, H. Nordsee und Küstenlandschaft—Beispiel einer dynamischen Landschaftsentwicklung. In Natur und Landschaft zwischen Küste und Harz; Balck, F., Ed.; Niedersächsische Akademie der Geowissenschaften: Clausthal-Zellerfeld, Germany, 2002; Volume 20, pp. 134–149. [Google Scholar]
  20. Ehlers, J. Das Eiszeitalter; Springer: Berlin/Heidelberg, Germany, 2011; pp. 1–367. [Google Scholar] [CrossRef]
  21. Caspers, G.; Jordan, H.; Merkt, J.; Meyer, K.-D.; Müller, H.; Streif, H. Niedersachsen. In Das Quartär Deutschlands; Benda, L., Ed.; Geb. Borntraeger: Berlin/Stuttgart, Germany, 1995; pp. 23–50. [Google Scholar]
  22. Litt, T.; Behre, K.-E.; Meyer, K.-D.; Stephan, H.-J.; Wansa, S. Stratigraphische Begriffe für das Quartär des norddeutschen Vereisungsgebietes. E&G Quat. Sci. J. 2007, 56, 7–65. [Google Scholar]
  23. Streif, H.-J. Das ostfriesische Küstengebiet: Nordsee, Inseln, Watten und Marschen, Sammlung geologischer Führer 57, 2nd ed.; Gebr. Borntraeger: Berlin/Stuttgart, Germany, 1990; pp. 1–376. [Google Scholar]
  24. Shackleton, N.J. Oxygen isotopes, ice volume and sea level. Quat. Sci. Rev. 1987, 6, 183–190. [Google Scholar] [CrossRef]
  25. Streif, H. Die Geologische Küstenkarte von Niedersachsen 1:25,000—Eine neue Planungsgrundlage für die Küstenregion. Z. Angew. Geol. 1998, 44, 183–194. [Google Scholar]
  26. Streif, H. Sedimentary record of Pleistocene and Holocene marine inundations along the North Sea coast of Lower Saxony, Germany. Quat. Intern. 2004, 112, 3–28. [Google Scholar] [CrossRef]
  27. Werner, A.D.; Simmons, C.T. Impact of sea-level rise on sea water intrusion in coastal aquifers. Groundwater 2009, 47, 197–204. [Google Scholar] [CrossRef]
  28. LBEG. Borehole Database of Lower Saxony (BDN); Landesamt für Bergbau, Energie und Geologie (LBEG): Hannover, Germany, 2019; Available online: http://nibis.lbeg.de/cardomap3/ (accessed on 4 February 2019).
  29. BKG. Digitales Geländemodel (DGM25); Bundesamt für Kartographie und Geodäsie: Frankfurt, Germany, 2012; Available online: https://www.geodatenzentrum.de (accessed on 1 February 2012).
  30. BKG. Rasterdaten Topographische Karte 1:100000 (DTK1000); Bundesamt für Kartographie und Geodäsie (BKG): Frankfurt, Germany, 2012; Available online: https://www.geodatenzentrum.de (accessed on 3 July 2012).
  31. BGR. Geologische Karte der Bundesrepublik Deutschland 1:1000000 (GK1000); Bundesanstalt für Geowissenschaften und Rohstoffe (BGR): Hannover, Germany, 1993; Available online: https://download.bgr.de/bgr/Geologie/GK1000/jpg/GK1000.zip (accessed on 17 March 2020).
  32. Siemon, B.; Kerner, T.; Krause, Y.; Noell, U. Airborne and ground geophysical investigation of the environment of abandoned salt mines along the Staßfurt-Egeln anticline, Germany. First Break 2012, 30, 43–53. [Google Scholar] [CrossRef]
  33. Siemon, B.; Steuer, A.; Ullmann, A.; Vasterling, M.; Voß, W. Application of frequency-domain helicopter-borne electromagnetics for groundwater exploration in urban areas. Phys. Chem. Earth 2011, 36, 1373–1385. [Google Scholar] [CrossRef]
  34. Oasis montaj™ Mapping and Processing System Version 9.5, Geosoft Inc. Available online: https://www.geosoft.com/products/oasis-montaj (accessed on 4 October 2019).
  35. Briggs, I.C. Machine contouring using minimum curvature. Geophysics 1974, 39, 39–48. [Google Scholar] [CrossRef]
  36. Swain, C.J. A FORTRAN IV program for interpolating irregularly spaced data using the difference equations for minimum curvature. Comput. Geosci. 1976, 1, 231–240. [Google Scholar] [CrossRef]
  37. Siemon, B. Levelling of frequency-domain helicopter-borne electromagnetic data. J. Appl. Geophys. 2009, 67, 206–218. [Google Scholar] [CrossRef]
  38. Siemon, B. Improved and new resistivity-depth profiles for helicopter electromagnetic data. J. Appl. Geophys. 2001, 46, 65–76. [Google Scholar] [CrossRef]
  39. Sengpiel, K.-P. Approximate inversion of airborne EM data from a multi-layered ground. Geophys. Prospect. 1988, 36, 446–459. [Google Scholar] [CrossRef]
  40. Sengpiel, K.-P.; Siemon, B. Advanced inversion methods for airborne electromagnetic exploration. Geophysics 2000, 65, 1983–1992. [Google Scholar] [CrossRef]
  41. Siemon, B.; Auken, E.; Christiansen, A.V. Laterally constrained inversion of frequency-domain helicopter-borne electromagnetic data. J. Appl. Geophys. 2009, 67, 259–268. [Google Scholar] [CrossRef]
  42. Siemon, B.; van Baaren, E.; Dabekaussen, W.; Delsman, J.; Dubelaar, W.; Karaoulis, M.; Steuer, A. Automatic identification of fresh-saline groundwater interfaces from airborne electromagnetic data in Zeeland, the Netherlands. Near Surf. Geophys. 2019, 17, 3–25. [Google Scholar] [CrossRef] [Green Version]
  43. Langel, R.A. International Geomagnetic Reference Field, 1991 Revision: International Association of Geomagnetism and Aeronomy Division V, Working Group 8: Analysis of the main field and secular variation. Geophys. J. Int. 1992, 108, 945–946. [Google Scholar] [CrossRef]
  44. Soille, P. Morphological Image Analysis, 2nd ed.; Springer: Berlin/Heidelberg, Germany, 2004; pp. 1–85. [Google Scholar] [CrossRef]
  45. BKG. Digitales Basis-Landschaftsmodell (AAA-Modellierung)—Basis-DLM (AAA); Bundesamt für Kartographie und Geodäsie: Frankfurt, Germany, 2019. [Google Scholar]
  46. Baranov, V. A new method for interpretation of aeromagnetic maps: Pseudo-gravimetric anomalies. Geophysics 1957, 22, 359–383. [Google Scholar] [CrossRef]
  47. IAEA. Guidelines for Radioelement Mapping Using Gamma Ray Spectrometry—IAEA-TECDOC-1363; International Atomic Energy Agency (IAEA): Vienna, Austria, 2003; pp. 1–173. Available online: https://www-pub.iaea.org/mtcd/publications/pdf/te_1363_web.pdf (accessed on 4 October 2019).
  48. LBEG. Generalised Hydrogeological Map of Lower Saxony, 1:200000—Groundwater Salinisation; Landesamt für Bergbau, Energie und Geologie (LBEG): Hannover, Germany, 1987; Available online: https://nibis.lbeg.de/cardomap3/?lang=en (accessed on 4 January 2020).
  49. Delsman, J.R.; van Baaren, E.S.; Siemon, B.; Dabekaussen, W.; Karaoulis, M.; Pauw, P.; Vermass, T.; Bootsma, H.; de Louw, P.G.B.; Gunnink, J.L.; et al. Large-scale, probabilistic salinity mapping using airborne electromagnetics for groundwater management in Zeeland, the Netherlands. Environ. Res. Lett. 2018, 13, 1–12. [Google Scholar] [CrossRef]
  50. Siemon, B.; Costabel, S.; Voß, W.; Meyer, U.; Deus, N.; Elbracht, J.; Günther, T.; Wiederhold, H. Airborne and ground geophysical mapping of coastal clays in Eastern Friesland, Germany. Geophysics 2015, 80, WB21–WB34. [Google Scholar] [CrossRef]
  51. Gabriel, G.; Vogel, D.; Scheibe, R.; Lindner, H.; Pucher, R.; Wonik, T.; Krawczyk, C.M. Anomalies of the Earth’s total magnetic field in Germany—The first complete homogenous data set reveals new opportunities for multiscale geoscientific studies. Geophys. J. Int. 2011, 184, 1113–1118. [Google Scholar] [CrossRef]
  52. Hartmann, T. Interpretation Oberflächennaher Geologischer Strukturen mittels Aeromagnetik in Nordwest-Deutschland. Project Thesis, Leibniz Universität Hannover (LUH), Hannover, Germany, 14 January 2020. [Google Scholar]
  53. Taylor, M.J.; Smettem, K.; Pracilio, G.; Verboom, W. Relationships between soil properties and high-resolution radiometrics, Central Eastern Wheatbelt, Western Australia. Explor. Geophys. 2002, 33, 95–102. [Google Scholar] [CrossRef]
  54. De Louw, P.G.B.; Eeman, S.; Siemon, B.; Voortman, B.R.; Gunnink, J.; van Baaren, E.S.; Oude Essink, G.H.P. Shallow rainwater lenses in deltaic areas with saline seepage. Hydrol. Earth Syst. Sci. 2011, 15, 3659–3678. [Google Scholar] [CrossRef] [Green Version]
  55. Post, V.E.A. Annotated translation of “Nota in verband met de voorgenomen putboring nabij Amsterdam [Note concerning the intended well drilling near Amsterdam]” by J. Drabbe and W. Badon Ghijben (1889). Hydrogeol. J. 2018, 26, 1771–1788. [Google Scholar] [CrossRef]
  56. Houben, G. Annotated translation of “Die Wasserversorgung einiger Nordseebäder [The water supply of some North Sea spas]” by Alexander Herzberg (1901). Hydrogeol. J. 2018, 26, 1789–1799. [Google Scholar] [CrossRef]
  57. BKG. Rasterdaten Topographische Karte 1:50000 (DTK50-V); Bundesamt für Kartographie und Geodäsie: Frankfurt, Germany, 2014; Available online: https://www.geodatenzentrum.de (accessed on 4 February 2014).
  58. LBEG. Versalzung des Grundwassers 1:50000; Landesamt für Bergbau, Energie und Geologie: Hannover, Germany, 2020; Available online: https://nibis.lbeg.de/cardomap3/?permalink=2BjTs9lR (accessed on 9 April 2020).
  59. Skua–Gocad. Available online: https://www.pdgm.com/products/skua-gocad/ (accessed on 16 April 2020).
  60. Repsold, H. Geoelektrische Untersuchungen zur Bestimmung der Salz-/Süßwasser-Grenze im Gebiet zwischen Cuxhaven und Stade. Geol. Jahrb. 1990, C56, 3–37. [Google Scholar]
  61. Deus, N.; Elbracht, J.; Siemon, B. 3D-modelling of the salt-/fresh water interface in coastal aquifers of Lower Saxony (Germany) based on airborne electromagnetic measurements (HEM). In Proceedings of the AquaConSoil, 13th International UFZ-Deltares Conference on Sustainable Use and Management of Soil, Sediment and Water Resources, Copenhagen, Denmark, 9–12 June 2015; pp. 5–10. Available online: https://www.aquaconsoil.org/ACS_History/assets/aquaconsoil_proceedings_2015.pdf (accessed on 4 October 2019).
  62. Siemon, B.; Steuer, A.; Deus, N.; Elbracht, J. Comparison of manually and automatically derived fresh-saline groundwater boundaries from helicopter-borne EM data at the Jade Bay, Northern Germany. E3S Web Conf. 2018, 54, 1–6. [Google Scholar] [CrossRef] [Green Version]
  63. Wartenberg, W.; Vött, A.; Freund, H.; Hadler, H.; Frechen, M.; Willershäuser, T.; Schnaidt, S.; Fischer, P.; Obrocki, L. Evidence of isochronic transgressive surfaces within the Jade Bay tidal flat area, southern German North Sea coast—Holocene event horizons of regional interest. Z. Geomorphol. 2013, 57, 229–256. [Google Scholar] [CrossRef]
  64. Stackebrandt, W.; Ludwig, A.O.; Ostaficzuk, S. Base of Quaternary Deposits of the Baltic Sea Depression and Adjacent Areas—Brandenburgische Geowissenschaftliche Beiträge, 8; Landesamt für Boden, Geologie und Rohstoffe (LBGR): Kleinmachnow, Germany, 2001; pp. 13–19. Available online: https://lbgr.brandenburg.de/media_fast/4055/1_01_Stackebrandt_13-19.pdf (accessed on 16 March 2020).
  65. Ehlers, J. Allgemeine und Historische Quartärgeologie; Ferdinand Enke: Stuttgart, Germany, 1994; pp. 1–358. [Google Scholar]
  66. Eberle, D.G.; Siemon, B. Identification of buried valley using the BGR helicopter-borne geophysical system. Near Surf. Geophys. 2006, 4, 125–133. [Google Scholar] [CrossRef]
  67. Gabriel, G.; Kirsch, R.; Siemon, B.; Wiederhold, H. Geophysical investigation of Pleistocene valleys in Northern Germany. J. Appl. Geophys. 2003, 53, 159–180. [Google Scholar] [CrossRef]
  68. Blume, H.-P.; Fleige, H. Watten und Strände—Salzwiesen und Mangrovenwälder. In Handbuch der Bodenkunde; Wiley-VCH: Weinheim, Germany, 2016. [Google Scholar] [CrossRef]
  69. Sindowski, H. Das Ostfriesische Küstengebiet. In Sammlung Geologischer Führer, 1st ed.; Gebr. Borntraeger: Berlin/Stuttgart, Germany, 1973; Volume 57. [Google Scholar]
  70. Höfle, H.C.; Merkt, J.; Müller, H. Die Ausbreitung des Eem-Meeres in Nordwestdeutschland. E&G Quat. Sci. J. 1985, 35, 49–59. [Google Scholar] [CrossRef]
  71. Homeier, H. Der Gestaltwandel der ostfriesischen Küste im Laufe der Jahrhunderte—Ein Jahrtausend ostfriesischer Deichgeschichte. In Ostfriesland im Schutze des Deiches; Ohling, J., Ed.; Deichacht Krummhörn: Pewsum, Germany, 1969; Volume 2, pp. 2–75. [Google Scholar]
  72. Beamish, D. Peat mapping associations of airborne radiometric survey data. Remote Sens. 2014, 6, 521–539. [Google Scholar] [CrossRef] [Green Version]
  73. Beamish, D. Enhancing the resolution of airborne gamma-ray data using horizontal gradients. J. Appl. Geophys. 2016, 132, 75–86. [Google Scholar] [CrossRef] [Green Version]
  74. Schneekloth, H. Das Ahlen-Falkenberger Moor—Eine moorgeologische Studie mit Beiträgen zur Altersfrage des Schwarz-/Weißtorfkontaktes und zur Stratigraphie des Küstenholozäns. Geol. Jahrb. 1970, 89, 63–96. [Google Scholar]
  75. BGR. Soil map—Bodenübersichtskarte der Bundesrepublik Deutschland, 1:200000 (BUEK200); Bundesanstalt für Geowissenschaften und Rohstoffe (BGR): Hannover, Germany, 2018; Available online: https://geoviewer.bgr.de/ (accessed on 4 October 2019).
  76. Silvestri, S.; Christensen, C.W.; Lysdahl, A.O.K.; Anschütz, H.; Pfaffhuber, A.A.; Viezzoli, A. Peatland volume mapping over restive substrates with airborne electromagnetic technology. Geophys. Res. Lett. 2019, 46, 6459–6468. [Google Scholar] [CrossRef] [Green Version]
  77. Jupp, D.L.B.; Vozoff, K. Stable iterative methods for inversion of geophysical data. Geophys. J. Int. 1975, 42, 957–976. [Google Scholar] [CrossRef]
  78. King, J.; Oude Essing, G.; Karaoulis, M.; Siemon, B.; Bierkens, M.F.P. Quantifying inversion algorithms using airborne frequency domain electromagnetic data—Applied at the Province of Zeeland, the Netherlands. Water Resour. Res. 2018, 54, 8420–8441. [Google Scholar] [CrossRef] [Green Version]
  79. Gunnink, J.; Bosch, J.H.A.; Siemon, B.; Roth, B.; Auken, E. Combining ground-based and airborne EM through Artificial Neural Networks for modelling glacial till under saline groundwater conditions. Hydrol. Earth Syst. Sci. 2012, 16, 3061–3074. [Google Scholar] [CrossRef] [Green Version]
  80. Gunnink, J.L.; Siemon, B. Applying airborne electromagnetics in 3D stochastic geohydrological modelling for determining groundwater protection. Near Surf. Geophys. 2015, 13, 45–60. [Google Scholar] [CrossRef]
  81. Klimke, J.; Wiederhold, H.; Winsemann, J.; Ertl, G.; Elbracht, J. Three-dimensional mapping of Quaternary sediments improved by airborne electromagnetics. Z. Dtsch. Ges. Geowiss. 2013, 164, 369–384. [Google Scholar] [CrossRef]
  82. Minsley, B.J. A trans-dimensional Bayesian Markov chain Monte Carlo algorithm for model assessment using frequency-domain electromagnetic data. Geophys. J. Int. 2011, 187, 252–272. [Google Scholar] [CrossRef] [Green Version]
  83. BGR Produktcenter. Available online: https://produktcenter.bgr.de/ (accessed on 14 April 2020).
  84. BGR Geoviewer. Available online: https://geoviewer.bgr.de/ (accessed on 14 April 2020).
  85. BurVal Working Group. Groundwater Resources in Buried Valleys—A Challenge for Geosciences; Kirsch, R., Rumpel, H.-M., Scheer, W., Wiederhold, H., Eds.; Leibniz Institute for Applied Geosciences (GGA): Hannover, Germany, 2006. [Google Scholar]
  86. Rumpel, H.-M.; Binot, F.; Gabriel, G.; Siemon, B.; Steuer, A.; Wiederhold, H. Benefit of geophysical data for hydrogeological 3D modelling—An example of the Cuxhaven buried valley. Z. Dtsch. Ges. Geowiss. 2009, 160, 259–269. [Google Scholar] [CrossRef]
  87. Scheer, W.; Kröger, J.; Kirsch, R.; Zarth, M. Ellerbeker Rinne. In Groundwater Resources in Buried Valleys—A Challenge for Geosciences; Kirsch, R., Rumpel, H.-M., Scheer, W., Wiederhold, H., Eds.; Leibniz Institute for Applied Geosciences (GGA): Hannover, Germany, 2006; pp. 205–226. [Google Scholar]
  88. CLIWAT: Welcome to CLIWAT—A Transnational Project in the North Sea Region. Available online: https://cliwat.eu/ (accessed on 14 April 2020).
  89. Harbo, M.S.; Pedersen, J.; Johnsen, R.; The Cliwat Project Group (Eds.) Groundwater in a Future Climate—The CLIWAT Handbook; The Cliwat Project Group c/o Central Denmark: Viborg, Denmark, 2011; pp. 1–185. Available online: https://cliwat.eu/xpdf/groundwater_in_a_future_climate.pdf (accessed on 14 April 2020).
  90. Sulzbacher, H.; Wiederhold, H.; Siemon, B.; Grinat, M.; Igel, J.; Burschil, T.; Günther, T.; Hinsby, K. Numerical modelling of climate change impacts on freshwater lenses on the North Sea Island of Borkum using hydrological and geophysical methods. Hydrol. Earth Syst. Sci. 2012, 16, 3621–3643. [Google Scholar] [CrossRef] [Green Version]
  91. NAWAK: Development of Sustainable Adaptation Strategies for Water Management under Conditions of Climatic and Demographic Change. Available online: https://nawam-inis.de/en/inis-projects/nawak (accessed on 14 April 2020).
  92. TOPSOIL. Available online: https://northsearegion.eu/topsoil/ (accessed on 14 April 2020).
  93. Schneider, A.; Zhao, H.; Wolf, J.; Logashenko, D.; Reiter, S.; Vogel, A.; Howahr, M.; Eley, M.; Gelleszun, M.; Schöniger, H.M.; et al. Modeling saltwater intrusion scenarios for a coastal aquifer at the German North Sea. E3S Web Conf. 2018, 54, 1–6. [Google Scholar] [CrossRef]
  94. Rahman, M.A.; González, E.; Wiederhold, H.; Deus, N.; Elbracht, J.; Siemon, B. Characterization of a regional coastal zone aquifer using an interdisciplinary approach—An example from Weser-Elbe region, Lower Saxony, Germany. E3S Web Conf. 2018, 54, 1–7. [Google Scholar] [CrossRef]
  95. Ullmann, A.; Wiederhold, H.; Günther, T.; Steuer, A.; Siemon, B. Improving groundwater models by electromagnetic measurements—Case of Elbe-Weser estuaries. In Proceedings of the Near Surface Geoscience, Turin, Italy, 6–10 September 2015; European Association of Geoscientists & Engineers (EAGE): Houten, The Netherlands, 2015; Volume 2015, pp. 1–5. [Google Scholar] [CrossRef]
  96. Wiederhold, H.; Ullmann, A. INIS-Verbundprojekt NAWAK: Entwicklung Nachhaltiger Anpassungsstrategien für die Infrastrukturen der Wasserwirtschaft unter den Bedingungen des Klimatischen und Demografischen Wandels, Teilprojekt 4, BMBF-Schlussbericht; Leibniz-Institut für Angewandte Geophysik (LIAG): Hannover, Germany, 2017. [Google Scholar]
  97. Rahman, M.A.; Zhao, Q.; Skibbe, N.; Wiederhold, H.; González, E.; Siemon, B. Distribution of chloride concentration derived from helicopter-borne electromagnetic (HEM) data in the Elbe-Weser coastal aquifer, Lower Saxony, Germany. In Proceedings of the 79th Jahrestagung der Deutschen Geophysikalischen Gesellschaft (DGG), Braunschweig, Germany, 4–7 March 2019; p. 203. [Google Scholar]
  98. AIDA: From Airborne Data Inversion to In-Depth Analysis. Available online: https://www.geotechnologien-aida.de/AIDA/EN/Home/aida_node_en.html (accessed on 14 April 2020).
  99. Götze, H.-J.; Afanasjew, M.; Alvers, M.; Barrio-Alvers, L.; Börner, R.-U.; Brandes, C.; Eröss, R.; Menzel, P.; Meyer, U.; Scheunert, M.; et al. Towards an integrative inversion and interpretation of airborne and terrestrial data. In Tomography of the Earth’s Crust: From Geophysical Sounding to Real-Time Monitoring. Advanced Technologies in Earth Sciences; Geotechnologien Science Report no. 21; Weber, M., Münch, U., Eds.; Springer: Cham, Switzerland, 2014; pp. 21–41. [Google Scholar] [CrossRef]
  100. Scheunert, M.; Ullmann, A.; Afanasjew, M.; Börner, R.-U.; Siemon, B.; Spitzer, K. A cut-&-paste strategy for the 3-D inversion of helicopter-borne electromagnetic data—I. 3-D inversion using the explicit Jacobian and a tensor-based formulation. J. Appl. Geophys. 2016, 129, 209–221. [Google Scholar] [CrossRef]
  101. Ullmann, A.; Scheunert, M.; Afanasjew, M.; Börner, R.-U.; Siemon, B.; Spitzer, K. A cut-&-paste strategy for the 3-D inversion of helicopter-borne electromagnetic data—II. Combining regional 1-D and local 3-D inversion. J. Appl. Geophys. 2016, 130, 131–144. [Google Scholar] [CrossRef]
  102. Steinmetz, D.; Winsemann, J.; Brandes, C.; Siemon, B.; Ullmann, A.; Wiederhold, H.; Meyer, U. Towards an improved geological interpretation of airborne electromagnetic data: A case study from the Cuxhaven tunnel valley and its Neogene host sediments (northwest Germany). Neth. J. Geosci. 2015, 94, 201–227. [Google Scholar] [CrossRef] [Green Version]
Figure 1. (a) Onshore surface elevation [29] in meters above sea level (m asl) on a topographic map [30] of northwest Germany including numbered airborne survey areas. (b) Geology map [31] of northwest Germany including a legend with the main units within the airborne survey areas (black lines).
Remotesensing 12 01629 g001
Figure 2. Sketch of the helicopter-borne geophysical system (after [32]).
Remotesensing 12 01629 g002
Figure 3. Apparent resistivities ρa at a frequency of (a) f = 41 kHz and (b) f = 1.8 kHz. The corresponding centroid depths z* for the red/yellow/blue areas are about < 2 m/7 m/> 13 m in (a) and < 10 m/30 m/> 60 m in (b). The red dotted and blue dashed lines indicate the old estimates of shallow and deep saline groundwater, respectively [48]. Background: topographic map [30].
Remotesensing 12 01629 g003
Figure 4. Anomalies of the magnetic field ΔT (colors): (a) including anthropogenic effects, (b) cleaned (anthropogenic effects removed) and superposed with positive bandpass (BP) filtered ΔT values (grey). Background: topographic map [30].
Remotesensing 12 01629 g004
Figure 5. Radiometric results: (a) exposure rate E on a topographic map [30], (b) contours (minima in histogram: 1.5/5.5 µR/h) in comparison with geology [31]. Black line: frame of entire airborne survey area.
Remotesensing 12 01629 g005
Figure 6. East Frisian Island of Borkum: (a) resistivity map at -15 m asl and vertical resistivity section derived from four-layer inversion of helicopter-borne electromagnetic (HEM) data, (b) thickness of freshwater lenses derived from HEM (colors) and direct current (DC) geoelectric soundings (contours) models [10] on a topographic map [57]. Numbered black lines: flight lines. For location, see area 130 in Figure 1a.
Remotesensing 12 01629 g006
Figure 7. Fresh–saline groundwater interface (FSI): The colored contour map was recently derived from HEM resistivity models and borehole data (after [58]). The green and blue dotted lines indicate the old estimates of shallow and deep saline groundwater, respectively [48]. Background: topographic map [30].
Remotesensing 12 01629 g007
Figure 8. Jade Bay area: (a) resistivities at z = -25 m asl, (b) elevation of fresh–saline groundwater interface. The black lines in (a) indicate erased and partly interpolated data due to increased sensor elevations caused by anthropogenic effects (e.g., power lines) and regulations of the Wadden Sea National Park (bird breading areas at the coastline). Background: topographic map [57]. For location, see area 139 in Figure 1a.
Remotesensing 12 01629 g008
Figure 9. Cuxhaven–Bremerhaven (BC) channel area: clayey sediments appear as conductive signatures (orange to green colors) on resistivity maps (here: apparent resistivity at f = 1.8 kHz). An increased magnetic signal (here bandpass (BP) filtered magnetic ΔT data) also indicates areas with increased clay content (grey colors), e.g., the BC channel (dotted arrow). Background: topographic map [30]. For location, see areas 081, 087, 109, and 132 in Figure 1a.
Remotesensing 12 01629 g009
Figure 10. Ancient Harle Bay area to the southeast of the island of Spiekeroog: resistivities at -5 m asl in comparison with ancient shorelines due to land reclamations by enclosures. The bold dashed black line shows the situation at the end of the 13th century and the bold black line the current shoreline. The thin solid and dashed lines indicate the successive land reclamations in the century (Jh.) or year of activity (after [71]). The grey dots surrounded by dotted black lines indicate the area of Pleistocene sediments. For location, see area 133 in Figure 1a.
Remotesensing 12 01629 g010
Figure 11. Mires in northwest Germany [75]: Green colors indicate bogs and fens. The blue lines derived from a threshold of the exposure rate at E = 1.5 µR/h fairly well outline most of the larger mires. Black line outlines the airborne survey area and the red frame: shows the location of the Ahlen-Falkenberger Moor (see Figure 12). Background: topographic map [30].
Remotesensing 12 01629 g011
Figure 12. Elevation of the peat base of the Ahlen-Falkenberger Moor (AFM). The colored area resulted from applying thresholds to the elevation and radiometric (exposure rate) data to estimate the bog area (red lines). The grid shows the peat base derived from resistivity and exposure rate and the colored circles the borehole results. Double black circles mark those boreholes, where the difference to the airborne results exceeds ±2 m. Red circles indicate clayey sediments below the peat, the other sands. The brown lines outline Pleistocene sediments (Geest). The numbered flight lines are shown in black (and white if the data of the highest frequency were interpolated). Background: topographic map [57]. For location, see red frame in Figure 11.
Remotesensing 12 01629 g012
Table 1. Airborne geophysical systems.
System
No.
HEM
Bird No. (Freq.)
HMG
Cs Magnetometer
HRD
Spectrometer/Crystal Pack
1BKS48 (5F)G-822AGR-820/GPX-1024 (4⨯4 L)
2BKS36a (5F)G-822AGR-820/GPX-1024 (5⨯4 L)
3BKS60 (5F)G-822AGR-820/GPX-1024 (5⨯4 L)
4BKS36a (6F)G-822AGR-820/GPX-1024 (5⨯4 L)
5BKS36a (6F)G-822ARS-500/RSX-5 (5⨯4 L)
6BKS60 (6F)G-822ARS-500/RSX-5 (5⨯4 L)
Table 2. Airborne geophysical survey areas at the German North Sea coast, survey parameters, and systems used (principal system, temporarily replaced by the system in brackets).
Area
No.
Area NameYearArea Size [km2]Profile Length [km]System
No.
081Cuxhaven200053024271
087Bremerhaven200155022271
109Hadelner Marsch200470029713
111Ellerbeker Rinne2005/062809083 (2)
128Langeoog2008/0925910814
129Esens2008/0937915424
130Borkum2008884144 1
132Glückstadt2008/09195085814 (3)
133Jever2009/1449021396 (4)
138Nordenham2009/1036815694
139Varel201431912456
149Langeoog 2201410395
155Baltrum20145175
1 Gamma-ray spectrometer out of order.