Article

A Spatio-Temporal Analysis of Active Fires over China during 2003–2016

School of Geographical Sciences, Nanjing University of Information Science and Technology (NUIST), Nanjing 210044, China
*
Author to whom correspondence should be addressed.
Remote Sens. 2020, 12(11), 1787; https://doi.org/10.3390/rs12111787
Submission received: 3 May 2020 / Revised: 29 May 2020 / Accepted: 30 May 2020 / Published: 1 June 2020
(This article belongs to the Special Issue Satellite Remote Sensing Applications for Fire Management)

Abstract

:
Fire is a common circumstance in the world. It causes direct casualties and economic losses, and also brings severe negative influences on the atmospheric environment. In the background of climate warming and rising population, it is important to understand the fire responses regarding the spatio-temporal changes. Thus, a long-term change analysis of fires is needed in China. We use the remote sensed MOD14A1/MYD14A1 fire products to analyze the seasonal variations and long-term trends, based on five main land cover types (forest, cropland, grassland, savannas and urban areas). The fires are found to have clear seasonal variations; there are more fires in spring and autumn in vegetated lands, which are related to the amount of dry biomass and temperature. The fire numbers have significantly increased during the study period, especially from spring to autumn, and those have decreased in winter. The long-term fire trends are different when delineated into different land cover types. There are significant increasing fire trends in grasslands and croplands in North, East and Northeast China during the study period. The urban fires also show increasing trends. On the contrary, there are significant decreasing fire trends in forests and savannas in South China where it is most densely vegetated. This study provides an overall analysis of the spatio-temporal fire changes from satellite products, and it may help to understand the fire risk in the changing climate for a better risk management.

Graphical Abstract

1. Introduction

Fire is one of the most important disturbance agents in terrestrial ecosystems on a global scale [1]. It is also devastating and causes irreparable damage to the environment and atmosphere [2]. Many studies have shown that a strong relationship between the biomass burning with the main air pollution gas, such as Particulate Matter 2.5(PM2.5), CO2, and CO [3,4,5]. In addition, it is confirmed that biomass combustion is a major source of PM2.5 in both chemical and Positive matrix factorization (PMF) analysis, harming human health [6]. Meanwhile, biomass burning is not merely playing a role in degrading the air quality, but also, through radiance and cloud formation, affects the weather and climate [7]. In a changing climate, monitoring fire activities is significant so as to understand its response to the recent climate warming [8]. Therefore, it is very important to study the fire changes in the past decades.
During the period of 1965–2010, 1614 forest fires happened in Great Xing’an Mountains, in the northeast of China. The sum of burned forest area reached 35,230.19 km2 [9]. It is widely accepted that China is a great agricultural country. In recent years, accompanying the increase of the living standard, crop residue is not used in most areas, so a large amount of crop residue is burned in the croplands [10,11]. Every year, more than 400 grassfires occurred in the northeast of Inner Mongolia Autonomous Region, and the total of burned area reaches about 8000 km2 [12]. A large number of biomass fires in different vegetation types occur in China every year. It is necessary to conduct a comprehensive study of biomass fires in China for the goal of mastering the spatio-temporal characteristics of fires precisely, and we should take the different vegetation types into account for this purpose.
However, it is difficult to detect the biomass burning from traditional ways, which need much human and material resources, not to mention the observation of long-term spatio-temporal changes. Studies have used satellite remote sensing to monitor fires from the early 1990s [13,14], which can be applied at large scales. With the rapid development of remote sensing technology, increasingly satellites are used for fire monitoring [15,16,17].
In recent years, many studies have been committed to the spatial and temporal characteristics of fires from the global and regional perspectives, using satellite data [18,19,20,21]. Also, many researches are aimed at understanding the spatial and temporal patterns of biomass fires in China, applying different remote sensing data. From 2001 to 2013, 78.6% of the land was influenced by fire in China; forest fires have a large quantity and higher inter-annual variability in the northeast of China [22]. The Great Khingan Range forest area, Guangdong province and Yunnan province were regions with high fire risk from 2001 to 2010 [23]. In the past decades, the grasslands showed a higher fire risk in spring and autumn in Northeast China [24]. The croplands fires are mainly detected in Northeast China especially in spring and autumn, showing a upward trend with limited fluctuations in the past decades [25]. Most of the forest fires are detected in Northeast and Southwest China from 2013 to 2017 [26].
However, most of these studies have focused on fires of one landcover fires, a long-term and a comprehensive analysis of spatio-temporal in different vegetation types is needed in China. In addition, China has experienced a rapid urbanization recently, and around 60% of the population are living in urban areas [27]. Fires in urban areas are more harmful, and this study also takes the urban fires into account. In this research, we have analyzed the fire changes of different land cover types during 2003–2016 in China, using satellite images and the online tool: Google earth engine (GEE). It is expected that this study can help us to understand the fire risk of different land cover types to the changing climate.

2. Study Area, Data and Methods
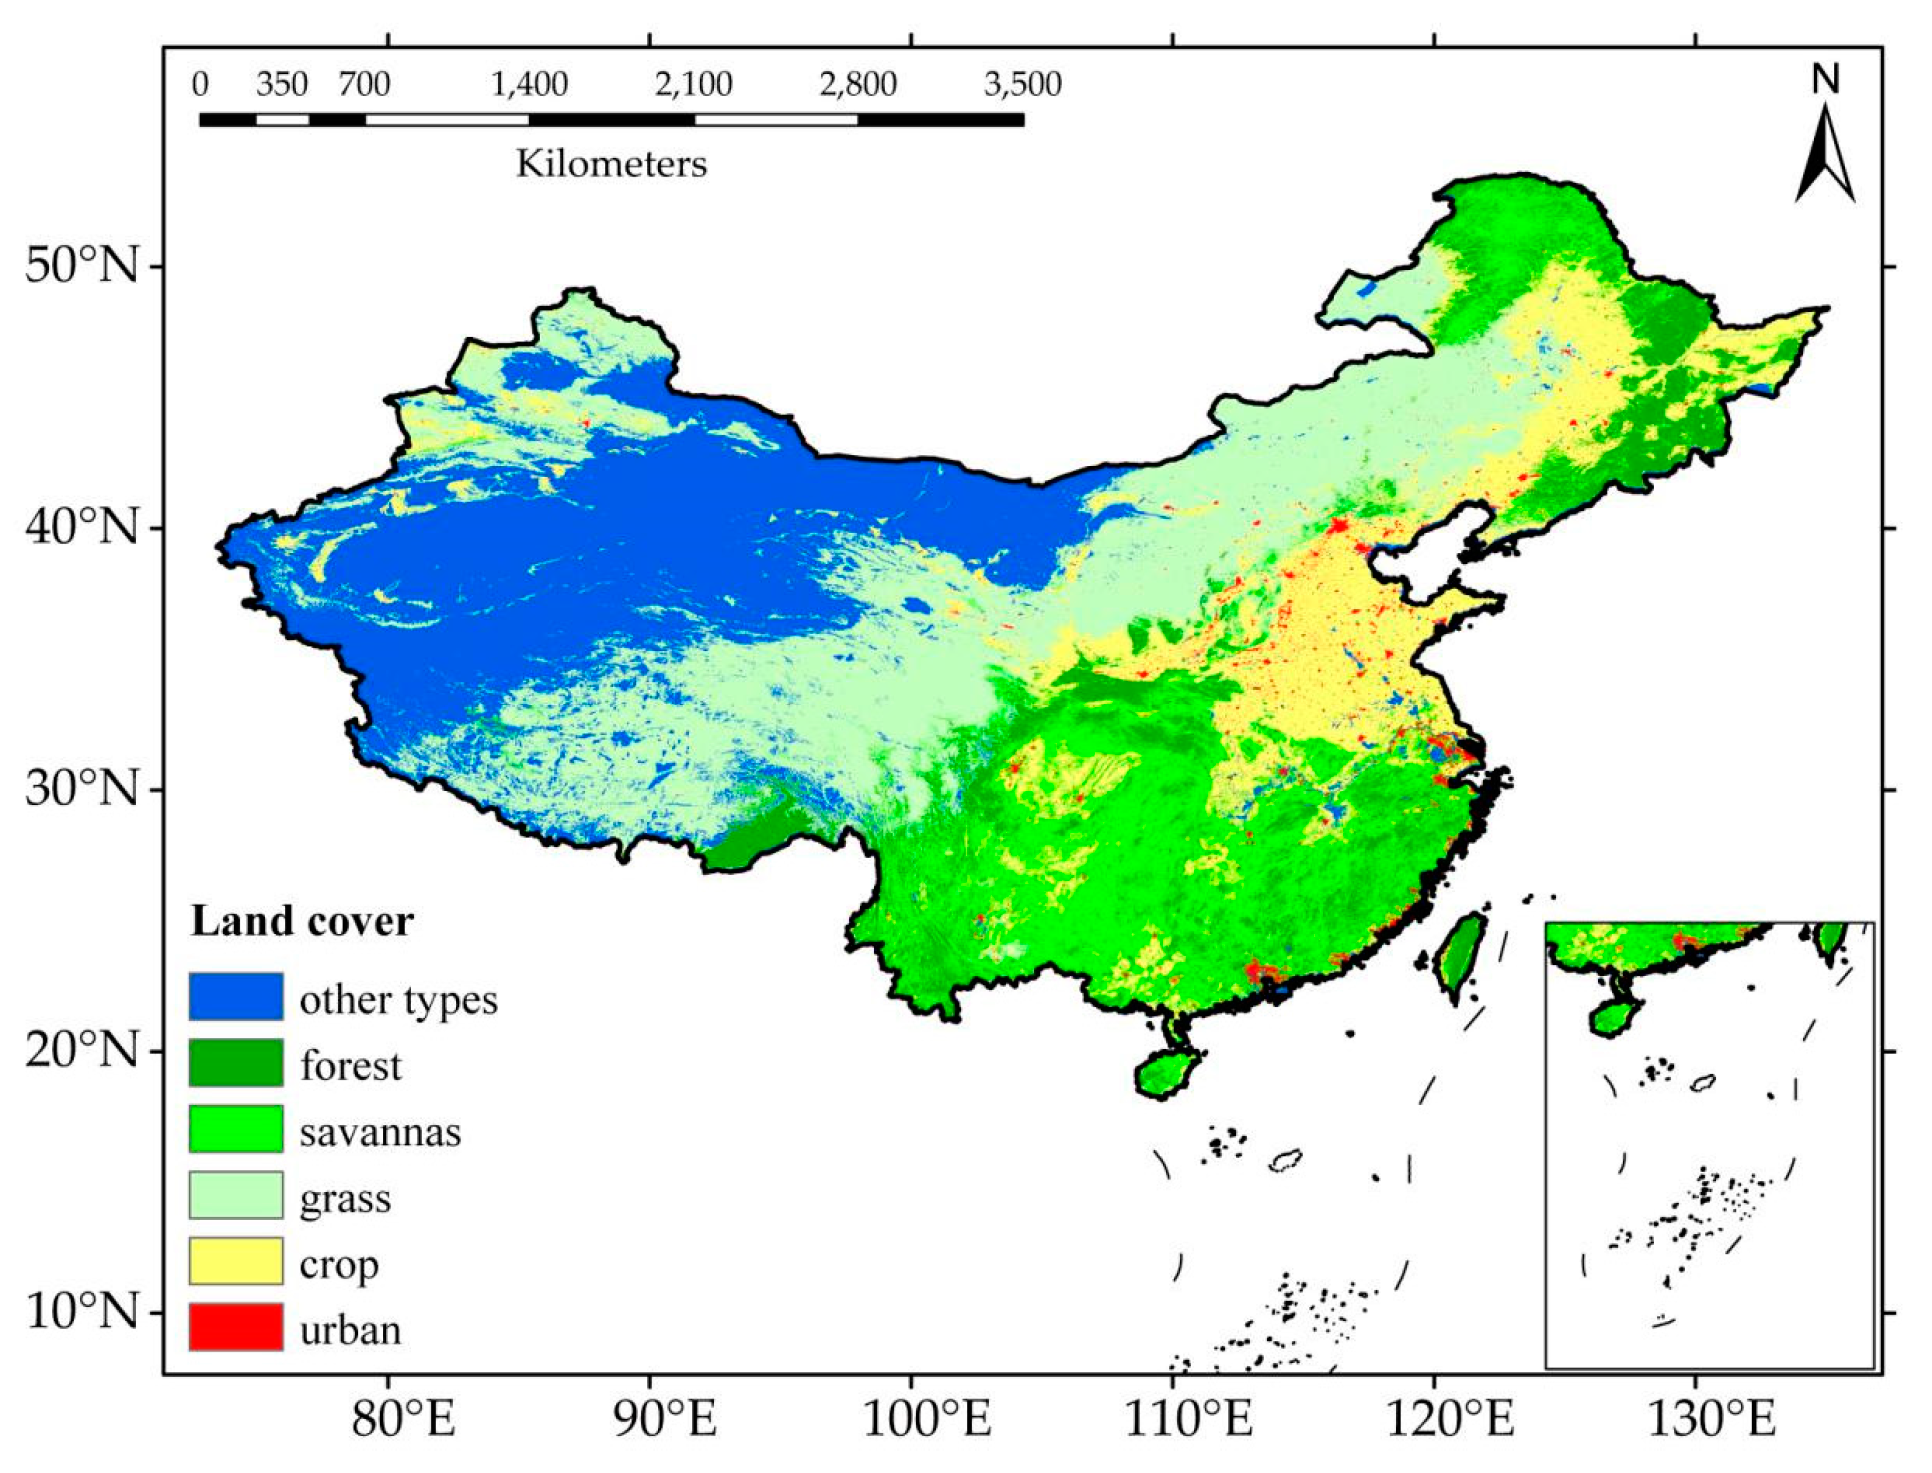
2.1. Study Area

Our study area includes the whole territory of China, except for the Nansha islands. China has a large latitude span with a complex climate, where it is relatively dry in the north and wet in the south [28,29]. The dry areas are mainly distributed in Northwest China because of the long distance from the oceans and the Tibet Plateau that blocks warm, wet air from the Indian Ocean [30,31]. The climate is dominated by the East Asian monsoon in the East China, where the summer is wet and hot while winter is dry and cold [32].
It is known that about 75% of the land areas of China are covered by different vegetation types, mainly including forest, savannas, croplands and grasslands [33]. Therefore, the whole country is divided into five main kinds of land coverage types, including forest, croplands, grasslands, savannas, and urban areas.

2.2. Data

2.2.1. MODIS Fire Products

We use NASA’S MODIS fire product in this study, which is the longest fire records at a global scale [34]. The products are obtained from the MODIS sensors onboard the Terra and Aqua satellites launched in December 1999 and May 2002 respectively. Both satellites have a revisit time of twice a day. The Terra crosses the equator at about 10:30 and 22:30 local time, and the Aqua crosses the equator at about 1:30 and 13.30 local time. Since the launch of Terra and Aqua, they have been widely used to study the role of fires in the Earth system [35]. There are fire products from both Terra and Aqua satellites, named MOD14A1 and MYD14A1 respectively, freely available from the USGS/NASA Land Processes Distributed Active Archive Center (https://lpdaac.usgs.gov/). These provide global daily records of burning spots at a spatial resolution of 1 km. These products are mainly derived from 3.9 and 11 μm channels, using a contextual algorithm according to the temperature difference of the fire site and surrounding areas [15]. The active fires detected by MODIS have a high precision. The latest MODIS fire product (C6) is reported to have a noticeable improvement over the last collection, with a low commission error at about 3% in China, and the omission error is about 5% [36]. The difference in overpass time provides a unique insight into diurnal occurrences; our statistics are applied to both products separately rather than their daily average. The fire data are extracted using the online tool of Google earth engine (GEE), which is a cloud platform, for big satellite data processing [37,38,39]. The land cover products for our study are the MCD12Q1 products on the GEE platform.

2.2.2. The Data of Land Cover

In this study, we use the MODIS land cover type product (MCD12Q1), which provides global maps of land cover types at a spatial resolution of 500 m. This product is updated on an annual base. The MCD12Q1 product has 5 legacy classification schemes(International Geosphere-Biosphere Programme (IGBP), University of Maryland classification scheme (UMD), the LAI/fPAR Biome scheme (LAI), the Biome classification scheme (BGC), and the Plant Functional Type scheme described(PFT) and a new three layer legend based on the land cover classification system (LCCS) from the Food and Agriculture Organization [40]. The recent version (C6) has an improvement to both the classification algorithm and product quality compared with the previous versions, especially regarding the reduction of spurious land cover change [41]. The IGBP classification is used in our study, which includes 17 land cover types (Table 1). We reclassified these types into forests (1,2,3,4,5), savannas (6,7,8,9), grasslands (10), croplands (12,14) and urban (13). Other land cover types, including permanent wetlands (11), permanent snow and ice (15), and barren and water bodies (16,17), where there are limited fires, are not analyzed in our study. These land cover types of China are shown in Figure 1.

2.3. Methods

2.3.1. Extract Burning Spot

We use the geographical information science (GIS) to extract the total fire numbers with the fire products of China [20]. We note that the fire number hereon means the detected fires on each day and each pixel. The MCD12Q1 product has a spatial resolution of 500 m and we aggregate it to 1 km resolution [42] so that it can match the Terra and Aqua fire products [43,44].

2.3.2. Theil-Sen slope (TS)

The Theil-Sen slope (TS) method is used to detect the pixel-wise linear trends in the fire products. The TS method a well-established non-parametric method put forward by Theil in 1950 and Sen modified it in 1968 [45,46]. Compared with traditionally used linear regression, this method is not sensitive to outliers, and thus it is plausible for a more robust estimation of linear trend [47]. It is especially suitable for time series with large inter-annual variations [48]. The formula of the TS method is as follows:
Δ = m e d i a n ( x j x i j i ) .
In the above formula, median is the median function, xj and xi are the data at time points of j and i respectively.

2.3.3. Mann-Kendall (MK) Test

The Mann–Kendall (MK) test is applied to determine the significance of long-term trends. This method is also a non-parametric statistic that does not need samples to meet a certain distribution. An combination of the MK and the TS methods is an important trend analysis approach [49]. The statistic, S, is calculated as followed:
S = i = 1 n 1 j = i + 1 n s g n ( x j x i ) ,
S g n ( x j x i ) = { + 1 ,     0 , 1 , x j x i > 0 x j x i = 0 x j x i < 0   ,
where x i   and   x j are sequential data values at time i and j (j > i), and n represents the length of data points.
The calculation of probability is related to S and n. When n 10 , S is generally in a standard normal distribution and the variance is computed as follows:
V a r ( S ) = n ( n 1 ) ( 2 n + 5 ) i = 1 m x i ( x i 1 ) ( 2 x i + 5 ) , 18
where m is the length of the tied group. The statistic Zs is calculated using the following equations:
Z s = { S 1 V a r ( S ) ,    if   S > 0             0 ,    if   S = 0 S + 1 V a r ( S ) ,    if   S < 0 .
When Zs is positive, the trend is increasing, or vice versa. The bilateral trend test is conducted according to a special α significance level. The null hypothesis is false if | Z s | > Z 1 α / 2   ( Z 1 α / 2 is obtained by the table lookup method); if the hypothesis is true, the time series has a significant up- or downward trend. In this study, the significance level α = 0.05 is applied.

3. Results

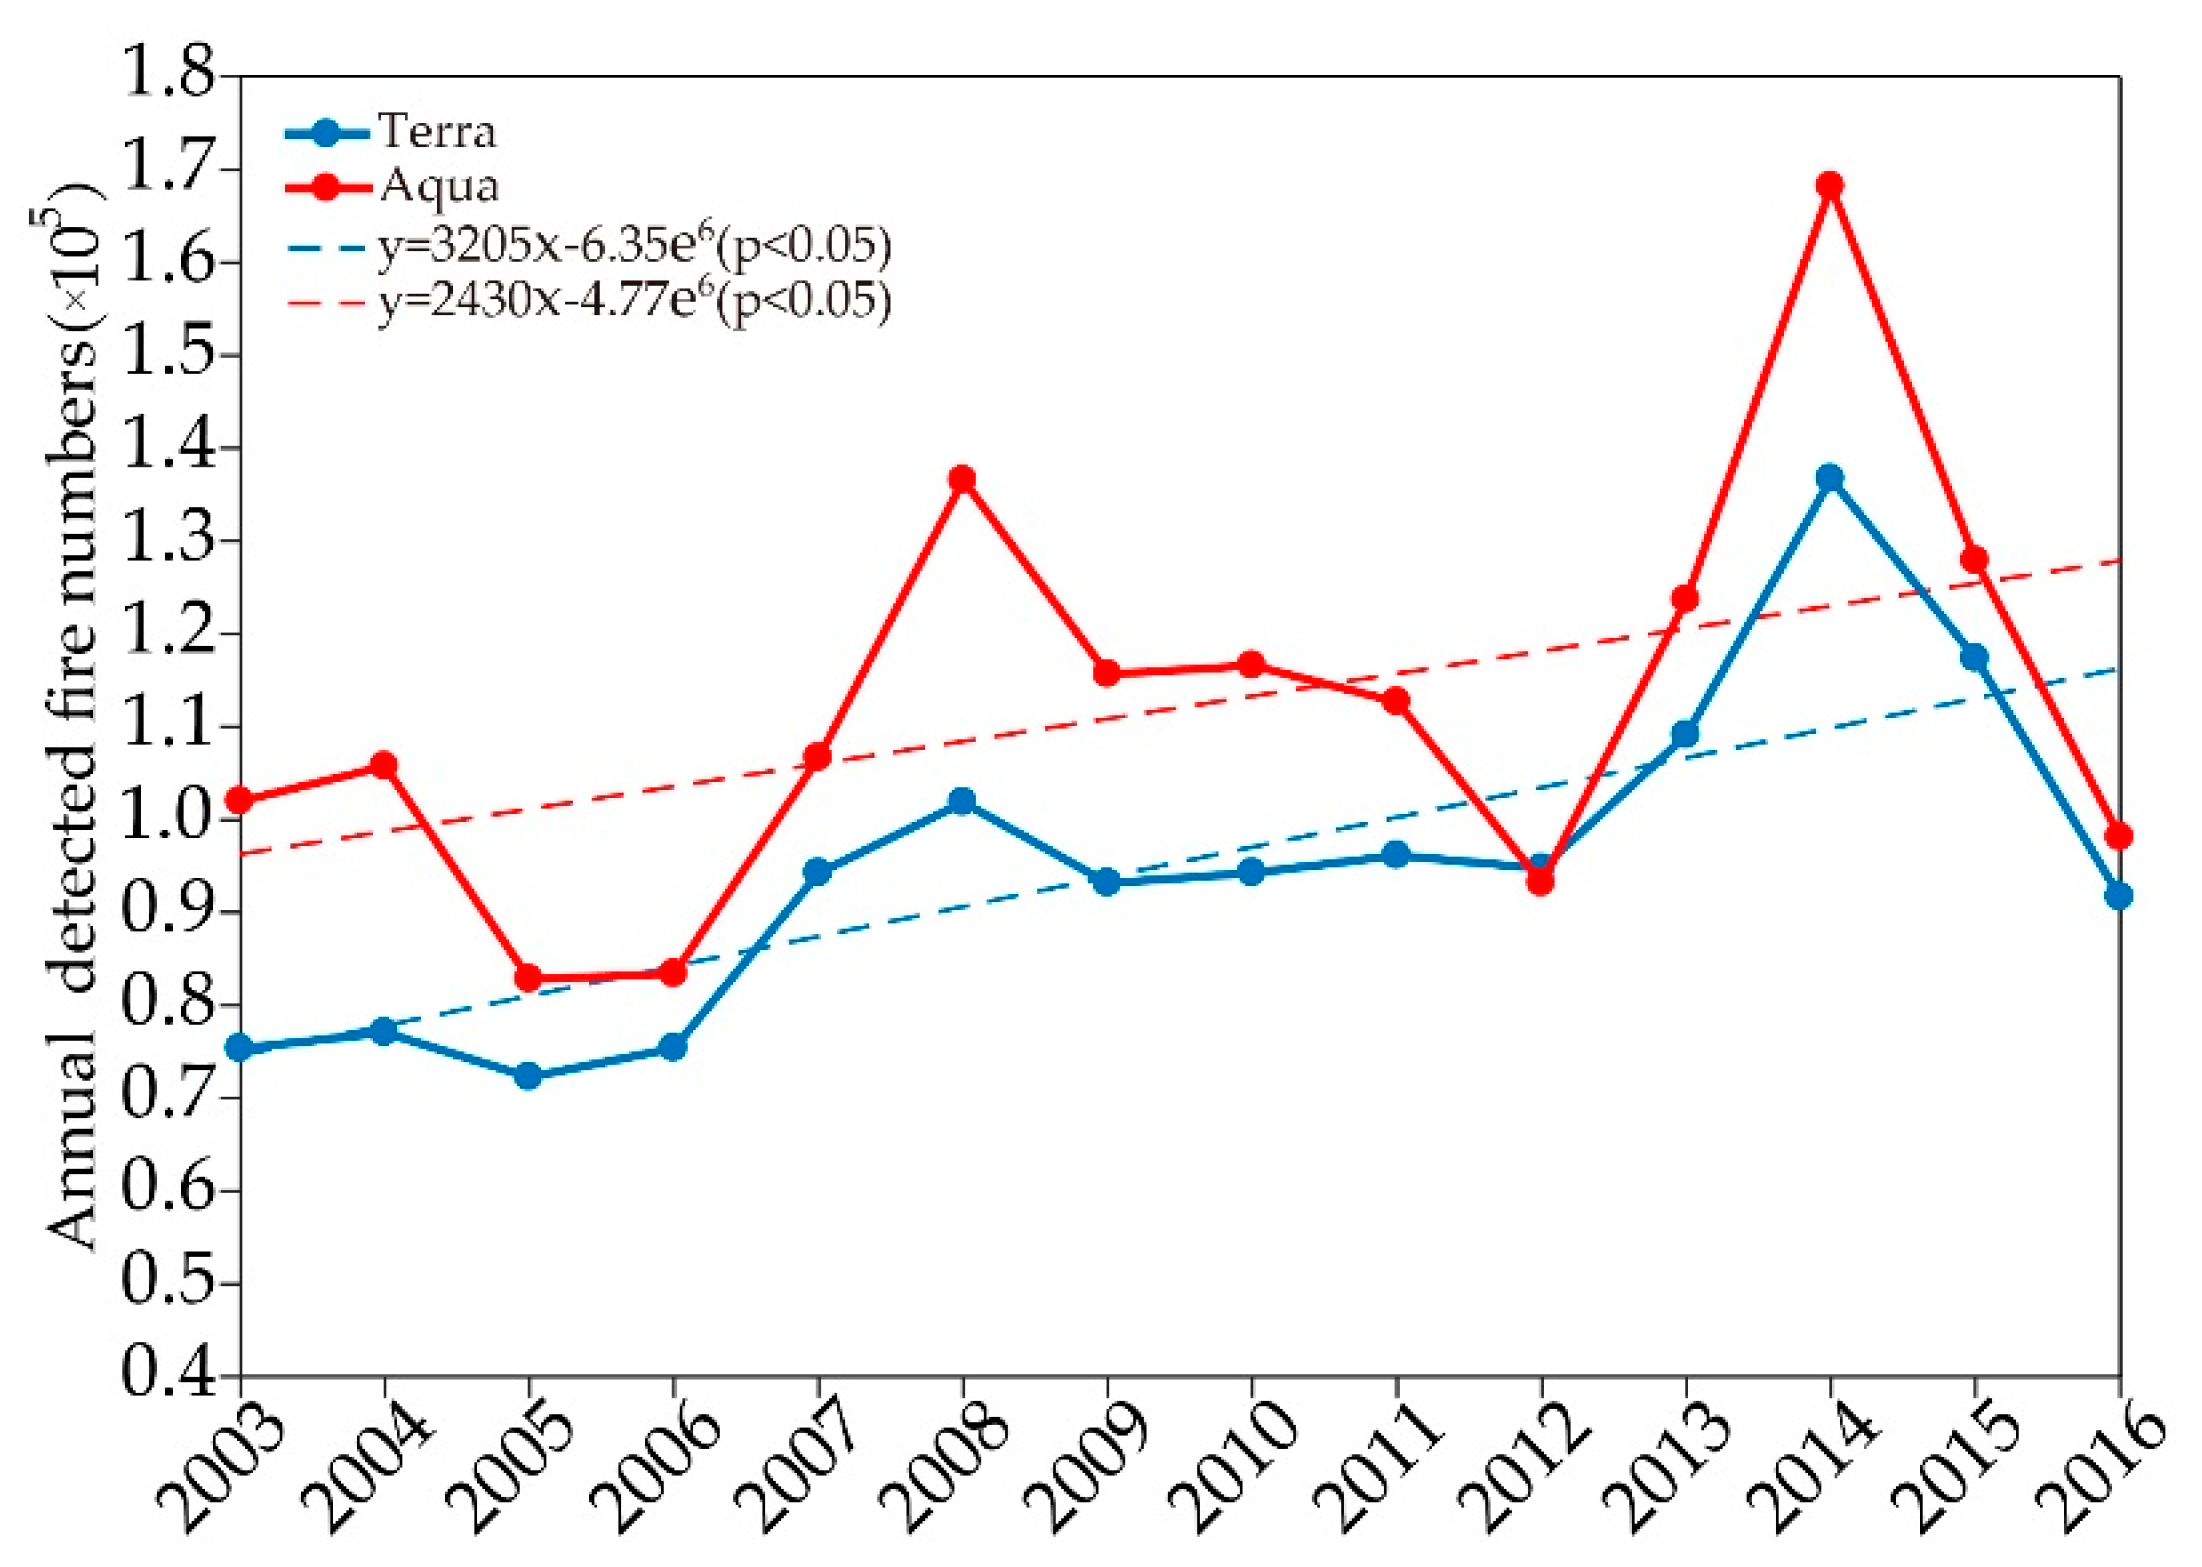
3.1. Annual Fire Changes

Shown in Figure 2 are the annual fire numbers of the Terra and Aqua satellites during 2003–2016, across China. We note that the fire number hereon means the detected fire points on each day and each pixel. It is indicated that, the annual fire numbers range from 0.7 × 10⁵ to 1.7 × 10⁵, and there are significantly more fires detected by the Aqua than the Terra satellite. Notably, fires from both satellites have shown increasing trends during 2003–2016, passing the significance test at 0.05 level. It is thus indicated that China has experienced more and more fires in the past decade. During the study period, there are two pronounced peaks, in 2008 and 2014, indicating more fire occurrences. There are significantly more fires in these peak years from the Aqua versus the Terra satellite. This may relate to the overpass times of the satellites [50]. The overpass times of the Terra satellite are about 10:30 and 22:30, and those of the Aqua satellite about about 1:30 and 13.30. Some fires occurring at morning may last until the Aqua satellite passes; meanwhile, this satellite is the only one that can detect fires occurring at afternoon.
We then delineate the fire numbers into land cover types of forests, savannas, grasslands, croplands, and urban areas. Table 2 shows the percentages of fire numbers in different land covers during 2003–2016. We can clearly find that most fires that have occurred are in the savannas, croplands and forests, amounting to totally about 85% from both Terra and Aqua satellites. For grasslands and urban areas, their respective percentages are less than 10% from both satellites. There are rather limited fire occurrences in the other land cover types, which are mostly located in Northwest China.
Figure 3 shows the annual fire numbers delineated to the land cover types of forests, croplands, grasslands, savannas, and urban areas during 2003–2016. From the viewpoint of land covers, the fires have shown quite different trends. They are significantly increasing in grassland, cropland and urban areas, which have mostly passed the significant test at 0.05 level. However, in forest and savannas, the fire trends are significantly downward, indicating there are less and less fires in the past decades. The reasons for these opposite trends remain unclear. Croplands and grasslands are noticed to have comparable fire numbers during 2003–2016. However, in forests and savannas there are obviously more fires from the Aqua than the Terra satellite. This may relate to fire durations in different land cover types. Fires in croplands and grasslands may have relatively short durations, those in forests and savannas have a high possibility to last a longer time than can be detected by the Terra but also by the Aqua satellite. In the urban areas, there are significant increasing trends in both products, and there are significantly more fires from the Terra satellite than the Aqua satellite.
Sometimes it is of interest to understand the fire changes in different land forest types. Figure 4 shows the change of annual fire numbers in different forest types: broadleaf forest, needleleaf forest and mixed forest areas, during 2003–2016. From the view of different forest types, the fires have shown quite different trends. There is a significant decreasing trend in the broadleaf forests which are mostly located in South China. However, there are not significant changes observed in the needleleaf and mixed forests, which are mostly located in North China. Therefore, we can conclude that the decline of forest fires is mostly due to the changes in the broadleaf forests.

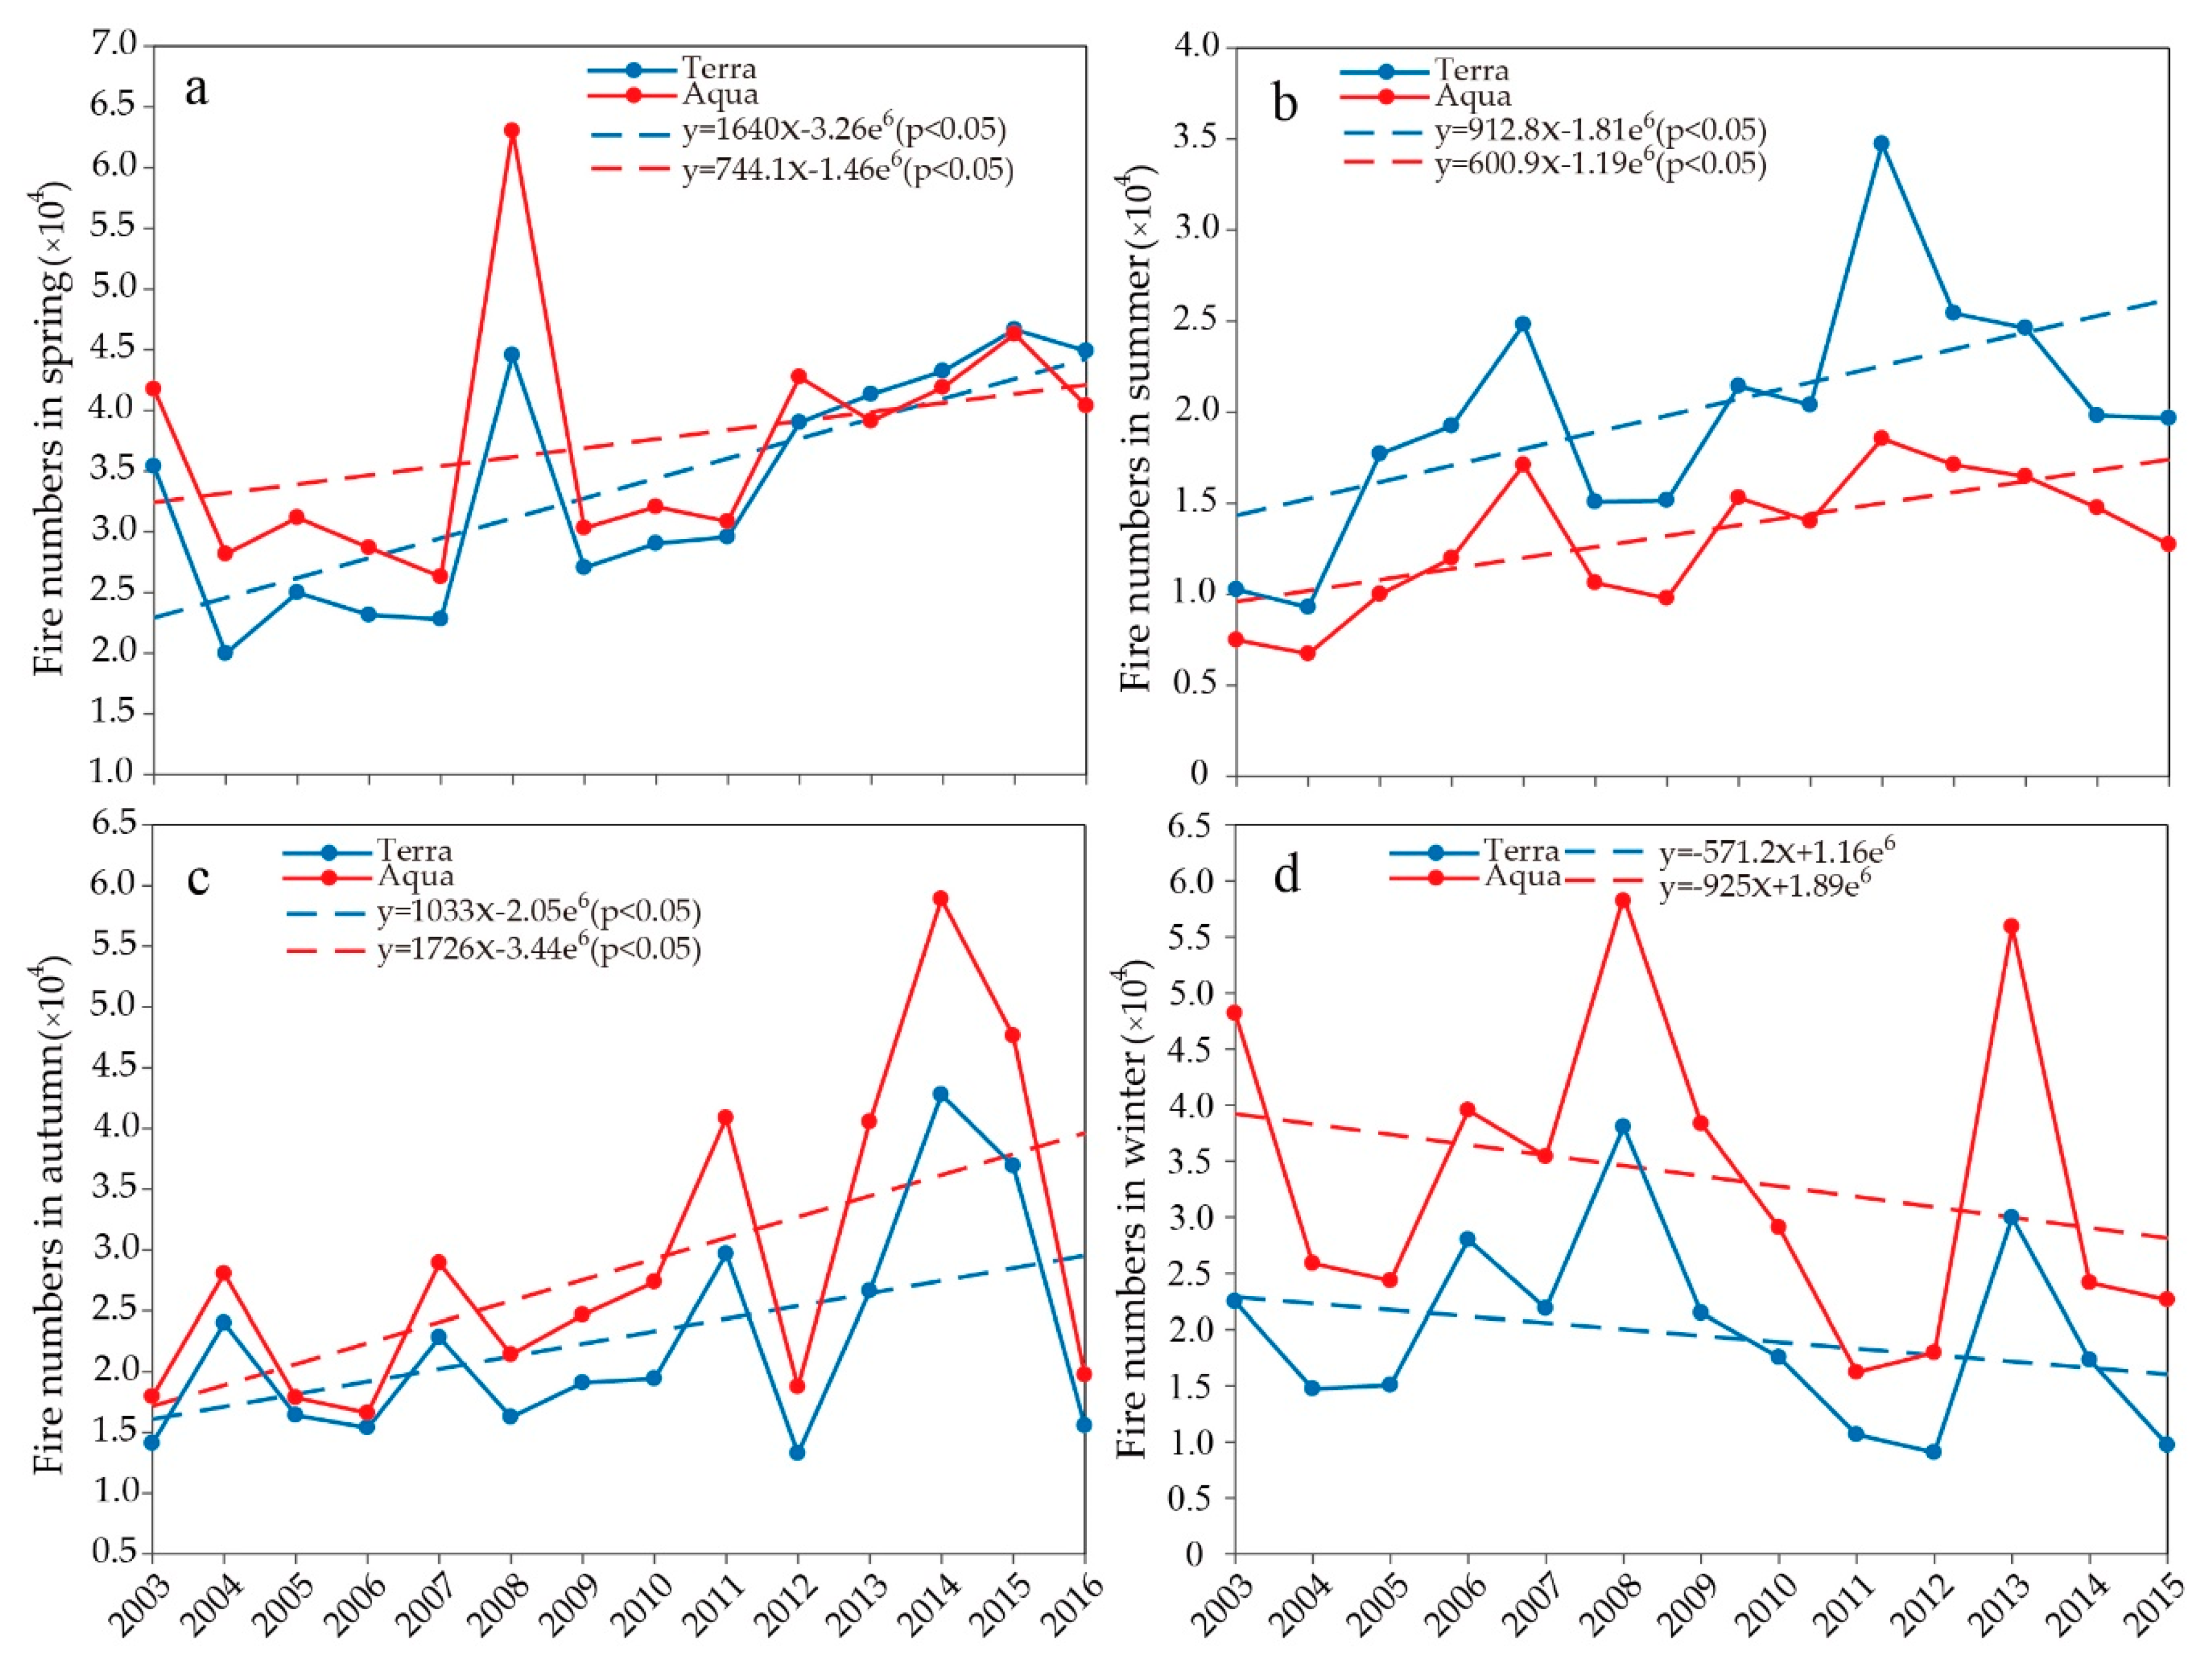
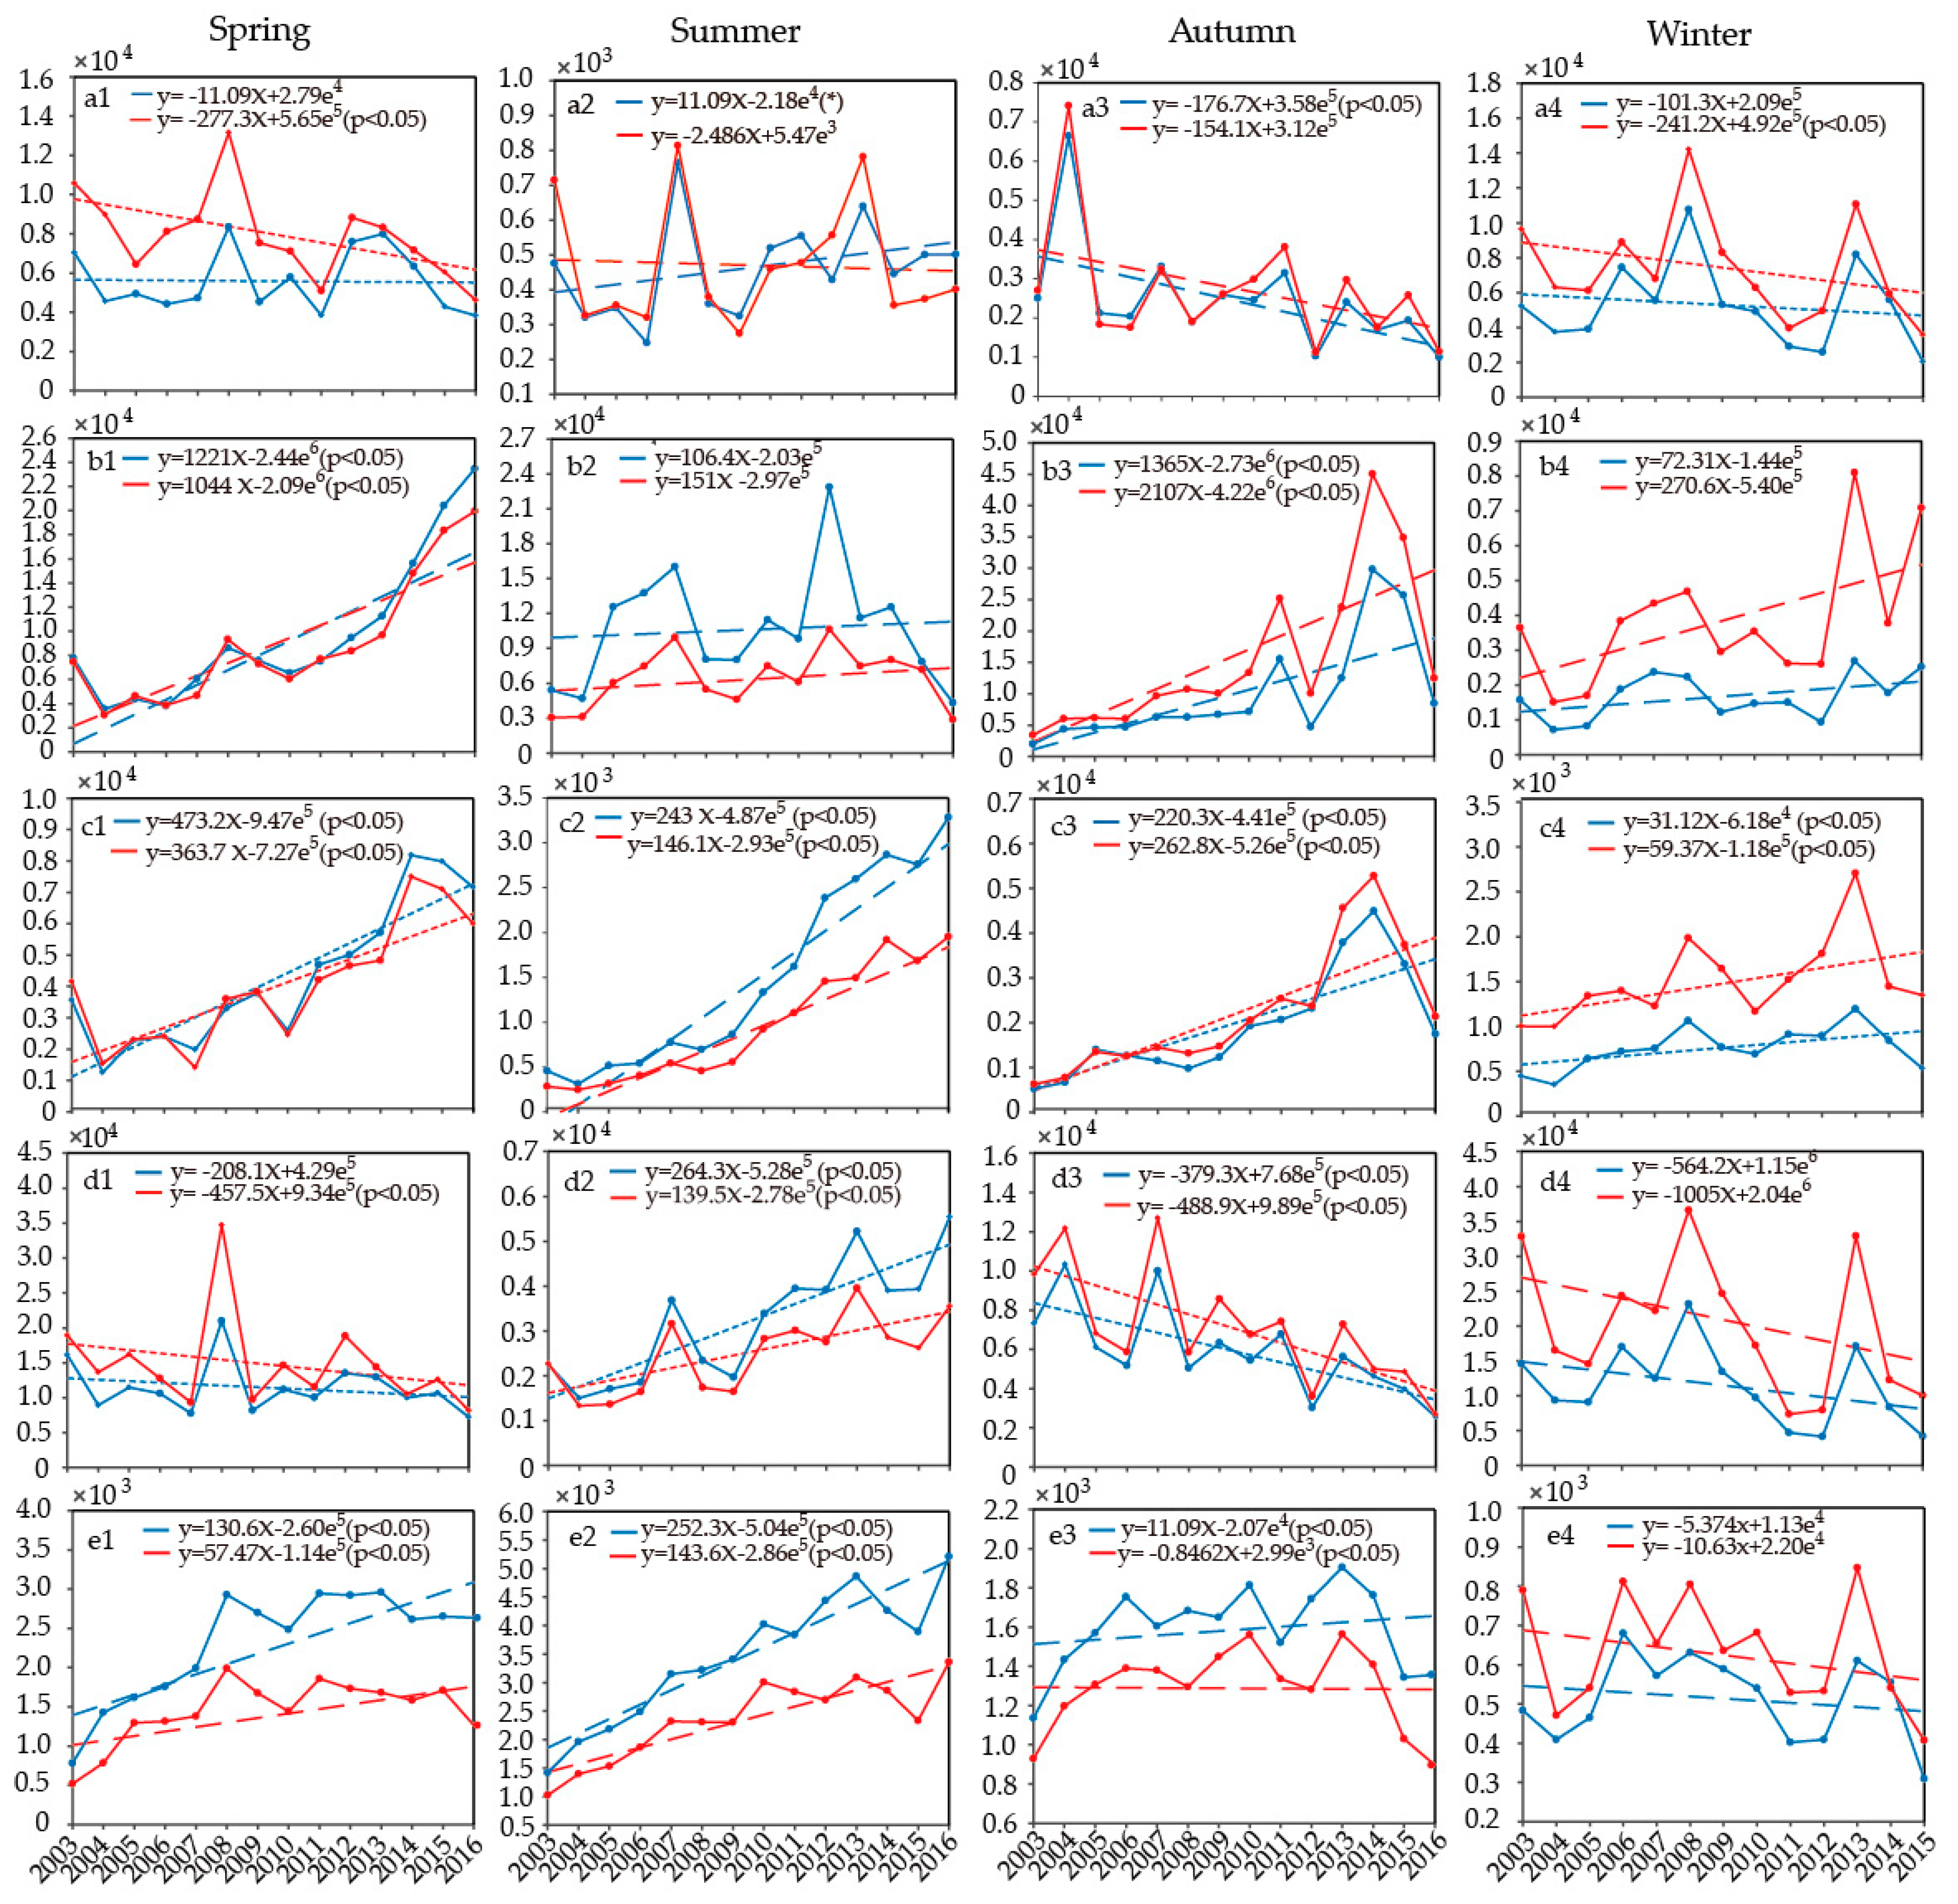
3.2. Annual Fire Changes in Different Seasons

Figure 5 shows the annual fire changes in different seasons. It is not surprising to find that both fire products from Terra and Aqua satellites appear to have quite similar trends in each season. In spring, there are increasing trends in both fire products during 2003–2016, and their fire numbers are comparable especially in the latest seven years. In summer, both fire products show significant increasing trends, and there are significantly more fires from the Terra satellite. In autumn, both satellites show similar increasing trends as in spring; however, there are significantly more fires from the Aqua than the Terra satellite, which are opposite to those in spring. In winter, both fire products show trends opposite to those in other seasons, indicating the decreasing fire occurrences in the past decades.
We further delineated these annual trends into different land cover types, which are shown in Figure 6. It is obvious that the long-term fire changes in each land cover type differ largely with seasons. Overall, fires in forests show a decreasing trend (Figure 6a); however, this trend is not significant in all seasons. In cold seasons of winter and spring, only the Aqua data show a significant increasing trend, and no significant trends are observed in the Terra data. In autumn, there are significant decreasing trends in both Terra and Aqua data, as in the annual data; however, in summer there is a slight but significant increasing trend in the Terra data. Fires in croplands show a significant increasing trend in terms of the annual amount (Figure 6b); however, a significant increasing trend is only found in spring and autumn, and the trend in autumn is much stronger than that in spring. In summer and winter seasons, there are not significant trends observed from either satellite. In grasslands, there are significant increasing trends in all seasons, and that in spring is strongest. In savannas, there is a significant decreasing trend of the annual fire numbers (Figure 6d); such a trend is observed in spring, summer and winter seasons, and on the contrary a significant decreasing trend is observed in autumn. In the urban areas, annual numbers show an increasing trend (Figure 6e); however, increasing trends are only found in spring and summer seasons, and there are not significant trends in autumn and winter.

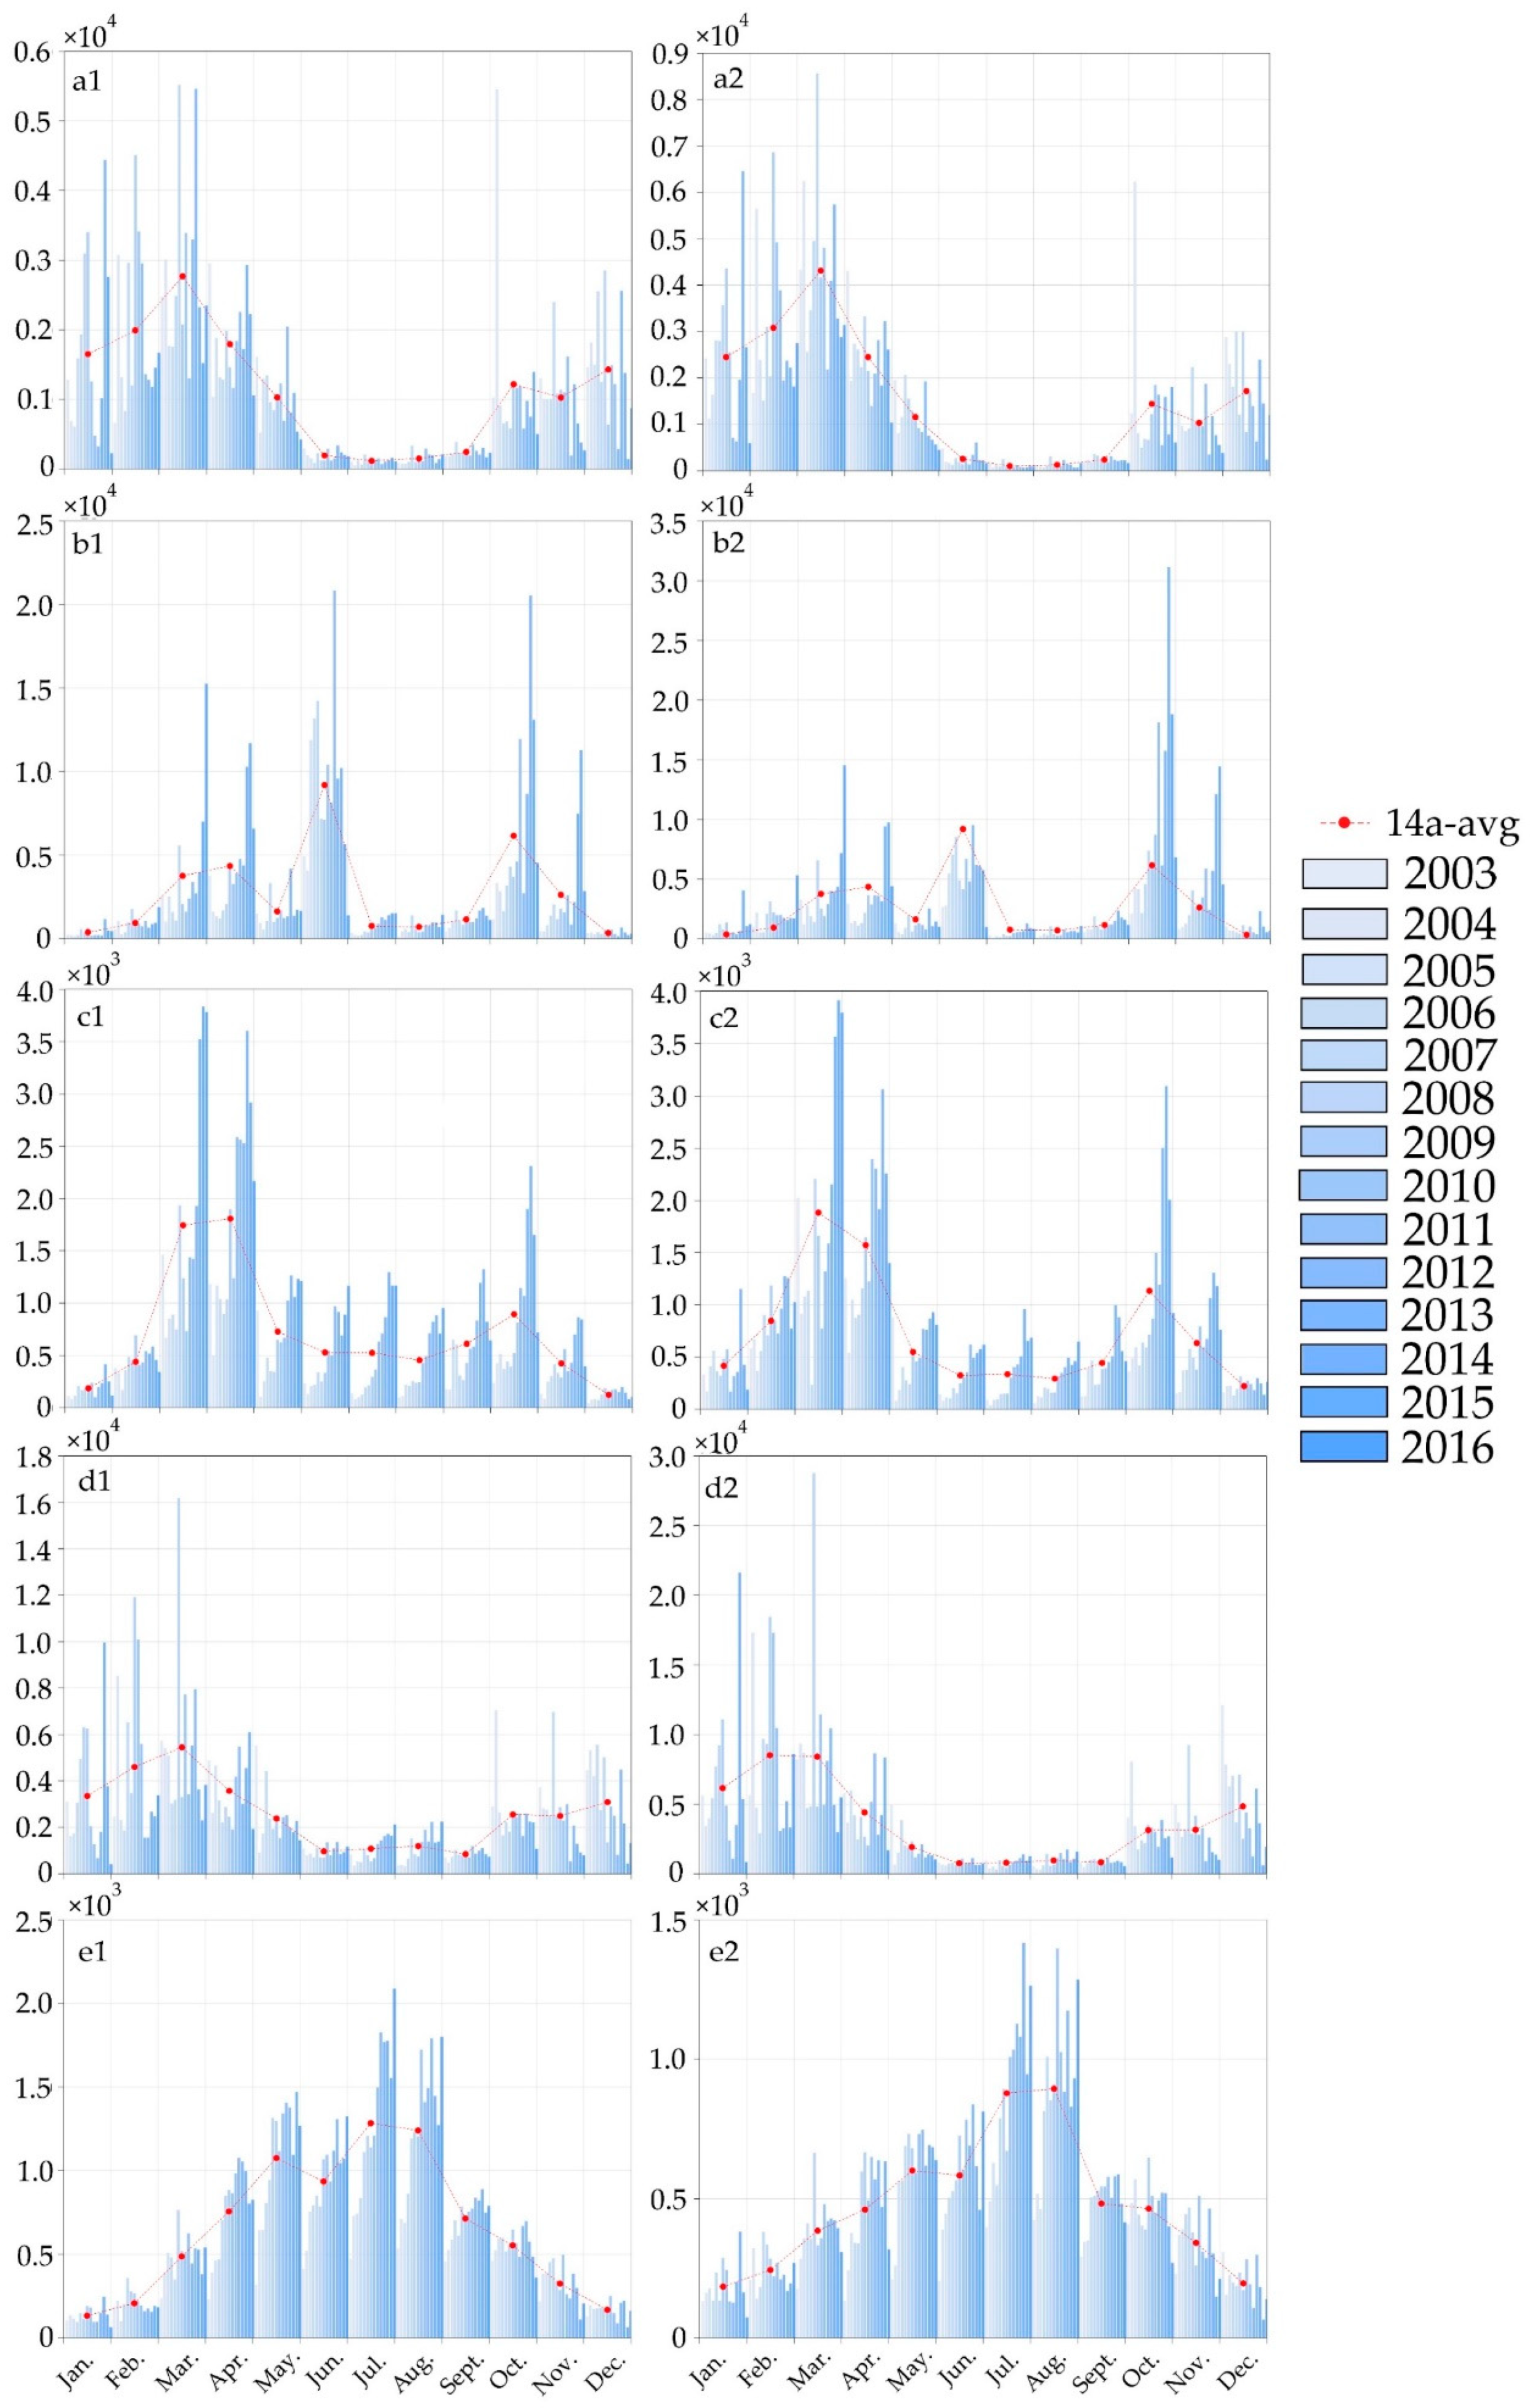
3.3. Seasonal Fire Changes

We then analyzed the seasonal variability of the fire numbers from both satellites. To understand the possible data uncertainties, the monthly fire numbers during 2003–2016 are also shown. Figure 7 shows the monthly fire numbers from (a) Terra and (b) Aqua products across China during 2003–2016. Clearly, there are significant changes of the fires in each month during the study period; and obvious increasing trends are seen especially in the months of spring, summer and autumn seasons. Both the Terra and the Aqua products show a very strong seasonality of the fire numbers. It is clearly shown that there are more fires in spring and autumn, while much less in summer and winter. This seasonality of the fire occurrences may relate to the seasonal changes of biomass and the meteorological conditions. Wild fires are mainly affected by dry biomass, temperature, and human activities. In winter, there is maximum dry biomass especially in forests, grasslands and savannas; however, the temperature is low, which hinders fire occurrences. In spring and autumn, the temperature is relatively high and it may promote fire occurrences. In summer, there are the least fires; while the temperature is the highest, the dry biomass is relatively reduced and there is more rainfall, resulting in reduced fires.
Next, the seasonality of fire changes from both satellites is studied in different land cover types, which are shown in Figure 8. The seasonal fire changes in forests are distinct with two peaks in spring and autumn respectively. This seasonality of wild fires in forests is largely related to the large amount of dry biomass, especially fallen leaves, and high temperature in spring and autumn. In summer, although temperature is the highest, the dry biomass is the least, which makes it different for fire occurrences. As for the interannual fire variations in forests, long-term decreasing trends during 2003–2016 are seen in most months, especially in the spring and autumn months. In croplands, there is not a distinct seasonality as in forests; however, in months of April–June and September–October, there are relatively more fires. This may relate to the agricultural management system, and there are more fires in the crop harvesting months. As for their long-term changes during 2003–2016, we can see significant fire increases in spring and autumn months in which there are more fires. Grasslands shows a clear seasonal change and there are relatively more fires in spring and autumn as in forests. There are significant increasing trends in almost all months during 2003–2016, except for those in winter. In grasslands, there is a quite similar seasonality as in savannas with more fires in spring and autumn, and less in summer and winter.
In the abovementioned land cover types, the seasonal fire changes are obviously the changes of dry biomass, and generally there are more fires in spring and autumn months. However, in urban areas the seasonal fire changes are quite different from the abovementioned land cover types. Clearly, there are the least fires in winter, and then fires gradually increase in spring; fire numbers reach the maximum in summer, and then decrease gradually in autumn. The seasonal fire changes appear to follow a bell curve from both Terra and Aqua satellites. This probability distribution indicates that urban fires are likely to have a close relation with the seasonal changes of meteorological conditions, especially temperature.

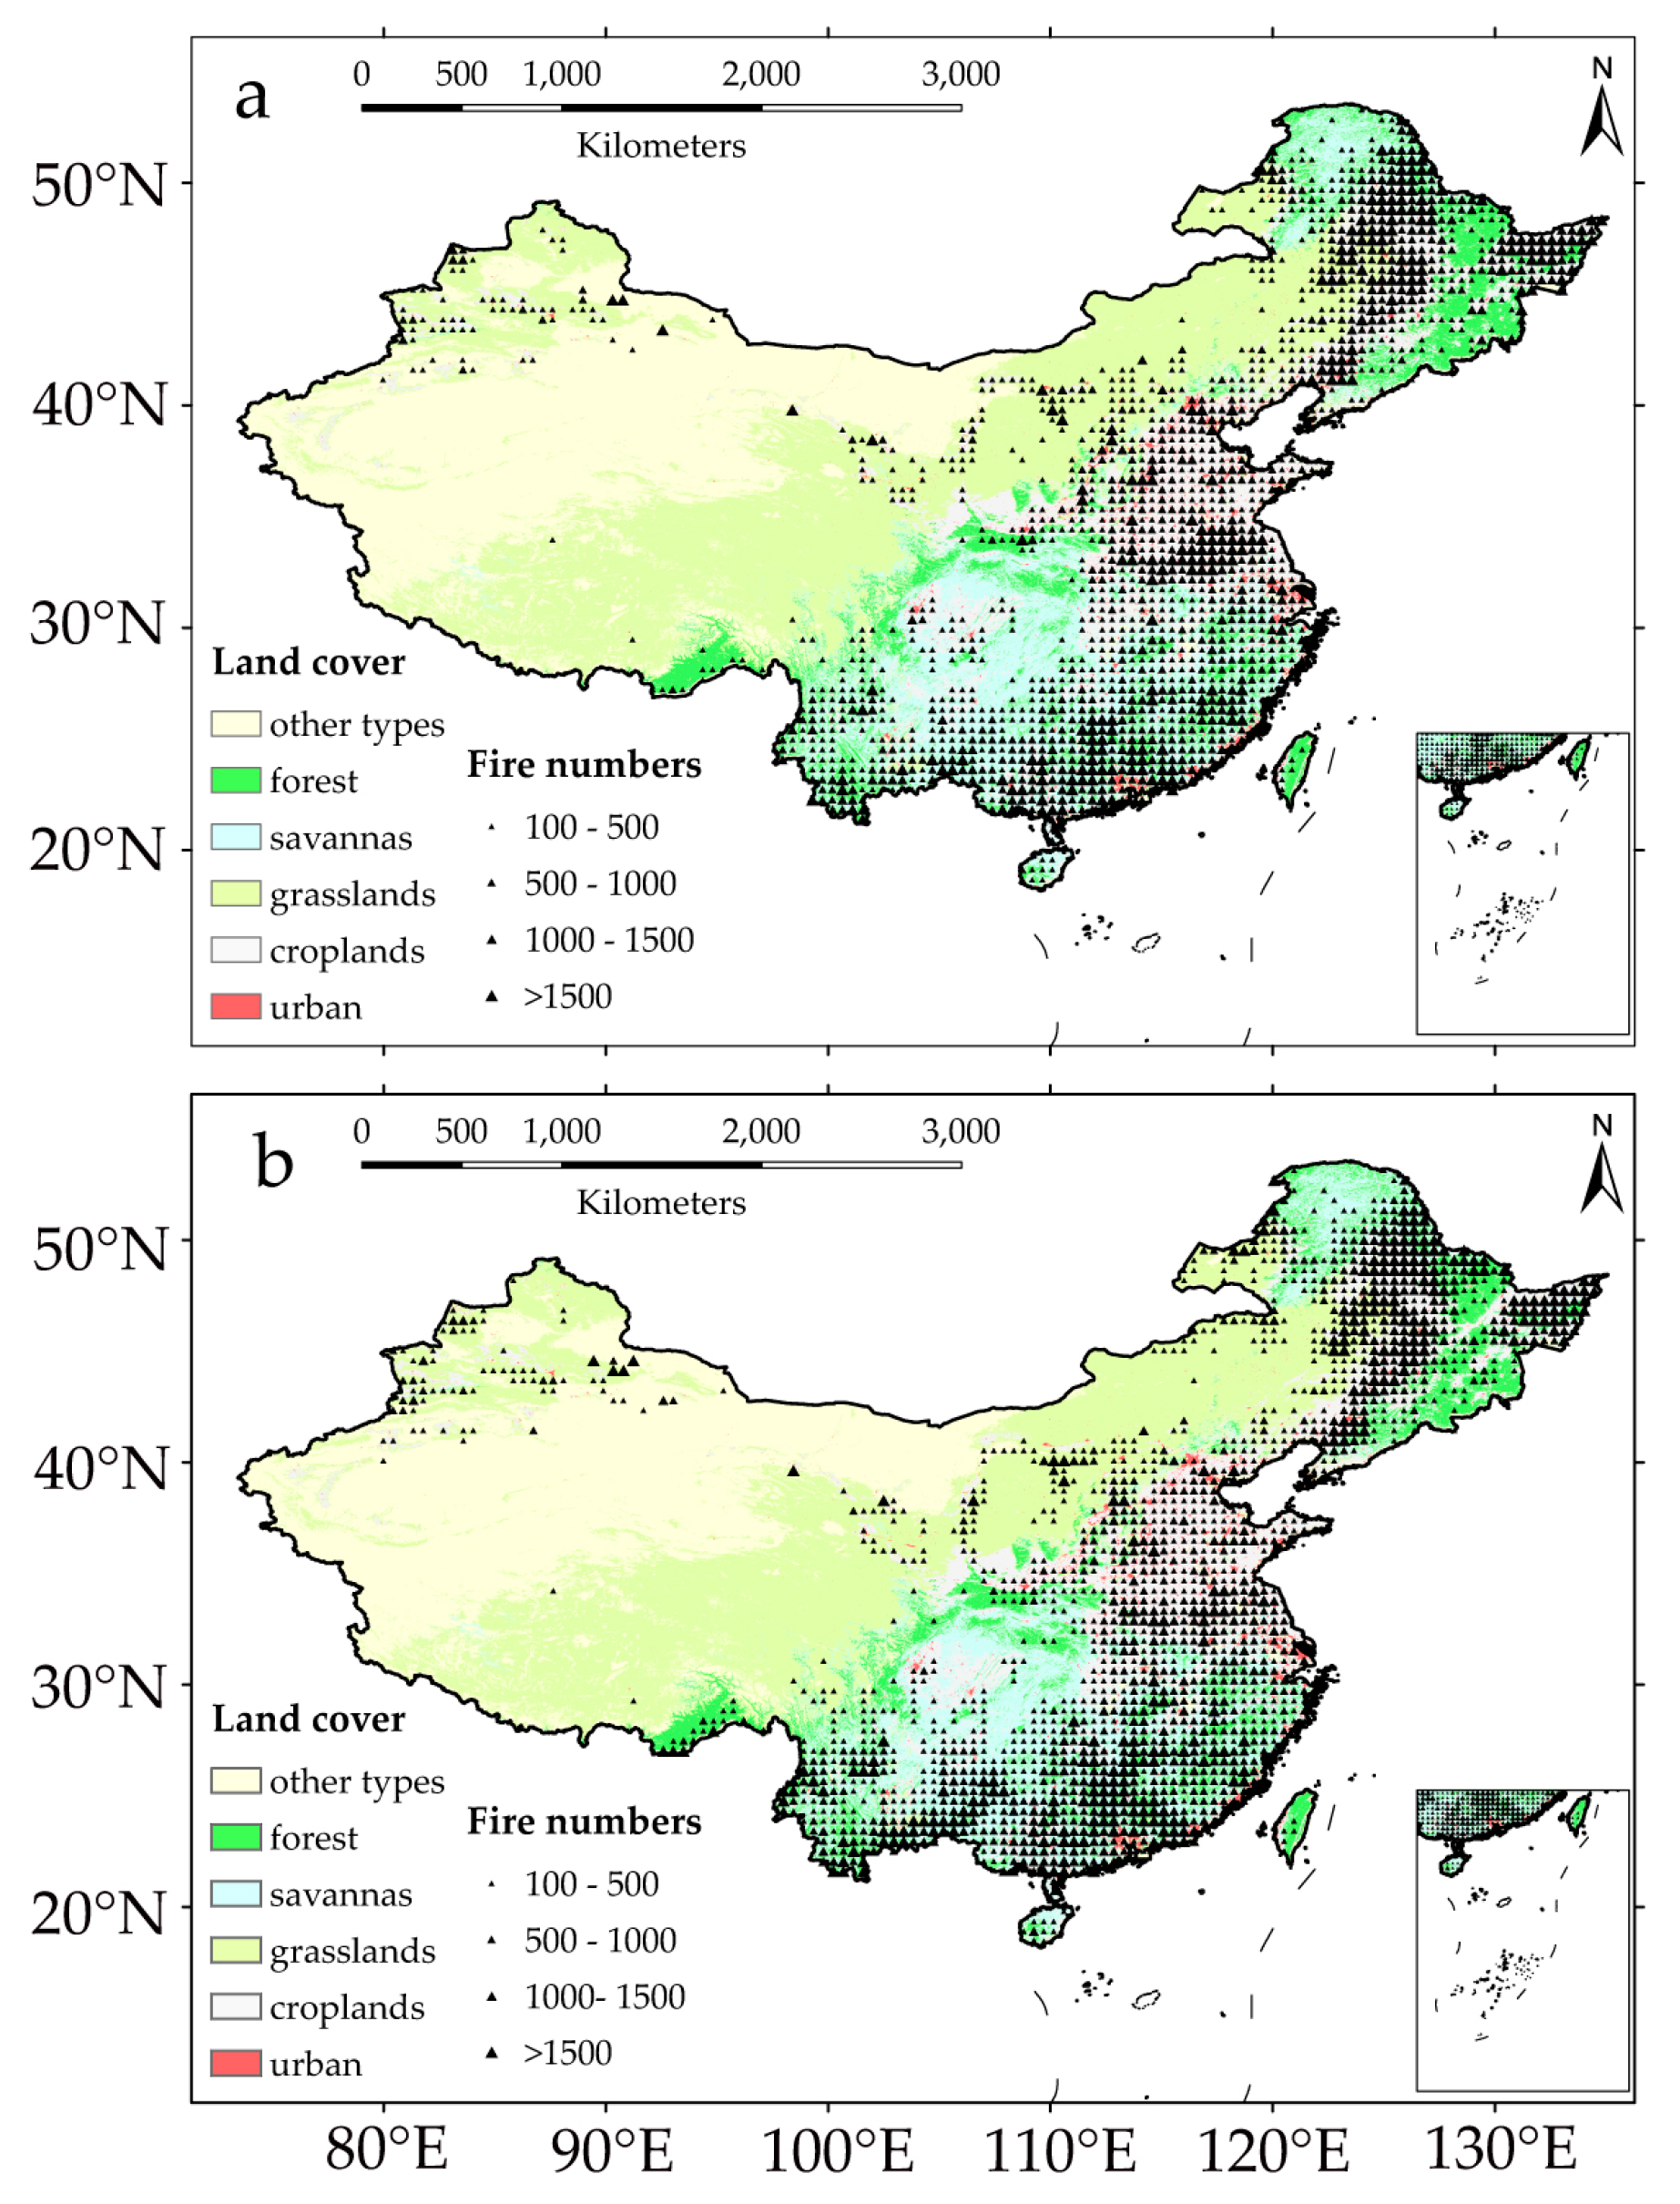
3.4. Spatial Patterns

Shown in Figure 9 are the spatial patterns of the accumulated fire numbers during 2003–2016 from theTerra and Aqua satellites. For a generalized knowledge, we calculate the sum of all fire numbers over each pixel, and then resample the derived data to the spatial resolution of 50 square kilometers. Therefore, the fire numbers in Figure 9 indicate the averaged values over 50 square kilometers; and the values less than 100 are not shown for a better display. In general, both Terra and Aqua products show quite similar spatial patterns. Clearly, most of the fires are scattered in the eastern regions of China. There are three hot regions of fires, including Northeast China, East China and South China. The land covers of Northeast China mainly consist of forests, croplands and grasslands; in the East China the land is mainly covered by croplands, and in the South China, they are mostly forests and savannas. In these regions, the land is more vegetated and there are plenty of dry biomass, especially in spring and autumn, prone to fires. In Northwest China and Tibetan Plateau, there is sparse vegetation and thus quite limited biomass for fires.
Figure 10 shows the long-term trends of annual fire numbers during 2003–2016 from Terra and Aqua products. In this picture, we resample the derived data to the spatial resolution of 50 km2 firstly for a better display, and the fire numbers are the sum of those from the 1-km2 resolution pixels. The trends are determined with the TS method, which are subjected to MK significance test at the 5% level. Both products appear to have quite similar spatial patterns of the long-term trends. Strongest increasing trends of fires appear in the central areas of Northeast China. Significant increasing trends also appear in most areas of East China, although less strong than those in Northwest China. Thus, more and more fires are observed in Northwest and East China over the past decades. However, there appears decreasing trends in South China where the land cover types mainly consist of forests and savannas, indicating less and less fires in the past decades. In Northwest China and Tibetan Plateau, there are quite few significant trends observed from both Terra and Aqua products. This country-wide spatial pattern appears much clearer in the Aqua than the Terra fire product.
Furthermore, the long-term trends are delineated into different seasons, which are shown in Figure 11. For better display, we resample the derived data to the spatial resolution of 50 square kilometers too, and the fire numbers are the sum of those from the 1-km resolution pixels. The derived spatial patterns of long-term fire trends are very similar from Terra and Aqua products. Obviously, the long-term fire trends appear to be quite different in different seasons. In spring, there are significant increasing trends in the central areas of Northeast China and East China where the vegetation is mostly croplands; there are some decreasing trends in South China, which however do not pass the significance test. In summer, significant increasing trends are observed in East China, including Shandong, Jiangsu and Anhui provinces; there are also some significant decreasing trends observed in the north part of Jiangsu province. In autumn, there are significant increasing trends in northeast and East China, and those in Northeast China are stronger; on the contrary, significant decreasing trends appear in South China, where the land cover types are mainly forest and savannas. These long-term trends appear more significant from Aqua than the Terra product. In winter, there are only decreasing trends observed in South China; similar as in autumn, the decreasing trends in winter are more significant from the Aqua than the Terra product.

4. Discussion

4.1. Spatio-Temporal Changes

Climate change has actually affected the wildfire risk all over the world [51,52]. Globally, it is reported that fire weather seasons have lengthened across 29.6 million km2 (25.3%) of the Earth’s vegetated surface, resulting in an 18.7% increase in global mean fire weather season length [53]. If climate keeps changing like this, the fire risk in the northern hemisphere will become three times greater than it is now at the end of this century [54]. The suitable weather conditions for surface fire (temperature, humidity, wind speed, and precipitation) and coincidences of high index values of atmospheric conditions (tropospheric instability and dryness) will increase in frequency in the future [55].
Study indicates that global burned area has experienced a human-driven decline in the past decades [56]. Similar as other studies, fires in China are found to be mostly located in Northeast, East, and South China, where there are the most densely populated regions in China [26,57]. In our study, we found that the total fire numbers over China have significantly increased during 2003–2016, based on the Terra and Aqua satellite products. It is indicated that fire numbers in croplands, grasslands, and urban areas have significant increasing trends. In croplands, the fire numbers show significant increasing trends in spring, summer and autumn, especially in the central area of Northeast China and East China, especially Shandong, Anhui and Jiangsu provinces where the land cover type is mostly croplands. Such an increase is suggested to have a link with the burning of crop residuals; with the rapid development of economy in such areas, there is no need to keep the crop residuals and they are often burned after harvesting the crops, leading to a sharp increase of burning fires in the past decades [25]. In recent years, strict policies have been imposed to prohibit burning the crop residuals in order to protect the atmospheric environment. However, the increased fires observed in this study have suggested that more administrative efforts are probably needed to reduce the fires in croplands.
The grasslands are mainly located in North China. There appears to be significant increasing trends in grasslands, especially in spring, summer and autumn seasons. In the warming climate, these areas experience more and more droughts due to reduced precipitation and increasing temperature, leading to, at least partly, increasing fires in grasslands. Furthermore, as grassland fires will not cause massive economic loss, limited efforts have been made to prevent the fires [24]. In urban areas, the increasing trends of fires are also significant. On one hand, the rapid urbanization in China may be one reason for it. During 1985–2010, urban areas increased more than 20% in China [58], and the proportion of the Chinese population living in urban areas increased from 17.9% to 52.6% between 1978 and 2012 [59]. On the other hand, an urban heat island (UHI) is more serious accompanying the rapid urbanization. This effect makes the urban temperature higher than the surrounding areas, which is more significant in summer than other seasons [59]. In addition, there are some extraordinary heat sources in urban, such as some factories [60]. Because the algorithm to detect active fire is a contextual algorithm according to the temperature difference of the fire site and surrounding areas [15], it is sensitive to such thermal anomalies in urban areas. The fire numbers may be highly related with the temperature, and the probability density functions show like bell curves within a year. However, the biomass burning in the forest shows significant decreasing trends in the Great Khingan Range and South China, especially in autumn and winter seasons, consistent with a global study of forest fires [23,61]. In recent decades, the international governments have paid great attention to the fire management of forests and savannas. In China, more efforts are made to reduce the forest fire risk, and the decrease in fire trends is likely due to the fire management. Fires in savannas are found to have quite similar temporal patterns as those in forests, especially in South China.

4.2. Limitations and Prospects

This study has analyzed the spatio-temporal changes of fires in China during 2003–2016 from both national and land cover perspectives; however, there are some known limitations. Firstly, the spatial resolutions of fire products from Terra and Aqua products is 1 km, which are relatively coarse for fire monitoring. Thus, some fires of smaller scales may not be found. Higher resolution satellite data should be applied for better results in the future. Secondly, the spatial resolution of the land cover product is 500 m, which cannot match with the fire products. In the downscaling process, resampling errors may occur and affect the accuracy of the result. A prototype downscaling algorithm designed for MODIS active fire data [62] can be taken into account in future research, which may improve the result. Thirdly, the urban fires observed by the satellite have some errors, which may be due to the extraordinary heat sources. More detailed statistical data should be added for a more precise analysis. Furthermore, our study showed an increased fire trend in summer (July-August) when there are the least fire events; this is interesting and deserves a detailed study in the future.
Apart from this, the cloud change may influence the fire detection. This relationship is worth studying to quantify how many uncertainties remain.
In addition, due to the vast territory of China, we only divide it into five categories of discussion. In future studies, higher resolution fire and land cover products from satellites should be taken into consideration. Fires are mainly influenced by both human activities and meteorological conditions. In the context of climate change, it is of interest to understand the effect of changing climate on wild fires, especially in forests, savannas and grasslands.

5. Conclusions

Our study used the fire products from the MODIS satellites to understand the spatio-temporal changes of fires during 2003–2016. Fires are mostly located in the eastern half of China, where it is the most developed and densely populated. In the national perspective, total fire numbers are found to increase significantly, especially in East and Northeast China. However, the long-term trends differ in different seasons. From spring to autumn, the long-term trends of total fire numbers are significantly positive, and in winter these trends are significantly negative. Results from both Terra and Aqua satellites appear to be well consistent.
When delineated into different land cover types, the fires show different seasonal variations and long-term trends. Generally speaking, the seasonal variations of fires in forests, grasslands, croplands and savannas are, at least partly, related with the amount of dry biomass, and thus they mostly have peak numbers in spring and autumn; however, the fires in urban areas are likely to follow a bell curve distribution. The long-term fire trends in different land cover types are dramatically different. In forests and savannas, there are significantly decreasing fire trends in the study period, especially in South China where it is densely vegetated in a hot and wet climate. In the grasslands, there are significant increasing trends, especially in North China. The fire numbers in croplands, mainly located in East China and the central areas of Northeast China, are significantly increasing in recent years, and the trends are much stronger in the Northeast China. The urban fires also show increasing trends, similar as in grassland and croplands.

Author Contributions

Conceptualization, X.W. and G.W.; methodology, X.W. and T.C.; software, X.W. and D.F.T.H.; validation, X.W., G.W. and T.C.; formal analysis, G.W. and W.U.; investigation, X.W.; resources, G.W.; data curation, X.W.; writing—original draft preparation, X.W.; writing—review and editing, G.W. and D.F.T.H.; visualization, X.W. and W.U.; supervision, G.W.; project administration, G.W.; funding acquisition, G.W. All authors have read and agreed to the published version of the manuscript.

Funding

This research was funded by National Social Science Foundation, grant number of 16ZDA047, the National Natural Science Foundation of China, grant number of 41875094 and the Postgraduate Research and Practice Innovation Program of Jiangsu Province, grant number of KYCX20_0958.

Acknowledgments

All authors are grateful to anonymous reviewers and editors for their constructive comments on earlier versions of the manuscript.

Conflicts of Interest

The authors declare no conflict of interest.

References

  1. Van Der Werf, G.R.; Randerson, J.T.; Giglio, L.; Collatz, G.J.; Mu, M.; Kasibhatla, P.S.; Morton, D.C.; Defries, R.S.; Jin, Y.; Van Leeuwen, T.T. Global fire emissions and the contribution of deforestation, savanna, forest, agricultural, and peat fires (1997–2009). Atmos. Chem. Phys. 2010, 10, 11707–11735. [Google Scholar] [CrossRef] [Green Version]
  2. Alkhatib, A.A. A review on forest fire detection techniques. Int. J. Distrib. Sens. Netw. 2014, 10, 597368. [Google Scholar] [CrossRef] [Green Version]
  3. Chen, Z.; Chen, D.; Zhuang, Y.; Cai, J.; Zhao, N.; He, B.; Gao, B.; Xu, B. Examining the influence of crop residue burning on local PM2.5 concentrations in Heilongjiang province using ground observation and remote sensing data. Remote Sens. 2017, 9, 971. [Google Scholar] [CrossRef] [Green Version]
  4. Mouillot, F.; Narasimha, A.; Balkanski, Y.; Lamarque, J.F.; Field, C.B. Global carbon emissions from biomass burning in the 20th century. Geophys. Res. Lett. 2006, 33, 1801–1805. [Google Scholar] [CrossRef] [Green Version]
  5. Song, Y.; Liu, B.; Miao, W.; Chang, D.; Zhang, Y. Spatiotemporal variation in nonagricultural open fire emissions in China from 2000 to 2007. Glob. Biogeochem. Cycles 2009, 23, 1–13. [Google Scholar] [CrossRef]
  6. Reisen, F.; Meyer, C.P.M.; Keywood, M.D. Impact of biomass burning sources on seasonal aerosol air quality. Atmos. Environ. 2013, 67, 437–447. [Google Scholar] [CrossRef]
  7. Field, R.D.; Van Der Werf, G.R.; Fanin, T.; Fetzer, E.J.; Fuller, R.; Jethva, H.; Levy, R.; Livesey, N.J.; Luo, M.; Torres, O.; et al. Indonesian fire activity and smoke pollution in 2015 show persistent nonlinear sensitivity to El Niño-induced drought. Proc. Natl. Acad. Sci. USA 2016, 113, 9204–9209. [Google Scholar] [CrossRef] [Green Version]
  8. Earl, N.; Simmonds, I. Spatial and temporal variability and trends in 2001–2016 global fire activity. J. Geophys. Res. Atmos. 2018, 123, 2524–2536. [Google Scholar] [CrossRef]
  9. Hu, H.-Q.; Wei, S.-J.; Sun, L. Estimation of carbon emissions due to forest fire in Daxing’an Mountains from 1965 to 2010. Chin. J. Plant. Ecol. 2013, 36, 629–644. [Google Scholar] [CrossRef]
  10. Mehmood, K.; Chang, S.; Yu, S.; Wang, L.; Li, P.; Li, Z.; Liu, W.; Rosenfeld, D.; Seinfeld, J.H. Spatial and temporal distributions of air pollutant emissions from open crop straw and biomass burnings in China from 2002 to 2016. Environ. Chem. Lett. 2018, 16, 301–309. [Google Scholar] [CrossRef]
  11. Chen, J.; Li, C.; Ristovski, Z.; Milic, A.; Gu, Y.; Islam, M.S.; Wang, S.; Hao, J.; Zhang, H.; He, C.; et al. A review of biomass burning: Emissions and impacts on air quality, health and climate in China. Sci. Total Environ. 2017, 579, 1000–1034. [Google Scholar] [CrossRef] [PubMed] [Green Version]
  12. Li, Y.; Zhao, J.; Guo, X.; Zhang, Z.; Tan, G.; Yang, J. The influence of land use on the grassland fire occurrence in the northeastern inner Mongolia Autonomous Region, China. Sensors 2017, 17, 437. [Google Scholar] [CrossRef] [PubMed] [Green Version]
  13. Prins, D.M.; Menzel, W.P. Geostationary satellite detection of biomass burning in South America. Int. J. Remote Sens. 1992, 13, 2783–2799. [Google Scholar] [CrossRef]
  14. Nakayama, M.; Maki, M.; Elvidge, C.D.; Liew, S.C. Contextual algorithm adapted for NOAA-AVHRR fire detection in Indonesia. Int. J. Remote Sens. 1999, 20, 3415–3421. [Google Scholar] [CrossRef]
  15. Giglio, L.; Descloitres, J.; Justice, C.O.; Kaufman, Y.J. An enhanced contextual fire detection algorithm for MODIS. Remote Sens. Environ. 2003, 87, 273–282. [Google Scholar] [CrossRef]
  16. Giglio, L.; Csiszar, I.; Restás, Á.; Morisette, J.T.; Schroeder, W.; Morton, D.; Justice, C.O. Active fire detection and characterization with the advanced spaceborne thermal emission and reflection radiometer (ASTER). Remote Sens. Environ. 2008, 112, 3055–3063. [Google Scholar] [CrossRef]
  17. Schroeder, W.; Oliva, P.; Giglio, L.; Quayle, B.; Lorenz, E.; Morelli, F. Active fire detection using Landsat-8/OLI data. Remote Sens. Environ. 2016, 185, 210–220. [Google Scholar] [CrossRef] [Green Version]
  18. Ardakani, A.S.; Valadan Zoej, M.J.; Mohammadzadeh, A.; Mansourian, A. Spatial and temporal analysis of fires detected by MODIS data in northern iran from 2001 to 2008. IEEE J. Sel. Top. Appl. Earth Obs. Remote Sens. 2011, 4, 216–225. [Google Scholar] [CrossRef]
  19. Palumbo, I.; Grégoire, J.; Simonetti, D.; Punga, M. Spatio-temporal distribution of fire activity in protected areas of Sub-Saharan Africa derived from MODIS data. Procedia Environ. Sci. 2011, 7, 26–31. [Google Scholar] [CrossRef]
  20. Molinario, G.; Davies, D.K.; Schroeder, W.; Justice, C.O. Characterizing the spatio-temporal fire regime in Ethiopia using the MODIS-active fire product: A replicable methodology for country-level fire reporting. Afr. Geogr. Rev. 2014, 33, 99–123. [Google Scholar] [CrossRef]
  21. Biology, G.C.; Systems, S. Global characterization of fire activity: Toward defining fire regimes from Earth observation data. Glob. Chang. Biol. 2008, 14, 1488–1502. [Google Scholar]
  22. Chen, D.; Pereira, J.M.C.; Masiero, A.; Pirotti, F. Mapping fire regimes in China using MODIS active fire and burned area data. Appl. Geogr. 2017, 85, 14–26. [Google Scholar] [CrossRef]
  23. Qin, X.L.; Li, Z.Y.; Zhang, Z.H. Spatial and temporal distribution pattern of fires in China using MODIS data. In Proceedings of the 2010 IEEE International Geoscience and Remote Sensing Symposium, Honolulu, HI, USA, 25–30 July 2010; pp. 331–334. [Google Scholar]
  24. Zhang, Z.; Feng, Z.; Zhang, H.; Zhao, J.; Yu, S.; Du, W. Spatial distribution of grassland fires at the regional scale based on the MODIS active fire products. Int. J. Wildl. Fire 2017, 26, 209–218. [Google Scholar] [CrossRef] [Green Version]
  25. Zhuang, Y.; Li, R.; Yang, H.; Chen, D.; Chen, Z.; Gao, B.; He, B. Understanding temporal and spatial distribution of crop residue burning in China from 2003 to 2017 using MODIS data. Remote Sens. 2018, 10, 390. [Google Scholar] [CrossRef] [Green Version]
  26. Yi, K.; Bao, Y.; Zhang, J. Spatial distribution and temporal variability of open fire in China. Int. J. Wildl. Fire 2017, 26, 122–135. [Google Scholar] [CrossRef] [Green Version]
  27. Shin, H.B. Urbanization in China. In International Encyclopedia of Social and Behavioral Sciences; Elsevier: Amsterdam, The Netherlands, 2015; pp. 973–979. [Google Scholar]
  28. Yuan, Q.; Wang, G.; Zhu, C.; Lou, D.; Hagan, D.F.T.; Ma, X.; Zhan, M. Coupling of soil moisture and air temperature from multiyear data during 1980–2013 over china. Atmosphere 2020, 11, 25. [Google Scholar] [CrossRef] [Green Version]
  29. Gao, X.; Shi, Y.; Song, R.; Giorgi, F.; Wang, Y.; Zhang, D. Reduction of future monsoon precipitation over China: Comparison between a high resolution RCM simulation and the driving GCM. Meteorol. Atmos. Phys. 2008, 100, 73–86. [Google Scholar] [CrossRef]
  30. Mao, F.; Tang, S.; Sun, H.; Zang, J. A study of dynamic change of dry and wet climate regions in the tibetan plateau over the last 46 years. Chin. J. Atmos. Sci. 2008, 32, 499–507. [Google Scholar]
  31. Cheng, G.; Jin, H. Pergélisol et eau de nappe sur le Plateau Qinghai-Tibet et dans le Nord-Est de la Chine. Hydrogeol. J. 2013, 21, 5–23. [Google Scholar] [CrossRef]
  32. Wang, Z.; Ding, Y. Climatic characteristics of rainy seasons in China. Chin. J. Atmos. Sci. 2008, 32, 1–13. [Google Scholar]
  33. Ke, H.; Gong, S.; He, J.; Zhou, C.; Zhang, L.; Zhou, Y. Spatial and temporal distribution of open bio-mass burning in China from 2013 to 2017. Atmos. Environ. 2019, 210, 156–165. [Google Scholar] [CrossRef]
  34. Justice, C.O.; Townshend JR, G.; Vermote, E.F.; Masuoka, E.; Wolfe, R.E.; Saleous, N.; Roy, D.P.; Morisette, J.T. An overview of MODIS Land data processing and product status. Remote Sens. Environ. 2002, 83, 3–15. [Google Scholar] [CrossRef]
  35. Pausas, J.G.; Ribeiro, E. The global fire-productivity relationship. Glob. Ecol. Biogeogr. 2013, 22, 728–736. [Google Scholar] [CrossRef]
  36. Giglio, L.; Schroeder, W.; Justice, C.O. The collection 6 MODIS active fire detection algorithm and fire products. Remote Sens. Envrion. 2016, 178, 31–41. [Google Scholar] [CrossRef] [PubMed] [Green Version]
  37. Earth Engine Data Catalog. Available online: https://developers.google.com/earth-engine/datasets/ (accessed on 30 March 2020).
  38. Mutanga, O.; Kumar, L. Google earth engine applications. Remote Sens. 2019, 11, 591. [Google Scholar] [CrossRef] [Green Version]
  39. Kumar, L.; Mutanga, O. Google Earth Engine applications since inception: Usage, trends, and potential. Remote Sens. 2018, 10, 1509. [Google Scholar] [CrossRef] [Green Version]
  40. Sulla-Menashe, D.; Friedl, M.A. User Guide to Collection 6 MODIS Land Cover (MCD12Q1 and MCD12C1) Product; USGS: Reston, VA, USA, 2018. [Google Scholar]
  41. Sulla-Menashe, D.; Gray, J.M.; Abercrombie, S.P.; Friedl, M.A. Hierarchical mapping of annual global land cover 2001 to present: The MODIS Collection 6 Land Cover product. Remote Sens. Environ. 2019, 222, 183–194. [Google Scholar] [CrossRef]
  42. Ten Hoeve, J.E.; Remer, L.A.; Correia, A.L.; Jacobson, M.Z. Recent shift from forest to savanna burning in the Amazon Basin observed by satellite. Environ. Res. Lett. 2012, 7, 024020. [Google Scholar] [CrossRef]
  43. Resampling and Reducing Resolution. Available online: https://developers.google.com/earth-engine/resample#pixel-weights-for-reduceresolution (accessed on 30 March 2020).
  44. Hyer, E.J.; Reid, J.S. Baseline uncertainties in biomass burning emission models resulting from spatial error in satellite active fire location data. Geophys. Res. Lett. 2009, 36, 3–7. [Google Scholar] [CrossRef]
  45. Theil, H. A Rank polynomial- and linear-invariant method of regression analysis. Indag. Math. 1950, 1, 386–392. [Google Scholar]
  46. Sen, P.K. Estimates of the regression coefficient based on kendall’s tau. J. Am. Stat. Assoc. 1968, 63, 1379–1389. [Google Scholar] [CrossRef]
  47. Lu, J.; Wang, G.; Gong, T.; Hagan, D.F.T.; Wang, Y.; Jiang, T.; Su, B. Changes of actual evapotranspiration and its components in the Yangtze River valley during 1980–2014 from satellite assimilation product. Appl. Clim. 2019, 138, 1493–1510. [Google Scholar] [CrossRef]
  48. Silva, J.M.N.; Moreno, M.V.; Le Page, Y.; Oom, D.; Bistinas, I.; Pereira, J.M.C. Spatiotemporal trends of area burnt in the Iberian Peninsula, 1975–2013. Reg. Envrion. Chang. 2019, 19, 515–527. [Google Scholar] [CrossRef]
  49. Xu, Z.X.; Takeuchi, K.; Ishidaira, H. Monotonic trend and step changes in Japanese precipitation. J. Hydrol. 2003, 279, 144–150. [Google Scholar] [CrossRef]
  50. Giglio, L. Characterization of the tropical diurnal fire cycle using VIRS and MODIS observations. Remote Sens. Envrion. 2007, 108, 407–421. [Google Scholar] [CrossRef]
  51. Duane, A.; Brotons, L. Synoptic weather conditions and changing fire regimes in a Mediterranean environment. Agric. Meteorol. 2018, 253–254, 190–202. [Google Scholar] [CrossRef]
  52. Kirchmeier-Young, M.C.; Zwiers, F.W.; Gillett, N.P.; Cannon, A.J. Attributing extreme fire risk in Western Canada to human emissions. Clim. Chang. 2017, 144, 365–379. [Google Scholar] [CrossRef] [Green Version]
  53. Jolly, W.M.; Cochrane, M.A.; Freeborn, P.H.; Holden, Z.A.; Brown, T.J.; Williamson, G.J.; Bowman, D.M.J.S. Climate-induced variations in global wildfire danger from 1979 to 2013. Nat. Commun. 2015, 6, 1–11. [Google Scholar] [CrossRef]
  54. Flannigan, M.; Cantin, A.S.; De Groot, W.J.; Wotton, M.; Newbery, A.; Gowman, L.M. Forest Ecology and Management Global wildland fire season severity in the 21st century. For. Ecol. Manag. 2013, 294, 54–61. [Google Scholar] [CrossRef]
  55. Di Virgilio, G.; Evans, J.P.; Blake, S.A.P.; Armstrong, M.; Dowdy, A.J.; Sharples, J.; McRae, R. Climate change increases the potential for extreme wildfires. Geophys. Res. Lett. 2019, 46, 8517–8526. [Google Scholar] [CrossRef]
  56. Andela, N.; Morton, D.C.; Giglio, L.; Chen, Y.; Van Der Werf, G.R.; Kasibhatla, P.S.; DeFries, R.S.; Collatz, G.J.; Hantson, S.; Kloster, S.; et al. A human-driven decline in global burned area. Science 2017, 356, 1356–1362. [Google Scholar] [CrossRef] [PubMed] [Green Version]
  57. Li, L.; Clarke, K.C. Cartograms showing China’s population and wealth distribution. J. Maps 2012, 8, 320–323. [Google Scholar] [CrossRef] [Green Version]
  58. Liu, M.; Tian, H. China’s land cover and land use change from 1700 to 2005: Estimations from high-resolution satellite data and historical archives. Glob. Biogeochem. Cycles 2010, 24, 3003–3021. [Google Scholar] [CrossRef]
  59. Peng, J.; Xie, P.; Liu, Y.; Ma, J. Urban thermal environment dynamics and associated landscape pattern factors: A case study in the Beijing metropolitan region. Remote Sens. Envrion. 2016, 173, 145–155. [Google Scholar] [CrossRef]
  60. Zhang, L.; Meng, Q.; Sun, Z.; Sun, Y. Spatial and temporal analysis of the mitigating effects of industrial relocation on the surface urban heat island over china. ISPRS Int. J. Geo Inf. 2017, 6, 121. [Google Scholar] [CrossRef] [Green Version]
  61. van Lierop, P.; Lindquist, E.; Sathyapala, S.; Franceschini, G. Global forest area disturbance from fire, insect pests, diseases and severe weather events. For. Ecol. Manag. 2015, 352, 78–88. [Google Scholar] [CrossRef] [Green Version]
  62. Kumar, S.S.; Picotte, J.J.; Peterson, B. Prototype downscaling algorithm for MODIS satellite 1 km daytime active fire detections. Fire 2019, 2, 29. [Google Scholar] [CrossRef] [Green Version]
Figure 1. The MCD12Q1 land cover types in China.
Remotesensing 12 01787 g001
Figure 2. The annual number of fire points from Terra and Aqua satellites in China from 2003 to 2016.
Remotesensing 12 01787 g002
Figure 3. The annual fire numbers during 2003–2016 in different land cover types of (a) forests, (b) croplands, (c) grasslands, (d) savannas, and (e) urban areas across China.
Remotesensing 12 01787 g003
Figure 4. The annual fire numbers during 2003–2016 in different forest types of (a) broadleaf forests, (b) needleleaf forests, (c) mixed forests across China.
Remotesensing 12 01787 g004
Figure 5. The annual changes of fire numbers in different seasons of (a) spring, (b) summer, (c) autumn and (d) winter, across China during 2003–2016.
Remotesensing 12 01787 g005
Figure 6. The annual changes of fire numbers in different land covers of (a) forests, (b) croplands, (c) grasslands, (d) savannas, and (e) urban areas across China in different seasons during 2003–2016.
Remotesensing 12 01787 g006
Figure 7. The monthly fire numbers from (a) Terra and (b) Aqua products, across China during 2003–2016. The value 14a-avg represents the average fire numbers in different months in our study period.
Remotesensing 12 01787 g007
Figure 8. The seasonality of fires across China during 2003–2016 in different land cover types of (a) forests, (b) croplands, (c) grasslands, (d) savannas, and (e) urban areas from the Terra and the Aqua satellites. The value 14a-avg represents the average fire numbers in different months in our study period.
Remotesensing 12 01787 g008
Figure 9. The spatial patterns of accumulated fire numbers during 2003–2016 from (a) Terra and (b) Aqua satellites. The fire numbers are the sum of 1-km2 fire within the resampled 2500 km2 area.
Remotesensing 12 01787 g009
Figure 10. The long-term trends of annual fire numbers during 2003–2016 from (a) Terra and (b) Aqua products. The “+” sign indicates the trend has passed the significance test at the 5% level. The fire numbers are the sum of 1-km2 fire within the resampled 2500 km2 area; the unit is fire numbers/year.
Remotesensing 12 01787 g010
Figure 11. The long-term trends of annual fire numbers in different seasons of (a) spring, (b) summer, (c) autumn and (d) winter during 2003–2016 from (a) Terra and (b) Aqua products respectively. The “+” sign indicates the trend has passed the significance test at the 5% level. The left column is for the Terra product and the right column is for the Aqua product. The fire numbers are the sum of 1-km2 fire within the resampled 2500 km2 area; the unit is fire numbers/year.
Remotesensing 12 01787 g011
Table 1. MCD12Q1 International Geosphere-Biosphere Programme (IGBP) legend.
NameValueNameValue
Evergreen Needleleaf Forests1Grasslands10
Evergreen Broadleaf Forests2Permanent Wetlands11
Deciduous Needleleaf Forests3Croplands12
Deciduous Broadleaf Forests4Urban and Built-up Lands13
Mixed Forests5Croplands/Vegetation Mosaics14
Closed Shrublands6Permanent Snow and Ice15
Open Shrublands7Barren16
Woody Savannas8Water Bodies17
Savannas9Unclassified255
Table 2. The percentages of fire numbers in different land covers.
ForestsCroplandsGrasslandsSavannasUrbanOther Types
Terra14.7%32.8%8.6%34.3%8.2%1.6%
Aqua16.6%29.9%7.6%40.1%5.2%1.2%

