Article

Remote Crop Mapping at Scale: Using Satellite Imagery and UAV-Acquired Data as Ground Truth

1
RTI International, Research Triangle Park, NC 27709, USA
2
Independent Agri-Consultant, Kigali 20093, Rwanda
*
Author to whom correspondence should be addressed.
Remote Sens. 2020, 12(12), 1984; https://doi.org/10.3390/rs12121984
Submission received: 22 April 2020 / Revised: 10 June 2020 / Accepted: 19 June 2020 / Published: 20 June 2020
(This article belongs to the Special Issue Remote Sensing for Agriculture in the Developing World)

Abstract

:
Timely and accurate agricultural information is needed to inform resource allocation and sustainable practices to improve food security in the developing world. Obtaining this information through traditional surveys is time consuming and labor intensive, making it difficult to collect data at the frequency and resolution needed to accurately estimate the planted areas of key crops and their distribution during the growing season. Remote sensing technologies can be leveraged to provide consistent, cost-effective, and spatially disaggregated data at high temporal frequency. In this study, we used imagery acquired from unmanned aerial vehicles to create a high-fidelity ground-truth dataset that included examples of large mono-cropped fields, small intercropped fields, and natural vegetation. The imagery was acquired in three rounds of flights at six sites in different agro-ecological zones to capture growing conditions. This dataset was used to train and test a random forest model that was implemented in Google Earth Engine for classifying cropped land using freely available Sentinel-1 and -2 data. This model achieved an overall accuracy of 83%, and a 91% accuracy for maize specifically. The model results were compared with Rwanda’s Seasonal Agricultural Survey, which highlighted biases in the dataset including a lack of examples of mixed land cover.

Graphical Abstract

1. Introduction

Up-to-date agricultural information is needed for planning and forecasting to identify areas at risk of food insecurity and better inform resource allocation and sustainability efforts in developing countries. The Food and Agriculture Organization (FAO) of the United Nations in its “Global Strategy to Improve Agricultural and Rural Statistics, Phase 2, 2020–2025” identified remote sensing as an important component of its research agenda, calling for new data and methodologies to enable high-accuracy, high-refresh crop mapping, and crop yield estimation [1,2,3]. While the potential of satellite-based remote sensing to provide information on agricultural production has been recognized since the mid-1970s [4,5], data at a sufficient resolution and revisit frequency for accurately mapping smallholder agricultural systems have only recently been made freely available with the launch of the Sentinel satellites.
Crop maps can be generated by applying supervised machine learning (ML) models to satellite data. Immitzer et al. classified seven crop types (six summer and one winter/bare soil) in Austria using Sentinel-2 images acquired on a single date using pixel-based (overall accuracy: 83%) and object-based (overall accuracy: 77%) approaches [6]. Confusion between crop types was attributed to the sub-optimal timing of the Sentinel-2 image used [6]. Building on this work, Vuolo et al. used a pixel-based approach for classifying nine crop types over a two-year time frame using data from multiple versus single dates [7]. They found that using multi-temporal information improved overall accuracy (91–95%), and the highest single-date classification accuracies occurred when the summer crops reached the peak of their development and winter crops were harvested [6,7]. While these results are promising, analysis of smallholder farms remains a challenge. Higher resolution imagery can be used to accurately predict maize yields in smallholder agricultural systems [8,9], but these data are not freely available. Using a hybrid approach, Lebourgeois et al. used an object-based approach to segment smallholder agricultural systems in Madagascar into crop versus non-crop classes (using high-resolution Pleiades imagery) before further classifying individual crops (using Landsat 8 and SPOT-5 imagery) [10]. Clevers et al. also showed that several vegetation indices (i.e., leaf area index, leaf chlorophyll content, and canopy chlorophyll content) could be derived from the Sentinel-2 bands available at a 10m spatial resolution, which has important implications for smallholder agriculture [11].
Relying on multispectral information alone is challenging in areas with significant cloud cover as data from multiple dates may not be available and the most suitable imagery may correspond to sub-optimal crop separation conditions (especially for rainfed crops). Synthetic aperture radar (SAR) data are not affected by cloud cover, and backscatter in the VV and VH polarizations correlates with the normalized difference vegetation index (NDVI) [12] and is sensitive to changes in soil surface conditions (i.e., fallow, preparation for planting, and active growth) as well as plant phenology [13]. Using multi-temporal SAR models, Xu et al. were able to identify summer corn, rice, soybean, and peanut fields at two sites in China with overall accuracies exceeding 90% [14]. With respect to smallholder agriculture, models using SAR data only show higher accuracies for parcels >2 ha [15], which may limit their utility in the developing world where fields are often <1 ha.
Multispectral and SAR data can be combined into a single model to take advantage of the strengths offered by each data source. Sonobe et al. classified six crop types at the parcel level using Sentinel-1 and -2 imagery [16]. They tested four ML algorithms and achieved the highest accuracy (96.8%) using the kernel extreme learning machine (KELM) [16]. Kussul et al. tested several pixel- and object-based approaches for identifying a variety of landcover and crop types using Sentinel-1 and Landsat-8 data [13]. They achieved the highest accuracy when assigning parcels based on the dominate pixel class and demonstrated that accuracies exceeding 90% should be achievable for large parcels. Identifying individual parcels is difficult and time-consuming in smallholder agricultural systems, which may limit the utility of these approaches. However, techniques for combining multispectral and SAR data into a single model are still relevant for identifying cropland, and specifically maize, in Kenya and Tanzania where smallholder agriculture is predominantly practiced and cloud cover interferes with the regular availability of Sentinel-2 imagery [17].
A key aspect in developing well-performing ML models is the quality of ground-truth data [2]. Continental- or regional-scale cropland data maps can be used to generate a large amount of ground-truth data quickly, but these types of maps cannot be rendered with a high degree of accuracy for the developing world because of sparse and/or missing data [18]. Sites managed by the Joint Experiment for Crop Assessment and Monitoring (JECAM) [19] can be valuable sources of data for studies conducted in nearby areas [10,12,13] as these sites are rigorously monitored for the purposes of generating time series datasets. For smallholder agricultural systems, information is traditionally obtained by observers on the ground [6,7,8,9,14,16,17,18]. Aside from practical limitations such as the challenge of surveying hilly or remote areas with limited road systems, this practice is time consuming, is labor intensive, and does not lend itself to easy standardization and automation.
In recent years, unmanned aerial vehicles (UAVs) have become widely available and inexpensive, and companies providing UAV services are now present in many developing countries. UAVs can acquire high-resolution georeferenced images of large areas quickly and at low cost [20,21]. For example, in this study, images of an area of 80 ha with a minimum ground resolution of 10 cm were acquired in 2 to 3 h. UAV imagery can be georeferenced with high accuracy, reliably registering locations of even the smallest fields in the satellite grid. The aerial view gives the analyst the ability to accurately label intercropped fields, a task that is especially difficult for surveyors on the ground [22]. Although UAV-acquired images have previously been employed to gain information about agricultural production on a local scale [23,24,25,26,27,28], their use as a source of ground-truth data for satellite-based crop analytics has not yet been widely investigated [29].
Building on the strengths of UAVs for capturing on-demand, accurate agricultural information, the objective of this study was to determine the best practices for using UAV-based ground-truth data to create regional-scale cropland data maps for smallholder agricultural systems. To be cost-effective for use in the developing world, cropland data maps must be easy to maintain and update as new information becomes available. To this end, a second objective of this work was to implement all necessary models in open source platforms using freely available satellite data. In order to test the feasibility of this approach, we conducted a pilot study in Rwanda during 2019 Season A (September 2018–February 2019). Given the significant cloud cover during the growing season, we chose to focus the training, testing, and implementation of the model on relatively cloud-free Sentinel-2 (S2) images recorded in January 2019 when many crops reached their maturity [30] and tended to exhibit the most pronounced differences in their spectral signatures. We tested the model on a subset of the ground-truth dataset that was not used for training. We compared the areas under specific crops with the areas reported by the agricultural survey for 2019 Season A, obtaining agreement for maize and beans to within 10% on a country scale.

2. Materials and Methods

2.1. Study Site

This pilot study was conducted in Rwanda (Figure 1), a small country (approximately 25,300 km2 [30]) located in sub-Saharan Africa. Rwanda is characterized by a temperate tropical highland climate, with annual precipitation ranging between 1000 and 1400 mm, depending on the region, and daily temperatures ranging from 15 to 27 °C.
Approximately 75% of the total land area in Rwanda is devoted to agriculture [30], which represents 24% of Rwanda’s gross domestic product [31]. Fields in Rwanda are small (often <1 ha) and intercropped, although larger mono-cropped fields (consolidated land use areas) do exist. The crop calendar reflects two main seasons: Season A extends from September through February, and Season B extends from March through June [30]. The starts and ends of the agricultural seasons depend on the type of crop, the region of the country, and the onset of rain. The major crops grown in Rwanda are maize (16%), beans (23%), bananas (19%), and roots and tubers such as cassava (15%), potatoes (4%), and sweet potatoes (7%) [30].

2.2. Ground-Truth Data

For the ground-truth dataset, we collected high-resolution imagery (minimum ground resolution of 10 cm) in a series of UAV flights that were conducted at six locations in different agro-ecological zones (AEZs) [32,33] (Figure 1). AEZs in Rwanda are mainly divided along the lines of elevation (higher elevation in the west and north and lower elevation toward the east), rainfall (higher in the west and lower in the east), and temperature (higher in the east and lower in the west) [33]. Sites within these AEZs were selected based on accessibility and the presence of (1) consolidated land use areas where field sizes are larger and generally only a single crop is grown; (2) smaller, intercropped fields that represent the dominant practice of smallholder agriculture; and (3) natural areas. Flights covered approximately 80 ha in each location and were conducted on three dates during the peak of the 2019 Season A growing season. This information is summarized in Table 1.
The UAV flights were conducted by Charis Unmanned Aerial Solutions (Kigali, Rwanda). The RGB (red, green, blue) camera and UAV selections were based on the site requirements on the day of the flight. The DJI Zenmuse X5S (DJI, Shenzhen, China) camera was used with the DJI Inspire (DJI, Shenzhen, China) drone in all of the round #2 and round #3 flights and one round #1 flight. The senseFly S.O.D.A. (senseFly SA, Cheseaux-sur-Lausanne, Switzerland) camera was used with the Ebee plus (senseFly SA, Cheseaux-sur-Lausanne, Switzerland) drone in three round #1 flights. The SONY ILCE-6000 (SONY, New York, NY, USA) camera was used with the Parrot Disco (Parrot, Paris, France) drone in one round #1 flight. Georeferencing was accomplished using either a Continuously Operating Reference Station (CORS) with real time kinematic (RTK)-based correction or ground control points.
The orthomosiac images for each UAV flight were created using the Pix4D (Version 4.2) software package. For labeling, the orthomosaic RGB images from each flight (nominal resolution of 3 to 10 cm) were imported into a custom viewer that used ESRI’s ArcGIS API for JavaScript and ArcGIS Enterprise (ESRI, Redlands, CA, USA). The viewer was designed to support multiple users simultaneously, tracking the user and date of entry. The 10 × 10-m Sentinel pixel grid was overlaid on the UAV images in the viewer. To avoid labeling locations corresponding to S2 pixels covered by clouds in the images of interest, we created a shapefile representing these clouded pixels and applied it to mask the clouded locations in the viewer. Grid cells were labeled according to the dominant landcover (i.e., at least 75% of the cell was the same class), and cells were not labeled in clouded areas. For this pilot study, we limited the number of classes to four strategic crops (accounting for approximately 73% of the total cropped area in Season A), a “catch-all” class for other crops and grasslands, a class for trees and woodlands, and a catch-all class for non-vegetative land covers. The classes are as follows:
  • Maize;
  • Beans (bush beans and climbing beans);
  • Cassava;
  • Bananas (all varieties);
  • Other vegetation (OtherVeg) representing grassland and crops not in class 1 through 4;
  • Trees representing small tree stands, forest, and woodlands;
  • Non-vegetative (NonVeg) land cover representing bare ground, buildings, structures, and roads.
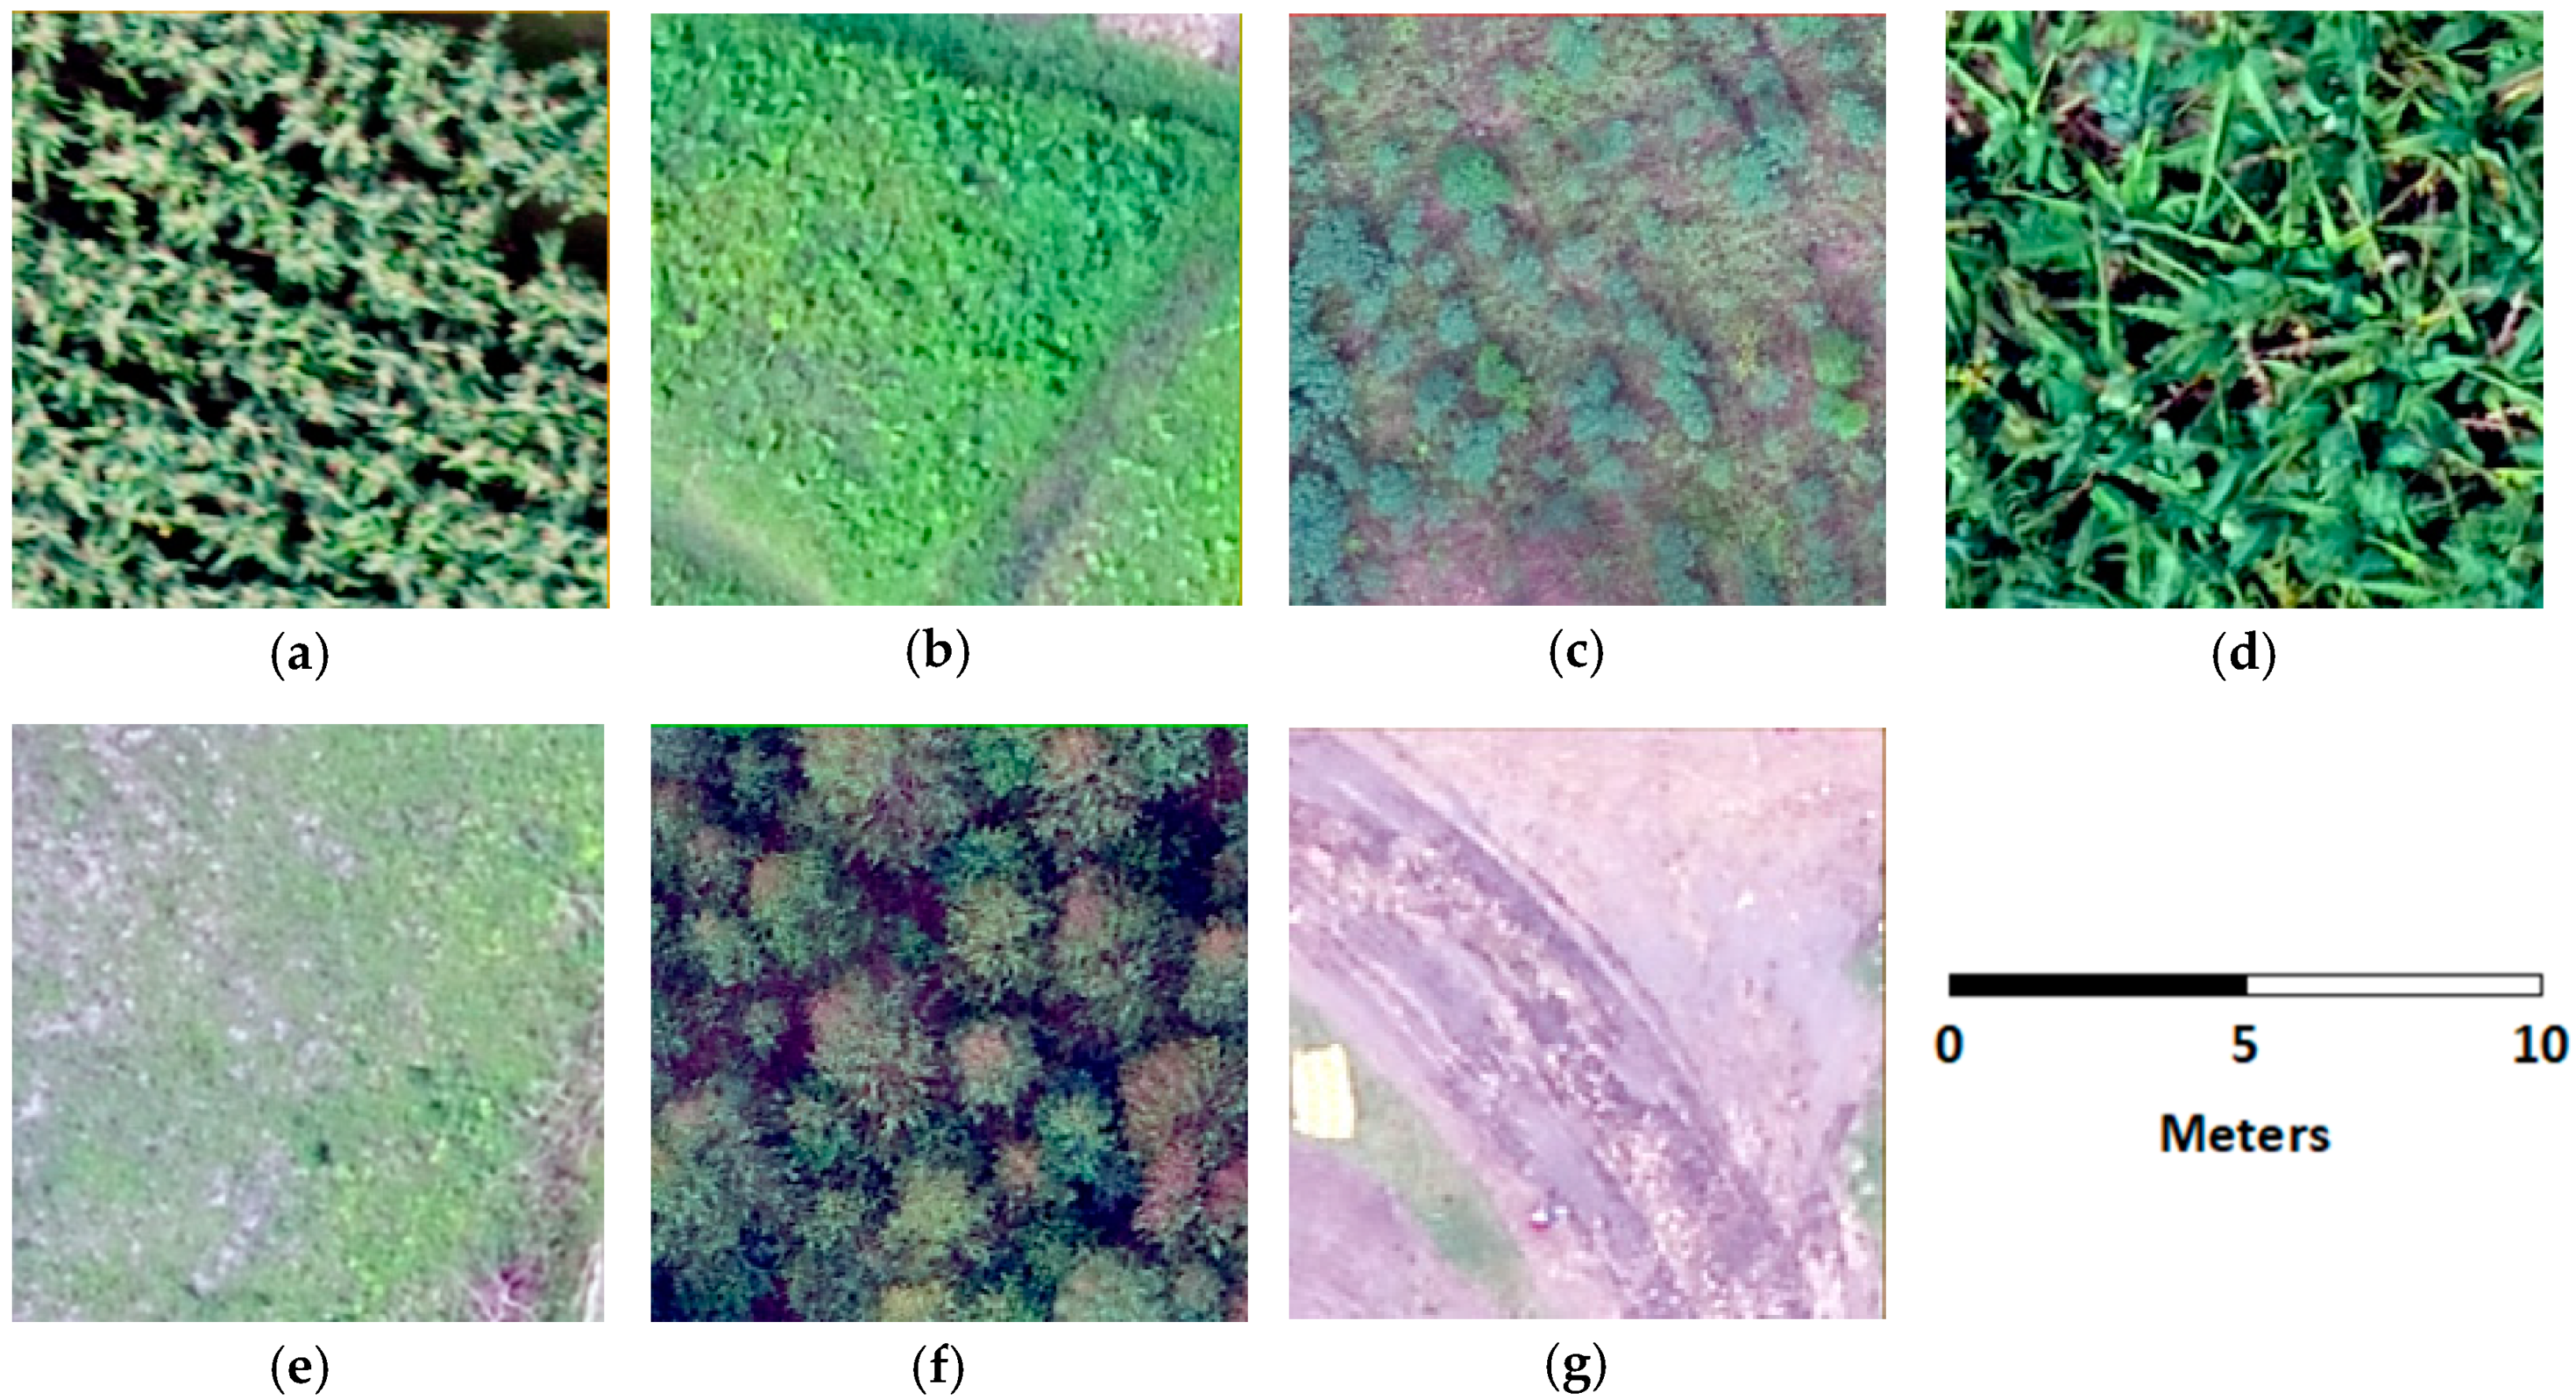
Figure 2 shows examples of labeled sections of UAV images for each of the selected classes. Each example corresponds to an area of 10 × 10 m on the ground. The number of ground-truth examples for each of the six UAV flight sites is detailed in Table 2. Emphasis was placed on labeling points from the Kaberege, Kinyaga, Kabarama, and Cyampirita sites for which cloud-free satellite images were available during the peak of the growing season; the Ngarama and Rwakigarati sites were heavily clouded then. Within the cloud-free sites, we tried to balance the number of labeled examples. In total, we created 1251 labeled data points. These data points were originally labeled by researchers who were trained by Mr. Noel Ujeneza who is a Rwandan agricultural expert and a co-author of this study. Mr. Ujeneza also accompanied the UAV operators to the test sites on several occasions and reviewed the labeled cells for accuracy. Furthermore, we cross-referenced the labeled cells between the December and January flight dates to ensure that the ground cover designation was consistent (note: in the February flights, it was apparent that harvest had already occurred in many areas, and we did not rely on these data for labeling). Cells not meeting this criterion were eliminated. Cells were also denoted as good, average, or poor examples of ground cover as related to the health of the vegetation, and cells labeled as poor were eliminated.

2.3. Satellite Data Processing

We used optical images from the S2 satellite and SAR images from the S1 satellite. S2 optical images represent the reflectance of light from the Earth’s surface as a function of the wavelength of the light. For crops, this spectral reflectance is determined by the plant’s biophysical and biochemical properties, such as the leaf area, biomass, chlorophyll content, water content, and canopy structure, as well as external factors such as background soil [35]. The S2 optical image processing was carried out in Google Earth Engine (GEE) [36]. For Rwanda, going back to December 2018, GEE provides access to S2 images that are corrected to represent signal values at the bottom of the atmosphere. Values of reflectance in the four bands B2 (490 nm), B3 (560 nm), B4 (665 nm), and B8 (842 nm) [29] were extracted from the identified imagery after cloud masking was applied using a built-in GEE algorithm and visually verifying the masked results. The S2 multispectral instrument (MSI) offers 10-m ground resolution in these four selected bands [29].
S1 SAR image processing was also carried out in GEE. SAR images represent the reflectance of electromagnetic radiation in the microwave range and are therefore not affected by cloud cover. For crops, this reflectance is primarily a function of the canopy architecture such as the size, shape, and orientation of the canopy components; the dielectric properties of the crop canopy; and the cropping characteristics such as plant density and row direction [37]. GEE provides access to S1 images that are preprocessed with thermal noise removal, radiometric calibration, and terrain correction. For this analysis, we selected images acquired using the interferometric wide (IW) swath mode and the vertical transmit/vertical receive (VV) polarization. The S1 SAR instrument offers a 10-m ground resolution in this band [38].

2.4. Cropped Land Modeling

Of the several ML algorithms that are available on the GEE platform [39], we elected to use the random forest (RF) model. RF is an ensemble learning method that uses the most common output of a large number of independent decision trees as its prediction. RF models have been widely used in interpreting remote sensing images because they produce accurate results, are computationally efficient, and can handle high data dimensionality without overfitting [40]. The model was parameterized using training data consisting of four S2 features and three S1 features for each of the labeled pixels. The S2 imagery from December 2018 through February 2019 was evaluated for cloud cover, and two images from late January were identified based on minimal cloud cover for the entire country (Table 3). The four S2 features were signal values in B2, B3, B4, and B8, extracted from a composite S2 image that was generated by filling in clouded pixels in the 2019-01-28 scene with unclouded pixels from the 2019-01-23 scene when available. The three S1 features were median VV values for the months of November 2018, December 2018, and January 2019. The training/testing datasets were generated from the ground-truth data using an 80/20 split.

3. Results

3.1. Discrimination of Labeled Categories

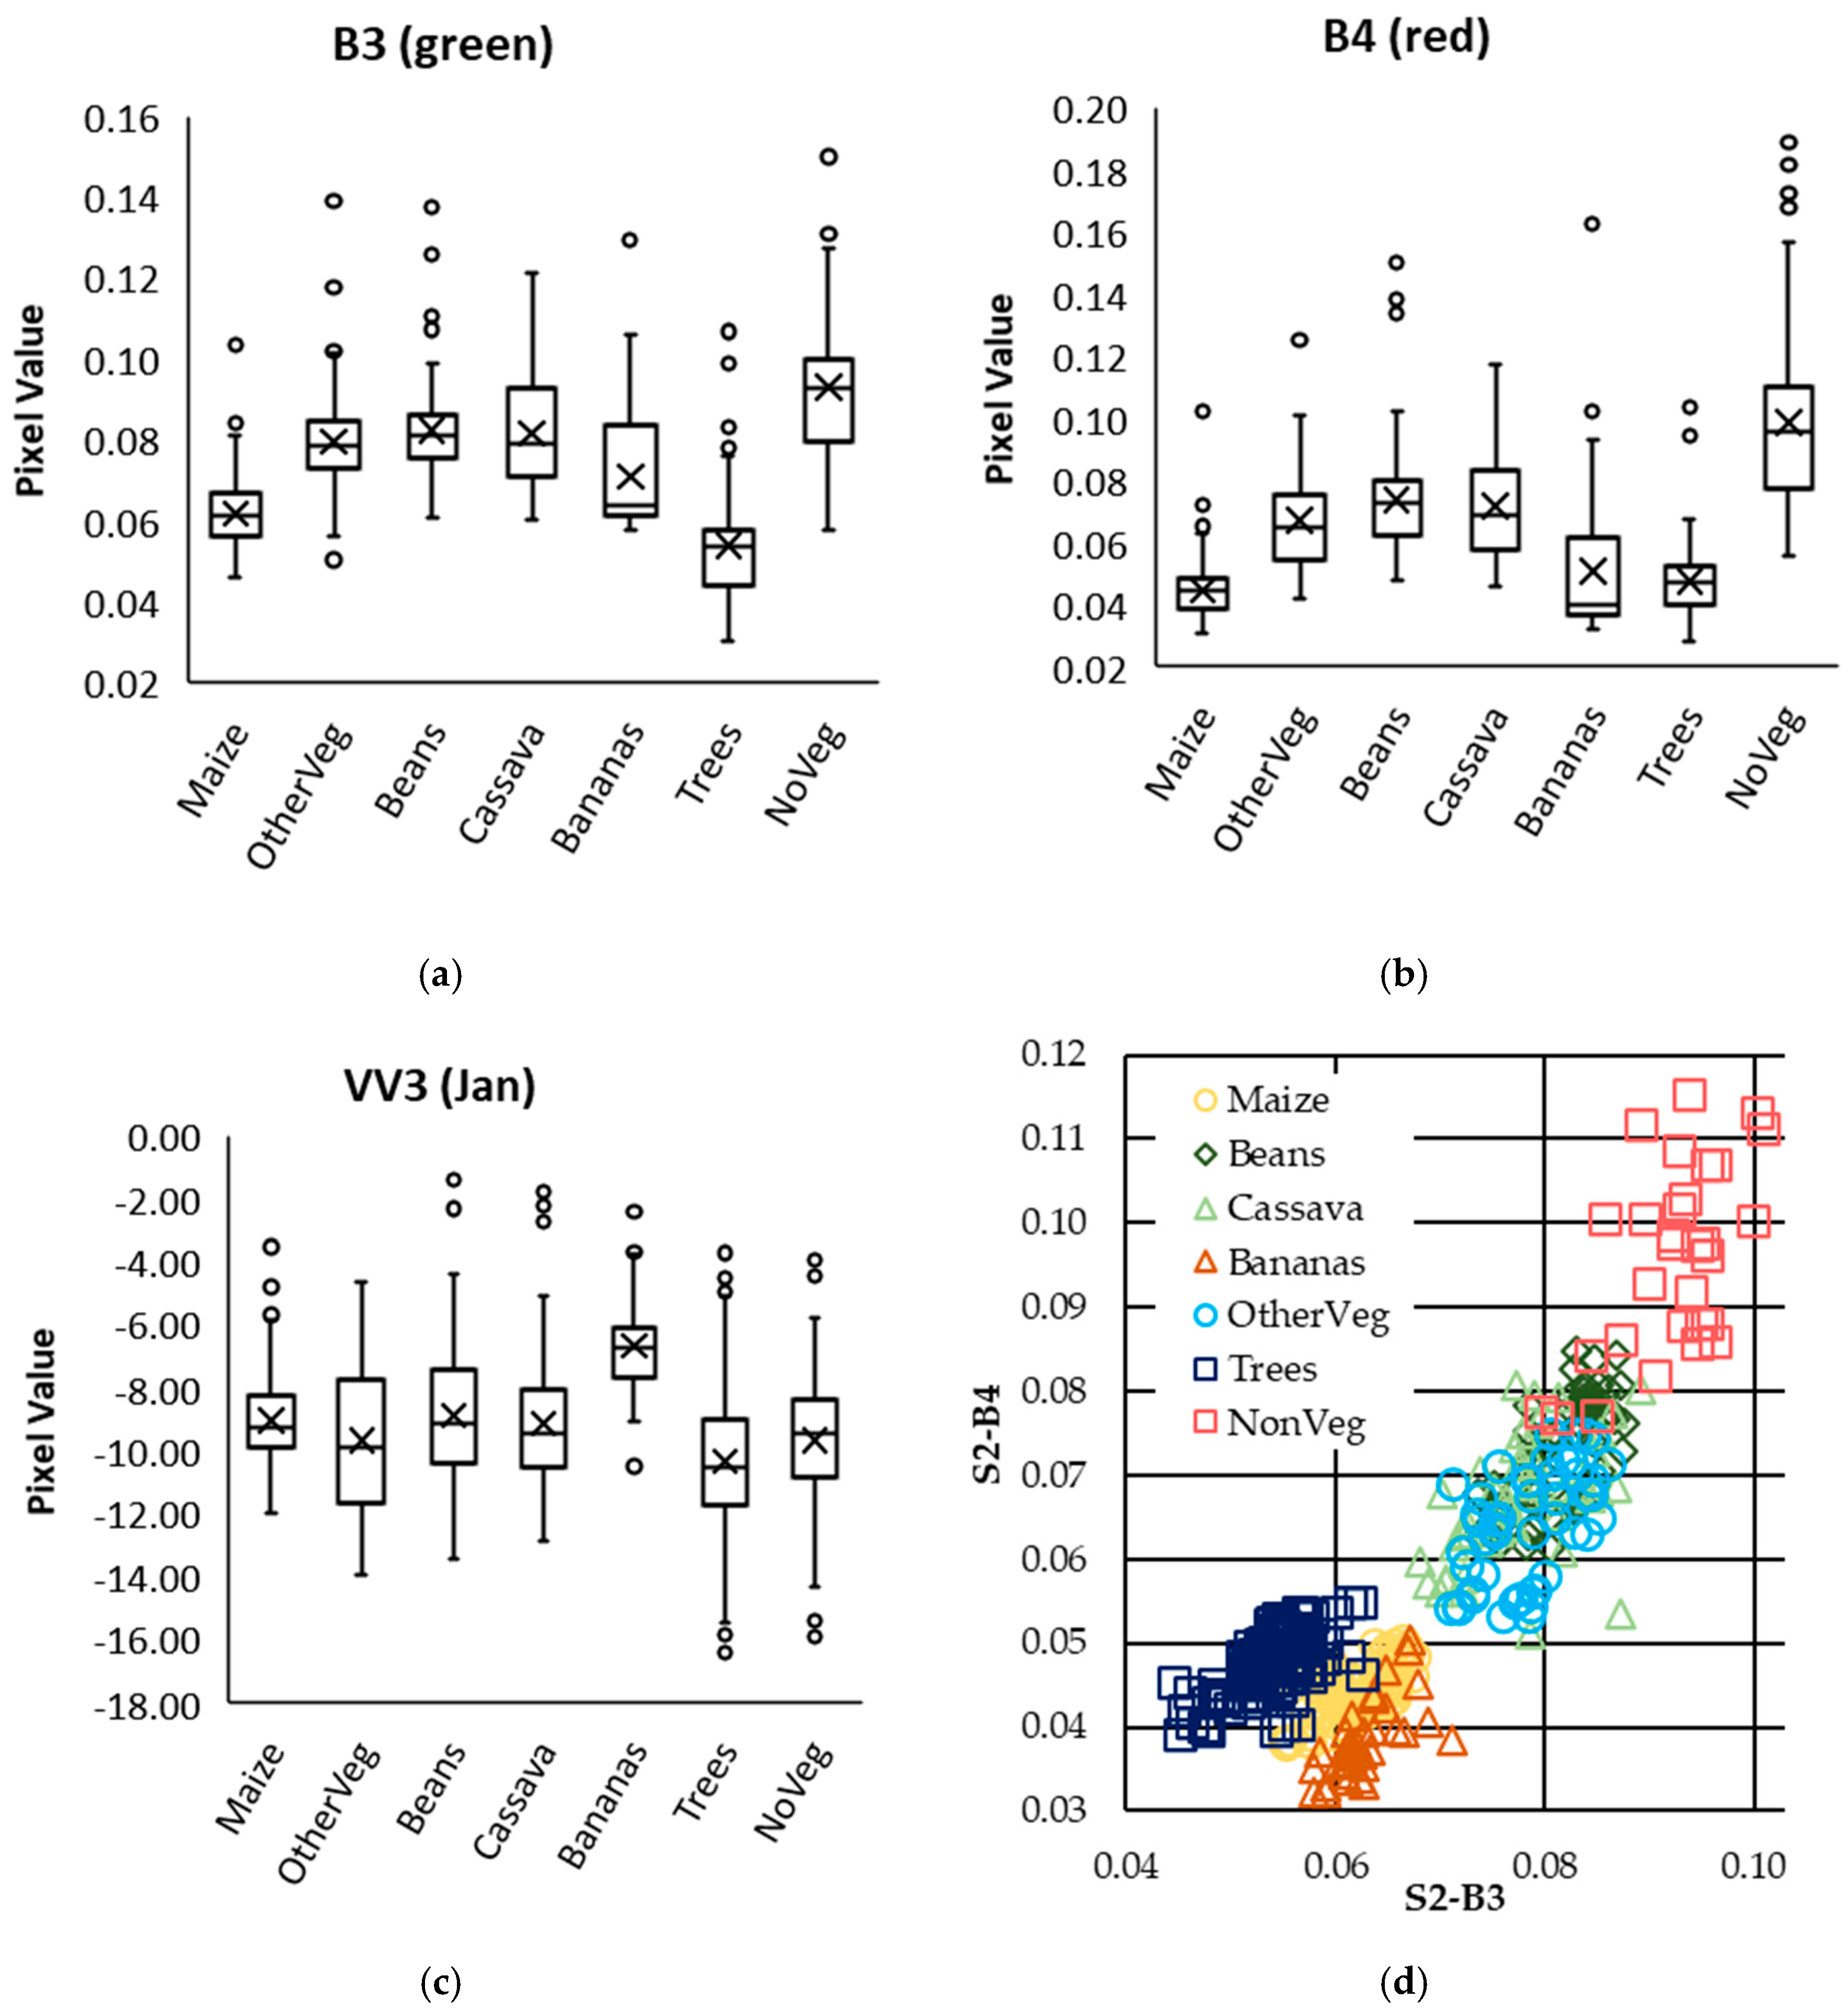
We analyzed the signal values for the labeled categories in the Sentinel satellite imagery that contributed most to the between-class differentiation to better understand the feasibility of discriminating between selected categories of crops and ultimately to interpret the results of the model. The RF algorithm outputs a standardized measure of the importance of each of the features used in the model [40]. In our case, the S2-B3 and S2-B4 features were the most important for discriminating between the selected seven classes, followed by the S1-VV value. Box plots of the training data for each of the classes were created using the S2-B3, S2-B4, and S1-VV signal values (Figure 3a–c). Figure 3d shows a two-dimensional (2D) plot in the S2-B3 and S2-B4 coordinates for representative training points. Although there is significant overlap in the spectral signatures of beans, cassava, and other vegetation, maize, bananas, trees, and the non-vegetative class appear separable.

3.2. Intercropped Maize (iMaize)

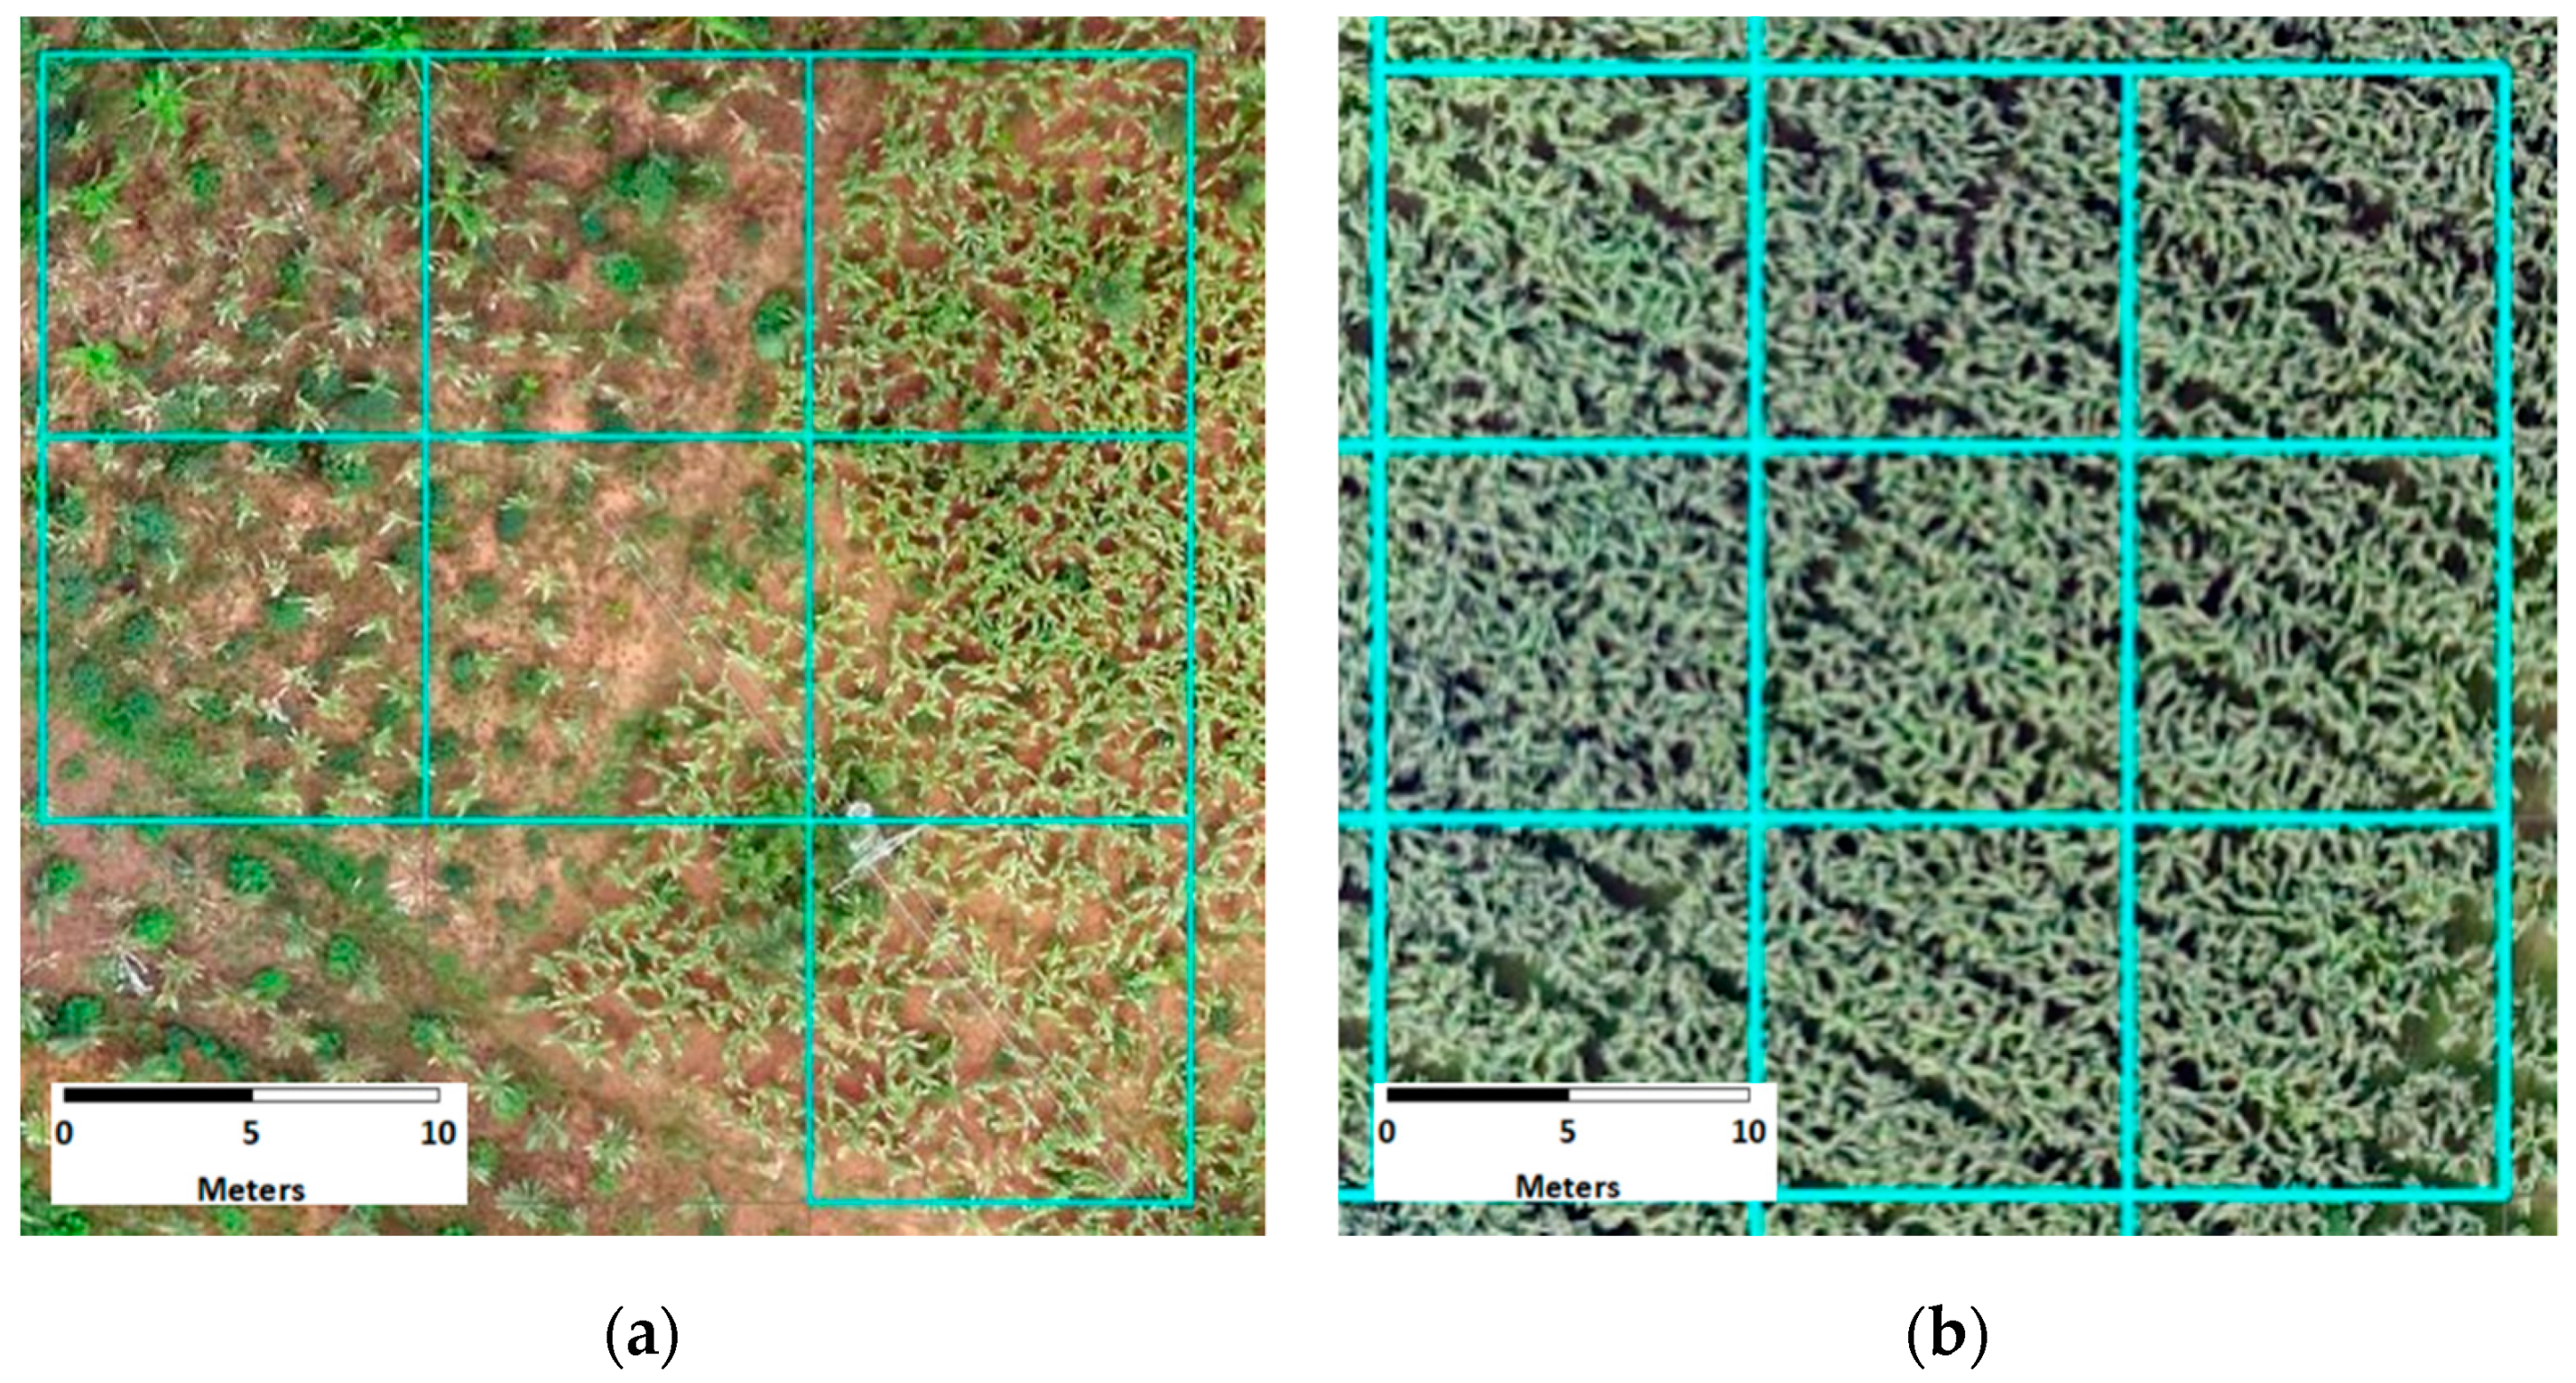
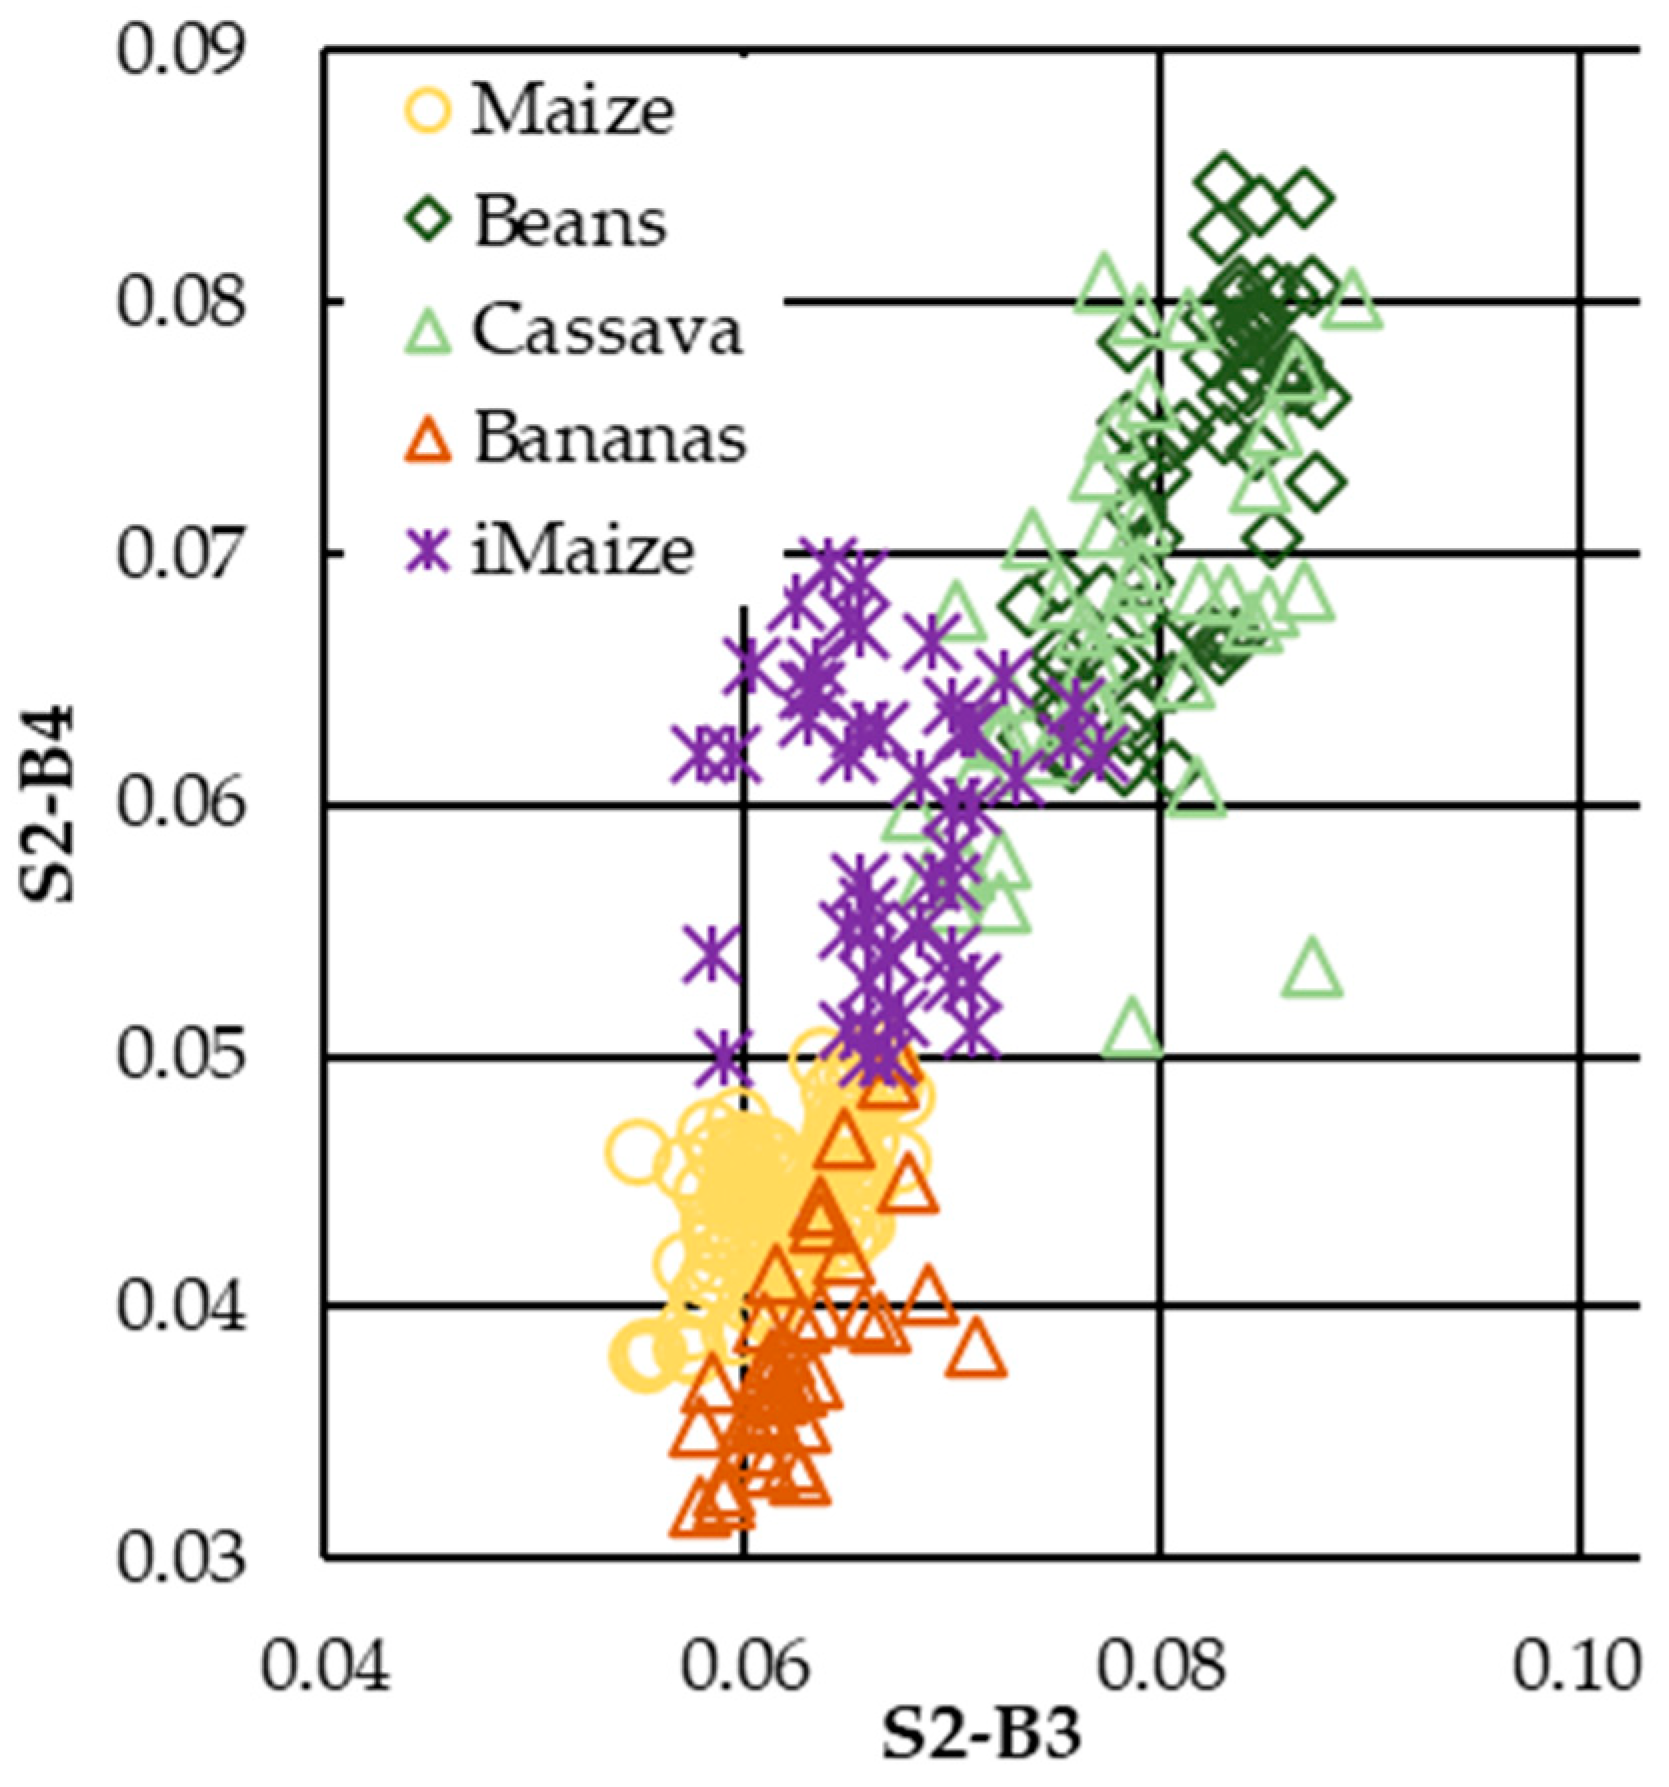
A similar analysis was performed to compare spectral signatures of intercropped maize (denoted as iMaize) with the other agricultural categories. Maize in Rwanda is most often intercropped with beans and cassava, although intercropping patterns can vary widely between fields both in terms of the crops being intercropped with maize and the ratio of maize to other crops (Figure 4). Given this variability and the relatively low density of maize in these examples, it is not surprising that such intercropped maize has a spectral signature that better matches the signature of the crop that it is intercropped with than the signature of pure maize (Figure 5). As a result, intercropped maize was likely classified as another crop type (i.e., beans or cassava). This is consistent with the labeling procedure used in this study in which we assigned the label according to the dominant crop type.

3.3. Cropped Land Model Results

An RF model was trained and tested on the GEE platform using a composite image that consisted of four S2 features (B2, B3, B4, and B8) from a single point in time and three S1 features that spanned the peak of the growing season (median VV values for the months of November 2018, December 2018, and January 2019). For the optical bands, pixels from the January 23 image were used to fill in clouded pixels in the January 28 image. The ground-truth dataset was split into training (80% of labeled points) and testing (20% of labeled points) datasets such that none of the points used to train the model were used to test the model. The confusion matrix for the testing dataset is provided in Table 4, where each row corresponds to a predicted class and each column to an actual class. The cells show the counts of correct and incorrect classifications for each class. The producer’s accuracy, defined as the ratio of the number of sites classified correctly by the model to the total number of sites for the class, is shown in the last column. The overall accuracy of the model was 83%, with producer’s accuracies of 91% and 84% for maize and beans, respectively.
Examining the confusion matrix more closely, we can see that in cases where other vegetation was not classified correctly, it was most often confused with beans and cassava. These classes are spectrally very similar (Figure 3d), so this confusion is not surprising. The non-vegetative class was also confused with beans, and there is some spectral overlap with this class (Figure 3d). Trees were occasionally confused with maize, which again agrees with the short distance between data points corresponding to these categories (Figure 3d). The comparatively large confidence intervals for some of the categories (e.g., beans, cassava, and bananas) result from a relatively small number of data points used in the accuracy assessment based on the 80/20 split of the original ground-truth dataset.
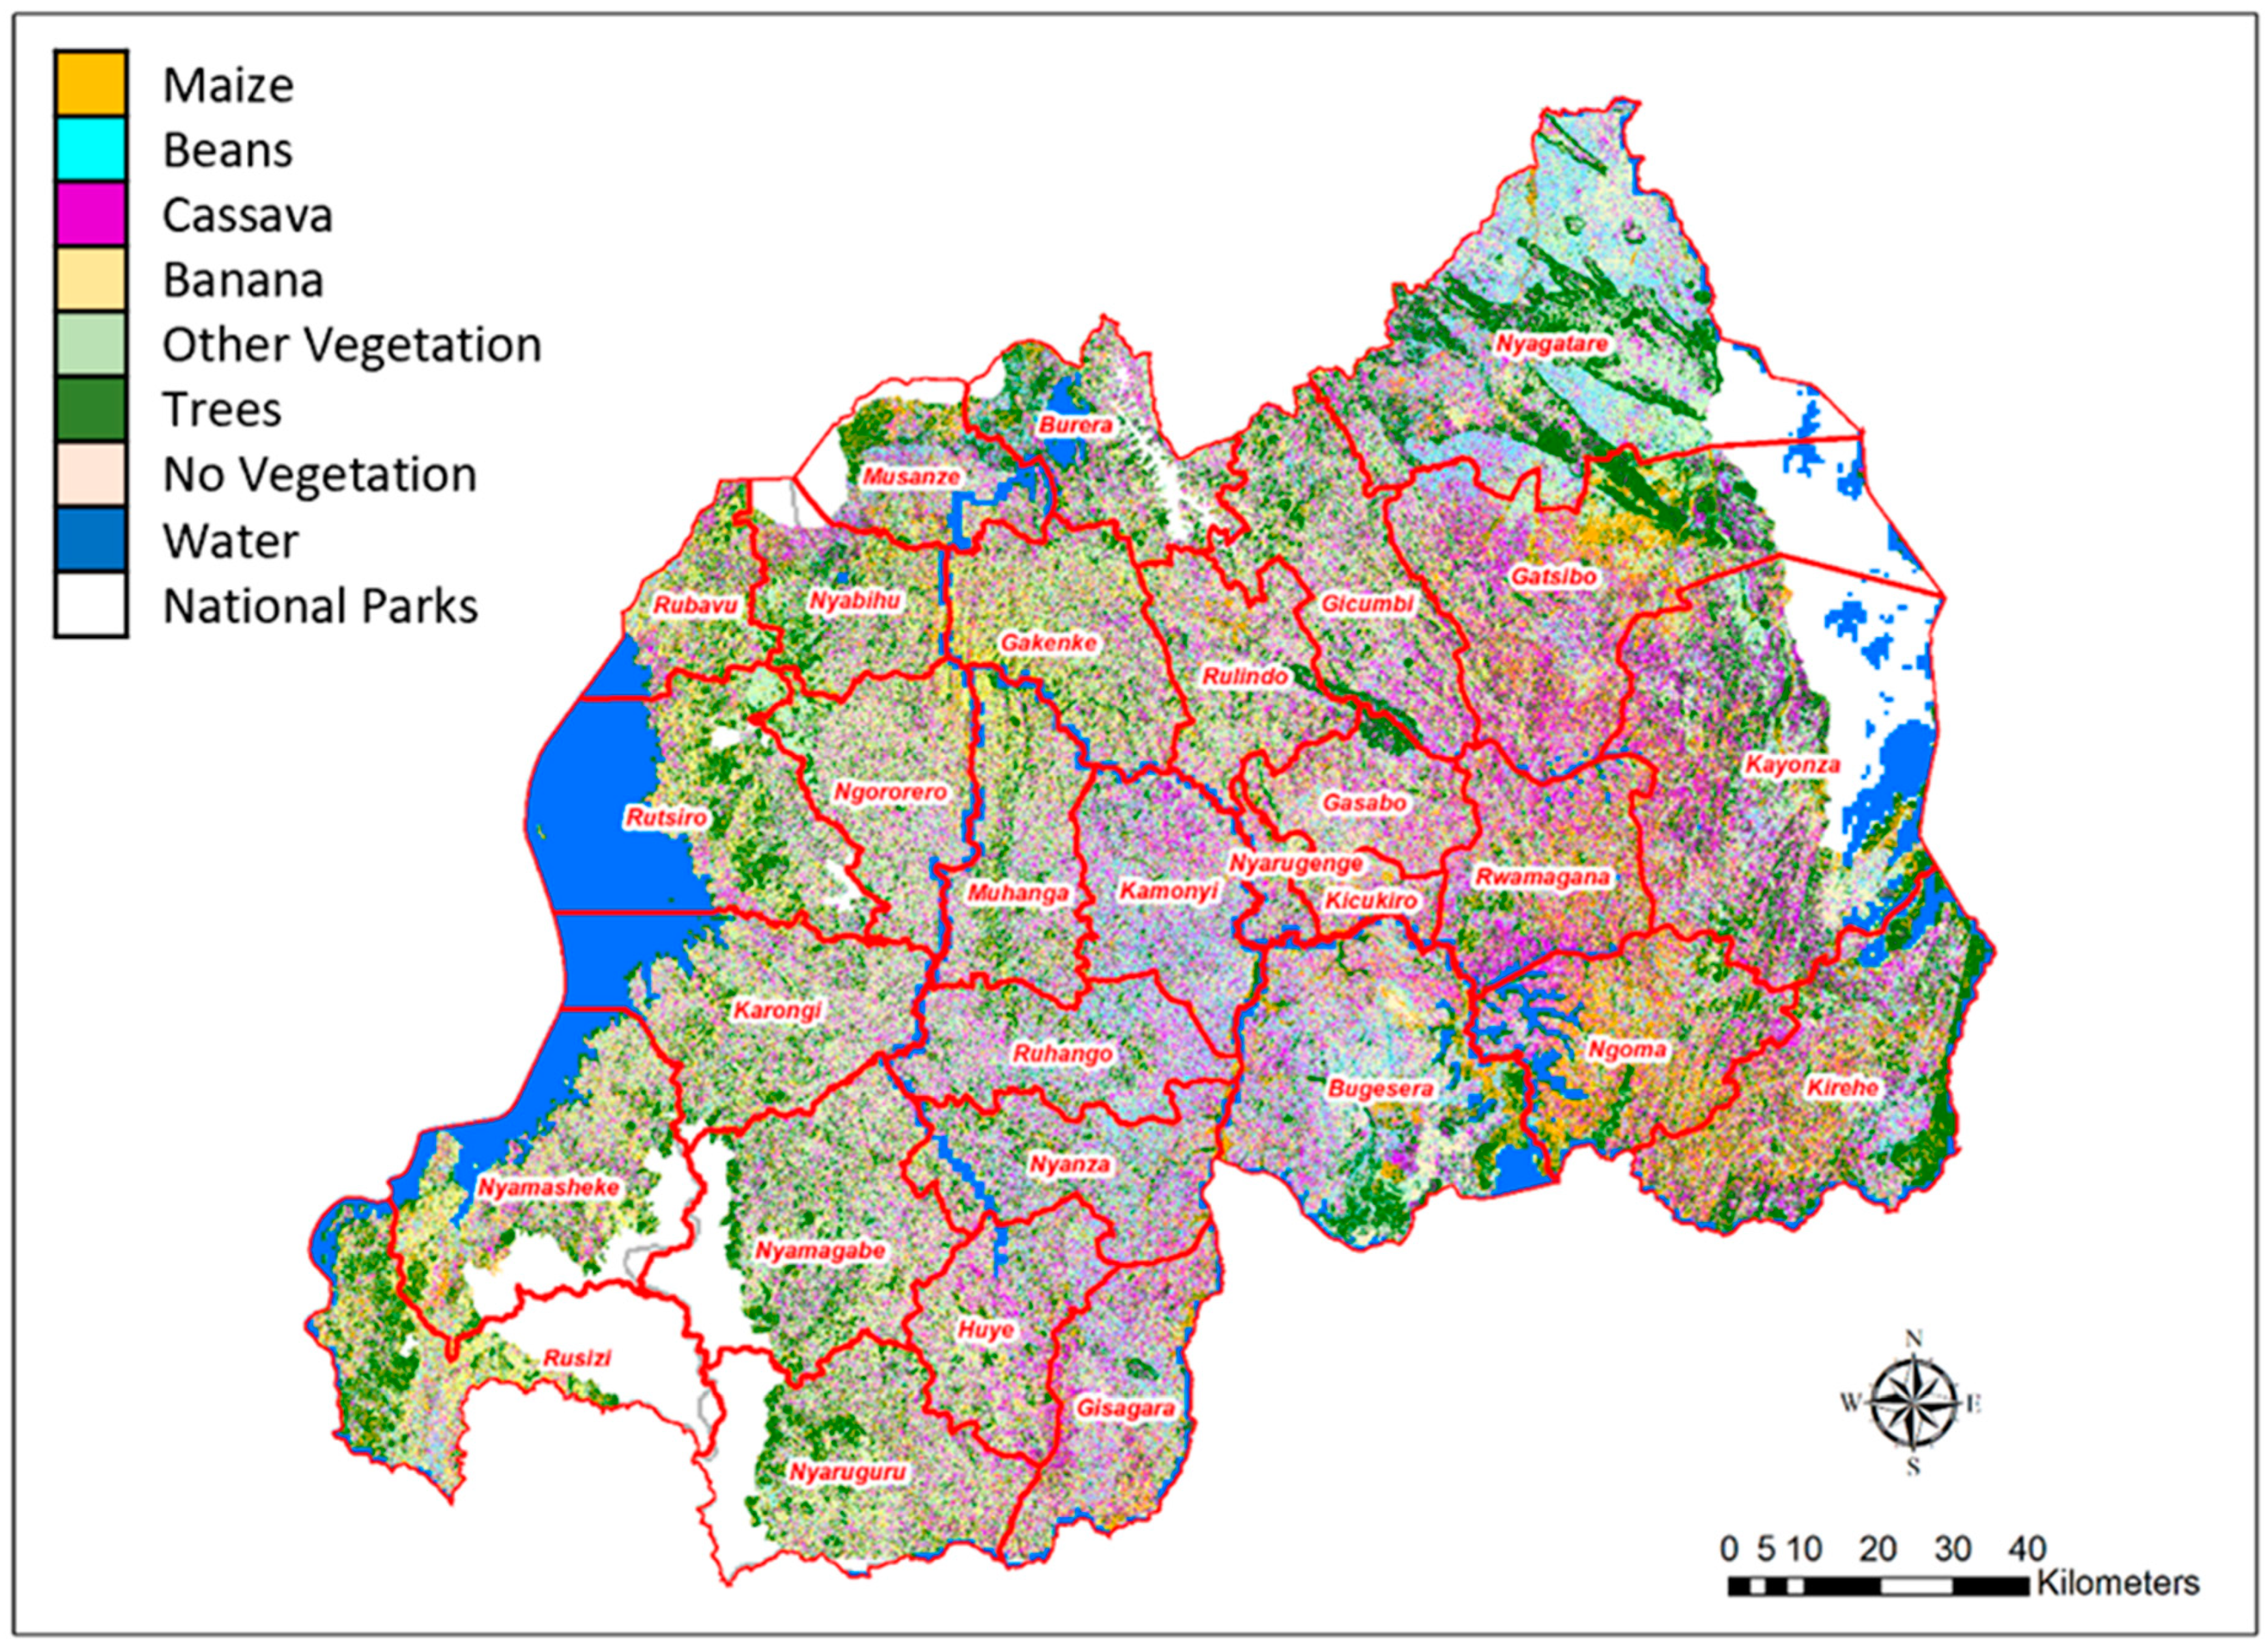
A cropped land area map (Figure 6) was created using the composite S1/S2 image for the entire country of Rwanda. National parks [41] and water bodies [42] were masked using available products in GEE. The estimated land area for each crop included in the model was compared with the 2019 Season A SAS on a country scale (Table 5) [30].
The estimated areas for maize and beans agreed with the crop/cultivated areas (defined as the area occupied by a given crop in a plot considering its density or occupation) reported in the SAS to within 3% and 7%, respectively. The estimated area for cassava was in good agreement with the total area reported by the SAS for tubers and roots but significantly overestimated the total area for cassava alone. The spectral feature space for cassava was overlapped with other vegetation, which was undercounted by the model. A large discrepancy was also observed for the predicted versus reported cropped area for bananas. The total harvested area (defined as the total number of hectares that was harvested in a given agricultural season) for bananas was lower than the cropped area (i.e., 82,523 ha versus 253,996 ha), indicating that the plants are at different stages of growth as would be expected for an annual crop. Other sources contributing to these discrepancies are further considered in the Discussion.
The total area under cultivation (i.e., the sum of classes 1 through 5) in the model (1,454,713 ha) agreed with the survey results (1,319,256 ha) to within 10%.

4. Discussion

This study investigated a scalable approach for using remote sensing technologies to create cropped land area maps for smallholder agricultural systems. UAVs were used to collect high-fidelity ground-truth information at six sites in Rwanda during 2019 Season A. Models were implemented using open-source, freely available resources to offer an accessible solution for the developing world [17].
Using UAVs to develop labeled datasets has advantages over traditional survey methods involving observers on the ground. In addition to accurate georeferencing, labelled imagery can be reviewed with respect to vegetation type, growth stage, and ground coverage. Labeling efforts can be extended at any point after the images are obtained and points added to the datasets based on the purpose of a specific model. The labeling can also be automated as indicated by another recently published study from our group [34]. Limitations to collecting ground-truth examples in this manner include restrictions on site selection in terms of the elevation and slope at which UAVs can fly.
Although other studies that specifically address crop mapping in smallholder agricultural systems have focused on a single crop, most commonly maize [17], this study aimed to develop a cropped area map that included several strategic crops. Determining the separability of classes using the selected features is an important first step to ensure a robust model and aid in interpretability [16]. We analyzed the data in selected optical and SAR bands from the peak of the growing season based on the availability of relatively cloud-free S2 imagery. This qualitative analysis indicated that maize, bananas, trees, and the non-vegetative class were well separated, but beans, cassava, and other vegetation significantly overlapped.
We also examined the spectral signatures of plots of maize that were intercropped with beans or cassava. It is generally assumed that intercropped maize will appear spectrally similar to pure maize fields [17]. From the UAV imagery, we determined that there was a broad range of intercropping patterns. Not surprisingly, when the density of maize was low, the plot signature more closely matched that of beans or cassava compared with pure maize. To better capture intercropped conditions, researchers should include additional categories and ground-truth examples in the model to describe specific intercropping patterns. Ultimately, as the development of publicly supported satellite networks continues and more high-resolution imagery is made freely available, the accuracy of labeled datasets and models will improve. For example, Richard et al. were able to differentiate between pure maize and intercropped maize conditions using imagery acquired from the commercial RapidEye satellites that provide images with 5-m ground resolution [38].
The ground-truth dataset generated from the labeled UAV imagery was used to create a seven-class cropped land model including three seasonal and one annual crop using a S1/S2 composite image. This model extends the seminal work of Jin et al. and Burke et al. [8,9,17] that focused on classifying maize only in smallholder agricultural systems. The model developed in this work was developed using the open-access GEE platform and achieved an overall accuracy of 83%, and maize and beans (including climbing beans and bush beans) were classified with overall accuracies of 91% and 84%, respectively. Model accuracies for these categories compare well to the models reported in the other studies of smallholder agricultural systems, in which single crops were classified with accuracies ranging from 67% to 79% [8,9,17]. Overall accuracy was also similar to the pixel-based multi-class modeling approaches used by Kussul et al. in their study combining S1 and S2 data to classify fields in Ukraine [13]. Other studies reported higher accuracies for multi-class models using optical and/or SAR data, but these studies had access to larger ground-truth data sets and/or more cloud-free optical imagery [7,14,16]. To tighten the confidence interval and improve accuracies for individual categories, labeling efforts should be expanded in future studies [15]. Ideally, independently gathered ground-truth data (especially for testing) would also be incorporated into a full-scale study to highlight and remove any biases in the model.
To further assess the model, we compared crop-specific areas calculated by the model with areas reported by the SAS for the same 2019 Season A. Although the estimated areas for maize and beans agreed with the survey results, the estimated area for cassava did not. The classification accuracy of cassava was lower than the other classes included in the model. The spectral signature of cassava overlapped with the spectral signature of the “other vegetation” class, which was undercounted by the model compared with the 2019 SAS. Additionally, some of intercropped maize was likely counted as cassava based on the similarity in the spectral information.
Although not a major source of testing error in the model, bananas were undercounted in relation to the 2019A SAS. Again, the harvested area was less than the total cropped area: 32% of the crop was harvested during Season A. The examples of bananas included in the training set were all from mature, healthy plants. Additionally, we did not include banana plants that were growing in residential areas, which is commonly practiced in Rwanda. To reduce noise in the training dataset, we decided early in the labeling effort to include only cells that were dominated (i.e., at least 75%) by a single class type, and we included only cells with banana plants that were surrounded by other cells with banana plants. Banana plants that were growing next to structures were likely classified in the non-vegetative class in our model because it was the dominant landcover. Again, as more higher resolution satellite imagery becomes available, the addition of mixed-landcover classes to the labeling taxonomy will help capture bananas growing in residential areas.
In the process of creating the country-scale map, we used existing shapefiles of water bodies and national parks to mask out known areas. The accuracy of these shapefiles affects the accuracy of the land areas calculated from the map generated using the trained model. Therefore, as these shapefiles are updated and improved, the precision of any models downstream in the mapping process will benefit. Future studies will be positively affected by the availability of up-to-date shapefiles for urban areas and other large-area non-vegetative structures that do not change as quickly as agricultural regions. These shapefiles can be created using commercial imagery as a source of ground-truth datasets for training the model, leaving UAV-acquired imagery for the ground-truthing of areas of intensive agricultural growth.

5. Conclusions

This pilot study indicates the potential to use UAV-acquired imagery rather than traditional ground-observer methods to collect large amounts of accurate ground-truth data, especially for smallholder agricultural systems. When collected via UAVs, ground-truth locations can be georeferenced accurately, which is important in areas where individual plots are small (<1 ha) and intercropping is the predominant practice. Additionally, imagery can be reviewed to verify ground cover and extract different features such as the density of vegetation coverage. More examples can easily be added to the training and testing datasets at any time based on the intent of the model. Limitations to collecting ground-truth examples in this manner include restrictions on site selection in terms of the elevation and slope at which UAVs can fly and regulatory constraints.
The UAV-based ground-truth dataset was used for training and testing an ML model for seven selected landcover categories, including four key crops in Rwanda. The overall accuracy of the model was 83%, with accuracies of 91% and 84% for maize and beans, respectively. Cassava was classified with lower accuracy (67%), and the model tended to confuse it with the catch-all class of other vegetation. Model accuracy may be improved by creating mixed land use categories to better capture intercropping and bananas growing in residential areas.
Future work will benefit from further increasing the size of the ground-truth datasets (note: our sample size included 1251 total examples that were divided between training and testing datasets) and adding categories to the limited taxonomy we worked with. The addition of these categories will need to be accompanied by an increase in the number of data points assuming 100 samples per class and ideally per AEZ as a typical rule of thumb for the minimum size. Further attention needs to be given to creating accurate and up-to-date shapefiles for landcover categories that do not require the resolution and timeliness needed for agricultural areas. The availability of these shapefiles will allow the downstream models to focus on agricultural classes and improve the overall classification accuracy.

Author Contributions

Data curation, J.P., M.O., and N.U.; formal analysis, M.H.-C, J.P., and D.S.T.; investigation, J.R., R.H.B., D.L., and D.S.T.; methodology, N.U., J.R., R.H.B., D.L., and D.S.T.; software, M.H.-C., J.P., and M.O.; project administration and supervision, J.R., R.H.B., D.L., and D.S.T. All authors have read and agreed to the published version of the manuscript.

Funding

This research received no external funding.

Acknowledgments

We gratefully acknowledge the financial support of RTI International through its Grand Challenge Initiative. We have benefited greatly from discussions with stakeholders in the Government of Rwanda, United States Agency for International Development, United Kingdom Department for International Development, European Union, World Bank, UN Food and Agriculture Organization, and many non-government organizations operating in Rwanda. Mads Knudsen from Vanguard Economics also provided important support to advance this analysis. We thank Charis Unmanned Aerial Solutions for executing UAV flights.

Conflicts of Interest

The authors declare no conflicts of interest.

References

  1. Food and Agriculture Organization of the United Nations (FAO). Global Strategy to Improve Agricultural and Rural Statistics, Action Plan, 2020–2025; FAO: Rome, Italy, 2018. [Google Scholar]
  2. Global Strategy to Improve Agricultural and Rural Statistics (GSARS). Handbook on Remote Sensing for Agricultural Statistics; GSARS: Rome, Italy, 2017. [Google Scholar]
  3. Fritz, S.; See, L.; You, L.; Justice, C.; Becker-Reshef, I.; Bydekerke, L.; Cumani, R.; Defourny, P.; Erb, K.; Foley, J.; et al. The Need for Improved Maps of Global Cropland. Eos Trans. Am. Geophys. Union 2013, 94, 31–32. [Google Scholar] [CrossRef]
  4. Macdonald, R.B. A summary of the history of the development of automated remote sensing for agricultural applications. IEEE Trans. Geosci. Remote Sens. 1984, GE-22, 473–482. [Google Scholar] [CrossRef]
  5. Frey, H.T.; Mannering, J.V.; Burwell, R.E. Agricultural Application of Remote Sensing: The Potential from Space Platforms; Economic Research Service, US Department of Agriculture: Washington, DC, USA, 1949.
  6. Immitzer, M.; Vuolo, F.; Atzberger, C. First experience with Sentinel-2 data for crop and tree species classifications in central Europe. Remote Sens. 2016, 8, 166. [Google Scholar] [CrossRef]
  7. Vuolo, F.; Neuwirth, M.; Immitzer, M.; Atzberger, C.; Ng, W.-T. How much does multi-temporal Sentinel-2 data improve crop type classification? Int. J. Appl. Earth Obs. Geoinf. 2018, 72, 122–130. [Google Scholar] [CrossRef]
  8. Burke, M.; Lobell, D.B. Satellite-based assessment of yield variation and its determinants in smallholder African systems. Proc. Natl. Acad. Sci. USA 2017, 114, 2189–2194. [Google Scholar] [CrossRef] [Green Version]
  9. Jin, Z.; Azzari, G.; Burke, M.; Aston, S.; Lobell, D. Mapping Smallholder Yield Heterogeneity at Multiple Scales in Eastern Africa. Remote Sens. 2017, 9, 931. [Google Scholar] [CrossRef] [Green Version]
  10. Lebourgeois, V.; Dupuy, S.; Vintrou, É.; Ameline, M.; Butler, S.; Bégué, A. A combined random forest and OBIA classification scheme for mapping smallholder agriculture at different nomenclature levels using multisource data (simulated Sentinel-2 time series, VHRS and DEM). Remote Sens. 2017, 9, 259. [Google Scholar] [CrossRef] [Green Version]
  11. Clevers, J.; Kooistra, L.; Van Den Brande, M. Using Sentinel-2 data for retrieving LAI and leaf and canopy chlorophyll content of a potato crop. Remote Sens. 2017, 9, 405. [Google Scholar] [CrossRef] [Green Version]
  12. Veloso, A.; Mermoz, S.; Bouvet, A.; Le Toan, T.; Planells, M.; Dejoux, J.-F.; Ceschia, E. Understanding the temporal behavior of crops using Sentinel-1 and Sentinel-2-like data for agricultural applications. Remote Sens. Environ. 2017, 199, 415–426. [Google Scholar] [CrossRef]
  13. Kussul, N.; Lemoine, G.; Gallego, F.J.; Skakun, S.V.; Lavreniuk, M.; Shelestov, A.Y. Parcel-based crop classification in ukraine using landsat-8 data and sentinel-1A data. IEEE J. Sel. Top. Appl. Earth Obs. Remote Sens. 2016, 9, 2500–2508. [Google Scholar] [CrossRef]
  14. Xu, L.; Zhang, H.; Wang, C.; Zhang, B.; Liu, M. Crop classification based on temporal information using sentinel-1 SAR time-series data. Remote Sens. 2019, 11, 53. [Google Scholar] [CrossRef] [Green Version]
  15. Tomppo, E.; Antropov, O.; Praks, J. Cropland Classification Using Sentinel-1 Time Series: Methodological Performance and Prediction Uncertainty Assessment. Remote Sens. 2019, 11, 2480. [Google Scholar] [CrossRef] [Green Version]
  16. Sonobe, R.; Yamaya, Y.; Tani, H.; Wang, X.; Kobayashi, N.; Mochizuki, K.-I. Assessing the suitability of data from Sentinel-1A and 2A for crop classification. GISci. Remote Sens. 2017, 54, 918–938. [Google Scholar] [CrossRef]
  17. Jin, Z.; Azzari, G.; You, C.; Di Tommaso, S.; Aston, S.; Burke, M.; Lobell, D.B. Smallholder maize area and yield mapping at national scales with Google Earth Engine. Remote Sens. Environ. 2019, 228, 115–128. [Google Scholar] [CrossRef]
  18. Xiong, J.; Thenkabail, P.S.; Tilton, J.C.; Gumma, M.K.; Teluguntla, P.; Oliphant, A.; Congalton, R.G.; Yadav, K.; Gorelick, N. Nominal 30-m Cropland Extent Map of Continental Africa by Integrating Pixel-Based and Object-Based Algorithms Using Sentinel-2 and Landsat-8 Data on Google Earth Engine. Remote Sens. 2017, 9, 1065. [Google Scholar] [CrossRef] [Green Version]
  19. JECAM. Joint Experiment for Crop Assessment and Monitoring. Available online: http://jecam.org/ (accessed on 19 March 2020).
  20. Shi, Y.; Thomasson, J.A.; Murray, S.C.; Pugh, N.A.; Rooney, W.L.; Shafian, S.; Rajan, N.; Rouze, G.; Morgan, C.L.; Neely, H.L.; et al. Unmanned Aerial Vehicles for High-Throughput Phenotyping and Agronomic Research. PLoS ONE 2016, 11, e0159781. [Google Scholar] [CrossRef] [Green Version]
  21. Eckman, S.; Eyerman, J.; Temple, D. Unmanned Aircraft Systems Can Improve Survey Data Collection; RTI Press Publication No. RB-0018-1806; RTI International: Research Triangle Park, NC, USA, 2018. [Google Scholar]
  22. Bigirimana, F. National Institute of Statistics Rwanda: Kigali, Rwanda. 2019. Available online: https://www.statistics.gov.rw/ (accessed on 22 April 2020).
  23. Yang, M.-D.; Huang, K.-S.; Kuo, Y.-H.; Tsai, H.; Lin, L.-M. Spatial and Spectral Hybrid Image Classification for Rice Lodging Assessment through UAV Imagery. Remote Sens. 2017, 9, 583. [Google Scholar] [CrossRef] [Green Version]
  24. Yahyanejad, S.; Rinner, B. A fast and mobile system for registration of low-altitude visual and thermal aerial images using multiple small-scale UAVs. ISPRS J. Photogramm. Remote Sens. 2015, 104, 189–202. [Google Scholar] [CrossRef]
  25. Lelong, C.C.; Burger, P.; Jubelin, G.; Roux, B.; Labbe, S.; Baret, F. Assessment of Unmanned Aerial Vehicles Imagery for Quantitative Monitoring of Wheat Crop in Small Plots. Sensors 2008, 8, 3557–3585. [Google Scholar] [CrossRef]
  26. Baluja, J.; Diago, M.P.; Balda, P.; Zorer, R.; Meggio, F.; Morales, F.; Tardaguila, J. Assessment of vineyard water status variability by thermal and multispectral imagery using an unmanned aerial vehicle (UAV). Irrig. Sci. 2012, 30, 511–522. [Google Scholar] [CrossRef]
  27. Hall, O.; Dahlin, S.; Marstorp, H.; Archila Bustos, M.; Öborn, I.; Jirström, M. Classification of Maize in Complex Smallholder Farming Systems Using UAV Imagery. Drones 2018, 2, 22. [Google Scholar] [CrossRef] [Green Version]
  28. Tripicchio, P.; Satler, M.; Dabisias, G.; Ruffaldi, E.; Avizzano, C.A. Towards Smart Farming and Sustainable Agriculture with Drones. In Proceedings of the 2015 International Conference on Intelligent Environments, Prague, Czech Republic, 15–17 July 2015; pp. 140–143. [Google Scholar]
  29. Polly, J.; Hegarty-Craver, M.; Rineer, J.; O’Neil, M.; Lapidus, D.; Beach, R.; Temple, D.S. The use of Sentinel-1 and -2 data for monitoring maize production in Rwanda. Pro. SPIE 2019, 11149, 111491Y. [Google Scholar]
  30. National Institute of Statistics of Rwanda. Seasonal Agricultural Survey. Season A 2019 Report; National Institute of Statistics Rwanda: Kigali, Rwanda, 2019.
  31. National Institute of Statistics of Rwanda. Gross Domestic Product—2019. Available online: http://www.statistics.gov.rw/publication/gdp-national-accounts-2019 (accessed on 22 April 2019).
  32. Rushemuka, P.N.; Bock, L.; Mowo, J.G. Soil science and agricultural development in Rwanda: State of the art. A review. BASE 2014, 18, 142–154. [Google Scholar]
  33. Prasad, P.V.; Hijmans, R.J.; Pierzynski, G.M.; Middendorf, J.B. Climate Smart Agriculture and Sustainable Intensification: Assessment and Priority Setting for Rwanda; Kansas State University: Manhattan, KS, USA, 2016. [Google Scholar]
  34. Chew, R.; Rineer, J.; Beach, R.; O’Neil, M.; Ujeneza, N.; Lapidus, D.; Miano, T.; Hegarty-Craver, M.; Polly, J.; Temple, D.S. Deep Neural Networks and Transfer Learning for Food Crop Identification in UAV Images. Drones 2020, 4, 7. [Google Scholar] [CrossRef] [Green Version]
  35. Jensen, J.R. Remote Sensing of the Environment, 2nd ed.; Pearson Prentice Hall: Upper Saddle River, NJ, USA, 2007. [Google Scholar]
  36. Shelestov, A.; Lavreniuk, M.; Kussul, N.; Novikov, A.; Skakun, S. Exploring Google Earth Engine Platform for Big Data Processing: Classification of Multi-Temporal Satellite Imagery for Crop Mapping. Front. Earth Sci. 2017, 5. [Google Scholar] [CrossRef] [Green Version]
  37. Kumaraperumal, R.; Shama, M.; Ragunath, B.; Jagadeeswaran, R. Sentinel 1A SAR Backscattering Signature of Maize and Cotton Crops. Madras Agric. J. 2017, 104, 54–57. [Google Scholar]
  38. Richard, K.; Abdel-Rahman, E.M.; Subramanian, S.; Nyasani, J.O.; Thiel, M.; Jozani, H.; Borgemeister, C.; Landmann, T. Maize Cropping Systems Mapping Using RapidEye Observations in Agro-Ecological Landscapes in Kenya. Sensors 2017, 17, 2537. [Google Scholar] [CrossRef] [Green Version]
  39. Google Earth Engine. Machine Learning in Earth Engine. Available online: https://developers.google.com/earth-engine/machine-learning (accessed on 3 March 2020).
  40. Belgiu, M.; Drăguţ, L. Random forest in remote sensing: A review of applications and future directions. ISPRS J. Photogramm. Remote Sens. 2016, 114, 24–31. [Google Scholar] [CrossRef]
  41. UNEP-WCMC. WDPA: World Database on Protected Areas (Polygons). Available online: https://developers.google.com/earth-engine/datasets/catalog/WCMC_WDPA_current_polygons (accessed on 20 March 2020).
  42. Copernicus. Copernicus Global Land Cover Layers: CGLS-LC100 Collection 2. Available online: https://developers.google.com/earth-engine/datasets/catalog/COPERNICUS_Landcover_100m_Proba-V_Global (accessed on 20 March 2020).
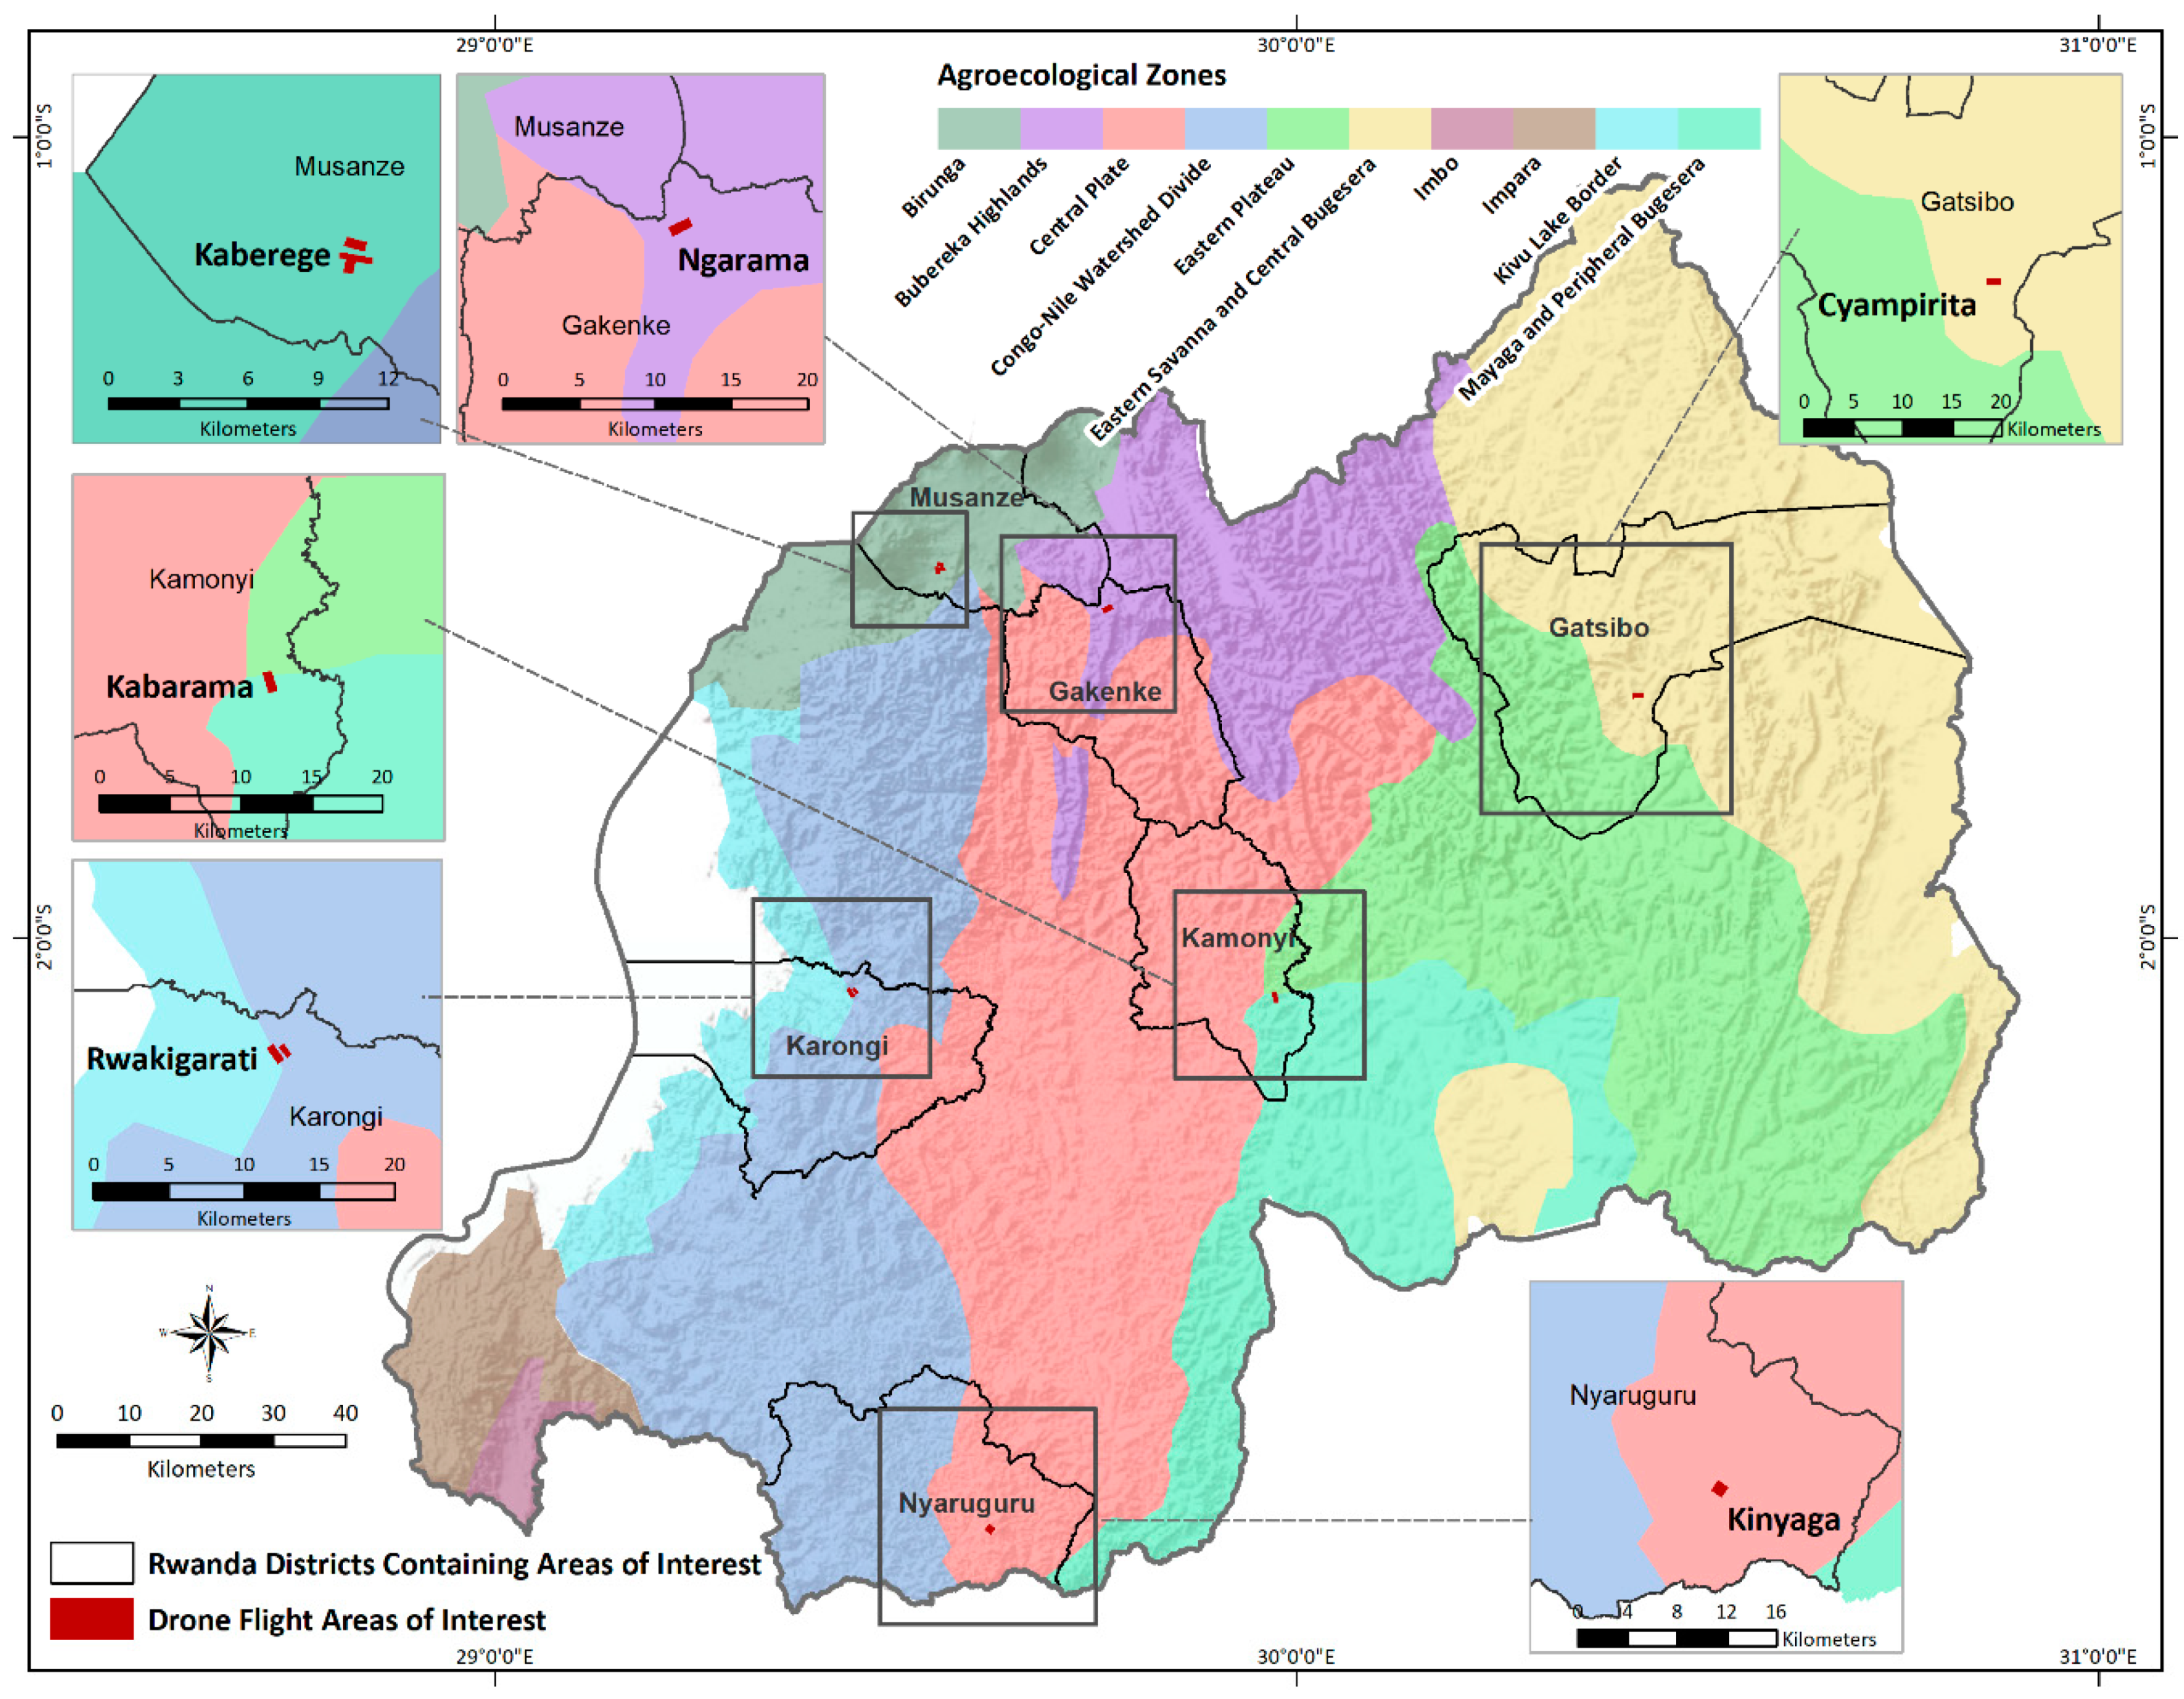
Figure 1. Agro-ecological zone map of Rwanda with unmanned aerial vehicles (UAV) flight sites and districts marked (Soucre: Chew et al. [34]).
Remotesensing 12 01984 g001
Figure 2. Examples of 10 × 10-m sections of UAV images representing selected categories: (a) Maize, (b) Beans, (c) Cassava, (d) Bananas, (e) OtherVeg, (f) Trees, (g) NonVeg.
Remotesensing 12 01984 g002
Figure 3. Boxplots of S2-MSI and S1-SAR features for all labeled training samples (ac) and 2D S2-MSI feature space for the representative training samples of each labeled class (d).
Remotesensing 12 01984 g003
Figure 4. Examples of maize intercropped with cassava (a) and maize-only (b) fields in Rwanda. The 10 × 10-m Sentinel grid cells are shown for reference and labeled to reflect at least 75% of the same landcover type.
Remotesensing 12 01984 g004
Figure 5. 2D S2-MSI feature space for representative examples of seasonal crops and vegetation (iMaize = intercropped maize).
Remotesensing 12 01984 g005
Figure 6. 2019 Season A crop area map.
Remotesensing 12 01984 g006
Table 1. UAV flight site information (note: imagery from 17 of the 18 flights was used in future analysis; the round #1 flight conducted at the Ngarama site was excluded).
LocationAgro-Ecological ZoneFlight #1Flight #2Flight #3
KaberegeBirunga27 December 201829 January 201919 February 2019
KinyagaCentral Plate/Eastern Plateau12 December 201824 January 201921 February 2019
KabaramaMayaga and Peripheral Bugesera10 December 201821 January 201916 February 2019
CyampiritaEastern Savanna and Central Bugesera17 December 201825 January 201918 February 2019
NgaramaBuberuka Highlands--30 January 201920 February 2019
RwakigaratiCongo-Nile Watershed Divide/Kivu Lake Border27 December 201831 January 201922 February 2019
Table 2. The number of ground-truth data points by class by site (Kbg = Kaberege, Kin = Kinyaga, Kbm = Kabarama, Cym = Cyampirita, Nga = Ngarama, Rwa = Rwakigarati).
ClassKbgKinKbmCymNgaRwaTotal
Maize130371110182289
Beans338692077144
Cassava0175347612135
Bananas41242149485
OtherVeg1246294709143
Trees105305610400295
NonVeg37382926525160
Total32118828935935591251
Table 3. S2 imagery cloud cover by frame (information from Sentinel-hub EO-Browser); Rwanda falls within four S2 frames (35MQU: Kaberege, Ngarama; 35MRU: Cyampirita, Ngarama; 35MQT: Kinyaga, Rwakigarati; 35MRT: Kabarama).
S2 Flight Date35MQU35MRU35MQT35MRT
2018-12-0477%98%93%65%
2018-12-09100%100%100%100%
2018-12-1444%39%19%51%
2018-12-2479%87%90%76%
2018-12-2939%52%19%18%
2019-01-0349%29%33%21%
2019-01-0837%34%36%63%
2019-01-1325%12%7%14%
2019-01-1881%100%100%89%
2019-01-236%12%26%7%
2019-01-2831%22%13%4%
2019-02-0240%40%54%35%
2019-02-0791%100%82%45%
2019-02-1236%77%37%66%
2019-02-1799%97%98%97%
2019-02-22100%100%98%99%
2019-02-2735%12%12%3%
Table 4. Confusion matrix for the random forest (RF) model; a 95% confidence interval is provided for the accuracy assessment.
ClassMaizeBeansCassavaBananasOtherVegTreesNonVeg% Accuracy
Maize5211201091 ± 4
Beans1162000084 ± 8
Cassava1112110267 ± 11
Bananas2011101073 ± 11
OtherVeg1421211072 ± 8
Trees4010153090 ± 4
NonVeg0510001673 ± 9
Total Pts61272015235618--
Table 5. Comparison of areas under cultivation by selected crops predicted by the model to the cultivated area reported in the 2019A SAS.
Model ClassModel Area (ha)SAS Category2019A SAS (ha)Difference
1. Maize222,570Maize215,1593%
2. Beans319,548Beans299,4437%
3. Cassava322,060Cassava195,13565%
4. Bananas137,784Bananas253,996−46%