Article

Improved Ice Velocity Measurements with Sentinel-1 TOPS Interferometry
by
Jonas Kvist Andersen
1,*,
Anders Kusk
1,
John Peter Merryman Boncori
1,
Christine Schøtt Hvidberg
2 and
Aslak Grinsted
2
1
DTU Space Institute, Technical University of Denmark (DTU), DK-2800 Kongens Lyngby, Denmark
2
Niels Bohr Institute, University of Copenhagen, DK-2100 Copenhagen, Denmark
*
Author to whom correspondence should be addressed.
Remote Sens. 2020, 12(12), 2014; https://doi.org/10.3390/rs12122014
Submission received: 13 May 2020 / Revised: 18 June 2020 / Accepted: 19 June 2020 / Published: 23 June 2020
(This article belongs to the Section Remote Sensing in Geology, Geomorphology and Hydrology)

Abstract

:
In recent years, the Sentinel-1 satellites have provided a data archive of unprecedented volume, delivering C-band Synthetic Aperture Radar (SAR) acquisitions over most of the polar ice sheets with a repeat-pass period of 6–12 days using Interferometric Wide swath (IW) imagery acquired in Terrain Observation by Progressive Scans (TOPS) mode. Due to the added complexity of TOPS-mode interferometric processing, however, Sentinel-1 ice velocity measurements currently rely exclusively on amplitude offset tracking, which generates measurements of substantially lower accuracy and spatial resolution than would be possible with Differential SAR Interferometry (DInSAR). The main difficulty associated with TOPS interferometry lies in the spatially variable azimuth phase contribution arising from along-track motion within the scene. We present a Sentinel-1 interferometric processing chain, which reduces the azimuth coupling to the line-of-sight phase signal through a spatially adaptive coregistration refinement incorporating azimuth velocity measurements. The latter are based on available ice velocity mosaics, optionally supplemented by Burst-Overlap Multi-Aperture Interferometry. The DInSAR processing chain is demonstrated for a large drainage basin in Northeast Greenland, encompassing the Northeast Greenland Ice Stream (NEGIS), and integrated with state-of-the-art offset tracking measurements. In the ice sheet interior, the combined DInSAR and offset tracking ice velocity product provides a spatial resolution of 50 × 50 m and 1-sigma accuracies of 0.18 and 0.44 m/y in the x and y components respectively, compared to GPS.

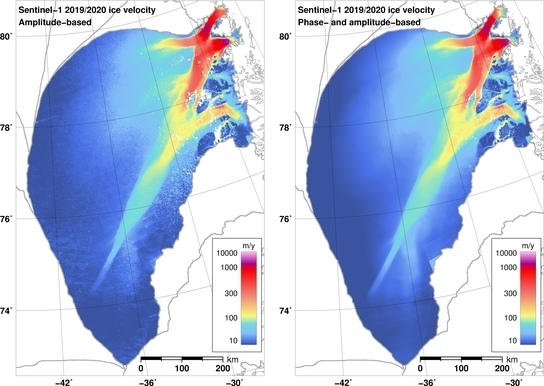
Graphical Abstract

1. Introduction

Ice velocity is an essential parameter in the study of ice sheet and glacier dynamics. It governs the discharge of ice from the accumulation zone to the edges of outlet glaciers and hence influences estimates of ice sheet mass balance and sea level rise [1,2]. Furthermore, ice velocity measurements constitute valuable input for constraining and validating numerical ice sheet models and for inversions seeking to infer, for example, basal sliding patterns and ice thickness.
Application of Synthetic Aperture Radar (SAR) satellites to ice motion monitoring has long been established. SAR-based measurements are currently obtained either through amplitude-based feature and speckle tracking (collectively referred to as offset tracking) [3,4] or through Differential SAR interferometry (DInSAR), a technique exploiting the radar phase [5]. Offset tracking has the advantage of producing two-dimensional velocity measurements, namely along the range (satellite line-of-sight) and azimuth (flight path) dimensions, and is applicable even on fast-flowing outlet glaciers, which may reach velocities as high as several km/year. The accuracy and resolution of the amplitude-based offset tracking velocity retrievals, however, are generally substantially poorer than those obtained with DInSAR [6], although the latter technique provides only measurements of the range motion component. A comprehensive review of SAR-based ice velocity measurement techniques applicable to Stripmap imagery is provided in [6].
In recent years, the European Space Agency (ESA) Sentinel-1A (S1A) and Sentinel-1B (S1B) SAR missions have been generating an unprecedented archive of regularly acquired free and open access data. Its main acquisition mode over land, namely Terrain Observation by Progressive Scans (TOPS) [7], trades off azimuth spatial resolution for wide swath coverage, allowing full coverage of the Greenland ice sheet to be achieved every 6–12 days. Concerning ice motion, however, such an archive is not being exploited to its full extent. Sentinel-1-based ice velocity products are in fact exclusively based on SAR offset tracking [8,9,10,11], whereas DInSAR is applied solely to Stripmap-mode imagery from other SAR missions [10,12]. This is a limitation particularly for the ice sheet interior regions, where the velocity magnitudes are often below the measurement accuracy provided by offset tracking. Even though interior velocities are slow, it is of high interest to monitor dynamical changes related to fast-flowing ice streams in order to detect how marginal acceleration and thinning spread inland [13], or to infer knowledge of basal hydrology from ice velocity patterns [14].
TOPS interferometry on ice sheets is complicated by the azimuth antenna steering of this acquisition mode, which significantly increases the sensitivity of the interferometric phase to azimuth misregistration compared to the Stripmap and ScanSAR case. For scenes covering near-stationary areas, Extended Spectral Diversity (ESD) was proposed in [15,16] to estimate a constant (i.e., scene-wide) azimuth offset to refine the results of geometric coregistration based on precise orbits and a Digital Elevation Model (DEM). Ice motion applications provide an additional challenge, however, since the projection of the underlying horizontal surface motion causes the azimuth misregistration to be spatially varying. In [17], a TOPS DInSAR approach based on adaptive azimuth coregistration and Multi-Aperture Interferometry (MAI) azimuth motion measurements was presented and demonstrated on TerraSAR-X TOPS acquisitions. However, this method was never applied to Sentinel-1 data. Sentinel-1 TOPS DInSAR was used in [18] to measure ice velocity on glaciers in the Canadian Arctic using the approach mentioned above for stationary scenes, which was justified for an area of interest in which motion was confined to glacier tongues with velocity magnitudes within 35 m/y. In [19], Sentinel-1 TOPS DInSAR was used to measure ice velocity and grounding line location for a set of glaciers in West Antarctica, using offset tracking to estimate and remove the phase contribution due to azimuth misregistration.
In this paper, we demonstrate the feasibility of generating Sentinel-1 TOPS DInSAR ice velocity measurements in the interior of the Greenland ice sheet using a DInSAR processing approach based on an azimuth coregistration refinement, as in [17]. However, after investigating different approaches, we select a different method to generate such a refinement. We assess the performance of our algorithm for the full Zwally 2.1 drainage basin [20], containing the North East Greenland Ice Stream (NEGIS), using both ascending and descending tracks from the Sentinel-1 winter campaign 2019–2020 and the surface parallel flow assumption [21] to generate 3D DInSAR velocity measurements. These are compared to GPS velocity retrievals as well as to 3D ice velocity mosaics based on amplitude offset tracking alone.
Section 2 outlines the data utilized in this study and describes the SAR data processing methods. Section 3 presents the ice velocity maps obtained for the Zwally 2.1 drainage basin using both offset tracking and DInSAR and their comparison with GPS measurements. Section 4 provides a discussion on the performance of Sentinel-1 TOPS DInSAR and on the requirements to include this processing algorithm in the routine generation of Greenland-wide ice velocity products. Conclusions are drawn in Section 5.

2. Data and Methods

2.1. Data

We utilized Sentinel-1A/B IW SLC images from the 2019–2020 Greenland winter campaign, during which the acquisition plan prioritized a frequent, comprehensive coverage of the Greenland ice sheet. We processed 3 acquisition cycles for 4 descending and 3 ascending passes, meaning that for each track, a total of five 6-day image pairs and three 12-day pairs could be formed. An overview of the processed Sentinel-1 images is found in Table 1. Figure 1 shows the coverage of the processed Sentinel-1 tracks along with an outline of the region of interest, i.e., the Zwally 2.1 drainage basin, containing the NEGIS.
External datasets used for the SAR data processing include the 90 m Tandem-X DEM [22], Sentinel-1 Precise Orbit Ephimeredes files downloaded from: https://qc.sentinel1.eo.esa.int/aux_poeorb/, and a Greenland-wide multi-year average (2016–2019) ice velocity mosaic, based on the monthly ice velocity products distributed by the Geological Survey of Denmark and Greenland (GEUS) within the Danish Programme for Monitoring of the Greenland Ice Sheet (PROMICE) [9]. These measurements were carried out with Sentinel-1 intensity offset tracking (cfr. Section 2.2), exploiting all available observations from 14 September 2016 to 17 June 2019, and are referred to as the PROMICE multi-year velocity mosaic throughout the remainder of this paper.
Validation of the core measurement techniques and of the final ice velocity mosaics was carried out using GPS measurements provided by the East Greenland Ice-core Project (EastGRIP). These cover transects both across and along the upstream part of NEGIS, as shown in Figure 1b. Additionally, measurements were collected for a 5 × 9 grid of stakes (spaced 2.5 km apart) just outside of the shear margin. The GPS measurements provide a range of velocities for validation between approximately 10–60 m/y and strain rates (i.e., velocity gradients) in the order of 10 3 y 1 near the NEGIS shear margin [23].

2.2. Intensity Offset Tracking

A reference offset tracking processing was carried out using the IPP processing software developed at the Technical University of Denmark [24]. Intensity data patches of size 256 × 64 (range × azimuth), corresponding to about 900 × 900 m on the ground, are selected on a regular grid of 40 × 10 pixels in the master SLC, corresponding to 560 × 560 m on the ground, and the corresponding patches in the slave SLC are located using the satellite orbits and a DEM. For each patch pair, the normalized 2D cross-correlation surface is calculated, and the position of the correlation peak is estimated with sub-pixel accuracy using FFT oversampling and a parabolic fit on a region surrounding the peak. Displacement estimates are accepted based on thresholds for the correlation (>0.05) and the signal-to-noise ratio (>7), i.e., the ratio of the peak to the surrounding correlation surface. These thresholds are the same used for the offset tracking processing within PROMICE and hence are not fine-tuned for this specific data set. The output is two offset maps (i.e., range and azimuth offsets), from which outliers are removed based on local medians using the approach described in [25]. Error estimates are generated by calculating the local standard deviation for each pixel in the displacement maps in a 5 × 5 neighborhood. Finally, the displacements and error estimates are scaled to velocity and geocoded to form slant range/azimuth velocity maps on a polar stereographic grid with 250 m spacing. The calculation of Cartesian velocity components is deferred to a later stage, as described in Section 2.5, since this allows to "fuse" measurements generated using different techniques and acquisition geometries.

2.3. Sentinel-1 TOPS Interferometry

2.3.1. Theoretical Background

Regardless of the SAR acquisition mode, for example, Stripmap or TOPS, the phase of a differential interferogram pixel Δ ϕ contains the following range- and azimuth-dependent contributions, respectively Δ ϕ r and Δ ϕ a :
Δ ϕ = Δ ϕ r + Δ ϕ a = 4 π λ v r Δ T + 2 π f D C Δ η
where λ is the radar wavelength, v r represents the range velocity component due to surface motion (positive towards the satellite), Δ T represents the time difference (temporal baseline) between acquisitions, f D C is the pixel’s Doppler centroid frequency, and Δ η represents the azimuth position difference (misregistration) expressed in time units, which is in turn given by:
Δ η = Δ η m o t i o n + Δ η o r b + Δ η i o n o
where Δ η m o t i o n is due to the underlying horizontal surface motion, and Δ η o r b and Δ η i o n o represent respectively the contributions of orbital uncertainties and ionospheric propagation. The azimuth motion contribution is related to the azimuth velocity component v a in an equivalent rectilinear geometry as follows:
Δ η m o t i o n = v a Δ T V r
where V r is an effective velocity [26], which is in the order of 7100 m/s for remote sensing satellites in near-polar orbit. Range and azimuth velocities are related to the 3D ice velocity vector, v = v x , v y , v z T as follows:
v r v a = cos θ cos ϕ cos θ sin ϕ sin θ sin ϕ cos ϕ 0 v x v y v z
where angles ϕ and θ describe the orientation of the line-of-sight (LoS) vector pointing from the pixel under consideration to the sensor, with the horizontal angle ϕ measured counter-clockwise from the y-axis of the map projection and the elevation angle θ measured from the ground to the LoS vector.
In the Stripmap case, f D C in Equation (1) is at most a few hundred Hz for current yaw-steered SARs, and its variations between adjacent pixels amount to a small fraction of a Hz, causing Δ ϕ a and its spatial gradient to be negligible compared to Δ ϕ r . However, for the TOPS acquisition mode, due to the azimuth antenna steering, the instantaneous Doppler centroid magnitude varies from Stripmap-like values at the burst center to as much as 2.6 kHz at the burst edges [16], where more importantly also a variation of up to 5.2 kHz occurs within one azimuth pixel. For a 6-day Sentinel-1 image pair, based on Equations (1)–(3), an azimuth motion v a of 10 m/y will cause a maximum intra-burst Δ ϕ a variation from 0.12 π rad at burst start to 0.12 π rad at burst end, as well as a phase jump of 0.24 π rad at the azimuth burst boundaries. If such a phase contribution were erroneously interpreted as being due to Δ ϕ r in Equation (1), this would lead to a maximum v r error of 0.2 m/y. Furthermore, as pixel phase differences approach +/ π , errors amounting to integer multiples of 2 π rad will arise in the unwrapped DInSAR phase, corresponding to integer multiples of 1.67 m/y in terms of v r . This example shows that even for slow moving ice sheet areas, with horizontal ice motion magnitudes in the order of a few tens of m/y, the contribution of the azimuth phase term in Equation (1) should not be neglected.
The rationale of the algorithm we describe in Section 2.3.2 is to estimate the misregistration due to Δ η m o t i o n in Equation (3) to reduce its contribution to Equation (1). The residual DInSAR phase can then be interpreted as being due to the range term Δ ϕ r alone, as for the Stripmap case, and scaled to yield the LoS velocity v r . As a by-product, azimuth velocity v a can also be accurately retrieved in the burst overlap regions.

2.3.2. Processing Algorithm

Our TOPS DInSAR algorithm is shown in Figure 2. Most steps are identical to those of a Stripmap DInSAR processor, albeit for a more complex coregistration approach detailed below. After image coregistration, the interferogram is formed from the mosaicked SLCs. We applied multilooking with a 15 × 3 averaging factor in range/azimuth (about 50 × 50 m on the ground) and a 10 × 2 decimation. Phase unwrapping is carried out using a Minimum Cost Flow algorithm with coherence-based weights [27], masking out results for areas with a coherence below 0.2. Finally, the unwrapped interferogram is scaled to yield a line-of-sight displacement map. A calibration is performed for each displacement map using the procedure described in Section 2.4 and Ground Control Points (GCPs) extracted from the PROMICE multi-year velocity mosaic (cfr. Section 2.1).
Coregistration is based on a resampling lookup table containing the range and azimuth slave SLC coordinates corresponding to each master SLC pixel. The lookup table is computed using precise orbits and a DEM, as in the Stripmap case [28], but also an external ice velocity mosaic, consisting of maps of the horizontal ice velocity components v x and v y . Within the processor, the latter are scaled to obtain the displacement between the master and slave acquisitions, and projected onto the azimuth dimension of the master SLC image using the second line in Equation (4). The resulting azimuth motion map is then used to refine the slave azimuth coordinates in the resampling lookup table.
Since external ice velocity mosaics are based on spatially and temporally averaged SAR and/or optical measurements [8,9,10,11], they could fail to account for temporal variations in the ice motion patterns and other dataset-specific sources of azimuth misregistration, such as ionospheric streak contributions [29]. These limitations could be avoided in principle by estimating the azimuth misregistration directly from the image pair at hand, using several available techniques. We investigated the use of offset tracking and MAI, as proposed respectively by [17,19], and of Burst-Overlap MAI (BO-MAI), the implementation of which is detailed in Appendix A. For Sentinel-1 data, however, we find that the measurement accuracy of MAI, and even more that of offset tracking, are too low to be beneficial and are influenced by a swath-dependent azimuth registration bias between the Sentinel-1A/B imagery, as detailed further in Appendix A. In contrast, an additional refinement based on BO-MAI, consisting of the steps within the dashed rectangle in Figure 2, was found to provide a slight improvement (< ± 0.1 m/y) compared to using the external ice velocity mosaic alone.
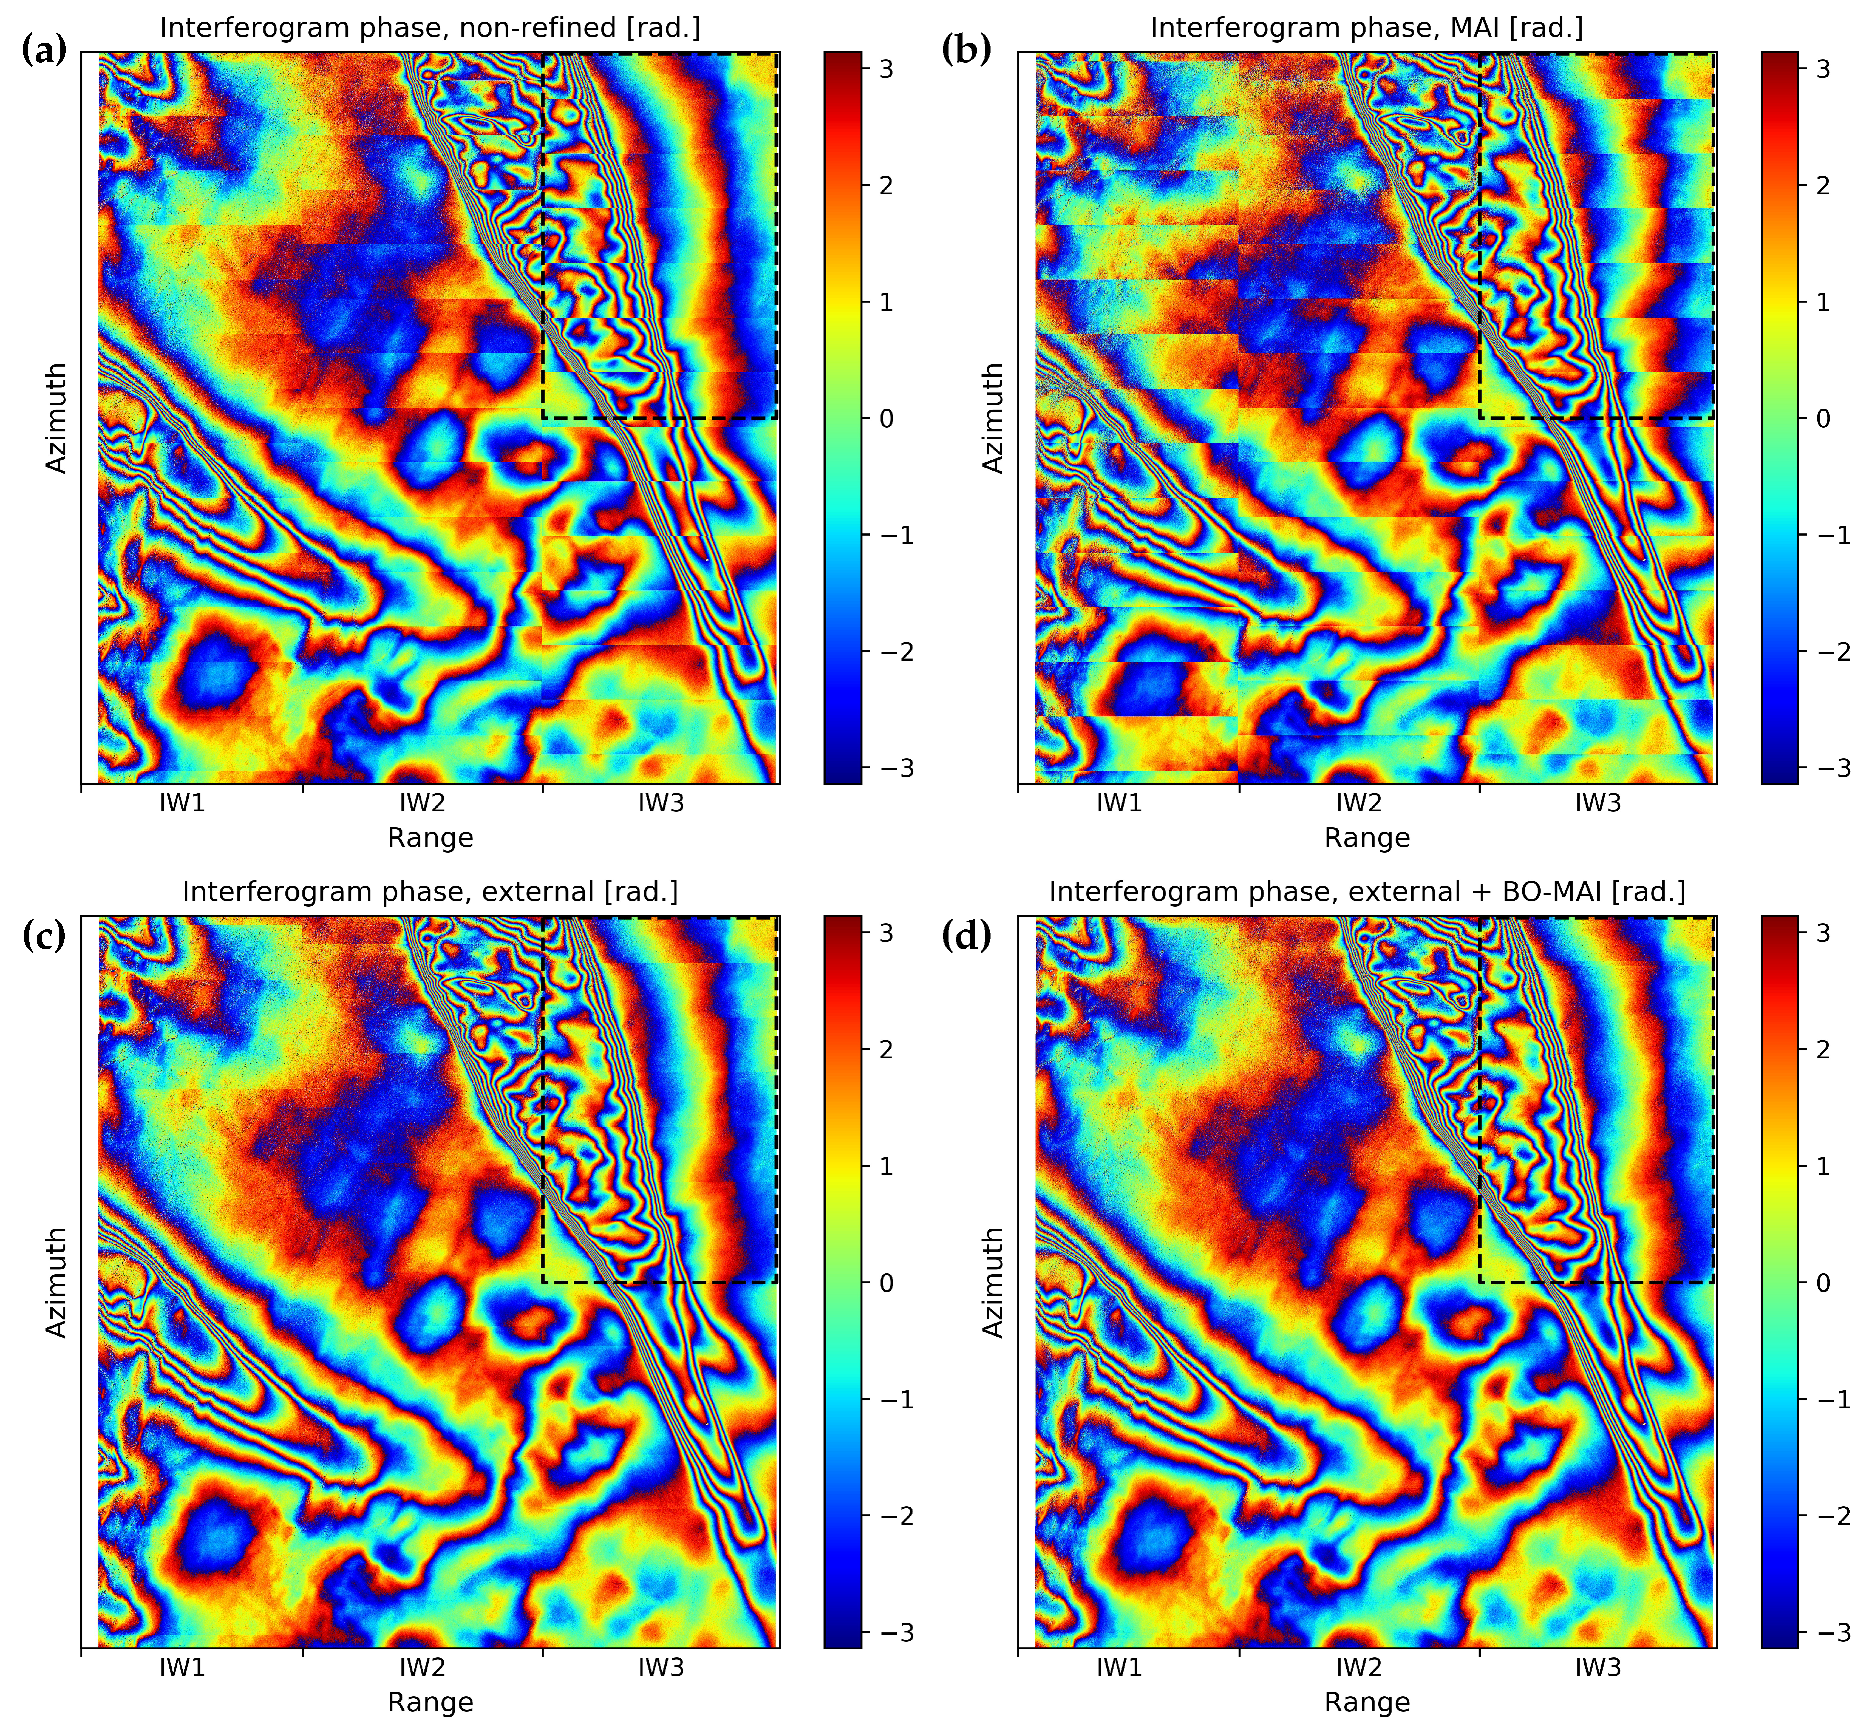
An application example of the above-mentioned coregistration approaches is shown in Figure 3. The wrapped DInSAR phase is shown in Figure 3a in the case of a Stripmap-like coregistration, based only on a DEM and precise orbits. Substantial phase jumps occur at almost every burst overlap, often exceeding 0.5–1.5 rad as seen in Figure 4a, which shows the average unwrapped azimuth phase gradient for sub-swath IW3. Locally the phase discontinuities may exceed several radians. Figure 3b shows the results when MAI azimuth velocity measurements (Figure A1c in Appendix A) are used to refine the coregistration. Surprisingly this worsens the phase discontinuities in the slow-moving areas of the ice sheet, which show roughly the same magnitude at each burst boundary (Figure 4b). This is due to a bias in the MAI and azimuth offset tracking measurements, when applied to S1A/S1B pairs, as discussed further in Appendix A. The effects of measurement noise, due to decorrelation, are also seen in the top-left area of Figure A1c, while compared to the non-refined coregistration, several phase jumps located on the fast-flowing ice stream are actually reduced. Figure 3c shows the case of a refined coregistration based on the PROMICE multi-year velocity mosaic described in Section 2.1. This approach almost completely eliminates the phase jumps seen in Figure 3a,b (as shown in Figure 4c). Applying an additional coregistration refinement based on BO-MAI azimuth velocity measurements (Figure A1d) results in only minor changes that are barely noticeable (Figure 3d and Figure 4d), albeit for the very first burst overlap in IW3. The case in which the azimuth coregistration is refined with intensity offset tracking measurements is not shown, since this yields very similar, although slightly noisier, results to those based on MAI, due to the similar properties of the azimuth velocity measurements provided by these methods (compare Figure A1b,c).
To assess the impact of the wrapped phase discontinuities on the final DInSAR measurements, the phase of the interferograms shown in Figure 3 was unwrapped and scaled to obtain LoS velocities. Figure 5 shows a subset of the LoS velocity map obtained from each of the interferograms shown in Figure 3, omitting the poorly-performing MAI refinement case. The bottom plot of Figure 5 shows the line-of-sight velocity across the profile indicated by a dashed line in the three velocity maps. While the inclusion of the BO-MAI coregistration refinement yields a velocity profile that is indiscernible from solely applying the external ice velocity mosaic refinement, the non-refined case shows discontinuities up to 1.5 m/y near the azimuth burst overlaps. For an underlying v a of 50 m/y, this is consistent with the discussion in Section 2.3.1. Note that in this case, the non-refined coregistration does not result in apparent phase unwrapping errors. In general, however, the unwrapping algorithm cannot be expected to reliably resolve phase ambiguities across the burst boundaries, and substantial unwrapping errors, leading to biases in the velocity measurements, may occur when applying the non-refined coregistration (see Figure S1 in the Supplementary Material).

2.4. Calibration and Error Estimation

Since DInSAR measures displacement relative to a reference point, namely the phase unwrapping seed, a calibration is required for each unwrapped interferogram in order to obtain absolute velocity estimates and to account for timing and orbit errors present in the radar data. The unknown absolute phase corresponds to a constant range offset, whereas orbit errors will result in slowly varying errors. In practice, it is difficult to separate the two effects, and we follow the approach in [30], modeling the unknown displacement as being due to a constant baseline error, and use GCPs to estimate the horizontal and vertical components of the error. Usually GCPs are selected in stationary areas (e.g., bedrock), but this approach has several problems with the present dataset. The region under consideration is an ice sheet bordered by steep mountainous terrain, with isolated bedrock areas separated by glaciers. The phase unwrapping algorithm is often not able to correctly unwrap across steep topography and ice/rock transitions, resulting in many of the stationary areas being prone to unwrapping errors. If GCPs are selected in such regions, the estimated velocity will be biased with respect to the ice-covered areas, affecting the overall calibration. Instead, we choose slow-moving GCPs on the ice sheet ( | v | <18 m/y, corresponding to 0.05 m/d) from the PROMICE multi-year mosaic (Section 2.1), under the assumption that the velocity in such areas does not vary significantly with time. The error estimate of the calibrated displacement for each pixel is also carried out as described in [30], based on the interferometric coherence and the uncertainties of the GCP height and velocity estimates. The selected GCPs are shown in Figure 1a.

2.5. Fusion of Velocity Measurements

Both DInSAR and intensity offset tracking measure the radar components of ice velocity, DInSAR providing only the range (LoS) component, v r , and offset tracking providing also the azimuth (along-track) component, v a . In order to calculate the horizontal components of the Cartesian velocity vector, v = v x , v y , v z T , we assume surface parallel flow, according to which v z = ( z x v x + z y v y ) [21], and use all available measurements (DInSAR, intensity offset tracking, or both) and Equation (4) to set up, for each output pixel, a weighted linear least squares problem, u = H v + ϵ , which can be stated as:
v r 1 v a 1 v r N v a N = cos θ 1 cos ϕ 1 + sin θ 1 z x cos θ 1 sin ϕ 1 + sin θ 1 z y sin ϕ 1 cos ϕ 1 cos θ N cos ϕ N + sin θ N z x cos θ N sin ϕ N + sin θ N z y sin ϕ N cos ϕ N v x v y + ϵ
where v r n is the measured LoS velocity from pair number n and v a n is the corresponding azimuth velocity (not available for DInSAR measurements). The angles ϕ n and θ n describe the LoS vector for the master image of pair number n (cfr. Equation (4)). The local height gradient at the pixel under consideration, ( z x , z y ) , is calculated numerically from the available DEM. The noise vector is assumed normally distributed with zero mean and diagonal covariance matrix Σ :
Σ = σ r 1 2 0 0 0 σ a 1 2 0 0 0 σ a N 2
with σ r n and σ a n indicating the estimated standard deviations of the range and azimuth measurements for pair n. The weighted least squares solution to this system is:
v ^ = ( H T Σ 1 H ) H T Σ 1 u
and the resulting covariance matrix of the estimate is H T Σ 1 H from which the error estimates for v ^ can be retrieved as the diagonal elements.
The formulation above implies that for each pair, both range and azimuth measurements are available, but in case only DInSAR products are available, u and H will contain only rows with LoS measurements, and H may become ill-conditioned if the contributing DInSAR pairs are acquired from nearly parallel tracks. In the absence of azimuth velocity measurements, we thus require both ascending and descending LoS measurements to produce a valid output.

3. Results

3.1. SAR-Based Ice Velocity Mosaics

The intensity offset tracking method described in Section 2.2 was applied to all 12-day image pairs available in Table 1, which amount to three pairs per track. We found this to be the most favorable data selection for offset tracking, since the ice motion contribution in a six-day time span is often below the noise floor of offset tracking measurements, especially in the slow-moving regions, and also due to azimuth and range measurement biases affecting S1A/S1B pairs (cfr. Section 4 and Appendix A). The resulting horizontal ice velocity magnitude within the Zwally 2.1 drainage basin is shown in Figure 6a. Figure 6b shows also a different intensity offset tracking result, based solely on range intensity offset tracking. The two offset tracking results are quite similar, although the following differences can be noticed: (a) the range/azimuth map (Figure 6a) shows an improved coverage, since a single ascending or descending track is sufficient to solve for the horizontal motion components in Equation (5), whereas an ascending/descending overlap is required for the range offset tracking case (Figure 6b); (b) the ionospheric streak contribution, for example, around (lat,lon)=(78N,42E), is absent in the range offset tracking mosaic (Figure 6b); (c) the latter shows a more prominent spatially-correlated noise pattern, particularly near the southern tip of the NEGIS, due to a known Level-1 processor block-processing effect affecting the range offsets, as discussed further in Section 4.
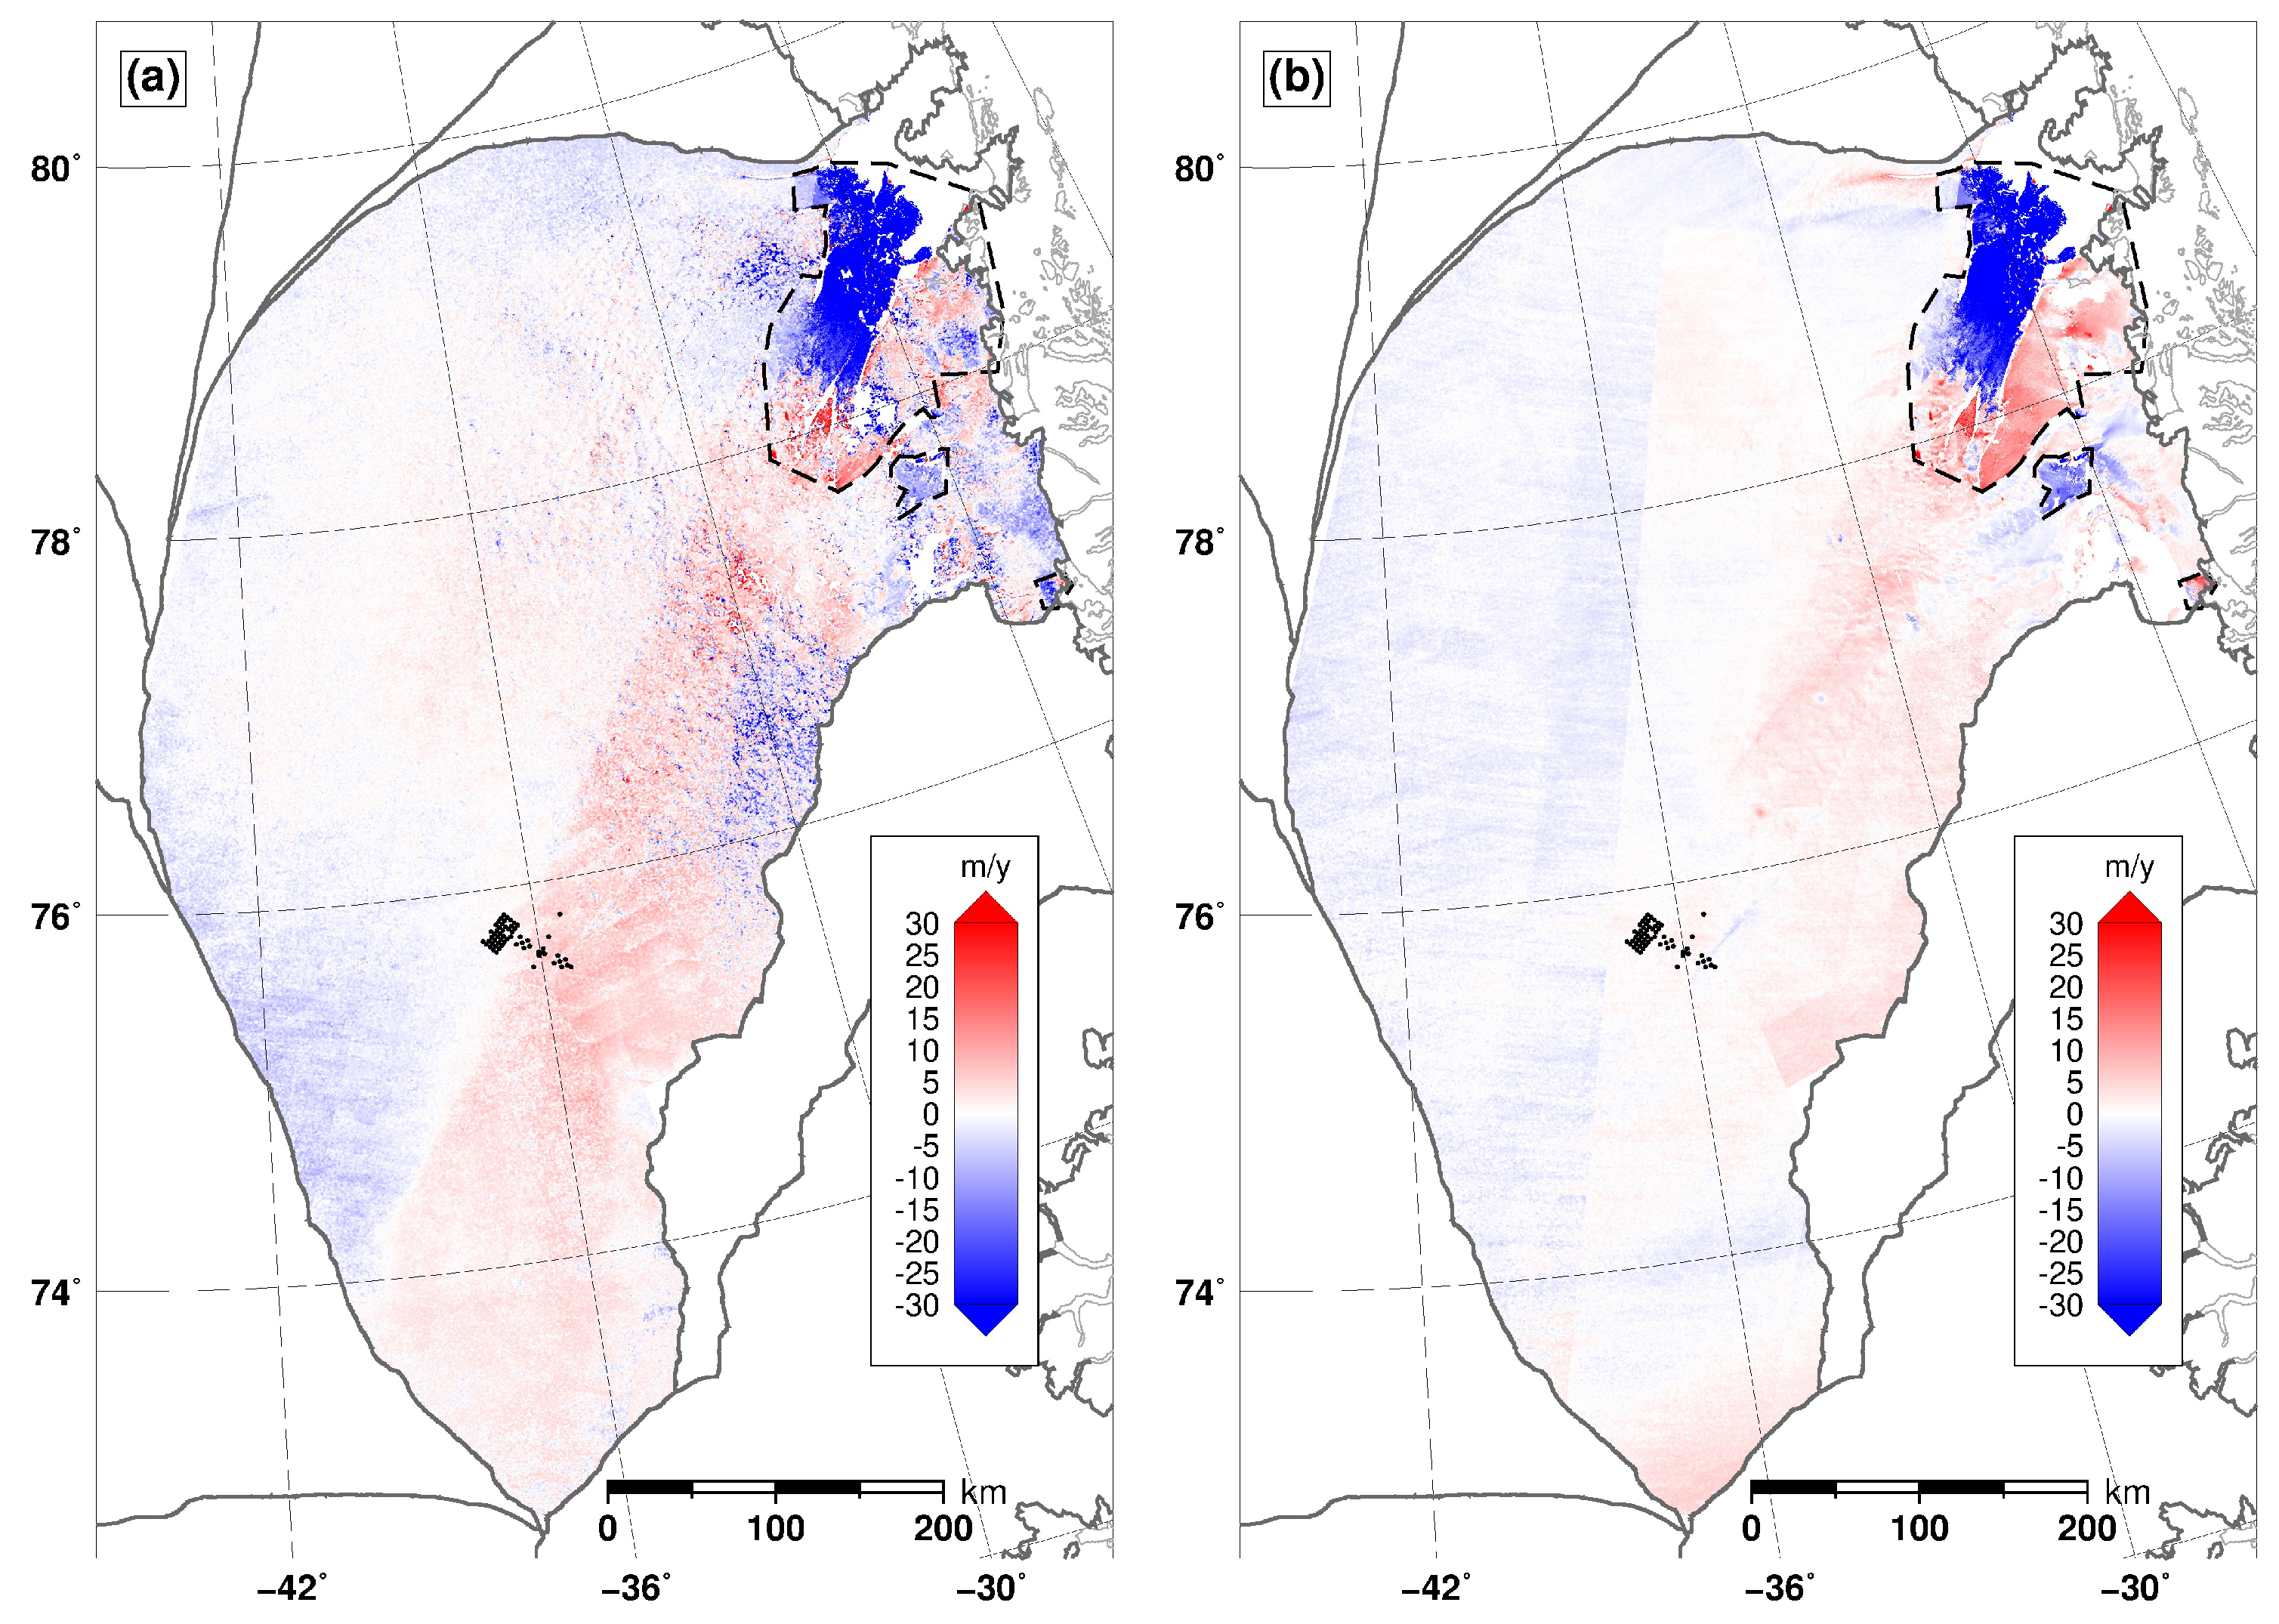
Figure 6c shows the velocity magnitude obtained using the TOPS DInSAR approach outlined in Section 2.3, applied to all available six-day pairs in Table 1, which amount to five image pairs per track. This is the most favorable data selection for DInSAR, since it maximizes the temporal coherence and reduces the fringe rate in fast-flowing regions, improving the phase unwrapping results. The azimuth coregistration refinement (illustrated in Figure 2) was carried out using the PROMICE multi-year velocity mosaic as an external ice velocity mosaic, whereas the BO-MAI refinement was omitted since its contribution in this area of interest was found to be below 0.1 m/y. Compared to the offset tracking results one immediately notes the improvement in resolution, particularly in slow-moving regions where a much smoother pattern is observed. The DInSAR velocity product resolution is about 50 × 50 m on the ground, while the resolution of the offset tracking velocity products is, at best, the 560 × 560 m posting of the measurements. The velocity pattern at the upstream part of NEGIS appears much better resolved in the DInSAR product: the two sub-streams that merge into NEGIS and are barely visible in the offset tracking results are clearly resolved by DInSAR. Moving further downstream of NEGIS, one observes the main limitation of DInSAR, namely that velocity cannot be retrieved reliably on fast-flowing outlet glaciers. In Figure 7, we show the difference in velocity magnitude as obtained by DInSAR and range/azimuth offset tracking (Figure 6a) as well as the difference between DInSAR and the PROMICE multi-year velocity mosaic. Large spatially-correlated differences in velocity magnitude of >30 m/y are observed towards the outlet glacier fronts, and represent the typical signature of phase unwrapping errors [30]. In order to reduce the effect of phase unwrapping errors in the final velocity product, we discarded the DInSAR results within the regions indicated by the dashed polygons in Figure 6c. These polygons were generated manually, based on the comparison between DInSAR and the PROMICE multi-year velocity mosaic (Figure 7b).
Figure 6d shows the final ice velocity magnitude mosaic obtained by the fusion of all DInSAR and range/azimuth intensity offset tracking measurements, as described in Section 2.5. In the interior parts, DInSAR dominates the fusion result, due to its lower standard deviation, and hence a velocity pattern that is virtually identical to Figure 6c is observed. In faster flowing regions, such as some shear margins and the outer parts of the outlet glaciers, the fusion with offset tracking significantly improves the measurement coverage compared to DInSAR alone. The final spatial resolution and accuracy of the ice velocity mosaic is spatially variable, and the uncertainties provided by the framework of Section 2.5 account for variations in the data coverage, as well as for the difference in accuracy between DInSAR and offset tracking. Mosaics of the 1- σ uncertainties associated with the horizontal velocity components, σ v x and σ v y , are shown in Figure S2.

3.2. Validation

As validation, we compare the horizontal ice velocity measurements from each of the four SAR-based ice velocity mosaics in Figure 6 to available velocity measurements from EastGRIP GPS stakes (see Section 2.1). The GPS and radar data are in the same polar stereographic projection, and we compare the two horizontal components ( v x and v y ) separately. The results of the GPS comparison are shown in Figure 8 and a summary of error statistics (where the error is computed as v S A R v G P S ) is provided in Table 2. For the offset tracking cases we note a slightly better (i.e., lower) standard deviation of Δ v x when applying only range offsets, while the Δ v y standard deviation is lower when including azimuth offsets. This is not surprising, as the x and y directions are roughly aligned with the radar range and azimuth directions, respectively, at polar latitudes. Figure 8 shows the results for the DInSAR-only case, corresponding to Figure 6c, since the fused ice velocity mosaic in Figure 6d leads to a virtually identical comparison at the GPS locations, due to DInSAR measurements dominating the weighted fusion in Equation (5). This is also noted in Table 2, where the difference in error statistics between DInSAR and the DInSAR/offset tracking fusion is seen to be negligible. As expected, the DInSAR results show a substantially better agreement with GPS, compared to offset tracking. The standard deviation for Δ v x and Δ v y is 0.18 and 0.44 m/y—respectively, a factor four and factor five better than what was obtained with intensity offset tracking. In terms of bias, i.e., the mean of Δ v x and Δ v y , the DInSAR results show values of virtually zero for the v x component and about 0.4 m/y for the v y component, which is in the order of the error standard deviation. The low biases indicate that the DInSAR calibration procedure, utilizing GCPs in slow-moving areas of the ice sheet, has been successful, at least for the region in the vicinity of the GPS locations. For the offset tracking cases, biases of 2.8 m/y in range and −5.2/−9.5 m/y in azimuth are observed. The individual range and azimuth offsets were not calibrated, as we found a calibration based on a slowly-varying polynomial to generally introduce more errors than it resolves. The bias and standard deviation for Δ v y is higher for range-only offset tracking due to the reduced sensitivity to motion in the y direction, which is roughly aligned with azimuth.
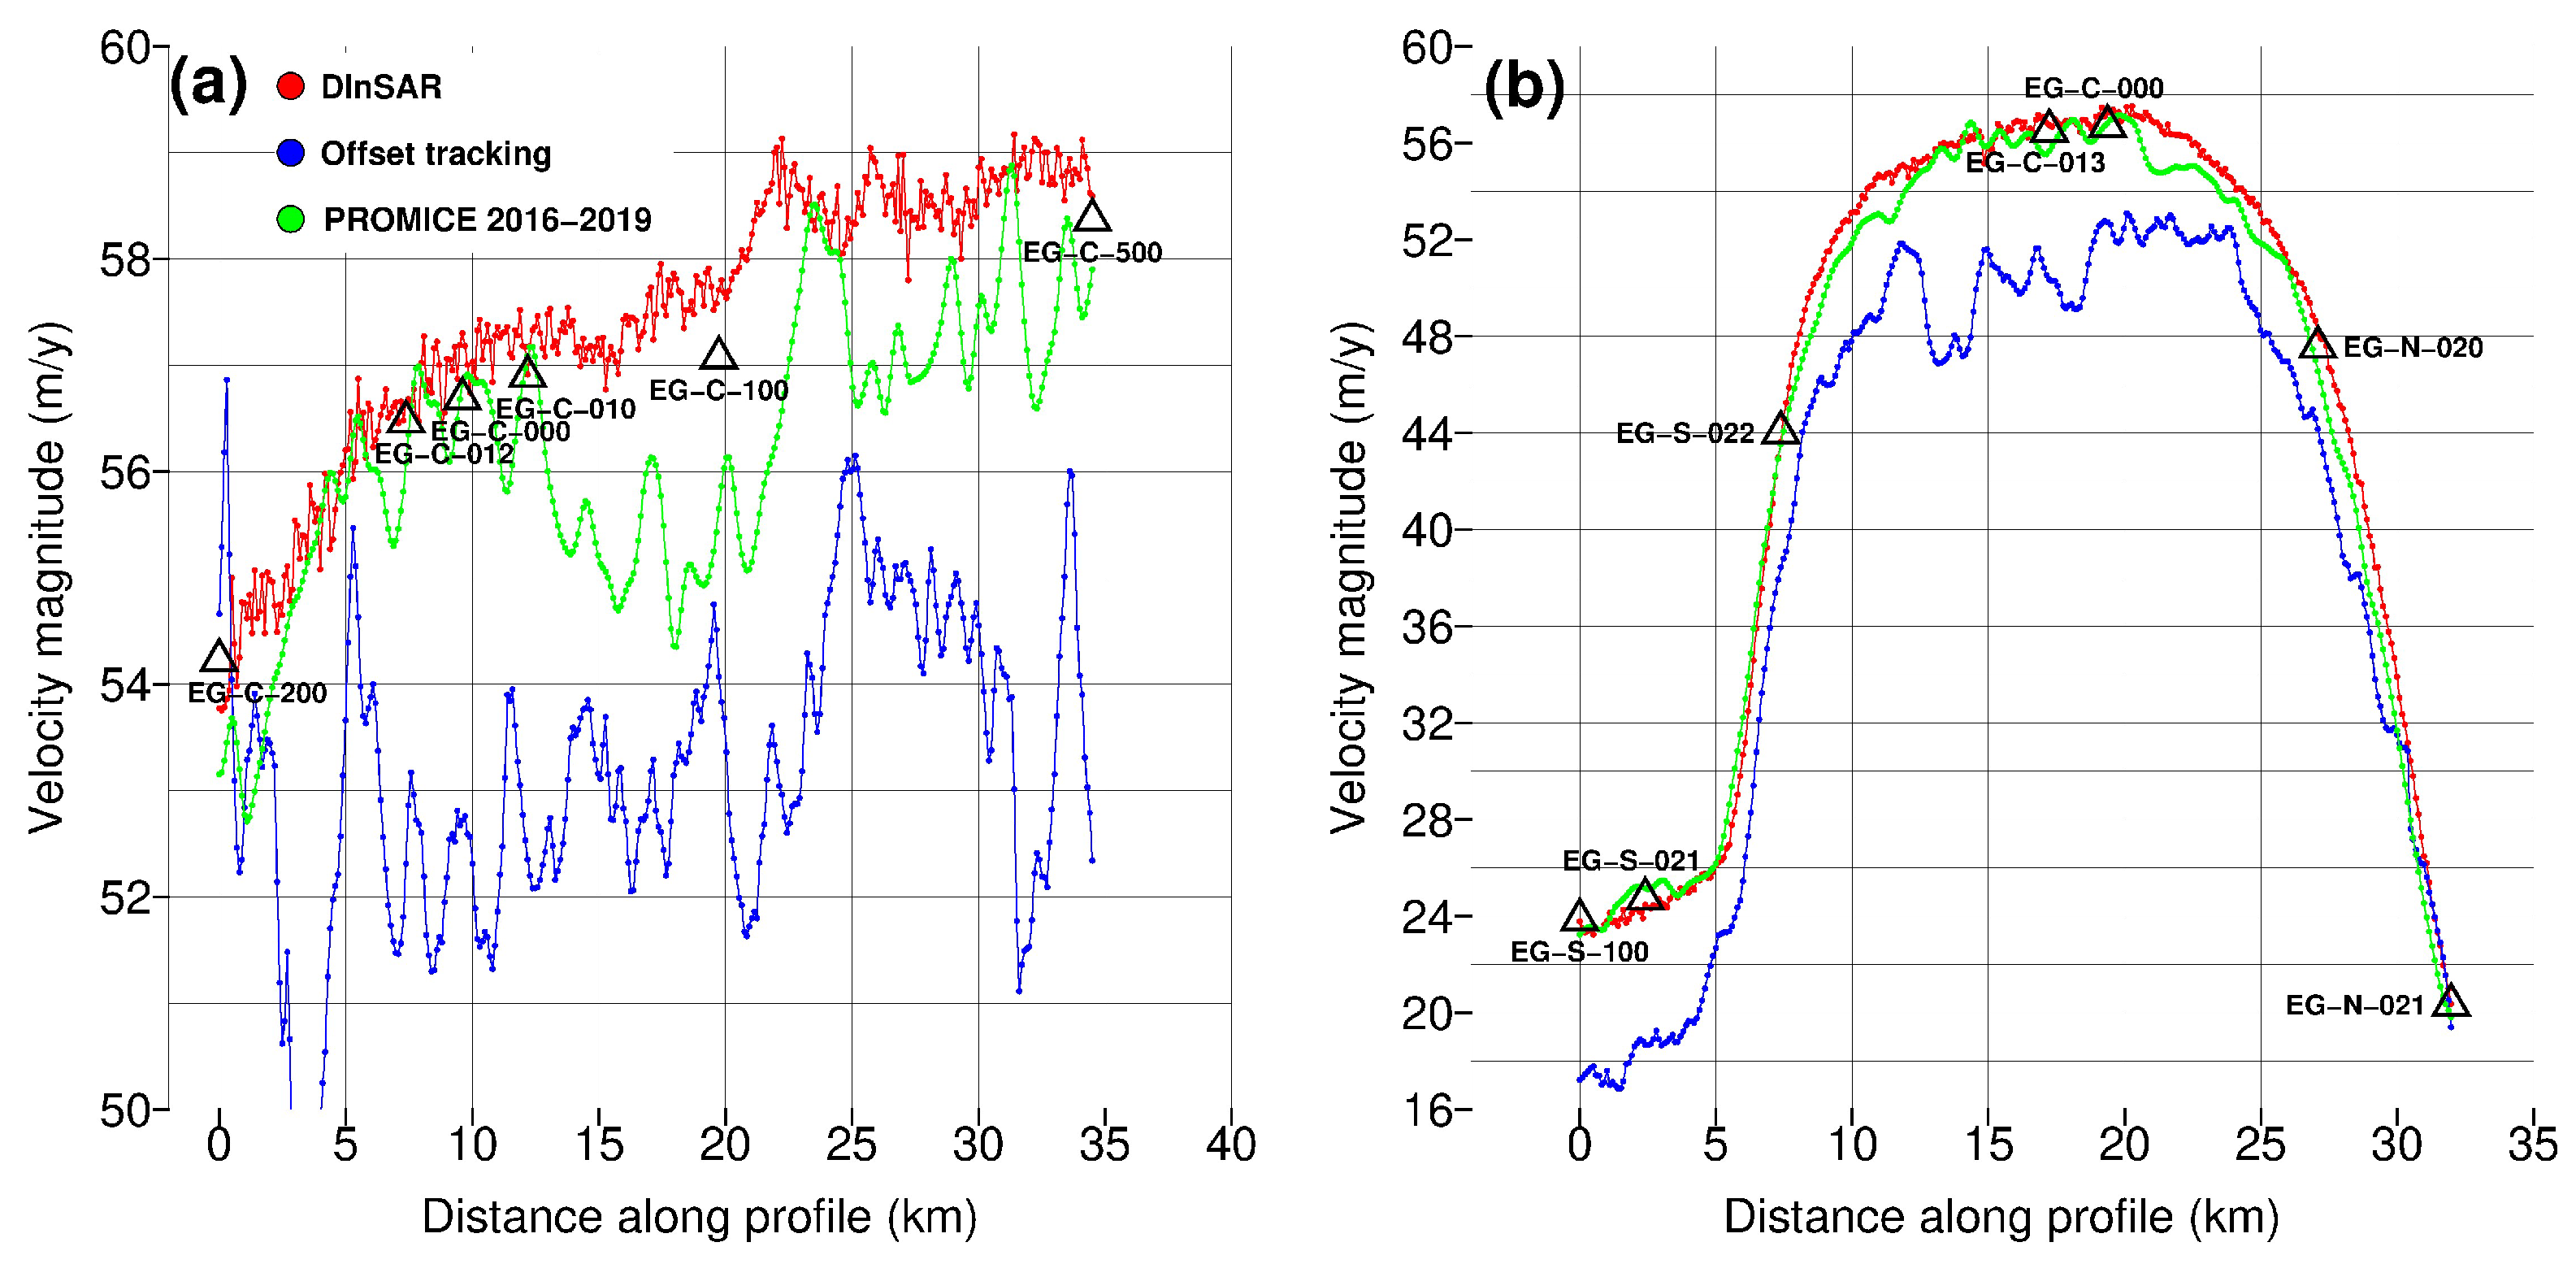
Figure 9 shows velocity magnitude profiles following the black and orange lines indicated in Figure 1b, for the range/azimuth offset tracking results (Figure 6a) and for DInSAR (Figure 6c) along with the PROMICE multi-year velocity mosaic. The profiles pass through several of the GPS locations and demonstrate the difference in terms of measurement bias between the DInSAR and offset tracking measurements (red and blue lines, respectively). Also, the difference in spatial resolution and error variance between the different processing methods is apparent, with the offset tracking measurements varying several m/y over very short distances, while the DInSAR measurements generally show a smoother pattern. To verify the quality of the azimuth motion information used to refine the DInSAR coregistration, we also compare the PROMICE multi-year velocities with the GPS data. Although these are also based on intensity offset tracking, measurements have been averaged over several years, thus showing a smaller variance compared to the campaign offset tracking case. Compared to DInSAR however, the PROMICE multi-year mosaic shows a worse agreement with the GPS (see Table 2) and a worse spatial resolution, as seen in Figure 9.

4. Discussion

We have demonstrated a DInSAR processing scheme for Sentinel-1 TOPS ice velocity retrieval over a large drainage basin in Northeast Greenland. As expected, TOPS DInSAR provides accurate high resolution measurements in the slower-moving regions of the ice sheet, while offset tracking must still be used to obtain measurements over fast-flowing outlet glaciers. In general, refinement of the azimuth coregistration using the external PROMICE multi-year velocity mosaic was successful in reducing phase discontinuities at burst boundaries. For some image pairs we noted residual phase discontinuities even after applying such a refinement (e.g., Figure S3c), most likely due to ionospheric effects and to small biases in the PROMICE multi-year product towards the ice sheet interior (cfr. Figure 7b). The BO-MAI refinement often succeeded in reducing such residual discontinuities (e.g., Figure S3d), although the impact on the resulting velocity measurements was small (∼0.1 m/y) in all the test cases we processed, which is why we denote BO-MAI as an optional step in our processing approach.
Aside from the improvement in spatial resolution and accuracy, the TOPS DInSAR velocity measurements also appear to be more immune to various data and/or processing artifacts affecting range and azimuth registration, but not the DInSAR phase. These include: (a) A sub-swath dependent bias (in the order of 15–30 m/y) affecting the MAI and azimuth offset tracking measurements from Sentinel-1A/1B or 1B/1A 6-day image pairs (see Appendix A); (b) An ∼10 m/y bias affecting range offset tracking measurements from Sentinel-1A/1B or 1B/1A 6-day image pairs (Figure S6c and Table S1, and Figure S8c and Table S3), which is consistent with the 15 cm average range misregistration observed between S1A and S1B SLC products in corner reflector experiments [31]; (c) An artifact observed in all range offset tracking measurements, presumably due to block-processing approximations of the Level-1 Sentinel-1 processor [32], which is the main cause of the "patchy" appearance of the slow-moving areas in the southern part of the Zwally 2.1 drainage basin in Figure 6a,b. Examples of the latter artifact are shown in Figures S6 and S8.
TOPS DInSAR velocity retrievals allow for improved analysis of ice dynamics and drainage. As the noise level in DInSAR retrievals is far lower than that obtained with offset tracking, it is generally not necessary to perform data stacking in order to achieve reliable velocity estimates. Hence, assuming frequent Sentinel-1 coverage, accurate velocity estimates can be generated on a sub-monthly time scale for the interior ice sheet, allowing for analysis with high spatial and temporal resolution, for example, monitoring intra-seasonal variations in ice dynamics. The improved ice velocity measurements also allow for improved estimates of strain rates in very high spatial and temporal resolution, thereby resolving the shear margins of fast flowing ice streams, where strain rates increase an order of magnitude over spatial scales of a few 100 m [23]. Ice velocity measurements are additionally applied in the evaluation of both surface mass balance (SMB) products and numerical ice sheet models. With more accurate estimates of the interior ice sheet velocity pattern, validation of SMB products and numerical ice sheet models becomes increasingly reliable [14,33,34].
The vast majority of the Greenland ice sheet moves with velocities <200 m/y and thus measurement accuracy and resolution could be greatly improved for ice sheet-wide velocity retrievals by routinely applying DInSAR along with intensity offset tracking. A pre-requisite to achieve DInSAR measurements of the quality described in this paper, is the availability of overlapping ascending and descending six-day acquisition pairs. In Greenland, this is currently limited to the winter acquisition campaigns and to areas of special interest, such as NEGIS, although the additional capacity provided by the forthcoming Sentinel-1C satellite could allow an increased availability of such data. From the processing point of view, the main challenges to be addressed in the design of an operational TOPS DInSAR/offset tracking processing scheme covering the entire Greenland ice sheet lie in (1) automatically discarding DInSAR measurements in areas prone to phase unwrapping errors; (2) consistently calibrating the DInSAR measurements; and (3) efficiently carrying out phase unwrapping of interferograms consisting of a large number of adjacent data slices, which can be challenging from the computational resource point of view, especially if network-based algorithms such as [27] are used.
A final note concerns the availability of external ice velocity mosaics to be used for the azimuth coregistration refinement in Figure 2. Although in this paper we relied on the PROMICE multi-year velocity mosaic, any Greenland-wide ice velocity mosaic of comparable accuracy could be used, such as those made available by [8,9,10,11]. If such a multi-year velocity mosaic is not available for a region of interest, one could in principle apply offset tracking (or MAI) to estimate the azimuth velocity prior to performing DInSAR. As mentioned in Section 2.3.2, however, the accuracy of offset tracking/MAI measurements based on only a single image pair was found to be too low to yield an adequate coregistration refinement. Hence, one would need to process an ensemble of acquisitions for the offset tracking/MAI azimuth velocity measurements to reach a noise level low enough to provide improvements over the simple geometric coregistration. Finally, since the fused DInSAR/offset tracking measurements show a better agreement with GPS compared to the PROMICE multi-year mosaic (cfr. Section 3.2), once the first ice sheet-wide velocity mosaics exploiting Sentinel-1 TOPS DInSAR are generated, these can be used as improved external ice velocity mosaics for the coregistration refinement within subsequent data processing.

5. Conclusions

Ice velocity measurements are frequently used for a host of different glaciological and climatological applications. With the launch of the Sentinel-1 satellites, the scientific community has been provided with an extensive SAR data coverage of the polar ice sheets. The contribution of this study is to demonstrate how the Sentinel-1 TOPS data archive can be further exploited by applying DInSAR processing in ice velocity retrieval. We present ice velocity measurements for the Zwally 2.1 Greenland drainage basin, applying TOPS DInSAR in the interior and intensity offset tracking over fast-flowing outlet glaciers. In comparison with available GPS measurements, the DInSAR ice velocity retrieval shows an accuracy that is four times better than that obtained by offset tracking, with standard deviations of 0.18 and 0.44 m/y in the x and y directions, respectively. Furthermore, the resolution of the DInSAR measurements are about 50 × 50 m on the ground, which is an order of magnitude better than what can be obtained with offset tracking.
In our DInSAR processing approach, image coregistration is refined by applying a correction in azimuth based on an external ice velocity mosaic and optionally an additional correction in burst overlaps using BO-MAI. With this refined coregistration approach, the TOPS-specific DInSAR challenges mainly related to phase discontinuities at the burst boundaries are overcome and the resulting DInSAR measurements are affected by the same coherence and phase unwrapping limitations that apply to Stripmap-mode DInSAR. Concerning the routine application of the method presented in this paper to the entire Greenland ice sheet, the main challenges lie in the integration of DInSAR and offset tracking measurements in areas which are more prone to phase unwrapping errors, and in the calibration of the DInSAR measurements. Also, these challenges, however, are well-known and are actually simplified compared to the Stripmap case, due to the wide coverage of the TOPS acquisition mode.

Supplementary Materials

The following are available online at https://www.mdpi.com/2072-4292/12/12/2014/s1, Figure S1: Line-of-sight velocity unwrapping error demonstration, Figure S2: 1 σ uncertainties for the fused DInSAR and offset tracking mosaic, Figure S3: Wrapped interferograms demonstrating capabilities of BO-MAI coregistration refinement, Figure S4: Azimuth phase gradient for IW2 in S3, Figure S5: Azimuth velocity for descending image pair, Figure S6: Line-of-sight velocity for descending image pair, Figure S7: Azimuth velocity for ascending image pair, Figure S8: Line-of-sight velocity for ascending image pair, Table S1: GPS comparison for descending image pair, Table S2: Bias estimates for descending image pair, Table S3: GPS comparison for ascending image pair, Table S4: Bias estimates for ascending image pair.

Author Contributions

Conceptualization, J.P.M.B., J.K.A., and A.K.; methodology, J.K.A., J.P.M.B., and A.K.; software, A.K., and J.K.A.; validation, J.K.A., A.K., J.P.M.B., C.S.H., and A.G.; data curation, A.K., C.S.H., and A.G.; paper writing: J.K.A., J.P.M.B., A.K., and C.S.H. All authors have read and agreed to the published version of the manuscript.

Funding

This research was funded by DTU Space, Technical University of Denmark.

Acknowledgments

The PROMICE multi-year ice velocity mosaic was generated by Anne M. Solgaard, GEUS. Sentinel-1 data is provided by the EU Copernicus Programme, and processed by ESA. The GAMMA Remote Sensing and Consulting software [35,36] was used to build a prototype of the TOPS DInSAR processing scheme presented in Figure 2. This prototype processor was also used to generate the examples shown in Figure 3, Figure 4 and Figure 5. The DTU Space inhouse interferometric processing software (IPP) was then used to build an operational TOPS DInSAR processor (currently omitting the additional BO-MAI refinement), which in turn was used to generate the results presented in Figure 6, Figure 7, Figure 8 and Figure 9. All plots in geographic coordinates were created with the Generic Mapping Tools software Version 5.4.3 [37].

Conflicts of Interest

The authors declare no conflict of interest.

Appendix A. Azimuth Ice Velocity Measurements with Sentinel-1

The methods available to measure azimuth ground motion with Sentinel-1 TOPS data include: offset tracking, either based on coherence maximization [38] or on image amplitude as described in Section 2.2; Spectral Diversity, also known as MAI [39,40]; the method referred to in this paper as BO-MAI [41,42,43]. The latter two techniques exploit Δ ϕ a in Equation (1), by generating the following double-difference interferogram, the phase Δ ϕ M A I of which is given by:
Δ ϕ M A I = arg ( M u S u * ) ( M l S l * ) *
where * denotes the complex conjugate, M and S denote master and slave SLC, and u and l denote forward- and backward-squinted acquisitions, respectively. An estimate of the azimuth misregistration Δ η in Equation (2) is given by:
Δ η = Δ ϕ M A I 2 π ( f u f l )
where f u and f l are the azimuth center frequencies of the forward- and backward-squinted SLCs, respectively. In MAI, the latter are generated via azimuth band-pass filtering of the master and slave acquisitions, exploiting the limited available azimuth bandwidth, which is about 325 Hz [16]. BO-MAI instead is applicable only within the azimuth burst overlap regions, where it exploits the large Doppler frequency separation created by the azimuth antenna steering. This varies between 4.4 kHz and 5.2 kHz depending on the image sub-swath [16], and thus provides a sensitivity to azimuth motion, which is an order of magnitude higher compared to MAI based on Equation (A2).
For the MAI implementation, the master and slave SLC images were deramped (i.e., basebanded), following the procedure described in [44], prior to band-pass filtering to generate forward- and backward-looking azimuth sub-bands. These were selected to have a bandwidth of 162 Hz (i.e., half the available azimuth bandwidth) each and a frequency separation of 162 Hz. The MAI processing approach described in [45] was then used, generating a full-resolution MAI interferogram and multi-looking with a factor of 20 × 5 in range and azimuth respectively, corresponding to 70 × 70 m on the ground. Finally, an adaptive phase filtering was carried out [46], with filter strength parameter α = 0.8 and spectral estimation window size of 64 × 64 in range and azimuth, respectively. Phase unwrapping was not carried out since for Sentinel-1 6-day image pairs, azimuth velocities would have to be larger than 1300 m/y in order to require phase unwrapping, and for such high displacements loss of coherence would hinder the retrieval of meaningful measurements anyway.
BO-MAI was implemented by forming the double-difference interferogram from the forward and backward squinted acquisitions for each azimuth burst overlap. A multi-looking of 12 × 3 in range/azimuth was applied (corresponding to about 50 × 50 m on the ground), followed by an adaptive filtering [46] with filter strength α = 0.8 and spectral estimation window size of 8 × 8 in range/azimuth. The term ( f u f l ) in Equation (A2) was computed as the local difference in the instantaneous Doppler centroid frequencies within the burst overlap. Due to the much larger frequency separation in Equation (A2), ice motion of about 40 m/y is sufficient to cause the BO-MAI phase for a 6-day pair to exceed π rad, which would require phase unwrapping even for slow moving regions of the ice sheet. To avoid this delicate processing step, we generate the double-difference interferogram in Equation (A1) after applying the external ice-velocity mosaic to refine the coregistration lookup table, as shown in Figure 2. This removes the bulk of the azimuth motion contribution, so that BO-MAI can be applied to the residual interferometric phase without the need for unwrapping. The final azimuth velocity estimate is obtained by adding back the motion contribution from the external ice velocity mosaic to the BO-MAI measurements.
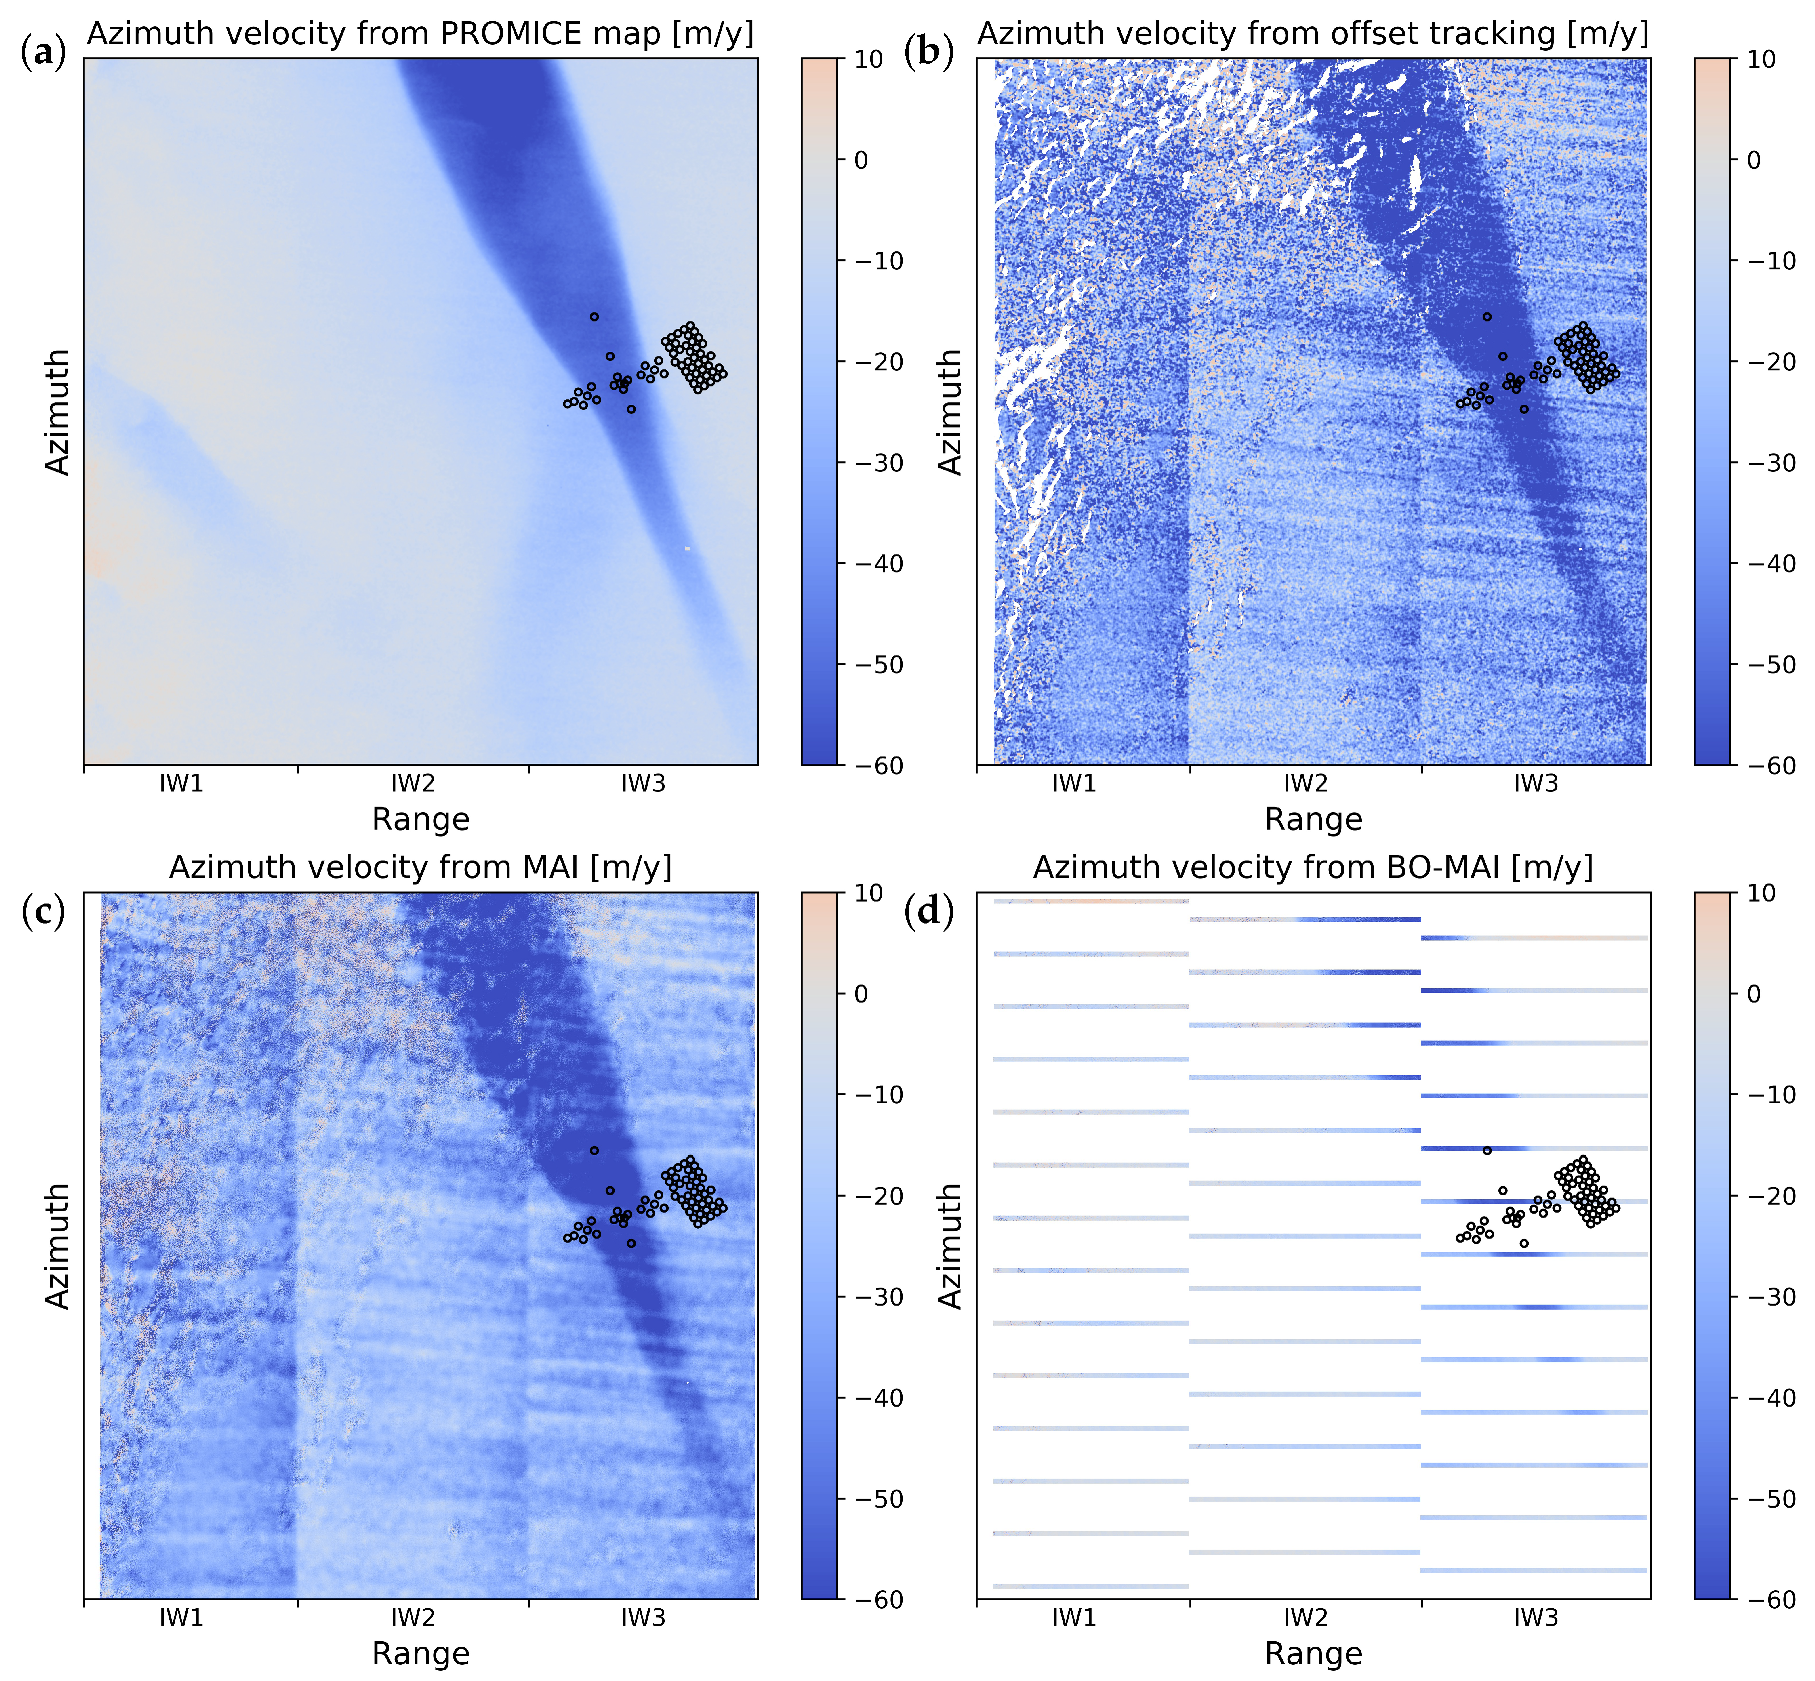
Figure A1 presents azimuth velocity measurements for the scene shown in Figure 3, which have been derived from the azimuth projection of the PROMICE multi-year mosaic (a), intensity offset tracking (b), MAI (c), and BO-MAI (d). The BO-MAI measurements are spatially discontinuous, since they can only be carried out in the burst overlap regions, and clearly show the best agreement with the PROMICE multi-year mosaic. All measurements based on a single image pair, namely Figure A1b–d, are clearly affected by ionospheric streaks [29], which are instead significantly reduced in the PROMICE multi-year mosaic (Figure A1a) due to temporal and spatial averaging. A substantial part of the scene also shows significant loss of coherence for the MAI and offset tracking cases. Table A1 presents a comparison between each of the azimuth velocity retrievals shown in Figure A1 and the azimuth projection of the available GPS velocity measurements. The BO-MAI approach shows an accuracy that is comparable to the PROMICE multi-year mosaic, despite being based on only a single image pair (note also that only seven GPS measurements are co-located with burst overlaps for this image pair). Offset tracking and MAI are seen to yield substantially poorer accuracy, with standard deviations being in the order of 10 m/y.
Offset tracking and MAI also show an unexpected swath-dependent bias compared to BO-MAI and to the PROMICE multi-year mosaic, which is confirmed by the GPS comparison shown in Table A1. A similar azimuth bias was observed for all the processed 6-day pairs (Table 1), i.e., pairs consisting of one image from Sentinel-1A and one from Sentinel-1B, whereas it was never observed for 12-day pairs, i.e., S1A-S1A or S1B-S1B pairs (Figures S5 and S7). The magnitude of the bias depends on the sub-swath and was found to be between 15 and 30 m/y for 6-day image pairs, based on the average differences with respect to the PROMICE multi-year mosaic (see Table A2). The sign of the bias changes depending on whether the master image was acquired from Sentinel-1A or -1B (cfr. Figure S7, Tables S3 and S4), suggesting that it is caused by a relative azimuth misregistration between the S1A and S1B SLC products. Indeed our findings are consistent with the corner reflector experiment described in [31], which reports an average azimuth misregistration of 39 cm between S1A and S1B SLC products, based on reflectors located mainly within sub-swath IW1 and partly within IW2. This corresponds to an azimuth velocity bias of 23.7 m/y for a 6-day temporal baseline.
Concerning DInSAR, the use of the MAI measurements in Figure A1c within the coregistration refinement step in Figure 2 surprisingly increases the phase-discontinuities at the burst boundaries (Figure 3b) compared to a purely geometric coregistration approach (Figure 3a). Such discontinuities are instead reduced by using the azimuth-projected PROMICE multi-year mosaic (Figure A1a) and BO-MAI (Figure A1d), as shown in Figure 3c,d, respectively. A possible interpretation is that the S1A/S1B SLC azimuth misregistration bias concerns only the image amplitude, namely the observable in the corner reflector experiments and in intensity offset tracking, but not the image phase, which is the observable in BO-MAI and in DInSAR. The reason for observing this bias with MAI, which is also a phase-based technique, could be due to the effect of band-pass filtering, which creates a coupling between the existing amplitude misregistration and the interferometric phase.
Figure A1. Azimuth velocity in radar geometry obtained from (a) re-projection of the PROMICE multi-year velocity mosaic; (b) azimuth intensity offset tracking on a single Sentinel-1 image pair; (c) Multi-Aperture Interferometry on a single Sentinel-1 image pair; and (d) Burst-Overlap Multi-Aperture Interferometry on a single Sentinel-1 image pair. The measurements in (bd) are obtained from the same image pair shown in Figure 3, Figure 4 and Figure 5. Black circles indicate GPS locations.
Remotesensing 12 02014 g0a1
Table A1. GPS comparison statistics for the azimuth velocities shown in Figure A1. Columns show mean and standard deviation of Δ v a z , which indicates the difference in velocity between SAR and GPS measurements in m/y. 61 co-located GPS and SAR measurements were used in each case, except for BO-MAI, as only 7 GPS measurements lay inside burst overlaps.
Method Δ v az Mean Δ v az Std.
PROMICE multi-year (offset tracking)0.910.72
Azimuth offset tracking−22.0213.63
Multi-Aperture Interferometry (MAI)−18.248.92
Burst-Overlap MAI (BO-MAI)−0.791.10
Table A2. Mean difference in azimuth velocity for each sub-swath between the offset tracking, MAI, and BO-MAI results in Figure A1b–d and the PROMICE multi-year mosaic in Figure A1a. All values are in m/y.
Δ v az Mean
MethodIW1IW2IW3
Offset tracking (6-day)−29.94−16.80−19.65
MAI (6-day)−26.20−13.63−15.02
BO-MAI (6-day)−1.131.110.73

References

  1. Shepherd, A.; Ivins, E.; Rignot, E.; Smith, B.; van den Broeke, M.; Velicogna, I.; Whitehouse, P.; Briggs, K.; Joughin, I.; Krinner, G.; et al. Mass balance of the Greenland Ice Sheet from 1992 to 2018. Nature 2020, 579, 233–239. [Google Scholar] [CrossRef]
  2. Box, J.E.; Colgan, W.T.; Wouters, B.; Burgess, D.O.; O’Neel, S.; Thomson, L.I.; Mernild, S.H. Global sea-level contribution from Arctic land ice: 1971–2017. Environ. Res. Lett. 2018, 13, 125012. [Google Scholar] [CrossRef] [Green Version]
  3. Gray, A.; Mattar, K.; Vachon, P.; Bindschadler, R.; Jezek, K.; Forster, R.; Crawford, J. InSAR results from the RADARSAT Antarctic Mapping Mission data: Estimation of glacier motion using a simple registration procedure. In Proceedings of the IGARSS ’98. Sensing and Managing the Environment, 1998 IEEE International Geoscience and Remote Sensing (Cat. No.98CH36174), Seattle, WA, USA, 6–10 July 1998; Volume 3, pp. 1638–1640. [Google Scholar] [CrossRef]
  4. Strozzi, T.; Luckman, A.; Murray, T.; Wegmüller, U.; Werner, C.L. Glacier motion estimation using SAR offset-tracking procedures. IEEE Trans. Geosci. Remote Sens. 2002, 40, 2384–2391. [Google Scholar] [CrossRef] [Green Version]
  5. Goldstein, R.M.; Engelhardt, H.; Kamb, B.; Frolich, R.M. Satellite radar interferometry for monitoring ice sheet motion: Application to an Antarctic ice stream. Science 1993, 262, 1525–1530. [Google Scholar] [CrossRef]
  6. Merryman Boncori, J.P.; Langer Andersen, M.; Dall, J.; Kusk, A.; Kamstra, M.; Bech Andersen, S.; Bechor, N.; Bevan, S.; Bignami, C.; Gourmelen, N.; et al. Intercomparison and Validation of SAR-Based Ice Velocity Measurement Techniques within the Greenland Ice Sheet CCI Project. Remote Sens. 2018, 10, 929. [Google Scholar] [CrossRef] [Green Version]
  7. De Zan, F.; Guarnieri, A.M. TOPSAR: Terrain observation by progressive scans. IEEE Trans. Geosci. Remote Sens. 2006, 44, 2352–2360. [Google Scholar] [CrossRef]
  8. Nagler, T.; Rott, H.; Hetzenecker, M.; Wuite, J.; Potin, P. The Sentinel-1 mission: New opportunities for ice sheet observations. Remote Sens. 2015, 7, 9371–9389. [Google Scholar] [CrossRef] [Green Version]
  9. PROMICE Scientific Data Portal: Sentinel-1 Greenland Ice Velocity, produced by GEUS and DTU Space. Available online: http://www.promice.org/PromiceDataPortal/ (accessed on 22 July 2019).
  10. Joughin, I.; Smith, B.E.; Howat, I.M. A complete map of Greenland ice velocity derived from satellite data collected over 20 years. J. Glaciol. 2018, 64, 1–11. [Google Scholar] [CrossRef] [Green Version]
  11. Mouginot, J.; Rignot, E.; Scheuchl, B.; Millan, R. Comprehensive annual ice sheet velocity mapping using Landsat-8, Sentinel-1, and RADARSAT-2 data. Remote Sens. 2017, 9, 364. [Google Scholar] [CrossRef] [Green Version]
  12. Mouginot, J.; Rignot, E.; Scheuchl, B. Continent-wide, interferometric SAR phase, mapping of Antarctic ice velocity. Geophys. Res. Lett. 2019, 46, 9710–9718. [Google Scholar] [CrossRef]
  13. Mouginot, J.; Rignot, E.; Bjørk, A.A.; van den Broeke, M.; Millan, R.; Morlighem, M.; Noël, B.; Scheuchl, B.; Wood, M. Forty-six years of Greenland Ice Sheet mass balance from 1972 to 2018. PNAS 2019, 116, 9239–9244. [Google Scholar] [CrossRef] [PubMed] [Green Version]
  14. Smith-Johnsen, S.; De Fleurian, B.; Schlegel, N.; Seroussi, H.; Nisancioglu, K. Exceptionally high heat flux needed to sustain the Northeast Greenland Ice Stream. Cryosphere 2020, 14, 841–854. [Google Scholar] [CrossRef] [Green Version]
  15. Prats-Iraola, P.; Scheiber, R.; Marotti, L.; Wollstadt, S.; Reigber, A. TOPS Interferometry with TerraSAR-X. IEEE Trans. Geosci. Remote Sens. 2012, 50, 3179–3188. [Google Scholar] [CrossRef] [Green Version]
  16. Yague-Martinez, N.; Prats-Iraola, P.; Gonzalez, F.R.; Brcic, R.; Shau, R.; Geudtner, D.; Eineder, M.; Bamler, R. Interferometric Processing of Sentinel-1 TOPS Data. IEEE Trans. Geosci. Remote Sens. 2016, 54, 1–15. [Google Scholar] [CrossRef] [Green Version]
  17. Scheiber, R.; Jager, M.; Prats-Iraola, P.; De Zan, F.; Geudtner, D. Speckle tracking and interferometric processing of TerraSAR-X TOPS sata for mapping nonstationary scenarios. IEEE J. Sel. Top. Appl. Earth Obs. Remote Sens. 2014, 8, 1709–1720. [Google Scholar] [CrossRef] [Green Version]
  18. Sánchez-Gámez, P.; Navarro, F.J. Glacier surface velocity retrieval using D-InSAR and offset tracking techniques applied to ascending and descending passes of sentinel-1 data for southern ellesmere ice caps, Canadian Arctic. Remote Sens. 2017, 9, 442. [Google Scholar] [CrossRef] [Green Version]
  19. Scheuchl, B.; Mouginot, J.; Rignot, E.; Morlighem, M.; Khazendar, A. Grounding line retreat of Pope, Smith, and Kohler Glaciers, West Antarctica, measured with Sentinel-1a radar interferometry data. Geophys. Res. Lett. 2016, 43, 8572–8579. [Google Scholar] [CrossRef] [Green Version]
  20. Zwally, J.H.; Giovinetto, M.B.; Beckley, M.A.; Saba, J.L. Antarctic and Greenland Drainage System. 2012. Available online: https://icesat4.gsfc.nasa.gov/cryo_data/ant_grn_drainage_systems.php (accessed on 22 July 2019).
  21. Joughin, L.R.; Kwok, R.; Fahnestock, M.A. Interferometric estimation of three-dimensional ice-flow using ascending and descending passes. IEEE Trans. Geosci. Remote Sens. 1998, 36, 25–37. [Google Scholar] [CrossRef] [Green Version]
  22. Rizzoli, P.; Martone, M.; Gonzalez, C.; Wecklich, C.; Tridon, D.B.; Bräutigam, B.; Bachmann, M.; Schulze, D.; Fritz, T.; Huber, M.; et al. Generation and performance assessment of the global TanDEM-X digital elevation model. ISPRS J. Photogramm. Remote Sens. 2017, 132, 119–139. [Google Scholar] [CrossRef] [Green Version]
  23. Hvidberg, C.S.; Grinsted, A.; Dahl-Jensen, D.; Khan, S.A.; Kusk, A.; Andersen, J.K.; Neckel, N.; Solgaard, A.; Karlsson, N.B.; Kjær, H.A.; et al. Surface velocity of the Northeast Greenland Ice Stream (NEGIS): Assessment of interior velocities derived from satellite data by GPS. Cryosphere Discuss. 2020, 2020, 1–27. [Google Scholar] [CrossRef]
  24. Kusk, A.; Boncori, J.; Dall, J. An automated system for ice velocity measurement from SAR. In Proceedings of the 12th European Conference on Synthetic Aperture Radar (EUSAR 2018), Aachen, Germany, 4–7 June 2018; pp. 929–932. [Google Scholar]
  25. Westerweel, J.; Scarano, F. Universal outlier detection for PIV data. Exp. Fluids 2005, 39, 1096–1100. [Google Scholar] [CrossRef]
  26. Cumming, I.G.; Wong, F.H. Digital Processing of Synthetic Aperture Radar Data: Algorithms and Implementation; Artech House: Norwood, MA, USA, 2005. [Google Scholar]
  27. Mario Costantini, T. A novel phase unwrapping method based on network programming. IEEE Trans. Geosci. Remote Sens. 1998, 36, 813–821. [Google Scholar] [CrossRef]
  28. Sansosti, E.; Berardino, P.; Manunta, M.; Serafino, F.; Fornaro, G. Geometrical SAR image registration. IEEE Trans. Geosci. Remote Sens. 2006, 44, 2861–2870. [Google Scholar] [CrossRef]
  29. Gray, A.L.; Mattar, K.E.; Sofko, G. Influence of Ionospheric Electron Density Fluctuations on Satellite Radar Interferometry. Geophys. Res. Lett. 2000, 27, 1451–1454. [Google Scholar] [CrossRef]
  30. Mohr, J.J.; Boncori, J.P.M. An error prediction framework for interferometric SAR data. IEEE Trans. Geosci. Remote Sens. 2008, 46, 1600–1613. [Google Scholar] [CrossRef]
  31. Gisinger, C.; Balss, U.; Breit, H.; Schubert, A.; Garthwaite, M.; Small, D.; Gruber, T.; EinedeR, M.; Fritz, T.; Miranda, N. Recent Findings on the Sentinel-1 Geolocation Accuracy Using the Australian Corner Reflector Array. In Proceedings of the 2018 IEEE International Geoscience and Remote Sensing Symposium, Valencia, Spain, 22–27 July 2018; pp. 6356–6359. [Google Scholar]
  32. De Zan, F.; German Aerospace Center, Oberpfaffenhofen, Germany. Personal Communication, 2019.
  33. Hvidberg, C.S.; Keller, K.; Gundestrup, N.S.; Tscherning, C.C.; Forsberg, R. Mass balance and surface movement of the Greenland ice sheet at summit, Central Greenland. Geophys. Res. Lett. 1997, 24, 2307–2310. [Google Scholar] [CrossRef]
  34. Mottram, R.; Simonsen, S.; Høyer Svendsen, S.; Barletta, V.; Sørensen, L.; Nagler, T.; Wuite, J.; Groh, A.; Horwath, M.; Rosier, J.; et al. An Integrated View of Greenland Ice Sheet Mass Changes Based on Models and Satellite Observations. Remote Sens. 2019, 11, 1407. [Google Scholar] [CrossRef] [Green Version]
  35. Werner, C.; Wegmüller, U.; Strozzi, T.; Wiesmann, A. GAMMA SAR and Interferometric Processing Software; (Special Publication) ESA SP; European Space Agency: Frascati, Italy, 2000. [Google Scholar]
  36. Wegmüller, U.; Werner, C.; Strozzi, T.; Wiesmann, A.; Frey, O.; Santoro, M. Sentinel-1 Support in the GAMMA Software. Procedia Comput. Sci. 2016, 100, 1305–1312. [Google Scholar] [CrossRef] [Green Version]
  37. Wessel, P.; Smith, W.H.F.; Scharroo, R.; Luis, J.; Wobbe, F. Generic Mapping Tools: Improved Version Released. Eos Trans. Am. Geophys. Union 2013, 94, 409–410. [Google Scholar] [CrossRef] [Green Version]
  38. Derauw, D. DInSAR and Coherence Tracking Applied to Glaciology: The Example of Shirase Glacier; (Special Publication) ESA SP; European Space Agency: Frascati, Italy, 2000. [Google Scholar]
  39. Scheiber, R.; Moreira, A. Coregistration of interferometric SAR images using spectral diversity. IEEE Trans. Geosci. Remote Sens. 2000, 38, 2179–2191. [Google Scholar] [CrossRef]
  40. Bechor, N.B.; Zebker, H.A. Measuring two-dimensional movements using a single InSAR pair. Geophys. Res. Lett. 2006, 33, L16311. [Google Scholar] [CrossRef] [Green Version]
  41. Grandin, R.; Klein, E.; Métois, M.; Vigny, C. Three-dimensional displacement field of the 2015 Mw8.3 Illapel earthquake (Chile) from across- and along-track Sentinel-1 TOPS interferometry. Geophys. Res. Lett. 2016, 43, 2552–2561. [Google Scholar] [CrossRef] [Green Version]
  42. Jiang, H.; Feng, G.; Wang, T.; Bürgmann, R. Toward full exploitation of coherent and incoherent information in Sentinel-1 TOPS data for retrieving surface displacement: Application to the 2016 Kumamoto (Japan) earthquake. Geophys. Res. Lett. 2017, 44, 1758–1767. [Google Scholar] [CrossRef] [Green Version]
  43. Jiang, H.J.; Pei, Y.Y.; Li, J. Sentinel-1 TOPS interferometry for along-track displacement measurement. In Proceedings of the IOP Conference Series: Earth and Environmental Science, Beijing, China, 16–17 May 2017; p. 012019. [Google Scholar] [CrossRef] [Green Version]
  44. Miranda, N. Definition of the TOPS SLC Deramping Function for Products Generated by the S-1 IPF (Technical Note COPE-GSEG-EOPG-TN-14-0025, Issue 1, Rev. 3); Technical Report; European Space Agency: Frascati, Italy, 2017. [Google Scholar]
  45. Merryman Boncori, J.P.; Pezzo, G. Measuring the north–south coseismic displacement component with high-resolution multi-aperture InSAR. Terra Nova 2015, 27, 28–35. [Google Scholar] [CrossRef]
  46. Goldstein, R.M.; Werner, C.L. Radar interferogram filtering for geophysical applications. Geophys. Res. Lett. 1998, 25, 4035–4038. [Google Scholar] [CrossRef] [Green Version]
Figure 1. (a) Sentinel-1 tracks processed in this study (black rectangles), Zwally drainage basins [20] (dark blue polygons and numbers), GPS measurements used for validation (black dots), and Ground Control Points used for the calibration described in Section 2.4 (gray triangles). (b) Zoom of the area located within the dashed rectangle in panel a, containing the EastGRIP GPS measurements (circles). (c) Area of interest for this study, shown in panel a. In all panels the color scale represents the Programme for Monitoring of the Greenland Ice Sheet (PROMICE) multi-year velocity mosaic described in Section 2.1.
Remotesensing 12 02014 g001
Figure 2. Block diagram showing the interferometric processing chain for a single Sentinel-1 Terrain Observation by Progressive Scans (TOPS) image pair.
Remotesensing 12 02014 g002
Figure 3. Wrapped DInSAR phase in radar geometry obtained using no azimuth coregistration refinement (a); a refinement based on Multi-Aperture Interferometry (MAI) (b); on the PROMICE multi-year velocity mosaic (c); and on the PROMICE multi-year velocity mosaic followed by Burst-Overlap (BO)-MAI (d). The dashed black rectangle indicates the region investigated in Figure 5. (Master/slave acquisitions: 22 December 2019 (S1A)/ 28 December 2019 (S1B), track: 112 descending)
Remotesensing 12 02014 g003
Figure 4. Average azimuth gradient of the unwrapped interferogram phase in sub-swath IW3 for each of the four processing approaches presented in Figure 3, i.e. using no azimuth coregistration refinement (a); a refinement based on Multi-Aperture Interferometry (MAI) (b); on the PROMICE multi-year velocity mosaic (c); and on the PROMICE multi-year velocity mosaic followed by Burst-Overlap (BO)-MAI (d). The dashed red lines indicate the location of azimuth burst overlaps, while the dashed black lines indicate the region investigated in Figure 5.
Remotesensing 12 02014 g004
Figure 5. TOPS DInSAR line-of-sight velocity in radar geometry for the region within the dashed rectangle in Figure 3 obtained using no coregistration refinement (a), a refinement based on the PROMICE multi-year velocity mosaic (b), and on the PROMICE multi-year velocity followed by BO-MAI (c). Panel (d) shows line-of-sight and azimuth velocity (purple dashed line and right y-axis) along the profile indicated by the dashed line in (ac). Azimuth velocities are based on the PROMICE multi-year mosaic.
Remotesensing 12 02014 g005
Figure 6. Horizontal velocity magnitude for Zwally drainage basin 2.1 [20] (dark blue polygons) based on (a) range/azimuth intensity offset tracking, (b) range intensity offset tracking, (c) the TOPS DInSAR approach presented in this paper, (d) the fusion (weighted average) of DInSAR and range/azimuth intensity offset tracking. The dashed polygons in panel (c) enclose DInSAR results that were discarded (cfr. Section 4) and not used in the generation of the fused result shown in panel (d).
Remotesensing 12 02014 g006
Figure 7. Velocity magnitude difference between: (a) DInSAR and range/azimuth offset tracking results (Figure 6c,a, respectively) (b) DInSAR and the PROMICE multi-year velocity mosaic (Figure 1a). The dashed polygons enclose DInSAR results that were discarded (cfr. Section 4). GPS measurements used for validation are shown as black dots. Zwally drainage basins [20] are traced in gray.
Remotesensing 12 02014 g007
Figure 8. GPS comparison for the two horizontal velocity components v x (left column) and v y (right column) obtained via range/azimuth offset tracking (top row), range/range offset tracking (middle row), and DInSAR (bottom row). 61 GPS retrievals, acquired by EastGRIP, were used.
Remotesensing 12 02014 g008
Figure 9. Velocity magnitude profiles for DInSAR (Figure 6c), range/azimuth offset tracking (Figure 6a), and the PROMICE multi-year mosaic (Figure 1a) along the black line (a) and the orange line (b) in Figure 1b.
Remotesensing 12 02014 g009
Table 1. Overview of Sentinel-1 image pairs processed for the Zwally 2.1 drainage basin test case. In the case of DInSAR, every available 6-day pair from the listed cycles (i.e., 5 image pairs per track) was used, while all available 12-day pairs were used in offset tracking processing (3 image pairs per track).
TrackOrbitCyclesAcquisition Dates
31AscendingA: 188, 189, 190/B: 118, 119, 12016 December 2019–15 January 2020
54DescendingA: 188, 189, 190/B: 118, 119, 12018 December 2019–17 January 2020
74AscendingA: 188, 189, 190/B: 118, 119, 12019 December 2019–18 January 2020
83DescendingA: 188, 189, 190/B: 118, 119, 12020 December 2019–19 January 2020
89AscendingA: 188, 189, 190/B: 118, 119, 12020 December 2019–19 January 2020
112DescendingA: 188, 189, 190/B: 118, 119, 12022 December 2019–21 January 2020
170DescendingA: 188, 189, 190/B: 118, 119, 12026 December 2019–25 January 2020
Table 2. GPS comparison statistics. Columns show mean and standard deviation of Δ v x and Δ v y , which indicate the difference in velocity between SAR and GPS measurements, for each of the horizontal velocity components in m/y. 61 co-located GPS and SAR measurements were used in each case.
Method Δ v x Mean Δ v x Std. Δ v y Mean Δ v y Std.
PROMICE 2016–2019−0.510.31−0.830.74
OTR (range/azimuth)2.800.80−5.222.31
OTR (range only)2.800.77−9.532.64
DInSAR only0.000.18−0.410.44
DInSAR+OTR (range/azimuth)0.020.18−0.470.44