Article

Romanian Natura 2000 Network: Evaluation of the Threats and Pressures through the Corine Land Cover Dataset

1
Faculty of Geography and Geology, Alexandru Ioan Cuza University, 700506 Iasi, Romania
2
Faculty of Biology, Alexandru Ioan Cuza University, 700506 Iasi, Romania
3
Integrated Center of Environmental Science Studies in the North Eastern Region—CERNESIM, ‘Alexandru Ioan Cuza’ University of Iasi, 11 ‘Carol I’ Blvd., 700506 Iasi, Romania
*
Author to whom correspondence should be addressed.
Remote Sens. 2020, 12(13), 2075; https://doi.org/10.3390/rs12132075
Submission received: 13 May 2020 / Revised: 25 June 2020 / Accepted: 25 June 2020 / Published: 28 June 2020

Abstract

:
The present paper aims to evaluate if the Natura 2000 sites in Romania are placed over dynamic areas from a land cover changes perspective, or if they are placed in areas with low human interest and what the impact of these changes are. The effectiveness of conservation measures was addressed by analyzing the number of land cover changes and their areas in Natura 2000 sites, before and after declaring them as protected areas. Corine Land Cover (CLC) data were used as a tool to identify threats and pressures from each Natura 2000 site, and also assess whether land cover changes are more frequent in sites with a high biodiversity index, compared to those with low diversity, in order to estimate the conservation status. Changes in the land cover during 1990–2018 are characterized by three types of events, from 1990 to 2000 with most changes recorded, followed by a relative period of stability from 2000 to 2012; the most dynamic period is from 2012 to 2018. The main changes are due to deforestation. Only 29.7% ROSCI (Romanian Sites of Community Importance) and 36.5% ROSPA (Romanian Special Protected Areas) sites are characterized by a good degree of conservation without or with low modifications regarding the land cover. The most frequent threats and pressures that were found through CLC changes in the ROSCIs in Romania are related to forestry, grazing, the extent of the urbanized environment and those related to agriculture. The correspondence between Corine Land Cover and Natura 2000 specific threats and pressures emphasizes new guidelines for the Corine Land Cover program; therefore, this correspondence can be a potential tool to get more information for Natura 2000 sites.

Graphical Abstract

1. Introduction

Romania is a country with significant surfaces of pristine forests and rich fauna, and these resources must be protected at all levels. The first protected areas in the country were created in the 19th century in order to preserve the game; there were hunting reserves, but since then, the number of reserves and their surface increased continuously. Before 2007, the year of Romanian admission to the European Union (EU), the total surface occupied by nature reserves, national and natural parks represented only 5.85% of the country’s surface, and after the implementation of the Birds and Habitats Directives, all of these protected areas were integrated into Natura 2000 Network alongside the new designated sites.
Romania has great biogeographic diversity among all EU states, provided that Romania hosts five biogeographic regions across its territory: continental, alpine, panonic, pontic (only in Romania and Bulgaria), and steppe (only in Romania). The Natura 2000 sites naming system involves two aspects: the first two letters represent the country code (i.e., FR, for France; or RO, for Romania), followed by characters, representing the type of site (SCI—Sites of Community Importance; SPA—Special Protection Areas for birds), while the letters at the end of each site, represents a unique identifier number code. Currently, Romania has over 600 European reserves: Romanian Sites of Community Importance (ROSCI—435) and Romanian Special Protected Areas for birds (ROSPA—171) distributed in all biogeographical regions in the country, representing 26.04 % of country’s total surface (ROSPA—3875298 ha, ROSCI—4650819 ha). Furthermore, Romanian SCI represent 4.69% from European SCI and Romanian SPA comprises 5.1% from European SPA.
Although satellite imagery can provide information on various climatic phenomena [1,2,3] or various forms of pollution [4,5], their most widespread use is land cover. Corine Land Cover (CLC) is a cartographic product that was initiated in the European Union and was created for working with many different environmental issues. Its inventory has 44 classes. The database offers information about the land cover and the fact that the dataset is available for a considerable period of time, can be an important starting point, concerning the land cover analysis, but also for identifying the impact these changes can have on the environment. Cartographic material was generated according to specific guidelines across all member states [6], in order for the resulting data to be as homogenous, as possible for the entire European Union. The base satellite imagery, from which Corine Land Cover vector layers were drawn, consists of LANDSAT 5 MSS/TM (for 1990 layer), LANDSAT 7 ETM (for 2000 vector), SPOT-4/5 and IRS P6 LISS III imagery (2006), IRS P6 LISS III and RapidEye (2012), and lastly, Sentinel 2 and LANDSAT 8, for the 2018 layer [7].
Studies regarding CLC were conducted in many countries across Europe on different themes, and the results can offer a clearer picture of the transformations, or the dynamics of this type of changes. The driving forces of land use/land cover changes are set off by the social, economic and political processes embedded in human societies that may include changes in population or consumption that result in different land resource demands, changes in technology, government policies, or economic conditions [8]. Pelorosso mentions that the trend for Mediterranean mountain landscape (Italy) shows a considerable reduction in meadowland landscape [9], due to woodland recovery after land abandonment, and an increase of urban areas. Changes like this caused the loss of large areas of traditional landscape. Cieślak has managed to demonstrate for two provinces in the north-eastern region of Poland, that the land fragmentation can also be traced through CLC dataset, and can be correlated with the economic terms [10]. Monitoring the evolution of the forest areas can also be performed at a European scale, based on the information provided by CLC, in order to develop a sustainable forest management system [11]. In Romania, Kucsicsa analyzed two main periods regarding the land cover/land use changes, 1990–2000 and 2000–2006, and highlighted that the period following the fall of the communist regime in 1989 (largely overlapping with the so-called transition period), was characterized by a series of fundamental political and socioeconomic transformations, which triggered significant structural and functional changes in land cover [12]. The fact that these changes could be identified on CLC datasets, which were drawn in several stages (CLC 1990, 2000, 2006, 2010, 2016), can be related to a series of tendencies regarding the dynamics of land cover. Furthermore, Grigorescu also mentions the main factors that have driven most changes after 1989: political aspects, demographic indicators, as well as natural factors [13]. Land cover, through its dynamics, can also influence the proper functioning of some ecosystems; therefore, it can have direct or indirect effects on biodiversity.
For the European Union, a sustainable approach regarding biodiversity is at the forefront of Natura 2000 Network, which has a very important role in promoting the conservation of natural habitats of flora and fauna species, but without excluding populated communities and local economic activities [14,15]. The importance of Natura 2000 is underlined by Pullin, who highlights the fact that this network appeared as a necessity in fulfilling the objectives of reducing species and habitat loss [15]. The fact that economic activities are allowed in the proximity of the sites, or even inside the sites, can induce a series of problems related to the habitats, but one of the main aims of this network is to find a middle ground from which neither the biodiversity nor the economic activities are impaired. When it comes to agricultural activities and their impact on biodiversity, two aspects are noted: they are considered the main risk affecting biodiversity at a global level [16], but also the support for sustaining biological communities [17,18].
Agricultural techniques are becoming increasingly more destructive, as the methods are devoted mainly to an increase in productivity [19]; the intensity of biodiversity threats induced by agriculture is extremely high in the 27 member states of the European Union (EU-27), where agricultural fields comprise 47.4% of the land area [20]. Studies regarding the land cover changes over biodiversity were conducted in the UK, where the results showed that changes recorded within the Natura 2000 sites suggest that they are generally well protected, and that they change less than the surrounding landscape [21]. In Romania, Petrișor mentions that the transitional dynamics affecting all natural protected areas consists mainly in deforestation and reforestation and, to a lesser extent, agriculture (abandonment and development), waters and wetlands (floods and draughts), and man-dominated systems (urbanization) [22]. However, the natural protected areas situated in the mountain region are affected more by deforestation, while those in the plain areas, by urbanization. Besides floods and draughts, different types of land cover categories are also affected through water quality changes [23]. These change-inducing hydrological phenomena are mostly studied and validated through satellite imagery and remote sensing techniques [24].
The aim of this study is to highlight if the conservation measures are effective, by analyzing the statistical results and the surfaces of land cover changes in Natura 2000 sites, before and after the protection status change, ascertaining whether the CLC dataset is a useful tool for the identification of threats and pressures in each site, and investigating whether the changes are more frequent in the sites that had a protection status before the accession to Natura 2000 program, than in those which just received the conservation status.

2. Materials and Methods

2.1. Materials

The materials used for this study are the CLC and Natura 2000 databases. The CLC project is a European project which highlights the land cover dynamics at European scale. In general, this project has a regular update time period of approximately six years. CLC data are available on the website of the European platform Copernicus [25], a platform managed by the European Environment Agency. This data is in digital vector format (shapefiles) and consists of polygons, with a corresponding table of attributes, that contains the characteristics of land cover types.
The vector data is quantified in two sets, a dataset containing the polygons with the land cover type corresponding to each year (1990, 2000, 2006, 2012, 2018), and a dataset that contains the polygons with the land cover changes between 1990–2000, 2000–2006, 2006–2012 and 2012–2018 periods.
Corine Land Cover is a hierarchical classification system. Therefore, the classification consists in three hierarchical levels (level 1—5 classes; level 2—15 classes; and level 3—44 classes. See Table 1). Level 3 corresponds to a spatial scale of 1:100000.
The boundaries of Natura 2000 sites have been downloaded from the Romanian Ministry of Environment website [26]. The data are in digital vector format (shapefiles), and contains the polygons of the protected sites. Additionally, the boundaries of natural and national parks and protected areas (according to the International Union for Conservation of Nature (IUCN) classification), legislated at national level, were downloaded in digital vector format. The digital vector files with the boundaries of the protected areas and sites contain attribute tables regarding the name and type of protected areas and sites and their area.
Due to Romania’s accession to the European Union, environmental legislation has been aligned with the national approval of European legislation, such as the Habitats Directive 92/43/EEC and the Birds Directive 2009/147/EC. Therefore, from a legislative point of view, Natura 2000 sites are described in the standard forms, available on the website of the Romanian Ministry of Environment [27]. The standard form for each Natura 2000 site contains the following information: geographic location, ecological information (such as habitat types, list of species according to Article 4 of Directive 2009/147/C and Annex II of Directive 92/43/EEC), a brief geographical and socio-economical description, the anthropogenic impact (pressures and threats).
The list of pressures and threats used in the study is in accordance with Article 17 of the Habitats Directive, which is a standard list required for reporting information on anthropogenic impact in the area of Natura 2000 sites. This list is hierarchical and contains four classification levels: level 1—14 categories; level 2—75 categories; level 3—209 categories; level 4—112 categories. These categories of pressures and threats are useful in establishing conservation measures and also for monitoring the impact level on protected habitats and species within Natura 2000 sites. The pressures and threats categories of level 1 are: A—Agriculture, B—Forestry, C—Extraction of resources, D—Energy production processes and related infrastructure development, E—Development and operation of transport systems, F—Development, construction and use of residential, commercial, industrial and recreational infrastructure and areas, G—Extraction and cultivation of biological living resources (other than agriculture and forestry), H—Military action, public safety measures, and other human intrusions, I—Alien and problematic species, J—Mixed source pollution, K—Human-induced changes in water regimes, L—Natural processes (excluding catastrophes and processes induced by human activity or climate change), M—Geological events, natural catastrophes, N—Climate change [28].

2.2. Methodology

According to Corine Land Cover (CLC) methodology, the Minimum Mapping Unit (MMU) for land cover polygons is 25 hectares, and 100 meters in width for sprawling polygons (e.g., road infrastructure, rivers etc.). For polygons that represent the change of land cover, from one period to another, the MMU is 5 ha. In order to be able to confront both of the data sources, CLC and Natura 2000, the MMU rule has also been applied for Natura 2000 sites spatial data; therefore, the nature reserves that are smaller than 25 ha, or narrower than 100 m, were not accounted for.
The digital vector data, containing the polygons of land cover categories, are described by the digitization detail related to a spatial scale of map representation, by the MMU, and by the minimum width for linear elements. Therefore, for the data used in the study, the digitization detail corresponds to a scale of 1: 100000, indicating the change from one category of land cover to another. According to Technical Report No 17/2007 [29], the accuracy of the data is higher than 85%.
Connections between the two databases were made by intersecting the Natura 2000 layer with CLC Change files, in order to identify the distribution of the land cover changes for the protected areas. A buffer zone of 1 km around each protected area was also created, so changes inside the Natura 2000 sites could be analyzed for each period of CLC, and changes occurring in their vicinity were treated as potential, future pressure. Furthermore, there was the intent to emphasize which Natura 2000 sites are under pressure, due to activities from inside the area, and which ones are menaced due to exterior activities.
Several types of statistical analyses were used concerning the following factors: the distribution of surfaces and land cover categories subjected to change inside the Natura 2000 sites, as well as in the 1-km buffer area of each Natura 2000 site; the association of different change types from CLC databases, with the categories of threats and pressures; and the generation of the corresponding graphical and cartographic representations derived from the statistical data results.
Sankey diagrams have been generated to assist with the visual representation of the dominant types of land cover changes, over each intermediate time period (1990–2000; 2000–2006; 2006–2012; 2012–2018), in order to present a detailed situation for each change type, not only a global foresight. Two types of Sankey diagrams were created; the first one reveals changes by land types in order of absolute magnitude, meaning that the absolute cumulated change areas (expressed in ha) have been extracted from table form, into 4 separate columns, each associated with a single time interval (Figures 5 and 6). The second type of diagram involves the representation of the number of polygons, used as a reference, which emphasizes the type of changes occurring, compared to their 1-km corresponding buffer areas, and the associated fragmentation (Figures 13–16). By comparing Sankey diagrams in the sites, and in the surrounding buffer areas, different type changes or similarities can reveal the efficiency of the protection status of the Natura 2000 areas, or the main types of human intervention (i.e., deforestation). These graphical representations were generated for both ROSCI and ROSPA sites, and they were created using the Flourish studio platform, while the final images were exported from Inkscape open source software.
Change emphasis across Natura 2000 sites involved calculus and generating reports for the entire analyzed period (1990–2018), concerning the number of changes on the Natura 2000 site and the total area of the changes, divided to the ROSCI/ROSPA surface, according to the following equations:
Area   change   ratio = total   CLC   change   area   ( ha ) × 100 Natura   2000   site   area   ( ha )
Number   of   polygons   ratio = Total   number   of   polygons   with   changes   ( period   1990 2018 ) Natura   2000   site   area   ( ha )
Change detection is relevantly performed both through multi-annual data comparison, and also by comparing changes in sites with the surrounding areas. For the latter type of comparison, buffer areas have been generated, with a conventional distance of 1 km around the site boundary. This provided sample areas through which in-site protection status for Natura 2000 sites could be validated by referring the changes that occurred in-site with those that have been registered in the immediate vicinity. This process partly provides a validation of the protection status efficiency for the sites, when correlated with the time periods before and after the implementation of Natura 2000 status. This ratio is calculated by dividing the percentage of cumulated changed areas from the sites to the percentage of cumulated changed areas from their corresponding buffer zones. In order to avoid errors introduced by occasional divisions by zero, the equation was adapted by inverting the percentages, using a difference from 100 both in the numerator and denominator fields (3):
S B _ C H _ R a t i o = 100 ( ( S C h 1   +   S C h 2   +   S C h 3   +   S C h 4 )   ×   100 s i t e   a r e a ) 100 ( ( B C h 1   +   B C h 2   +   B C h 3   +   B C h 4 )   ×   100 b u f f e r   a r e a )
where SB_CH_Ratio is the Site to Buffer Change area Ratio; SCh1, SCh2, SCh3, SCh4 are changed areas in sites for each of the study periods (1990–2000, 2000–2006, 2006–2012, and 2012–2018), and BCh1, BCh2, BCh3, BCh4 are the corresponding changed areas for the buffer zones, for the same aforementioned time periods.
Results from the performed calculations contain nine decimal values in order to ensure comparability between the ratio of the site and the buffer for the same site. Therefore, if the equation result is 1, then there are no changes at all in both the site itself, and the surrounding buffer area. Values lower than 1 indicate a negative case, in which the site has a larger percentage of areas affected by change than its corresponding buffer zone. The lower the values are, the more significant the negative effect is.
Values greater than 1 would suggest relatively less change in the site than the buffer area surrounding it, therefore a functional protection status, but also indicating current pressures and potential future threats. Similar to the prior class, the greater the values are, the better the protection status is, but threats and pressures increase accordingly.
For each ROSCI and ROSPA there is an associated standard data form, which was used to find several relevant pieces of information regarding the location, surface, average altitude, the biogeographical region to which it belongs, the list of species of community interest, as well as other species important for the site, and the habitats of community interest in the case of ROSCIs which are listed to be protected by law. Data are presented regarding the CLC inside the site, as well as the importance, the vulnerability, the state of protection, the property of the site, the anthropic activities and their effects on the site and outside it. The content of the Natura 2000 standard form must be regularly updated on the basis of the best information available for each network site in order to enable the Commission to act as coordinator and, in accordance with Article 9 of Directive 92/43/EEC, to examine the regular contribution of Natura 2000 to the achievement of the objectives set out in Articles 2 and 3 of that Directive [30].
Based on data from the list of pressures and threats, and the type of change in each CLC category, a correlation table was created. This correlation table reveals the link between the change in the type of land cover and human economic activities classified by the EU as threats. This correspondence was applied to identify the pressures and threats mentioned in the standard form of each Natura 2000 site, thus transforming Corine Land Cover Change data into a tool in order to identify the presence or the manifestation of pressures and threats within protected areas.

3. Results

Combining and analyzing the relation between Land Cover Changes and Natura 2000 sites in Romania revealed quantitative and qualitative results, and even some temporal variations.

3.1. Quantitative Analysis

3.1.1. Spatial Distribution of the Corine Land Cover Change within ROSPAs and ROSCIs

The vulnerability of the species and habitats within the protected areas is given primarily by the spatial changes of the habitat limits. From an economic point of view, these habitats have a market value and they are classified in different typologies regarding their use. The land cover category does not always overlap perfectly over a habitat; the land cover and land use classifications include major biological structures (e.g., coniferous forests, deciduous forests, meadows, wetlands, etc.) or encompass anthropic activities (e.g., clearing, construction, unmanaged waste, etc.), rather than smaller habitats. Our analysis has been performed separately for the ROSCI and ROSPA sites.

3.1.2. Total Surface Area Changes within Natura 2000 Sites

In total, in Romania, at the time of writing this study, there are 606 Natura 2000 sites, of which 435 are ROSCI and 171 are ROSPA. For the purpose of this analysis, all ROSCI and ROSPA sites with areas of over 25 ha were taken into account, due to the fact that this is the minimum surface of any given CLC polygon, for which change is potentially detectable (resulting in 415 sites for ROSCI and 171 sites for ROSPA, respectively) and mapped accordingly. Therefore, all cartographic representations in the current paper include these filtered Natura 2000 sites in the form of differently colored polygons in accordance with each map subject.
Analyzing the magnitudes of the land cover changes within the ROSCI protected areas, we observed that the total change ratio inside each Natura 2000 site has very low values for the majority of the areas (57.7% of them correspond to under 1% changes), which means that the protection is functional within the systems (Figure 1).
From a total surface change perspective, the sites with the least amount of change (expressed in percentages) are the sites that have the largest surface, those located in a more remote area and those with a higher degree of protection (Danube Delta). They have a better organization of the protection status, and more means of implementing the administrative measures related to site protection and management team. Furthermore, from a relativity standpoint, a small land cover change will be quantified differently depending on the total site area it occurs in (it is more significant for small sites and less impactful on the largest sites).
From the spatial point of view, it can be stated that the most affected by these changes are the forests from the Alpine Biogeographical region (Carpathian Mountain north and south) and then the wetlands of the great rivers, especially in the steppic biogeographical region (Figure 1).
Changes concerning ROSPA sites provide a better distribution of protection classes, considering the total number of sites in the first three classes of distribution (<5%—with a total of 80.5% of the total number of ROSPA sites). This indicates a better degree of protection than ROSCI sites, yet the sensitive areas are the same. (Figure 2).

3.1.3. Number of Polygon Changes within Natura 2000 Sites

The number of change polygons inside a Natura 2000 site is a relevant indicator because it shows the multiple directions of human aggression. The fragmentation of different land cover polygons reveals change tendency and human intervention, as proven in previous studies [31].
If there is a given surface change within a protected area, the pressure is considered to be more controllable if it comes from a one-polygon rather than a five-polygon change. The conflict is with one entity instead of five, the economic interest is just one, the legal issues are simplified and, therefore, the management problem is easier to confront.
In Romania, the natural barriers, such as mountains, corresponding to protected areas, can be considered to be “attacked” from all surrounding directions at the same time, while the very populated regions surrounded by settlements suffer from the same “aggression”. For both ROSCI and ROSPA sites, on Romanian territory, the fact that the continental biogeographic area is the most vulnerable of all can be observed.
In the alpine zone, the sites that have coniferous forests are especially affected, for these sites the value of the ratio is increasing to over 0.005. In the steppic zone, characterized by increasing anthropic activities and where the size of ROSCI is reduced, there are two situations: sites that are intensely modified, and sites that have a good administration concerning protection, or are strictly protected (due their protected area status as per IUCN) (Figure 3 and Figure 4).

3.1.4. Temporal Perspective of the Corine Land Cover Change on ROSPAs and ROSCIs

In the previous chapter, the spatial distribution of the most dynamic areas in the country from the land cover change perspective was addressed, followed by the analysis of the distribution of the human activities’ impact over the habitats from a temporal perspective.
Additionally, the temporal perspective reveals if the number of changes decreased after the implementation of the Natura 2000 network and if the program is efficient.

3.1.5. Overall Dynamics of CLC Change within ROSPAs and ROSCIs

The land cover changes in all of Romania’s protected areas, since the Corine Land Cover program started in the last 30 years, are presented in four periods: 1990–2000, 2000–2006, 2006–2012, and 2012–2018. Analyzing the overall changes, it can be stated that most of the changes happened during 1990–2000, after which there was a more stable period from 2000 until 2012, with a new increase starting from 2012. Taking into consideration the fact that the first period was 10 years long, while the others only 5 years long, it can be concluded that the most dynamic period was probably 2012–2018, and that the most recent years are not automatically associated with a better degree of natural protection.
Sankey diagrams have been generated to reveal the magnitude of each type of change for all four time periods analyzed. These reveal all cumulated change (1990–2018) which are segmented for each period relative to the total (hence, the percent values below each timeframe). Classes have been represented based on land cover codes (as seen in Table 1), both qualitatively (what type of land cover, transforms into another one, from one year, to another), and quantitatively (the height of each land cover category is a relative, proportional value, compared to the other types of change, referring to the area).
Each of the four analyzed periods had both changes associated with deforestation and afforestation. However, only the first decade reveals a balance in favor of forested area growth (for both ROSCI, and ROSPA sites), while the following three periods are clearly characterized by a dominance of deforestation processes (Figure 5).
Biodiversity loss is a problem after the year 2000 [32], considering the fact that deforestation implies the disappearance of all three forest categories (code 311, 312, 313), corresponding to deciduous, coniferous, and mixed forests. Unfortunately, the renewal of forested areas only implies the growth of either deciduous or coniferous forests, but very few mixed forests. This would also imply a change in how the forested areas are regenerated (either by natural or anthropic means). Until 2000, the occurrence of numerous mixed forests was associated to areas transitioning from woodland to shrub (code 324), which probably stands as proof of natural regeneration. By contrast, all periods following 2000 reveal very few cases of mixed forest regeneration (code 313), and this would stand as proof as the dominant type of regeneration being human dictated.
Another relevant aspect regarding mixed forest disappearance is the decrease of ecosystem services. The plantation of more mixed forests would increase the range of ecosystem services inside the forest [33]. Furthermore, mixed-tree plantations influence the nutrition process of individual species [34].
In the last periods, from 2006 until present, the land cover changes within Natura 2000 sites affected also the wetlands (411) ecosystems; therefore, a mutual change with the arable lands (211) from 2006 and 2012 can be observed. These changes are too significant to be forgotten. The possible causes are natural processes, such as flooding, a technical error, or human pressure. It is difficult to properly assess this issue; however, future research on the topic will be conducted.
On the ROSPA’s graph, compared with the ROSCI sites, an observable increase of importance in the changes in the pastures (231), agrosystems (211,221,222,242,243) and wetlands (511,512,411) is emphasized, due to the fact that a large number of the protected bird species in Romania are the water birds, so many of the ROSPA’s are located in the wetlands and the surrounding agricultural land. Additionally, floods have a higher importance; this is due to the fact that wetlands make up an important share of the natural protected areas, and significant floods occurred during the analyzed period [35]. The forests remain very important, but they lost the dominant position in changes issues (Figure 6).

3.1.6. Diachronic Behavior Analysis of the CLC Change within ROSPAs and ROSCIs

After an evaluation of the Land Cover Changes types distribution in all the Natura 2000 sites, we proceeded to analyze their distribution within each site, and to emphasize the different types of behavior. In our analysis, the trends of change within Natura 2000 sites (ROSCI and ROSPA) were considered within the following periods taken into account: 1990–2006 as the period preceding the moment of the sites implementation; 2006–2012 joined with 2012–2018 as periods that overlap the protection establishing dates for the sites.
Seven different types of patterns of dynamic behavior were identified according to the period in which changes occurred:
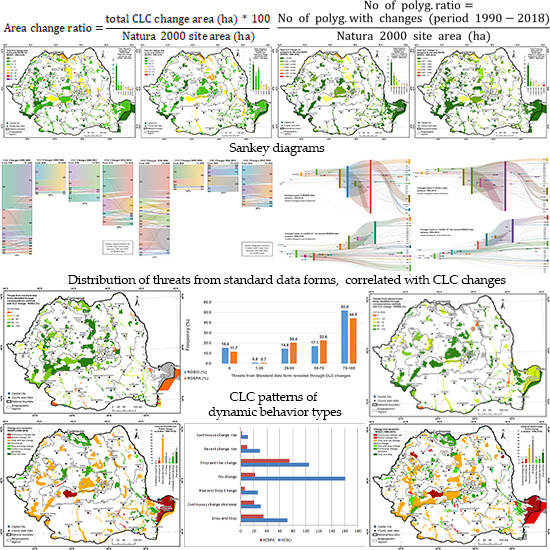
  • No change—there are no changes for the entire time period;
  • Recent change rise—an increase in changes between 2012–2018;
  • Drop and rise change—a decrease in changes until 2012, followed by an increase in change area until 2018;
  • Continuous change decrease—a continuous decrease in changes for the entire 1990–2018 period;
  • Rise and drop change—an increase in changes until 2012, followed by a decrease of changes, until 2018;
  • Drop and stop—a total decrease in changes until 2006, and no further changes until 2018;
  • Continuous change rise—there is a continuous increase in changes for the entire 1990–2018 period, despite all Natura 2000 implementations (Table 2 contains sample protected sites as examples that reflect types of dynamics concerning land cover).
Following the entry into the EU and the establishment of protected areas in the European Natura 2000 Network on natural and national parks, as well as on new areas, it is noted that this was beneficial for some areas and less so for others. The Natura 2000 site status allowed a reduction or complete stop of CLC changes for a number of 129 ROSCI sites and 62 ROSPA sites, these falling under the Drop and stop, Continuous change decrease, and Rise and drop change classes (Figure 7).
A representative case of drop and stop is given by ROSCI0256 Turbăria Ruginosu Zagon with an area of 346.6 ha, and changes that overlapped for over 140.3 ha; according to the CLC layers from 1990, 2000 and 2006, and after 2006, no further changes to this site are identified. Only a number of 183 sites are characterized by a good degree of conservation without modifications regarding the land cover; for example, ROSCI0033 The Șugăului Munticelu Gorges, which has an area of 324.9 ha, has not undergone any modification that could be identified on the CLC versions from 1990 until present. However, for a number of 232 areas, the establishment of Natura 2000 protection did not bring significant decreases in the dynamics of CLC changes, as is the case with ROSCI0386 Râul Vedea sites, which is noted by changes of approximately 17.5 ha in 1990–2006, 18 ha in 2006–2012 and 143.9 ha in 2012–2018. A similar case stands for ROSPA0031 The Danube Delta and Razim-Sinoie Complex, with changes over an area of 222 ha between 1990–2006, followed by changes of approx. 6432 ha between 2006–2012; during the last period (between 2012–2018), there were changes that took place over a total area of 11447 ha (Table 2).
Out of a total of 435 ROSCI sites, a weight of 37% is represented by sites where no changes has taken place, followed by a weight of 24% for ”Drop and rise change“, 17% for ”Drop and stop”, 7% belonging to the "Continuous change decrease" and ”Recent change rise“ scenarios, 2% ”Continuous change rise“, and "Rise and drop change" holds 6%. ”Drop and rise change”, ”Recent change rise" and “Continuous change rise” represent the catechesis problem as it highlights an increase of the areas changed after 2006, i.e., after the implementation of those areas as sites (Figure 8).
In the case of ROSPA sites, unlike ROSCI sites, the highest weight is given by “Drop and rise change” with 43%, followed by “Drop and stop” with 20%, and 13% for scenario “No change”. In these areas, the “Recent change rise” scenario has 6%, and “Continuous change rise” only 1%, while “Rise and drop change” 4%, and “Drop and stop” 21%. Regarding ROSPAs, a high share (of about 51%) of the scenarios in which the changes within the sites take place after 2006 can be observed, i.e., after the implementation of the Natura 2000 network in Romania (Figure 9).

3.1.7. Comparison between Land Cover Dynamics in the Former Protected Areas and in the New Ones

National parks are protected areas with large natural (or almost natural) surfaces, designated to protect large-scale environmental processes. National parks seek to minimize human activity in order to allow for “as natural a state as possible”, while natural parks include an option of continuous human interaction [36].
Similarly to natural parks from Romania, there are the European Natura 2000 sites, defined as protected areas where the interaction between humans and nature has produced an area with a distinctive character over time, where maintaining the integrity of this traditional interaction is vital for the protection and maintenance of the area and associated nature conservation values as well as other values [36].
In Romania, 29 protected areas are declared and administered, of which, 16 natural parks and 13 national parks. Out of these, 27 were declared before 2007 and only two were declared after 2007. The evolution of changes was analyzed only for the 27 natural and national parks that were declared before the Natura 2000 status was established. The total area of these parks is 1,082,282.98 ha (764,863.76 ha for natural parks and 317,419.22 ha for national parks). The establishment of these parks as Natura 2000 sites resulted in an increase of the protected areas at 2,409,715.33 ha for ROSCI (51 sites) and at 1,513,811.10 ha for ROSPA (31 sites).
As seen in Figure 10, the oldest ROSCI sites in Romania (National and Natural parks) follow the general distribution of the dynamic types in the Natura 2000 ROSCI sites. A positive piece of information is that they are not recording a steady increase of the Land Cover change and seem to be in the conservation half; however, the category Drop and Rise Change shows possible future pressure exposure on their behalf.
In terms of land cover dynamics, for all ROSPA sites and cumulated for the whole period between 1990–2018, only 30 sites are affected by a total of 70 types of changes, and for ROSCI only 46 sites, are subject to changes, with a total of 76 types of changes. The dominant changes for the whole period analyzed within the two types of Natura 2000 sites are those represented by deforestation (CLC 324—transitional woodland shrubs), 72% in ROSPA and 77% in ROSCI, especially in coniferous forests (CLC312) followed by mixed forests (CLC313) and deciduous forests (CLC311).
The analysis of the changes over the four time periods within the Natura 2000 sites, which had the status of natural and national park before 2007, reveals that certain types of changes are maintained and increased, as is the case with forest clearing (CLC311/312/313-CLC324). After the establishment of the parks as Natura 2000 sites, other types of changes occurred, such as vineyards (CLC221) into grasslands (CLC231), CLC 231 into arable land (CLC211), wetland (CLC411) into CLC211.

3.1.8. Comparing Dynamics from the Natura 2000 Sites with That from the Surrounding Buffer Zones

These calculi were performed for all ROSCI and ROSPA sites separately in order to emphasize any protection level differences between them.
One of the greatest differences between them is the fact that approximately one-fifth of ROSCI sites register no change across the entire studied time period (1990-2018), while ROSPA sites register no changes for only 4% of the total number of sites. Furthermore, sites registering no change are mostly the smallest sites, in general, for both ROSPA and ROSCI categories.
A major similarity is the fact that the largest sites, extending over hundreds or thousands of square kilometres, are mostly in the lower class, with values depicting negative impact. This is frequently the case in mountainous regions, with high abundance of wood resources and other areas where deforestation has been a common practice for a very long period of time. Riparian areas tend to provide a greater degree of protection, especially for ROSCI sites. This is due to the fact that there are frequent floods alternating with drought years [37].
The dependency on the types of neighbouring areas is also a relevant factor in the analysis. Sites that directly neighbour built-up areas or agricultural land are subjected to a higher degree of threats and pressures, compared to sites that have wild regions in their vicinity (Figure 11 and Figure 12).
Furthermore, we performed an analysis to emphasize what changes are occurring in the Natura 2000 sites compared to what is happening in the surrounding areas in order to reveal the sites that are under pressure from the outside activities. A well-protected area should have less changes inside than outside its borders. At the same time, huge activity outside means the existence of potential pressures.
The dynamics of the change typology for ROSPA and ROSCI is as diverse within the sites as outside them, but the amplitude of the manifestations for certain CLC classes is different. The area within the sites is rather dominated by deforestation (CLC324), the change of grassland cover (CLC231) but also the agricultural land (CLC211); in the buffer area, the amplitude of the changes decreases with their diversification.
The CLC changes during the analyzed period of 28 years (1990–2018) highlight the dynamics in a similar manner for the two time intervals 1990––2000 and 2012–2018 (over 25% of the changes occur), and, on the other hand, for the periods 2000–2006 and 2006–2012 (manifests up to about 20%). Therefore, the intervals between 1990–2000 and 2012–2018 depict an increase in the number of changes, and several land cover classes undergo modifications, changes with reversible or irreversible degradation, such as the following cases: forests (CLC31) changed in transitional woodland shrubs (CLC324), wetlands (CLC411) changed in pastures (CLC231), CLC31 and CLC231 changed in urban fabric (CLC11). For ROSCI and ROSPA, the dynamics of changes for these intervals exceeds a range of 20%, as follows: 47% for 1990–2000, and approx. 26% (2012–2018) for ROSPA; and 42% (1990–2000) and approx. 28% (2012–2018) for ROSCI. The interval between 2000 and 2012 is similar in its manifestation of changes; ROSPA and ROSCI concentrate between 13–17% for the whole period analyzed.
Sankey diagrams reveal which land cover categories have undergone the largest changes, representing the types of changes for the total 1990–2018 interval. As for the previous Sankey diagrams, the type of change has been emphasized between all categories for the entire study period (1990–2018). However, they compare the number of changes/number of changed polygons, both inside and outside all analyzed Natura 2000 protected areas, separately, for ROSCI and ROSPA sites (Figure 13, Figure 14, Figure 15 and Figure 16).
Similarities can be noticed when talking about the changes in ROSPA and ROSCI sites because they overlap over a degree of 63.67% and share the same typologies regarding the changes in the land cover. The number of change types manifested within the sites is about 170 (ROSCI: 174, ROSPA: 177) (Figure 13 and Figure 15), while in the buffer zones (of 1 km) (Figure 14 and Figure 16), 10 more changes are noticed for ROSCI (178) compared to ROSPA (168).
While analyzing the land cover changes in the ROSCI sites versus the buffer zone around them, it can be observed that, in the protected sites, the dominant changes refer to the forest habitats, while at a large distance, the 211 and 231 classes can be observed. In the buffer zones, the forests become less important, and the changes that implied agricultural ecosystems and artificial surfaces become significantly bigger.
The same situation is visible in the ROSPA sites, where complex agriculture and artificial surfaces become more important than in the ROSCI sites, due to the fact that limits of the ROSPA are closer to the settlements. The birds live in the wild regions, but feed themselves even around villages.

3.2. Qualitative Analysis

After the evaluation of the Land Cover Change impact over the Natura 2000 sites from the spatial perspective, the intention was to reveal what kind of changes occurred inside each protected area, and obtaining useful environmental information in the management protocols for all sites.

3.2.1. Correspondence between Corine Land Cover Changes and Natura 2000 Pressure and Threats

The aim was to connect these two European programs in order to use the Corine dataset in the Natura 2000 sites management by linking the changes presented in the Corine Land Cover changes files with the Pressures and Threats related to the Natura 2000 network, as presented in the European directive. Some of the pressures are not applicable on the CLC data, but many of them indicate probable threats.
From the entire list of pressures and threats, the pressures that are not visible from the satellite images were completely removed. Pressures that are not part of the CLC methodology were also removed, such as: H—Pollution, J—Invasive, other problematic species and genes, K—Natural biotic and abiotic processes (without catastrophes), M—Climate change. Those subtypes of the activities that did not fit from the rest of the list were partially eliminated.
Some land cover changes can fit in two or more threats and pressures, depending on the perspective that the analyst uses in order to evaluate the impact on the habitats. Only the CLC changes identified on the Romanian territory were used, but further studies will complete the correspondence table with changes from other biogeographical areas present in Europe, and will make the model applicable on the entire EU territory. A correspondence table was generated to emphasize the correlation between Natura 2000 sites threats and pressure list and Corine Land Cover changes identified in the Romanian protected areas (Table 3).
In the above table, some changes have been grouped in the same activities with impact and some supplementary validation is necessary. After finishing translating the changes into the pressures on each protected site, an evaluation process for the state of conservation of the Natura 2000 sites was conducted from the qualitative perspective. It is worth mentioning that those changes meant that a renaturation of the natural ecosystems were eliminated for the moment, while focusing only on the negative impact.

3.2.2. Types of Threats and Pressures Resulted from Correspondence in Romania

In the standard form of the SCIs and SPAs in Romania, the pressures for each specific site were identified. These are the initial evaluation of the sites and, after the completion of the management plan, the final pressures and threats will be emphasized. In Romania, only a part of the Natura 2000 sites have a Management Plan, due to which only the Standard form files during this stage of the study were taken into consideration.
Comparing the overall pressures found in these standard forms to those found from the correspondence table generated from Corine Land Cover Changes (Figure 17) revealed a highly reasonable percent of overlap. More than 69.1% ROSCIs and 67.1% of the ROSPA sites have a correspondence of over 50%. Most frequent correspondence is situated between 75% and 100% but these are all the pressures and threats, including those that are not visible from satellite imagery. Almost 15.4 % from ROSCIs and 11.7% of the ROSPA threats were unable to be identified. This might be explained by the fact that the creation of the standard form was operated in a specific year not covered by CLC, or the conservationist has a different in-field opinion compared with the photo interpreter.
Better results were obtained in the ROSCI sites than in the ROSPA sites, due to the fact that ROSCI sites are more connected to the habitats, and they are intimately related to the land cover.

3.2.3. Confronting the Result with the Pressures and Threats Presented in the Standard Form Distributed on Each ROSPA and ROSCI

The efficiency of this method was verified on each Natura 2000 site and two spatial distribution maps were generated: one for the ROSCI and the other for ROSPA sites. Some Natura 2000 sites have zero matches because the standard form is a preliminary evaluation of the conservation status and has a small number of threats, such as Larga Jijia. The management plan is the document that analyzes in detail the human impact over the environment, and a secondary validation with them would be the ultimate validation.
On the ROSCI sites map (Figure 18), it is visible that there is a high number of nature reserves where over 50% of the threats and pressures that could be identified through the Corine Land Cover changes have been mapped. The success rates are higher in the ROSCI sites overlapping the forest ecosystems from the Carpathian Mountains and the hilly regions of the country. Less relevant results were obtained on the ROSCI sites situated alongside riverbanks. These results could be explained by the fact that the de-/afforestation is easily identifiable by essential change, from the habitats perspective, for both the remote sensing specialists and the conservationists that created the standard forms. The land cover changes/threats that are less frequent can be ‘forgotten’ by one of the specialists implied in these data builds.
The results for ROSPA site (Figure 19) threats revealed that CLC changes are slightly different, sometimes with better results, such as the case of Danube Delta reserve and other ROSPA sites alongside riverbanks, and, in some cases, results are worse, such as in Ceahlău Mountains and Vânători Neamț ROSPA sites. The small values of matching percentages between Standard Form Threats and Corine Land Cover Threats are not necessarily a failure of the method used, but a possible simplification of the standard form, considering that the implementation of the Natura 2000 network was a very fast process, and the protected surface of the country should rise significantly; therefore, the specialist had less time to approach the problems.
The most frequent threats and pressures found through CLC changes in the ROSCIs in Romania are related to forestry, grazing, the extent of the urbanized environment and those related to agriculture. Less frequent, but still important, are those connected to the exploitation of mineral resources, the extension of road network and abandonment of pastures or agriculture (Figure 20).

3.2.4. Irreversible Land Cover Changes—A Serious Threat to the Environment

All the land cover changes induced by human activities have an impact over the protected areas, but some of them are a significantly larger problem. In order to discern the real impact of land cover changes on the Natura 2000 sites, they were classified into reversible and irreversible categories.
The monitoring of the environmental conflicts from Natura 2000 sites should be based on the context in which they occur, develop and are resolved. Using indicators for this purpose helps to highlight, in a simplified form, the complex natural, social, economic and historical circumstances where environmental conflicts arise [38].
The anthropization process considered for this study refers to what Martínez-Fernández defined as the areas that undergo changes from natural to less natural environments [39], specializing in the fact that, in our study, the transformations are from the natural CLC categories into the “1” CLC category. Category “1” was chosen because, unlike the classes related to agriculture or water bodies, the transformations into classes of this category are often irreversible. Therefore, agricultural areas or water bodies were not targeted from this perspective, which may induce the idea of using the term of artificialization instead of anthropization.
In the period taken into account (1990–2018), a total artificial area of approximately 1443 ha is highlighted, distributed unevenly during this time interval and according to the type of protected area (ROSCI/ROSPA). Within the ROSPAs, these land cover conversions are better emphasized during two periods, 1990–2000 and 2012–2018, while within the ROSCI sites, the surfaces converted into artificial areas gradually increase from 1990 to 2018 (Figure 21).
As a percentage of the sites’ areas, these changes cover insignificant territories (Figure 22). The mean value of artificialization in ROSCI sites is less than 1%, but more intense changes can be observed in the case of small sites such as ROSCI0393—Someșul Mare, where out of a total area of 526.24 ha, a surface of 56.5 ha, almost 11%, went through artificial processes.
For ROSPA sites, the situation is similar to that of ROSCI sites, the artificialization values being lower, with an average of about 0.2%, the highest values being about 0.9% and in this situation also within a site of small dimensions, ROSPA0050 Miheșu de Câmpie—Tăureni Ponds, which stretches over an area of 1186 ha, of which only 10 ha became artificialized surfaces during 1990–2018.
The fact that there are differences in the distribution of this phenomenon on the ROSCI and on the ROSPA maps could be observed. The Danube Delta seems to suffer more as a ROSPA, than as a ROSCI. This is happening due to the fact that the ROSPA limits are larger, and include feeding areas that can be crop yields around the villages (Figure 23). The general process of artificialization is not as intense, but it can become a huge pressure for some of the sites, especially because the phenomenon is on a “positive” trend, most of the artificialization is happening during the latest period.

4. Discussion

At present, in the full era of huge geospatial database existence, generated by the spatio-temporal quantification of land cover, habitats, the presence of species, the state of biodiversity conservation, landscape degradation, a multitude of classifications on the characteristics of the mentioned themes have emerged. In the literature, there are adaptations and correspondences between classification systems that address different hierarchical levels. Through this study, a correspondence was made between the typology of land cover categories changes (according to Corine methodology), and the typology of human activities, declared as threats and pressures (used in the management of protected sites in the European Natura 2000 network). The need for correlation tables between classification systems is useful in order to reuse data from different thematic systems to create indirect methods and tools for assessing qualitative characteristics (e.g., threat identification using land cover changes by analyzing satellite images).
Protected site managers can apply these tools, such as correlation tables between land cover change and threat and pressure type, as a survey method in the diachronic analysis of satellite images.
In multiple literature references, the correspondence between land cover modification typology, and threat and pressure types is treated from several different points of view, in terms of changes generated in land cover categories (e.g., the forest category becomes transitional woodland-shrub, and this is interpreted as deforestation) [40,41].
  • by identifying key criteria for linking categories in different land cover classification systems and habitat classes, e.g., translation of CORINE Land Cover, the Food and Agricultural Organization (FAO) land cover classification system (LCCS) and the International Geosphere-Biosphere Program to Habitat Classification Systems (Natura 2000, Corine Biotopes, Eunis, General Habitat Categories) [42]. Certain habitat classes reflect a degree of anthropogenic impact and these would indicate a certain pressure, but closely related to biodiversity.
  • By analyzing the dynamics of land cover that play the role of connector in ensuring the connectivity of protected sites in the Natura 2000 network and also indicate the sensitivity of conservation statuses for species and habitats [43,44].
The importance of forests as a relevant land cover class has special aspects not only for its significance as a habitat, but also for the fact that forests, in addition to the hydrographic network, are one of the most important corridors that can connect various ported areas [45].
Forest monitoring at the regional level would involve an enormous consumption of financial and temporal resources, so the approach of satellite remote sensing was one of the most reliable and highly successful options [11].
It is clearly visible that the changes involving forests ecosystems are dominant, but in the 1990-2000 period, there is an equilibrium between the deforestation and afforestation, because most of the forests were state owned and the mass planting programs were still active. After the change in the ownership structure, it was difficult to finance the planting programs from private funds, and most of the afforestation took place by natural means. Furthermore, the deciduous forests were the most vulnerable to clear-cuts until 2012, due to the high economic value of the corresponding species, considering that, lately, the broadleaved forests have attracted higher financial interest. This can be explained by the reduction of the available deciduous forest areas in the mountains, and the reorientation towards forests with higher accessibility, even if they have lower economic value.
Semi-natural habitats provide the quality of being able to represent a bridge between the need of human society and biodiversity conservation and, by intensifying agriculture, this quality can be lost. However, having at its disposal the CLC database and analysis of change dynamics, this study also represents a starting point for spatial planning that addresses the restoration of the natural landscape [46,47,48].
Even if the artificialization phenomenon stands out as being in a continuous growth at the level of the European Union [49], in Romania, regarding Natura 2000 sites, it is not reflected in the territory on large areas (less than 1% in the case of ROSCI). However, this process must be treated with increased care, as irreversibility makes this conversion have a major impact on protected areas.
After the Romanian accession to the EU, from 2007 until now, there is an increase of artificialization, even if most of the Natura 2000 sites received a form of protection starting during this period. Regional policy, particularly encouraging development in the growth poles, led in time to a concentration of development in a few selected urban areas [50].
The artificialization process is more intense near the great urban areas, near rivers and in the mountains where the mining activities are made into open pits or quarries.
A similar situation is treated by Lai [51] for the territory of Sardinia. Urbanization, as being part of artificialization, is considered to lead to an increase of impervious surfaces resulting in a reduction of rainwater infiltration [52]. However, the nature of CLC cannot always offer good results regarding the urbanization processes because the urban sprawl develops in a scattered manner [53,54]. As pressure is being placed on protected areas, anthropogenic structures were also analyzed a global scale, by Sanderson [55], and at regional scale, by Ursu [56].
Compared to similar land cover changes studies performed for other countries, such as Spain [41]—where analyses on Rate of Change or comparisons between protected and neighboring areas are made—buffer zones, net changes or losses are common; in the current study, we have addressed supplementary approaches, such as artificialization analysis, threats and pressures analysis, correlated to change types, change dynamics analysis, or indices such as number of polygons ratio or area change ratio.
Concerning the “Irradiation” of the Environmental sustainability from the Natural reserves to the rest of the territory mentioned by Rodriguez-Rodriguez, D [42], a direct observation can be made, from the polygon number perspective, that there are more land cover changes outside the protected areas, meaning that there is pressure from outside in the ROSCI sites, and lower than the inside in the ROSPA sites; therefore, the positive effect of the Natural area is more frequent in the SPAs.
The method that we have used for the identification of the threats and pressures in the Natura 2000 sites was validated only by confrontation with the pressures from Standard Form of the sites. These standard forms were made in order to sustain the implementation of the Natura 2000 network, but the creation of the Management plans for each area will necessitate a deeper analysis and probably arrive at a different result.

5. Conclusions

The Corine Land Cover program is a useful tool for the evaluation of the human activities impact on the Natura 2000 protected sites.
For the national and regional level, an evaluation of the state of conservation is possible and the results are good for the decision-making process. The stakeholders can easily obtain a general image of the spatial distribution of the natural protected areas from the country that are under environmental pressure. They can evaluate what kind of activities are dominant and where to act in order to compensate for the negative effect of them.
The most dynamic period is between 1990–2000 and then the 2012–2018. The first period is longer and includes the transition from communism regime to the capitalist one, but the revitalization of the changes in the 2012–2018 within the Natura 2000 sites is not a good sign of protection.
From a temporal perspective, the land cover changes dynamics were classified into the following six types: No change, Recent change rise, Drop and rise change, Continuous change decrease, Rise and drop change, Drop and stop, and Continuous change rise. The ROSCI sites seem to have a better protection than the ROSPA, because the frequency of the “better” classes is higher. In the ROSCI sites, there is a large number of sites in the “Drop and rise” changes category, meaning that the area is getting very dynamic again, even if it has a different protection status.
Inside the ROSPA and ROSCI sites, changes characterizing the natural environment were found; however, in the buffer zones, the type of changes get more agriculturally determined or related to the neighboring settlements.
The Natura 2000 sites close to the human settlements are the most vulnerable to artificialization; yet, even if in Romania the urbanization is a significant phenomenon, these changes are located far away from the natural protected areas.
The main advances of this paper is the correspondence method that was used to derive the threats and pressures from the land cover changes, revealing a new way to connect two existing databases in order to obtain new results with no further database investment.
The methods also describe a new driving line for the Corine Land Cover program, and a new category can be introduced in order to get more information for Natura 2000.
The Correspondence table should be expanded with more categories and threats in order to be used in all the European countries. As presented, it is made only with the land cover categories and land cover changes from Romanian territory.

Author Contributions

Conceptualization, A.U., C.C.S. and C.I.; methodology, C.C.S., A.U.; software, C.C.S., A.E.; validation, A.U., C.C.S. and C.I.; formal analysis, C.C.S.; investigation, V.J., C.I., A.U.; resources, V.J., C.I., A.E.; data curation, C.C.S., A.U.; writing—original draft preparation, A.U.; writing—review and editing, A.U., C.I.; visualization, A.E.; supervision, A.U.; project administration, A.U.; funding acquisition, A.U. All authors contributed equally and have equal rights to this research paper. All authors have read and agreed to the published version of the manuscript.

Funding

This work was financially supported by the Department of Geography, Faculty of Geography and Geology, ‘Alexandru Ioan Cuza’ University, of Iasi, Romania.

Acknowledgments

This project received technical support from the Department of Geography, Faculty of Geography and Geology, “Alexandru Ioan Cuza” University of Iași, Romania who offered us full access to the remote sensing and GIS laboratories. The infrastructure was provided through the POSCCEO 2.2.1, SMIS-CSNR 13984-901, No 257/28.09.2010 Project, CERNESIM.

Conflicts of Interest

The authors declare no conflict of interest. The funders had no role in the design of the study; in the collection, analyses, or interpretation of data; in the writing of the manuscript, or in the decision to publish the results.

References

  1. Yang, J.; Gong, P.; Fu, R.; Zhang, M.; Chen, J.; Liang, S.; Xu, B.; Shi, J.; Dickinson, R. The role of satellite remote sensing in climate change studies. Nat. Clim. Chang. 2013, 3, 875–883. [Google Scholar] [CrossRef]
  2. Dotzler, S.; Hill, J.; Buddenbaum, H.; Stoffels, J. The Potential of EnMAP and Sentinel-2 Data for Detecting Drought Stress Phenomena in Deciduous Forest Communities. Remote Sens. 2015, 7, 14227–14258. [Google Scholar] [CrossRef] [Green Version]
  3. Jitariu, V.; Vasiliniuc, I.; Rusu, C.; Roșca, B. The use of Sentinel 2 images for drought phenomenon monitoring in apple orchards. Int. Multidiscip. Sci. GeoConf. SGEM 2019, 19, 671. [Google Scholar] [CrossRef]
  4. Solberg, A.; Schistad, A.H. Remote Sensing of Ocean Oil-Spill Pollution. Proc. IEEE 2012, 100, 2931–2945. [Google Scholar] [CrossRef]
  5. Ning, S.-K.; Chang, N.-B.; Jeng, K.-Y.; Tseng, Y.-H. Soil erosion and non-point source pollution impacts assessment with the aid of multi-temporal remote sensing images. J. Environ. Manag. 2006, 79, 88–101. [Google Scholar] [CrossRef]
  6. Gallego Pinilla, F.J. Comparing CORINE Land Cover with a More Detailed Database in Arezzo (Italy) 2001. Available online: https://www.semanticscholar.org/paper/Comparing-CORINE-Land-Cover-with-a-more-detailed-in-Jrc/67037731cc23dfc3972984b969a9d45f794be282 (accessed on 15 October 2019).
  7. CORINE Land Cover — Copernicus Land Monitoring Service. Available online: https://land.copernicus.eu/pan-european/corine-land-cover (accessed on 4 October 2019).
  8. Napton, D.E.; Auch, R.F.; Headley, R.; Taylor, J.L. Land Changes and Their Driving Forces in the Southeastern United States. Reg. Environ. Chang. 2010, 10, 37–53. [Google Scholar] [CrossRef]
  9. Pelorosso, R.; Leone, A.; Boccia, L. Land cover and land use change in the Italian central Apennines: A comparison of assessment methods. Appl. Geogr. 2009, 29, 35–48. [Google Scholar] [CrossRef]
  10. Cieślak, I.; Szuniewicz, K.; Pawlewicz, K.; Czyża, S. Land Use Changes Monitoring with CORINE Land Cover Data. IOP Conf. Ser. Mater. Sci. Eng. 2017, 245, 052049. [Google Scholar] [CrossRef] [Green Version]
  11. Pekkarinen, A.; Reithmaier, L.; Strobl, P. Pan-European forest/non-forest mapping with Landsat ETM+ and CORINE Land Cover 2000 data. ISPRS J. Photogramm. Remote Sens. 2009, 64, 171–183. [Google Scholar] [CrossRef]
  12. Kucsicsa, G.; Popovici, E.-A.; Balteanu, D.; Grigorescu, I.; Dumitrascu, M.; Mitrica, B. Future land use/cover changes in Romania: Regional simulations based on CLUE-S model and CORINE land cover database. Landsc. Ecol. Eng. 2019, 15, 75–90. [Google Scholar] [CrossRef]
  13. Grigorescu, I.; Kucsicsa, G.; Popovici, E.-A.; Mitrica, B.; Mocanu, I.; Dumitrascu, M. Modelling land use/cover change to assess future urban sprawl in Romania. Geocarto Int. 2019. [Google Scholar] [CrossRef]
  14. Mücher, C.A.; Hennekens, S.M.; Bunce, R.G.H.; Schaminée, J.H.J.; Schaepman, M.E. Modelling the spatial distribution of Natura 2000 habitats across Europe. Landsc. Urban Plan. 2009, 92, 148–159. [Google Scholar] [CrossRef]
  15. Pullin, A.S.; Báldi, A.; Can, O.E.; Dieterich, M.; Kati, V.; Livoreil, B.; Lövei, G.; Mihók, B.; Nevin, O.; Selva, N.; et al. Conservation focus on Europe: Major conservation policy issues that need to be informed by conservation science. Conserv. Biol. 2009, 23, 818–824. [Google Scholar] [CrossRef] [PubMed]
  16. Primack, R.B.; Pătroescu, M.; Rozylowicz, L.; Iojă, C. Fundamentele Conservării Diversităţii Biologice; AGIR: Bucharest, Romania, 2008; ISBN 978-973-720-191-1. [Google Scholar]
  17. Baur, B.; Cremene, C.; Groza, G.; Rakosy, L.; Schileyko, A.A.; Baur, A.; Stoll, P.; Erhardt, A. Effects of abandonment of subalpine hay meadows on plant and invertebrate diversity in Transylvania, Romania. Biol. Conserv. 2006, 132, 261–273. [Google Scholar] [CrossRef]
  18. Ruprecht, E.; Enyedi, M.Z.; Eckstein, R.L.; Donath, T.W. Restorative removal of plant litter and vegetation 40 years after abandonment enhances re-emergence of steppe grassland vegetation. Biol. Conserv. 2010, 143, 449–456. [Google Scholar] [CrossRef]
  19. Stoate, C.; Báldi, A.; Beja, P.; Boatman, N.D.; Herzon, I.; van Doorn, A.; de Snoo, G.R.; Rakosy, L.; Ramwell, C. Ecological impacts of early 21st century agricultural change in Europe–A review. J. Environ. Manag. 2009, 91, 22–46. [Google Scholar] [CrossRef]
  20. Jones, W.; Silva, J.P. (Eds.) LIFE and Nature & Biodiversity Units of the Environment Directorate General (DG ENV) of the European Commission. 1 December 2008. Available online: https://ec.europa.eu/dgs/environment/index_en.htm (accessed on 21 October 2019).
  21. Thomson, A.G.; Manchester, S.J.; Swetnam, R.D.; Smith, G.M.; Wadsworth, R.A.; Petit, S.; Gerard, F.F. The use of digital aerial photography and CORINE-derived methodology for monitoring recent and historic changes in land cover near UK Natura 2000 sites for the BIOPRESS project. Int. J. Remote Sens. 2007, 28, 5397–5426. [Google Scholar] [CrossRef]
  22. Petrişor, A.-I. Assessment of the long-term effects of global changes within the Romanian Natural Protected Areas. Int. J. Conserv. Sci. 2016, 7, 759–770. [Google Scholar]
  23. Enea, A.; Hapciuc, O.-E.; Iosub, M.; Minea, I.; Romanescu, G. Water quality assessment in three mountainous watersheds from Eastern Romania (Suceava, Ozana and Tazlău rivers). Environ. Eng. Manag. J. 2017, 16, 605–614. [Google Scholar] [CrossRef]
  24. Enea, A.; Urzică, A.; Breabăn, I.G. Remote sensing, GIS and HEC-RAS techniques, applied for flood extent validation, based on LANDSAT imagery, LiDAR and hydrological data. Case study: Bașeu river, Romania. J. Environ. Prot. Ecol. 2018, 19, 1091–1101. [Google Scholar]
  25. CORINE Land Cover, Copernicus programme. Available online: https://land.copernicus.eu/pan-european/corine-land-cover (accessed on 2 October 2019).
  26. The Ministry of Environment, Water and Forests, Romania - GIS Data. Available online: http://www.mmediu.ro/articol/date-gis/434 (accessed on 5 October 2019).
  27. National Agency for Environmental Protection, Romania - Natura 2000 Standard forms. Available online: http://apmil.anpm.ro/informatii-natura-2000/-/asset_publisher/ikbc6radafTr/content/formulare-standard-natura-2000 (accessed on 4 October 2019).
  28. European Commission. The Habitats Directive-Environment- COUNCIL DIRECTIVE 92/43/EEC. Off. J. Eur. Communities 1992, 206, 7–50. [Google Scholar]
  29. Corine Land Cover 2006 Technical Report No. 17/2007. Available online: https://www.eea.europa.eu/publications/technical_report_2007_17 (accessed on 3 October 2019).
  30. Commission Implementing Decision of 11 July 2011. Available online: http://data.europa.eu/eli/dec_impl/2011/484/oj (accessed on 2 October 2019).
  31. Cole, B.; Smith, G.; Balzter, H. Acceleration and fragmentation of CORINE land cover changes in the United Kingdom from 2006-2012 detected by Copernicus IMAGE2012 satellite data. Int. J. Appl. Earth Obs. Geoinf. 2018, 73, 107–122. [Google Scholar] [CrossRef]
  32. Chávez, V.; Macdonald, S.E. Partitioning vascular understory diversity in mixedwood boreal forests: The importance of mixed canopies for diversity conservation. For. Ecol. Manag. 2012, 271, 19–26. [Google Scholar] [CrossRef]
  33. Brockerhoff, E.G.; Barbaro, L.; Castagneyrol, B.; Forrester, D.I.; Gardiner, B.; González-Olabarria, J.R.; Lyver, P.O.; Meurisse, N.; Oxbrough, A.; Taki, H.; et al. Forest biodiversity, ecosystem functioning and the provision of ecosystem services. Biodivers. Conserv. 2017, 26, 3005–3035. [Google Scholar] [CrossRef] [Green Version]
  34. Richards, A.E.; Forrester, D.I.; Bauhus, J.; Scherer-Lorenzen, M. The influence of mixed tree plantations on the nutrition of individual species: A review. Tree Physiol. 2010, 30, 1192–1208. [Google Scholar] [CrossRef] [PubMed] [Green Version]
  35. Petrisor, A.-I.; Petrisor, L.E. Transitional Dynamics Based Trend Analysis of Land Cover and Use Changes. Present Environ. Sustain. Dev. 2018, 12, 215–231. [Google Scholar] [CrossRef] [Green Version]
  36. The International Union for Conservation of Nature (IUCN). Available online: https://www.iucn.org/ (accessed on 2 October 2019).
  37. Mares, C.; Adler, M.-J.; Mares, I.; Chelcia, S.; Branescu, E. Climate Variability of the Hydro-Meteorological Extreme Events in Romania. 2013. Available online: https://ui.adsabs.harvard.edu/abs/2013EGUGA.15.9039M/abstract (accessed on 14 October 2019).
  38. Iojă, I.-C.; Hossu, C.-A.; Niţă, M.-R.; Onose, D.-A.; Badiu, D.-L.; Manolache, S. Indicators for Environmental Conflict Monitoring in Natura 2000 Sites. Procedia Environ. Sci. 2016, 32, 4–11. [Google Scholar] [CrossRef] [Green Version]
  39. Martínez-Fernández, J.; Ruiz-Benito, P.; Zavala, M.A. Recent land cover changes in Spain across biogeographical regions and protection levels: Implications for conservation policies. Land Use Policy 2015, 44, 62–75. [Google Scholar] [CrossRef]
  40. Gerard, F.; Petit, S.; Smith, G.; Thomson, A.; Brown, N.; Manchester, S.; Wadsworth, R.; Bugar, G.; Halada, L.; Bezák, P.; et al. Land cover change in Europe between 1950 and 2000 determined employing aerial photography. Prog. Phys. Geogr. 2010. [Google Scholar] [CrossRef] [Green Version]
  41. Rodriguez-Rodriguez, D.; Martinez-Vega, J.; Echavarria, P. A twenty year GIS-based assessment of environmental sustainability of land use changes in and around protected areas of a fast developing country: Spain. Int. J. Appl. Earth Obs. Geoinf. 2019, 74, 169–179. [Google Scholar] [CrossRef]
  42. Tomaselli, V.; Dimopoulos, P.; Marangi, C.; Kallimanis, A.S.; Adamo, M.; Tarantino, C.; Panitsa, M.; Terzi, M.; Veronico, G.; Lovergine, F.; et al. Translating land cover/land use classifications to habitat taxonomies for landscape monitoring: A Mediterranean assessment. Landsc. Ecol. 2013, 28, 905–930. [Google Scholar] [CrossRef] [Green Version]
  43. Piquer-Rodríguez, M.; Kuemmerle, T.; Alcaraz-Segura, D.; Zurita-Milla, R.; Cabello, J. Future land use effects on the connectivity of protected area networks in southeastern Spain. J. Nat. Conserv. 2012, 20, 326–336. [Google Scholar] [CrossRef]
  44. Santini, L.; Saura, S.; Rondinini, C. Connectivity of the global network of protected areas. Divers. Distrib. 2016, 22, 199–211. [Google Scholar] [CrossRef] [Green Version]
  45. de la Fuente, B.; Mateo-Sánchez, M.C.; Rodríguez, G.; Gastón, A.; Pérez de Ayala, R.; Colomina-Pérez, D.; Melero, M.; Saura, S. Natura 2000 sites, public forests and riparian corridors: The connectivity backbone of forest green infrastructure. Land Use Policy 2018, 75, 429–441. [Google Scholar] [CrossRef]
  46. Lawton, J.H.; Brotherton, P.N.M.; Brown, V.K.; Elphick, C.; Fitter, A.H.; Forshaw, J.; Haddow, R.W.; Hilborner, S.; Leafe, R.N.; Mace, G.M.; et al. Making Space for Nature: A Review of England’s Wildlife Sites and Ecological Network; Report to Defra; 2010; Available online: https://www.researchgate.net/publication/268279426_Making_Space_for_Nature_A_Review_of_England%27s_Wildlife_Sites_and_Ecological_Network (accessed on 21 October 2019).
  47. Lindborg, R.; Bengtsson, J.; Berg, Å.; Cousins, S.A.O.; Eriksson, O.; Gustafsson, T.; Hasund, K.P.; Lenoir, L.; Pihlgren, A.; Sjödin, E.; et al. A landscape perspective on conservation of semi-natural grasslands. Agric. Ecosyst. Environ. 2008, 125, 213–222. [Google Scholar] [CrossRef]
  48. Hooftman, D.A.P.; Bullock, J.M. Mapping to inform conservation: A case study of changes in semi-natural habitats and their connectivity over 70years. Biol. Conserv. 2012, 145, 30–38. [Google Scholar] [CrossRef]
  49. Kubacka, M.; Smaga, L. Effectiveness of Natura 2000 areas for environmental protection in 21 European countries. Reg. Envir. Chang. 2019, 19, 2079–2088. [Google Scholar] [CrossRef] [Green Version]
  50. Grădinaru, S.R.; Fan, P.; Iojă, C.I.; Niță, M.R.; Suditu, B.; Hersperger, A.M. Impact of national policies on patterns of built-up development: An assessment over three decades. Land Use Policy 2020, 94, 104510. [Google Scholar] [CrossRef]
  51. Lai, S.; Leone, F.; Zoppi, C. Anthropization Processes and Protection of the Environment: An Assessment of Land Cover Changes in Sardinia, Italy. Sustainability 2017, 9, 2174. [Google Scholar] [CrossRef] [Green Version]
  52. Fernandez-Nogueira, D.; Corbelle-Rico, E. Land Use Changes in Iberian Peninsula 1990-2012. Land 2018, 7, 99. [Google Scholar] [CrossRef] [Green Version]
  53. Abrantes, P.; Fontes, I.; Gomes, E.; Rocha, J. Compliance of land cover changes with municipal land use planning: Evidence from the Lisbon metropolitan region (1990–2007). Land Use Policy 2016, 51, 120–134. [Google Scholar] [CrossRef]
  54. Serra, P.; Vera, A.; Tulla, A.F.; Salvati, L. Beyond urban–rural dichotomy: Exploring socioeconomic and land-use processes of change in Spain (1991–2011). Appl. Geogr. 2014, 55, 71–81. [Google Scholar] [CrossRef]
  55. Sanderson, E.W.; Jaiteh, M.; Levy, M.A.; Redford, K.H.; Wannebo, A.V.; Woolmer, G. The Human Footprint and the Last of the Wild. bisi 2002, 52, 891–904. [Google Scholar] [CrossRef]
  56. Ursu, A.; Jitariu, V.; Ciutea, A. Estimating the Impact of Human Activities on the Environment in Moldova Region (HI Index). Present Environ. Sustain. Dev. 2017, 11, 129–140. [Google Scholar] [CrossRef] [Green Version]
Figure 1. Changed area to site area ratio (%) for ROSCI-Romanian Sites of Community Importance (1990–2018).
Remotesensing 12 02075 g001
Figure 2. Changed area-to-site area ratio (%) for ROSPA-Romanian Special Protected Areas (1990–2018).
Remotesensing 12 02075 g002
Figure 3. Changed polygon number to site area ratio for ROSCI (1990–2018).
Remotesensing 12 02075 g003
Figure 4. Changed polygons number to site area ratio for ROSPA (1990–2018).
Remotesensing 12 02075 g004
Figure 5. Corine Land Cover (CLC) dynamics within ROSCI sites (1990–2018) (the numbers that are mentioned in the graph refer to the land cover codes according to the CLC classification; their description is detailed in the Materials section (Section 2.1)).
Remotesensing 12 02075 g005
Figure 6. CLC dynamics within ROSPA sites (1990–2018).
Remotesensing 12 02075 g006
Figure 7. Frequency of each type of dynamics in ROSCI and ROSPA sites.
Remotesensing 12 02075 g007
Figure 8. Distribution of the different patterns of dynamic behavior for ROSCI (1990–2018).
Remotesensing 12 02075 g008
Figure 9. Distribution of the different patterns of dynamic behavior for ROSPA (1990–2018).
Remotesensing 12 02075 g009
Figure 10. Patterns of dynamic behavior encountered in Natural Parks, National Parks and ROSCI sites.
Remotesensing 12 02075 g010
Figure 11. Change area in site vs. change area in buffer zones (ROSCI sites).
Remotesensing 12 02075 g011
Figure 12. Change area in site vs. change area in buffer zones (ROSPA sites).
Remotesensing 12 02075 g012
Figure 13. Land cover change dynamic in ROSCI sites, between 1990–2018.
Remotesensing 12 02075 g013
Figure 14. Land cover change dynamic in buffer of ROSCI sites, between 1990–2018.
Remotesensing 12 02075 g014
Figure 15. Land cover change dynamic in ROSPA sites, between 1990–2018.
Remotesensing 12 02075 g015
Figure 16. Land cover change dynamic in buffer of ROSPA sites, between 1990–2018.
Remotesensing 12 02075 g016
Figure 17. Frequency distribution of threats from Standard data form revealed by CLC changes.
Remotesensing 12 02075 g017
Figure 18. Distribution of threats from standard data forms, identified through correspondence methods with CLC changes (for ROSCI sites).
Remotesensing 12 02075 g018
Figure 19. Distribution of threats from standard data forms, identified through correspondence methods with CLC changes (for ROSPA sites).
Remotesensing 12 02075 g019
Figure 20. Absolute frequency for threats and pressures, derived from CLC changes, in ROSCI sites.
Remotesensing 12 02075 g020
Figure 21. Artificialized areas.
Remotesensing 12 02075 g021
Figure 22. Percentage of artificialization in ROSCI sites.
Remotesensing 12 02075 g022
Figure 23. Percentage of artificialization in ROSPA sites.
Remotesensing 12 02075 g023
Table 1. Land cover categories according to Corine Land Cover classification.
Class 1. Artificial surfaces1.1. Urban fabric1.1.1. Continuous urban fabric, 1.1.2. Discontinuous urban fabric
1.2. Industrial, commercial and transport units1.2.1. Industrial and commercial units, 1.2.2. Road and rail networks and associated land, 1.2.3. Port areas, 1.2.4. Airports
1.3. Mine, dump and construction sites1.3.1. Mineral extraction sites, 1.3.2. Dump sites, 1.3.3. Construction sites
1.4. Artificial non-agricultural vegetated areas1.4.1. Green urban areas, 1.4.2. Sport and leisure facilities
Class 2. Agricultural areas2.1. Arable land2.1.1. Non-irrigated arable land, 2.1.2. Permanently irrigated land, 2.1.3. Rice fields
2.2. Permanent crops2.2.1. Vineyards, 2.2.2. Fruit trees and berry plantations, 2.2.3. Olive groves
2.3. Pastures2.3.1. Pastures
2.4. Heterogeneous agricultural areas2.4.1. Annual crops associated with permanent crops, 2.4.2. Complex cultivation patterns, 2.4.3. Land principally occupied by agriculture, with significant areas of natural vegetation, 2.4.4. Agro-forestry areas
Class 3. Forests and semi-natural areas3.1. Forests3.1.1. Broad-leaved forest, 3.1.2. Coniferous forest. 3.1.3. Mixed forest
3.2. Shrub and/or herbaceous vegetation association3.2.1. Natural grassland, 3.2.2. Moors and heathland, 3.2.3. Sclerophyllous vegetation, 3.2.4. Transitional woodland shrub
3.3. Open spaces with little or no vegetation(3.3.1. Beaches, dunes, and sand plains, 3.3.2. Bare rock, 3.3.3. Sparsely vegetated areas, 3.3.4. Burnt areas, 3.3.5. Glaciers and perpetual snow
Class 4. Wetlands4.1. Inland wetlands4.1.1. Inland marshes, 4.1.2. Peat bogs
4.2. Coastal wetlands4.2.1. Salt marshes, 4.2.2. Salines, 4.2.3. Intertidal flats
Class 5. Water bodies5.1. Inland waters5.1.1. Water courses, 5.1.2. Water bodies
5.2. Marine waters5.2.1. Coastal lagoons, 5.2.2. Estuaries, 5.2.3. Sea and ocean
Table 2. CLC patterns of dynamic behavior types—ROSCI sites sample.
Natura 2000 Site Code ExamplesChanged Area 1990–2006Changed Area 2006–2012Changed Area 2012–2018TrendClass
ROSCI00010.000.000.00 Remotesensing 12 02075 i001No change
ROSCI00030.000.0012.74 Remotesensing 12 02075 i002Recent change rise
ROSCI00045.140.000.77 Remotesensing 12 02075 i003Drop and rise change
ROSCI000838.7523.130.00 Remotesensing 12 02075 i004Continuous change decrease
ROSCI00240.0030.786.07 Remotesensing 12 02075 i005Rise and drop change
ROSCI002923.150.000.00 Remotesensing 12 02075 i006Drop and Stop
ROSCI00851994.932432.884844.38 Remotesensing 12 02075 i007Continuous change rise
Table 3. Pressures and Threats Associated with Types of Change.
Pressure
Code
Description (Threats and Pressures)CLC Changes (Codes)
AAgriculture
A01Cultivation311–244324–211324–243411–211411–243
A02.01Intensification of agriculture243–242222–242242–211242–222243–211211–242
A02.02Crop change213–211221–211222–211
A02.03Grassland removal for arable land231–211231–221231–222231–243231–242321–243
321–211
A03.03Abandonment/lack of mowing321–324
A04.01Intensive grazing321–231242–231243–231
A04.02Non-intensive grazing231–321
A04.03Abandonment of pastoral systems, lack of grazing231–324321–324
A06Annual and perennial non-timber crops
A06.02Perennial non-timber crops211–221211–222231–221231–222
A06.04Abandonment of crop production211–231211–324221–324213–231221–231222–231
213–243221–242221–243
A09Irrigation211–212
BForestry
B01Forest planting on open ground231–311242–311321–311321–312321–313
B02Forest and plantation, management and use311–324312–324313–324324–313324–311324–312
B03Forest exploitation without replanting or natural regrowth311–211311–231311–222311–242311–243324–321
311–112311–321311–331312–322312–231312–321
313–231313–132313–222313–242313–243
313–321
CMining, extraction of materials and energy production
C01.01Sand and gravel extraction321–131331–131411–131511–131211–131
C01.01.01Sand and gravel quarries321–131331–131411–131511–131211–131
C01.01.02Removal of beach materials321–131331–131411–131511–131211–131
C01.02Loam and clay pits231–131243–131211–131
C01.03Peat extraction412–131
C01.04Mines313–131311–131324–131
C01.04.01Open cast mining231–131
DTransportation and service corridors
D01Roads, paths and railroads211–122231–122311–122
D01.02Roads, motorways211–122231–122311–122
D01.04Railway lines, TGV231–122
D03Shipping lanes, port, and marine construction133–123
EUrbanisation, residential and commercial development
E01.02Discontinuous urbanisation221–112242–112243–112324–112331–112211-112
231–112411–112512–112
E02Industrial or commercial areas133–121211–121231–121242–121321–121243-121
411–121133–121211–121242–121321–121243-121
E02.01Factory231–121
E06Other urbanisation, industrial and similar activities211–133221–133231–133242–133243–133331-133
411–133
GHuman intrusions and disturbances
G02Sport and leisure structures411–142211–142231–142243–142311–142321-142
G02.07Sports pitch411–142211–142231–142243–142311–142321-142
G02.08Camping and caravans411–142211–142231–142243–142311–142321-142
HPollutionNot suitable for CLC
IInvasive, other problematic species and genesNot suitable for CLC
JNatural System modifications
J02.01Landfill, land reclamation and drying out, general511–211511–221511–231511–324512–211523-331
411–211
J02.06Water abstractions from surface waters512–234511–411
J02.13Abandonment of management of water bodies512–411512–243512–231
J03.03reduction, lack or prevention of erosion331–523
KNatural biotic and abiotic processes (without catastrophes)Partially suitable for CLC
K01.01Erosion211–331321–331324–331
K01.03Drying up511–243511–311511–321511–331
K01.04Inundation211–411211–511211–512221–512242–512243-511
231–411231–511231–512243–512311–511311-512
321–511321–512324–511324–512331–411331-511
331–512411–511411–512511–512
LGeological events, natural catastrophesPartially suitable for CLC
L05Collapse of terrain, landslide311–331211–331321–331324–331
MClimate changeNot suitable for CLC

