Hydrometeor Identification Using Multiple-Frequency Microwave Links: A Numerical Simulation
Abstract
:1. Introduction
- The detection object reflects the real precipitation situation near the ground;
- Higher spatial and temporal resolution;
- It can be widely distributed in remote mountainous areas;
- It is low-cost, being based on commercial microwave communication equipment.
2. Microphysical Characteristics and Microwave Attenuations of Different Hydrometeors
2.1. Data Acquisition for Different Hydrometeors and the Properties of Hydrometeors
2.2. Size Distribution of Hydrometeors
2.3. Microwave Attenuations of Hydrometeors
3. Method of Hydrometeor Identification
3.1. Microwave Link Simulation
3.2. Classification Method
4. Experimental Results
4.1. Single-Frequency Models
4.2. Dual-Frequency Models
4.3. Tri-Frequency Models
4.4. Precipitation Cell
5. Discussion
5.1. Noise Levels
5.2. Link Length and Link Data Processing
5.3. Choice of Frequency
5.4. Hydrometeor Property
5.5. Classification Method
6. Conclusions and Prospects
Author Contributions
Funding
Acknowledgments
Conflicts of Interest
Appendix A
| Categories | Precipitation Type | V–D | M–D |
|---|---|---|---|
| Rain | Rain | V = 9.65 − 10.3exp(−0.6D) | M = π/6D3.0 |
| Graupel | Lump graupel 1 | V = 1.16D0.46 | M = 0.042D3.0 |
| Lump graupel 2 | V = 1.30D0.66 | M = 0.078D2.8 | |
| Lump graupel 3 | V = 1.50D0.37 | M = 0.140D2.7 | |
| Conical graupel | V = 1.20D0.65 | M = 0.073D2.6 | |
| Hexagonal graupel | V = 1.10D0.57 | M = 0.044D2.9 | |
| Snow | Graupellike snow of lump type | V = 1.10D0.28 | M = 0.059D2.1 |
| Graupellike snow of hexagonal type | V = 0.86D0.25 | M = 0.021D2.4 | |
| Densely rimed dendrites | V = 0.62D0.33 | M = 0.015D2.3 | |
| Densely rimed radiating assemblages | V = 1.10D0.12 | M = 0.039D2.1 | |
| Unrimed side planes | V = 0.81D0.99 | – | |
| Aggregates of unrimed radiating assemblages | V = 0.80D0.16 | M = 0.073D1.4 | |
| Aggregates of densely rimed radiating assemblages of dendrites or dendrites | V = 0.79D0.27 | M = 0.037D1.9 | |
| Aggregates of unrimed radiating assemblages of plates, side planes, bullets, and columns | V = 0.69D0.41 | M = 0.037D1.9 | |
| Aggregates of unrimed side planes | V = 0.82D0.12 | M = 0.040D1.4 |
| Categories | N0 = algS + b | u = aSb | Λ = aSb | |||
|---|---|---|---|---|---|---|
| a | b | a | b | a | b | |
| Rain | 150,882 | −3.89 | 4.42 | −0.28 | 7.31 | −0.36 |
| Graupel | 3279 | −0.65 | 1.21 | −0.53 | 2.09 | −0.37 |
| Wet snow | 38 | −1.59 | 1.40 | −0.38 | 0.85 | −0.46 |
| Dry snow | 965 | −0.256 | 1.02 | −0.43 | 1.11 | −0.34 |
References
- Nanko, K.; Moskalski, S.M.; Torres, R. Rainfall erosivity–intensity relationships for normal rainfall events and a tropical cyclone on the US southeast coast. J. Hydrol. 2016, 534, 440–450. [Google Scholar] [CrossRef] [Green Version]
- Michaelides, S. Precipitation: Advances in Measurement, Estimation and Prediction; Michaelides, S.C., Ed.; Springer: Berlin, Germany, 2008. [Google Scholar]
- Chwala, C.; Kunstmann, H. Commercial microwave link networks for rainfall observation: Assessment of the current status and future challenges. Wiley Interdiscip. Rev. Water 2019, 6. [Google Scholar] [CrossRef] [Green Version]
- Wang, A.; Zeng, X. Sensitivities of terrestrial water cycle simulations to the variations of precipitation and air temperature in china. J. Geophys. Res. Atmospheres 2011, 116. [Google Scholar] [CrossRef] [Green Version]
- Gosnell, R.; Fairall, C.W.; Webster, P.J. The sensible heat of rainfall in the tropical ocean. J. Geophys. Res. Ocean. 1995, 100, 18437–18442. [Google Scholar] [CrossRef]
- Masek, J.G.; Isacks, B.L.; Gubbels, T.L.; Fielding, E.J. Erosion and tectonics at the margins of continental plateaus. J. Geophys. Res. Solid Earth 1994, 99, 13941–13956. [Google Scholar] [CrossRef]
- Löffler–Mang, M.; Joss, J. An optical disdrometer for measuring size and velocity of hydrometeors. J. Atmos. Ocean. Technol. 2000, 17, 130–139. [Google Scholar] [CrossRef]
- Gatlin, P.N.; Thurai, M.; Bringi, V.N.; Petersen, W.; Wolff, D.; Tokay, A. Searching for Large Raindrops: A Global Summary of Two–Dimensional Video Disdrometer Observations. J. Appl. Meteorol. Climatol. 2015, 54, 1069–1089. [Google Scholar] [CrossRef]
- Minda, H.; Tsuda, N.; Fujiyoshi, Y. Three–Dimensional Shape and Fall Velocity Measurements of Snowflakes Using a Multiangle Snowflake Imager. J. Atmos. Ocean. Technol. 2017, 34, 1763–1781. [Google Scholar] [CrossRef]
- Thurai, M.; Gatlin, P.; Bringi, V.N.; Petersen, W.; Kennedy, P.; Notaroš, B.; Carey, L. Toward Completing the Raindrop Size Spectrum: Case Studies Involving 2D–Video Disdrometer, Droplet Spectrometer, and Polarimetric Radar Measurements. J. Appl. Meteorol. Climatol. 2017, 56, 877–896. [Google Scholar] [CrossRef]
- Bringi, V.N.; Williams, C.R.; Thurai, M.; May, P.T. Using Dual–Polarized Radar and Dual–Frequency Profiler for DSD Characterization: A Case Study from Darwin, Australia. J. Atmos. Ocean. Technol. 2009, 26, 2107–2122. [Google Scholar] [CrossRef]
- D’Adderio, L.P.; Vulpiani, G.; Porcù, F.; Tokay, A.; Meneghini, R. Comparison of GPM Core Observatory and Ground–Based Radar Retrieval of Mass–Weighted Mean Raindrop Diameter at Midlatitude. J. Hydrometeorol. 2018, 19, 1583–1598. [Google Scholar] [CrossRef]
- Upton, G.J.G.; Cummings, R.J.; Holt, A.R. Identification of melting snow using data from dual–frequency microwave links. IET Microw. Antennas Propag. 2007, 1. [Google Scholar] [CrossRef]
- Yuter, S.E.; Kingsmill, D.E.; Nance, L.B.; LÖffler–Mang, M. Observations of Precipitation Size and Fall Speed Characteristics within Coexisting Rain and Wet Snow. J. Appl. Meteorol. Climatol. 2006, 45, 1450–1464. [Google Scholar] [CrossRef] [Green Version]
- Praz, C.; Roulet, Y.-A.; Berne, A. Solid hydrometeor classification and riming degree estimation from pictures collected with a Multi–Angle Snowflake Camera. Atmos. Meas. Tech. 2017, 10, 1335–1357. [Google Scholar] [CrossRef] [Green Version]
- Snyder, J.C.; Bluestein, H.B.; Zhang, G.; Frasier, S.J. Attenuation Correction and Hydrometeor Classification of High–Resolution, X–band, Dual–Polarized Mobile Radar Measurements in Severe Convective Storms. J. Atmos. Ocean. Technol. 2010, 27, 1979–2001. [Google Scholar] [CrossRef]
- Schuur, T.; Park, H.-S.; Ryzhkov, A.V.; Reeves, H.D. Classification of Precipitation Types during Transitional Winter Weather Using the RUC Model and Polarimetric Radar Retrievals. J. Appl. Meteorol. Climatol. 2012, 51, 763–779. [Google Scholar] [CrossRef]
- Praz, C.; Roulet, Y.-A.; Berne, A. A New Fuzzy Logic Hydrometeor Classification Scheme Applied to the French X–, C–, and S–Band Polarimetric Radars. J. Appl. Meteorol. Climatol. 2013, 52, 2328–2344. [Google Scholar] [CrossRef]
- Marzano, F.S.; Scaranari, D.; Montopoli, M.; Vulpiani, G. Supervised Classification and Estimation of Hydrometeors From C–Band Dual–Polarized Radars: A Bayesian Approach. IEEE Trans. Geosci. Remote Sens. 2008, 46, 85–98. [Google Scholar] [CrossRef]
- Minda, H.; Nakamura, K. High Temporal Resolution Path–Average Rain Gauge with 50–GHz Band Microwave. J. Atmos. Ocean. Technol. 2005, 22, 165–179. [Google Scholar] [CrossRef]
- Goldshtein, O.; Messer, H.; Zinevich, A. Rain Rate Estimation Using Measurements From Commercial Telecommunications Links. IEEE Trans. Signal Process. 2009, 57, 1616–1625. [Google Scholar] [CrossRef]
- Rahimi, A.R.; Holt, A.R.; Upton, G.J.G. Attenuation Calibration of an X–band Weather Radar Using a Microwave Link. J. Atmos. Ocean. Technol. 2006, 23, 395–405. [Google Scholar] [CrossRef]
- Krämera, S.; Verworna, H.-R.; Redderb, A. Improvement of X–band Radar Rainfall Estimates Using a Microwave Link. Atmos. Res. 2005, 77, 278–299. [Google Scholar] [CrossRef]
- Rafael, F.R.; Roger, H.L. Microwave link dual–wavelength measurements of path–average attenuation for the estimation of drop size distributions and rainfall. IEEE Trans. Geosci. Remote Sens. 2002, 40, 760–770. [Google Scholar] [CrossRef]
- Berne, A.; Schleiss, M. Retrieval of the rain drop size distribution using telecommunication dual–polarization microwave links. In Proceedings of the 34th Conference on Radar Meteorology, Williamsburg, VA, USA, 5–9 October 2009. [Google Scholar]
- Holt, A.R.; Kuznetsov, G.G.; Rahimi, A.R. Comparison of the use of dual–frequency and single–frequency attenuation for the measurement of path–averaged rainfall along a microwave link. IET Microw. Antennas Propag. 2003, 150, 315. [Google Scholar] [CrossRef]
- Cherkassky, D.; Ostrometzky, J.; Messer, H. Precipitation Classification Using Measurements From Commercial Microwave Links. IEEE Trans. Geosci. Remote Sens. 2014, 52, 2350–2356. [Google Scholar] [CrossRef]
- Jia, X.; Liu, Y.; Ding, D.; Ma, X.; Chen, Y.; Bi, K.; Tian, P.; Lu, C.; Quan, J. Combining disdrometer, microscopic photography, and cloud radar to study distributions of hydrometeor types, size and fall velocity. Atmos. Res. 2019, 228, 176–185. [Google Scholar] [CrossRef]
- Locatelli, J.D.; Hobbs, P.V. Fall speeds and masses of solid precipitation particles. J. Geophys. Res. 1974, 79, 2185–2197. [Google Scholar] [CrossRef]
- Atlas, D.; Srivastava, R.C.; Sekhon, R.S. Doppler characteristics of precipitation at vertical incidence. Rev. Geophys. Space Phys. 1973, 11, 1–35. [Google Scholar] [CrossRef]
- Chawla, N.V.; Bowyer, K.W.; Hall, L.O.; Kegelmeyer, W.P. SMOTE: Synthetic minority over–sampling technique. J. Artif. Intell. Res. 2002, 16, 321–357. [Google Scholar] [CrossRef]
- Seela, B.K.; Janapati, J.; Lin, P.-L.; Wang, P.K.; Lee, M.-T. Raindrop Size Distribution Characteristics of Summer and Winter Season Rainfall Over North Taiwan. J. Geophys. Res. Atmos. 2018, 123, 11, 602–611, 624. [Google Scholar] [CrossRef] [Green Version]
- Chen, B.; Yang, J.; Pu, J. Statistical Characteristics of Raindrop Size Distribution in the Meiyu Season Observed in Eastern China. J. Meteorol. Soc. Jpn. Ser. II 2013, 91, 215–227. [Google Scholar] [CrossRef] [Green Version]
- Jiang, J.H.; Wu, D.L. Ice and water permittivities for millimeter and sub-millimeter remote sensing applications. Atmos. Sci. Lett. 2004, 5, 146–151. [Google Scholar] [CrossRef]
- Wang, W.; Liu, H.; Wang, G.; Pu, J.; Zhou, Z. Fundamentals of Atmospheric Science; China Meteorological Press: Beijing, China, 2011; Volume 5, p. 346. [Google Scholar]
- George, H. A model for the complex permittivity of ice at frequencies below 1 thz. Int. J. Infrared Millim. Waves 1991, 12, 677–682. [Google Scholar] [CrossRef]
- Pruppacher, H.R.; Klett, J.D. Cloud processes (book reviews: Microphysics of clouds and precipitation). Science 1979, 204, 381–382. [Google Scholar] [CrossRef]
- Oguchi, T. Electromagnetic wave propagation and scattering in rain and other hydrometeors. Proc. IEEE 1983, 71, 1029–1078. [Google Scholar] [CrossRef]
- Awaka, J.; Furuhama, Y.; Hoshiyama, M.; Nishitsuji, A. Model calculations of scattering properties of spherical bright–band particles made of composite dielectrics. Proc. J. Radio Res. Lab. Jpn. 1985, 32, 73–87. [Google Scholar]
- Niu, S.; Jia, X.; Sang, J.; Liu, X.; Lu, C.; Liu, Y. Distributions of Raindrop Sizes and Fall Velocities in a Semiarid Plateau Climate: Convective versus Stratiform Rains. J. Appl. Meteorol. Climatol. 2010, 49, 632–645. [Google Scholar] [CrossRef]
- Boudala, F.S.; Isaac, G.A.; Rasmussen, R.; Cober, S.G.; Scott, B. Comparisons of Snowfall Measurements in Complex Terrain Made During the 2010 Winter Olympics in Vancouver. Pure Appl. Geophys. 2014, 171, 113–127. [Google Scholar] [CrossRef]
- Holt, A.R.; Cummings, R.J.; Upton, G.J.G.; Bradford, W.J. Rain rates, drop size information, and precipitation type, obtained from one–way differential propagation phase and attenuation along a microwave link. Radio Sci. 2008, 43, 1–18. [Google Scholar] [CrossRef]
- Mishchenko, M.I.; Videen, G.; Babenko, V.A.; Khlebtsov, N.G.; Wriedt, T. T–matrix theory of electromagnetic scattering by partciles and its applications: A comprehensive reference database. J. Quant. Spectrosc. Radiat. Transfer 2004, 88, 357–406. [Google Scholar] [CrossRef]
- Zinevich, A.; Messer, H.; Alpert, P. Prediction of rainfall intensity measurement errors using commercial microwave communication links. Atmos. Meas. Tech. Tech. 2010, 3, 1385–1402. [Google Scholar] [CrossRef] [Green Version]
- Pu, K.; Liu, X.; Xian, M.; Gao, T. Machine Learning Classification of Rainfall Types Based on the Differential Attenuation of Multiple Frequency Microwave Links. IEEE Trans. Geosci. Remote Sens. 2020, 58, 1–12. [Google Scholar] [CrossRef]
- Ostrometzky, J.; Messer, H. Dynamic Determination of the Baseline Level in Microwave Links for Rain Monitoring From Minimum Attenuation Values. IEEE Sel. Top. Appl. Earth Obs. Remote Sens. 2018, 11, 24–33. [Google Scholar] [CrossRef]
- Huang, G.-B.; Zhu, Q.-Y.; Siew, C.-K. Extreme learning machine: Theory and applications. Neurocomputing 2006, 70, 489–501. [Google Scholar] [CrossRef]
- Safavian, S.R.; Landgrebe, D. A survey of decision tree classifier methodology. IEEE Trans. Syst. Man Cybern. 1991, 21, 660–674. [Google Scholar] [CrossRef] [Green Version]
- Mao, K.Z.; Tan, K.C.; Ser, W. Probabilistic neural–network structure determination for pattern classification. IEEE Trans. Neural Netw. 2000, 11, 1009–1016. [Google Scholar] [CrossRef] [Green Version]
- Emanuel, K.A. On the Dynamical Definition(s) of “Mesoscale”. In Mesoscale Meteorology—Theories, Observations and Models; Springer: Dordrecht, The Netherlands, 1983; Volume 114, pp. 1–11. [Google Scholar]
- Luini, L.; Capsoni, C. A Rain Cell Model for the Simulation and Performance Evaluation of Site Diversity Schemes. IEEE Antennas Wirel. Propag. Lett. 2013, 12, 1327–1330. [Google Scholar] [CrossRef]
- Maximilian, G.; Christian, C.; Julius, P.; Harald, K. Rainfall estimation from a German–wide commercial microwave link network: Optimized processing and validation for one year of data. Hydrol. Earth Syst. Sci. 2019. [Google Scholar] [CrossRef] [Green Version]
- Fencl, M.; Dohnal, M.; Valtr, P.; Grabner, M.; Bareš, V. Atmospheric observations with E–band microwave links—Challenges and opportunities. Atmos. Meas. Tech. 2020. [Google Scholar] [CrossRef] [Green Version]
- Schleiss, M.; Berne, A. Identification of Dry and Rainy Periods Using Telecommunication Microwave Links. IEEE IEEE Geosci. Remote Sens. Lett. 2010, 7, 611–615. [Google Scholar] [CrossRef]
- Wang, Z.; Schleiss, M.; Jaffrain, J.; Berne, A.; Rieckermann, J. Using Markov switching models to infer dry and rainy periods from telecommunication microwave link signals. Atmos. Meas. Tech. 2012, 5, 1847–1859. [Google Scholar] [CrossRef] [Green Version]
- Moroder, C.; Siart, U.; Chwala, C.; Kunstmann, H. Modeling of Wet Antenna Attenuation for Precipitation Estimation From Microwave Links. IEEE Geosci. Remote Sens. Lett. 2019, 17, 386–390. [Google Scholar] [CrossRef]
- Schleiss, M.; Rieckermann, J.; Berne, A. Quantification and Modeling of Wet–Antenna Attenuation for Commercial Microwave Links. IEEE Geosci. Remote Sens. Lett. 2013, 10, 1195–1199. [Google Scholar] [CrossRef]
- Newman, A.J.; Kucera, P.A.; Bliven, L.F. Presenting the Snowflake Video Imager (SVI). J. Atmos. Ocean. Technol. 2009, 26, 167–179. [Google Scholar] [CrossRef]
- Löffler-Mang, M.; Blahak, U. Estimation of the Equivalent Radar Reflectivity Factor from Measured Snow Size Spectra. J. Atmos. Ocean. Technol. 2001, 40, 843–849. [Google Scholar] [CrossRef]
- Battaglia, A.; Rustemeier, E.; Tokay, A.; Blahak, U.; Simmer, C. PARSIVEL Snow Observations: A Critical Assessment. J. Atmos. Ocean. Technol. 2010, 27, 333–344. [Google Scholar] [CrossRef]
- Garrett, T.J.; Yuter, S.E.; Fallgatter, C.; Shkurko, K.; Rhodes, S.R.; Endries, J.L. Orientations and aspect ratios of falling snow. Geophys. Res. Lett. 2015, 42, 4617–4622. [Google Scholar] [CrossRef]


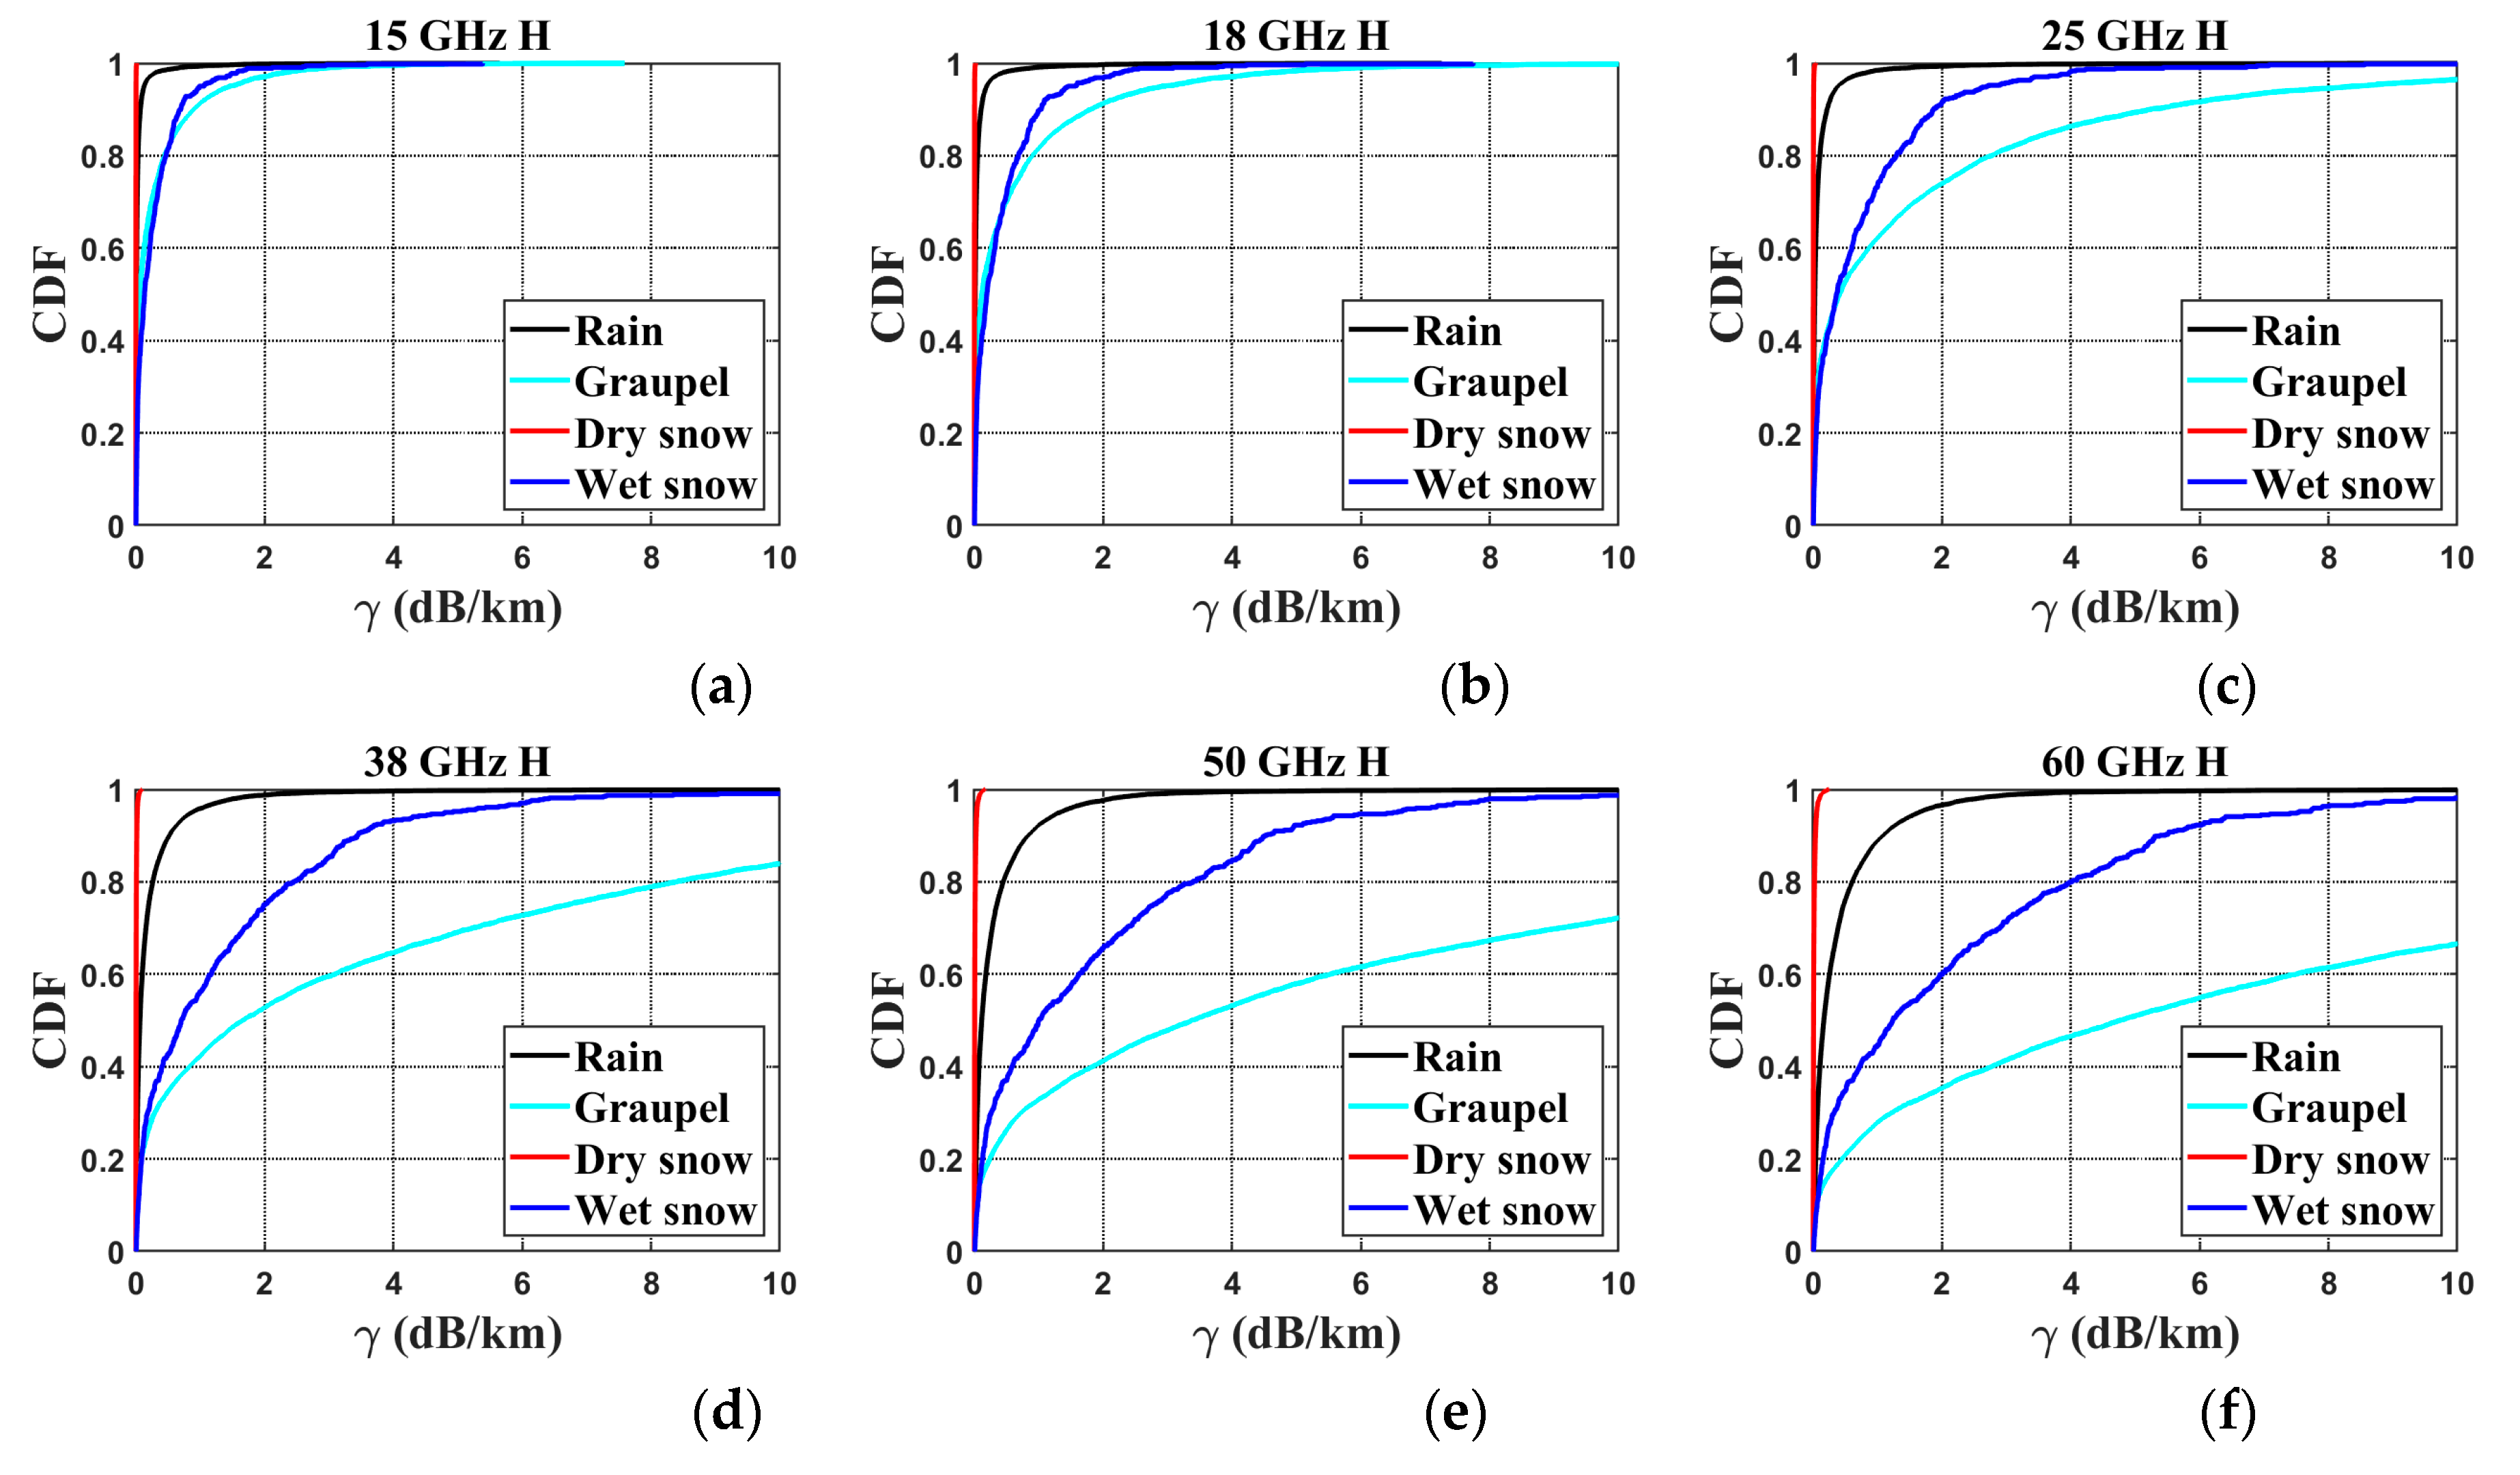
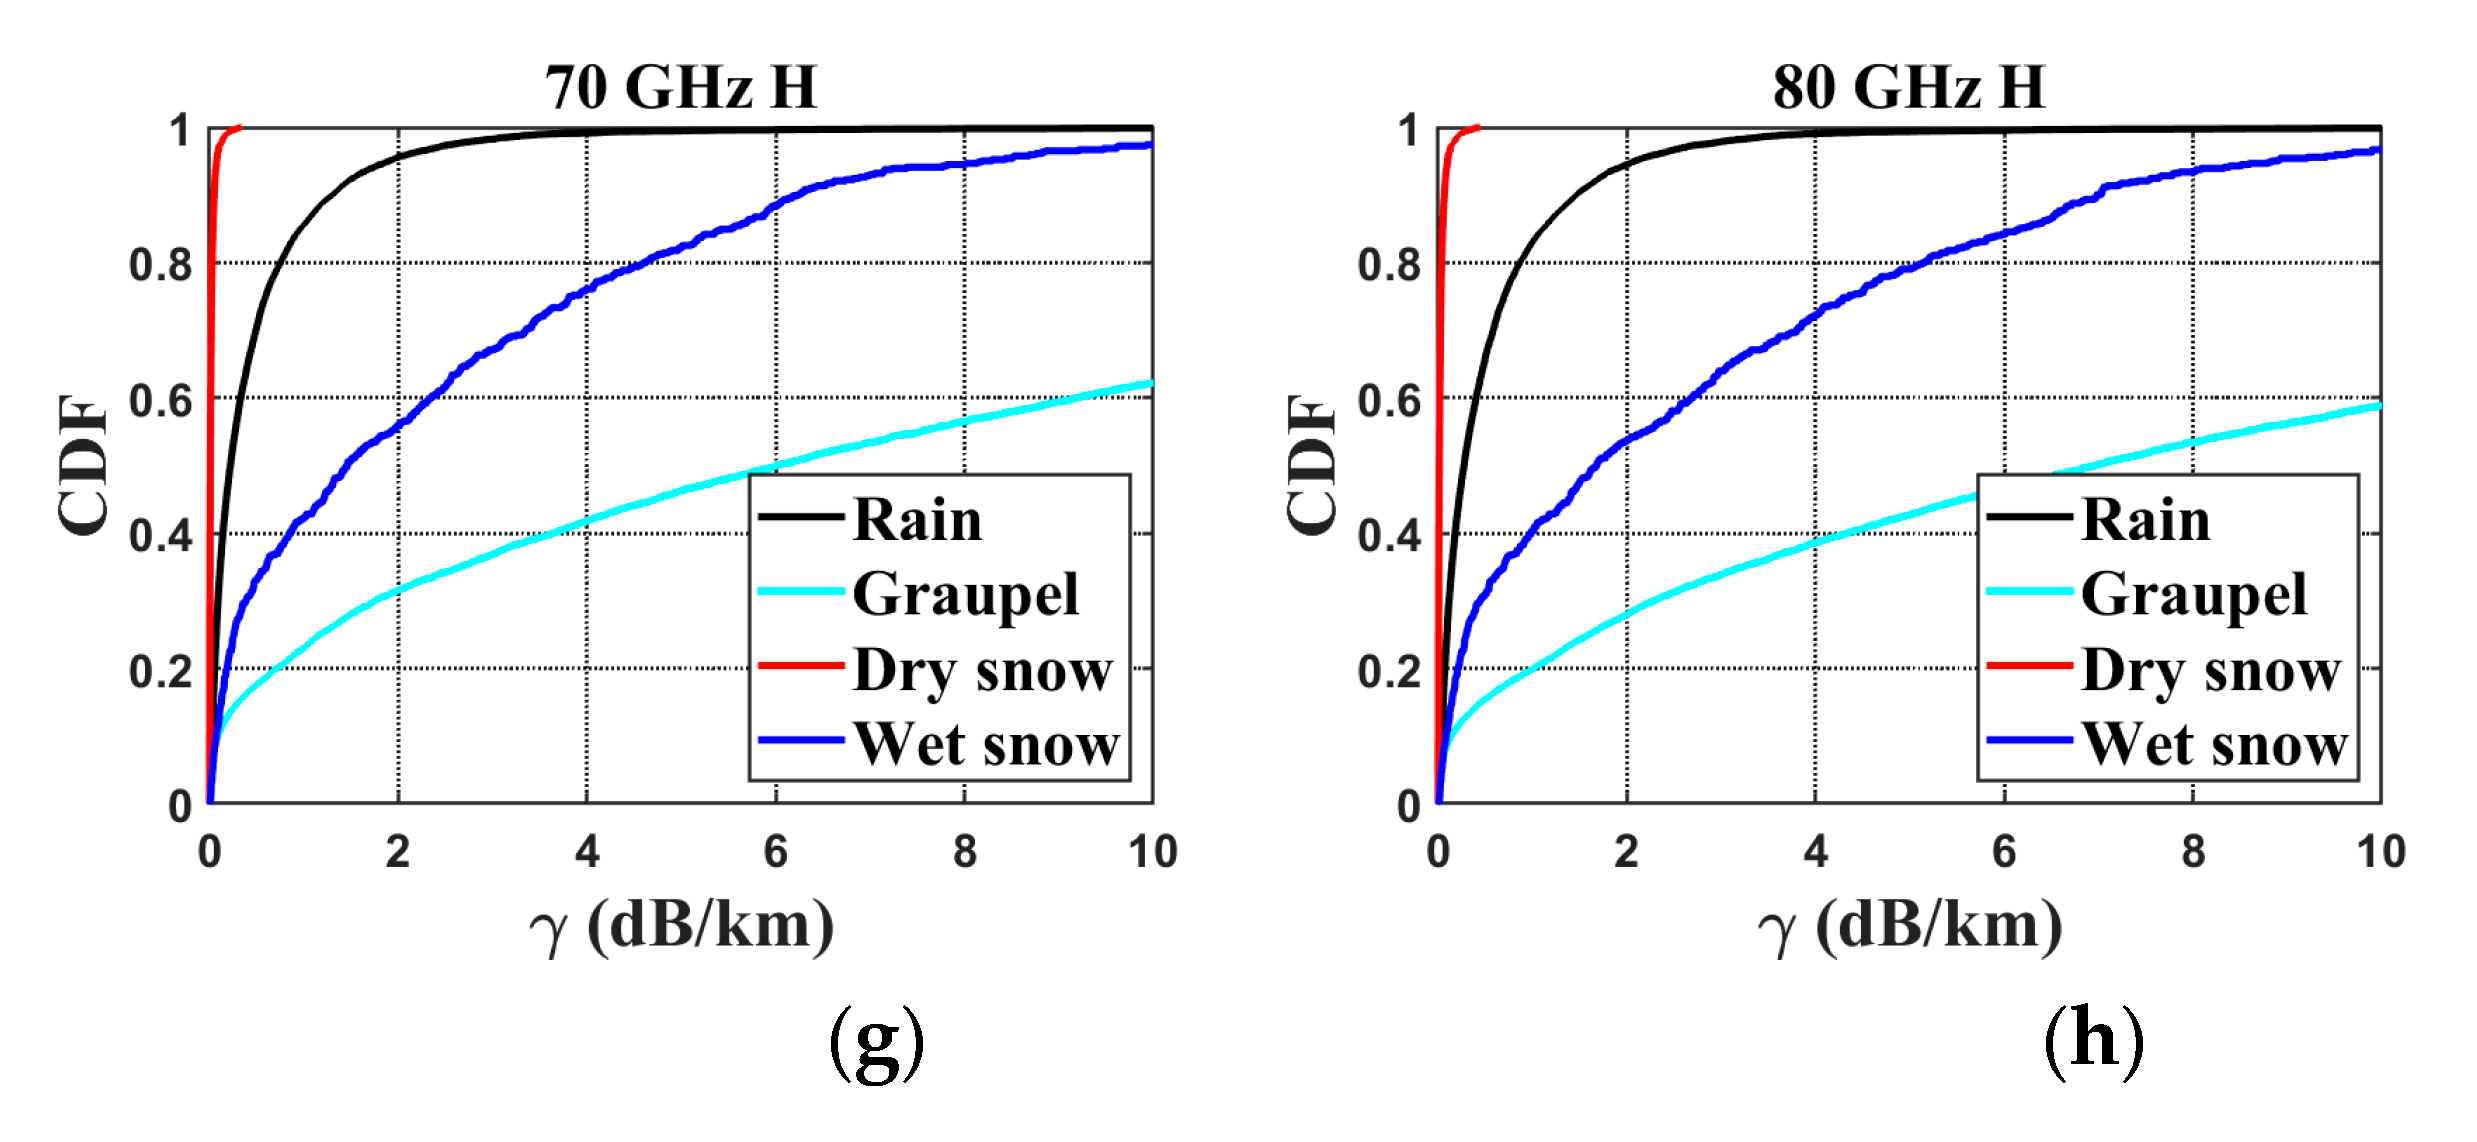
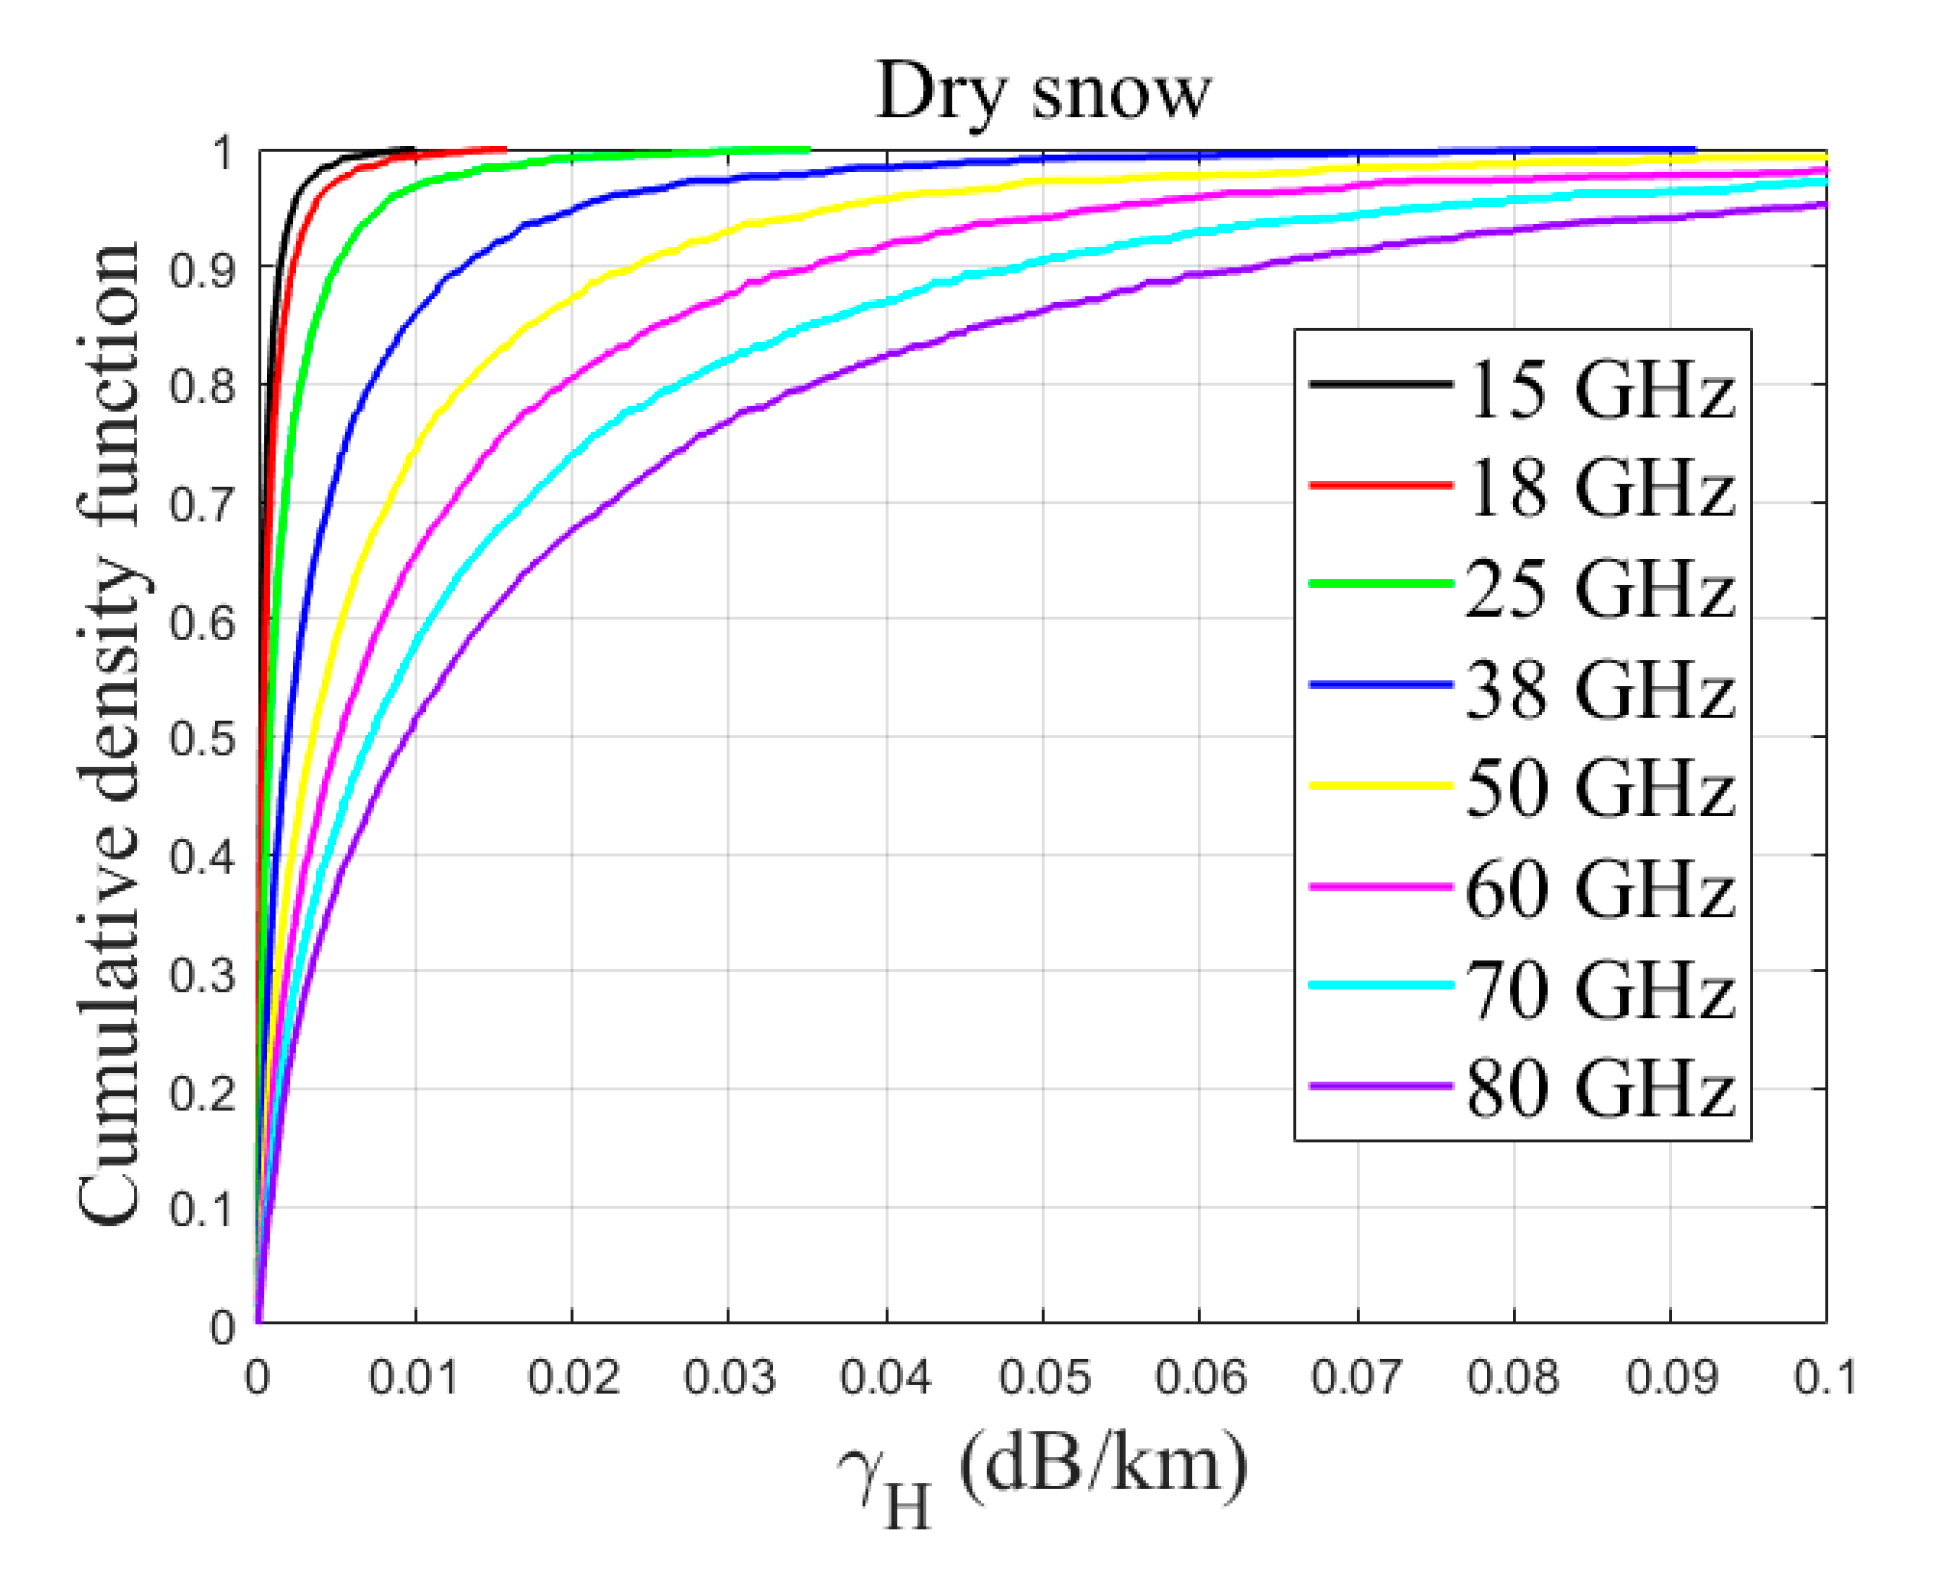
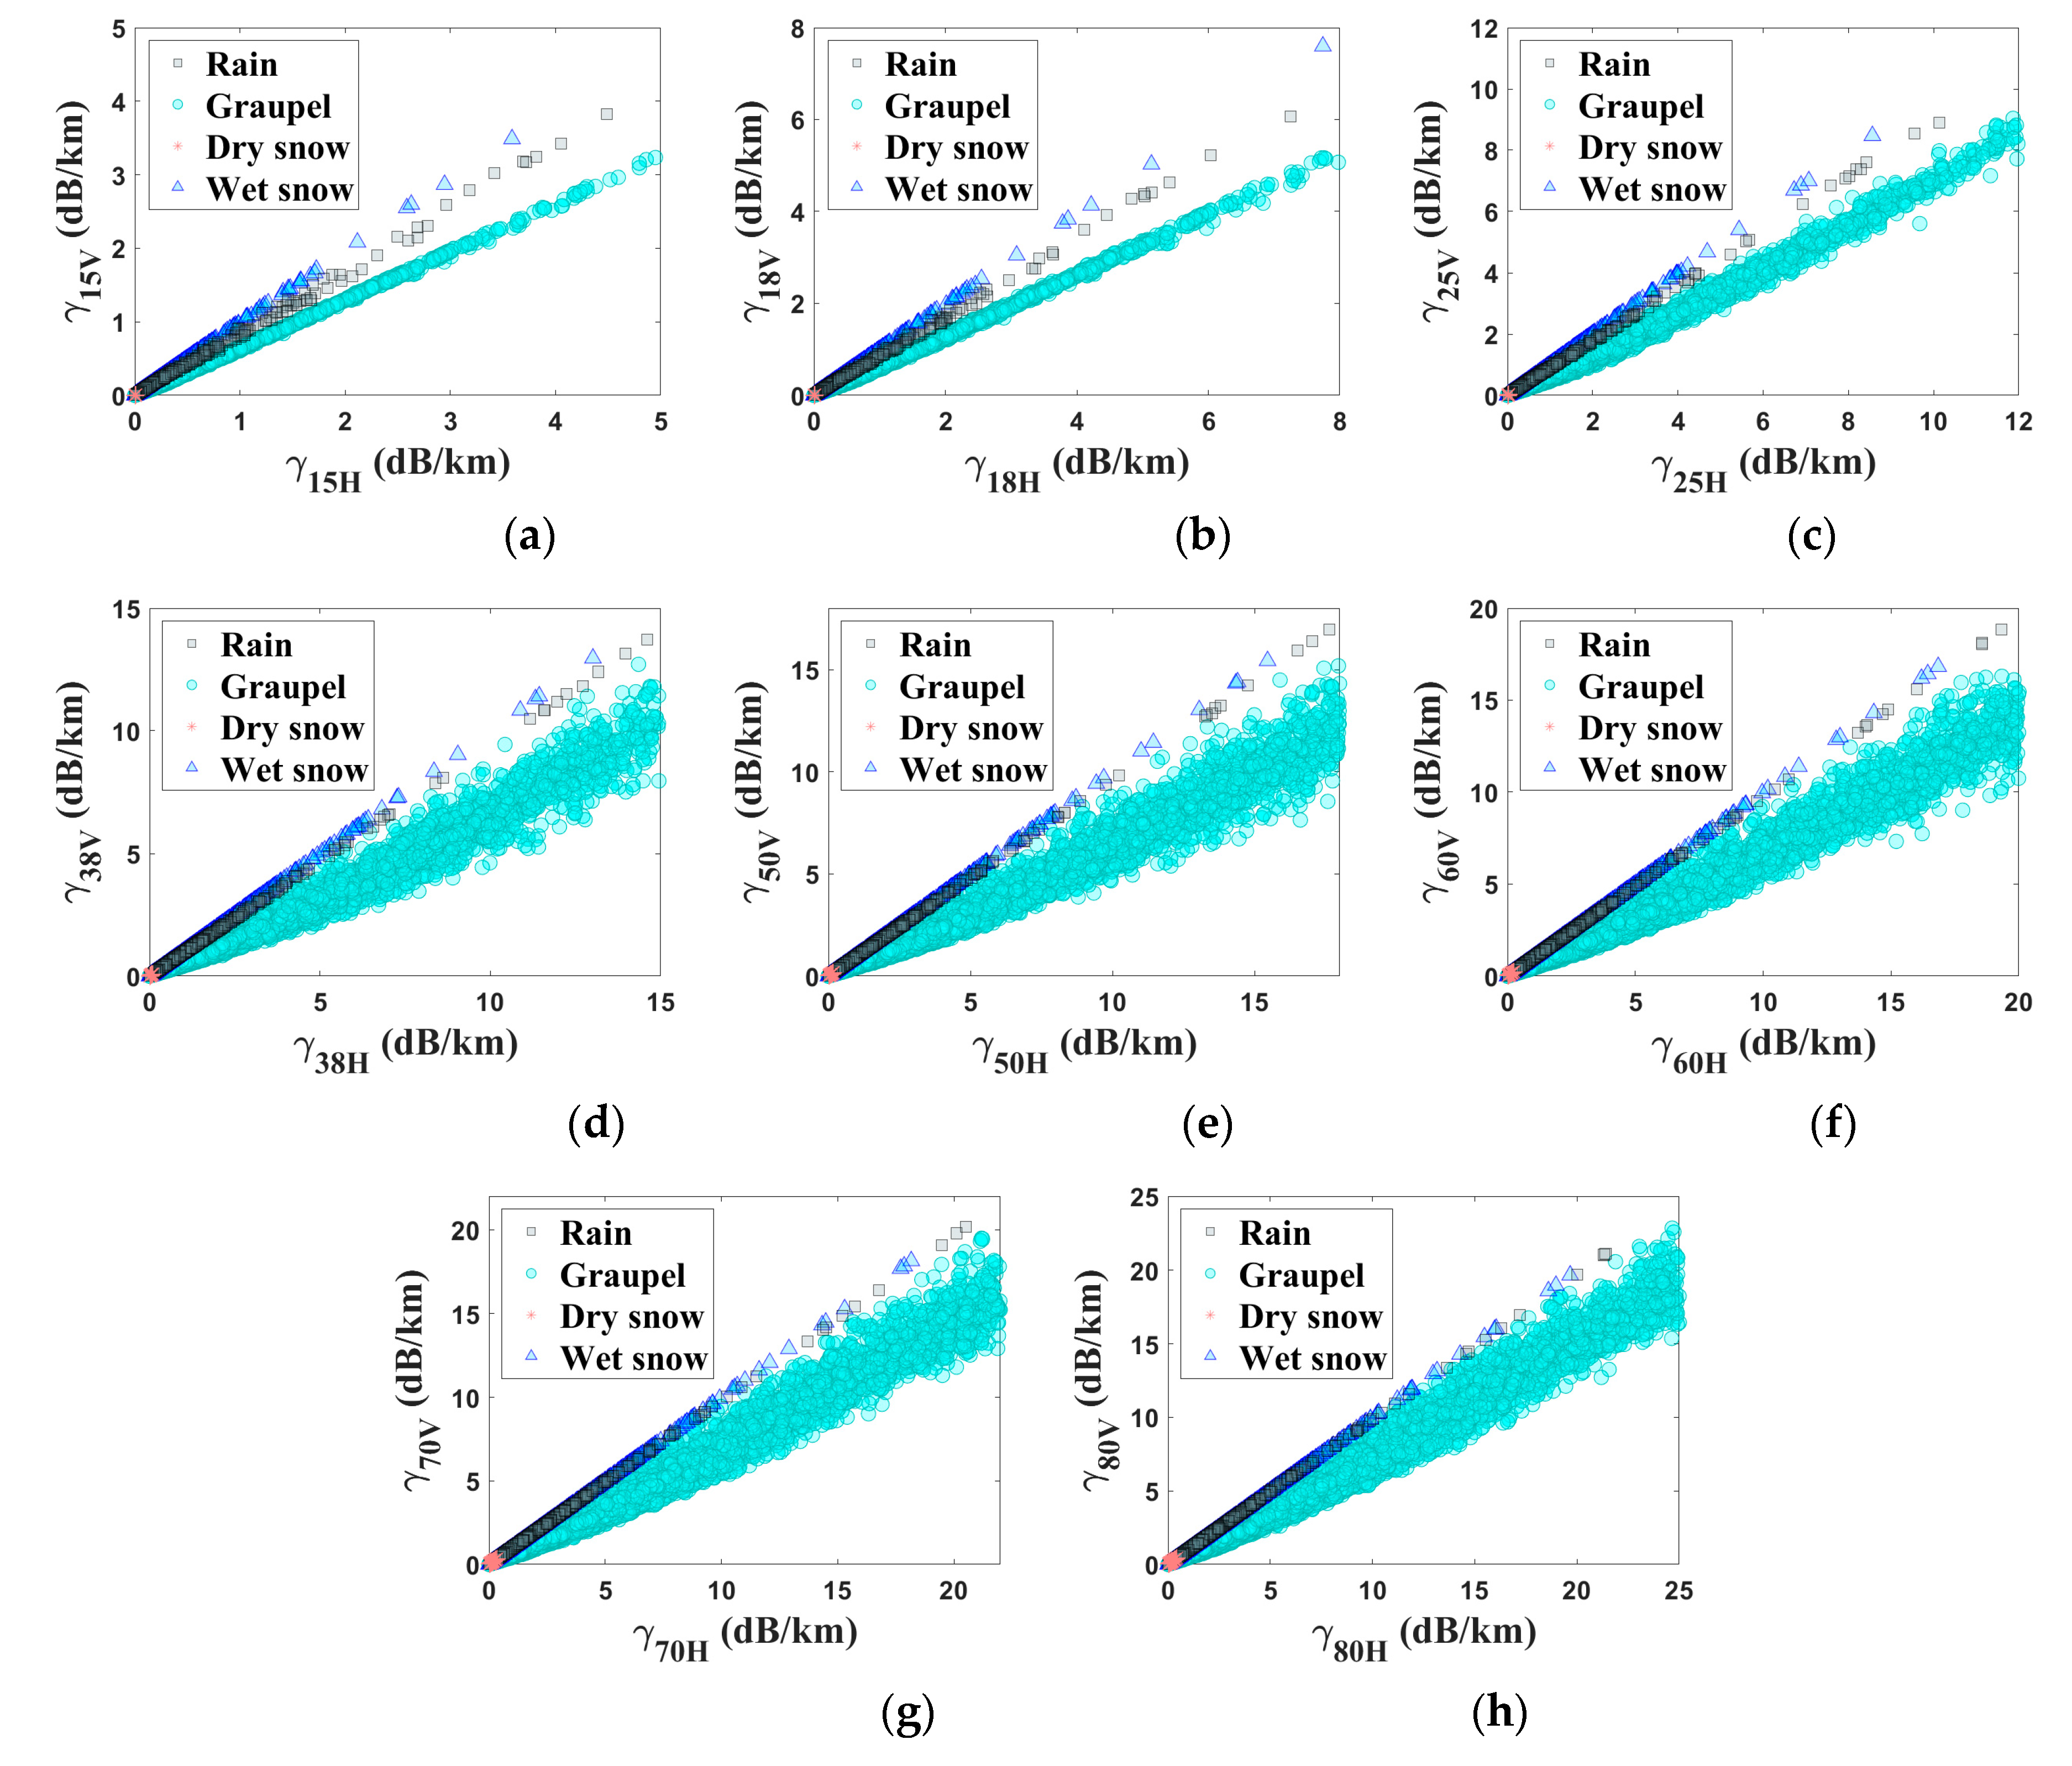

| Parameter | Rain | Graupel | Wet Snow | Dry Snow |
|---|---|---|---|---|
| Precipitation rate S (mm/h) | 0.73 (2.55) | 2.07 (2.93) | 0.16 (0.20) | 0.27 (0.40) |
| Shape parameter μ | 7.58 (6.35) | 2.90 (4.98) | 4.79 (4.49) | 4.10 (5.38) |
| Normalized intercept parameter log10Nw (mm−1 m−3) | 3.41 (0.53) | 3.30 (0.53) | 2.95 (0.49) | 2.99 (0.63) |
| Mass-weighted mean diameter Dm (mm) | 0.99 (0.53) | 2.58 (1.25) | 3.17 (1.78) | 3.49 (2.00) |
| Frequency (GHz) | Model Number | Frequency (GHz) | Model Number |
|---|---|---|---|
| 15 | 1 | 50 | 5 |
| 18 | 2 | 60 | 6 |
| 25 | 3 | 70 | 7 |
| 38 | 4 | 80 | 8 |
| Frequency (GHz) | Model Number | Frequency (GHz) | Model Number |
|---|---|---|---|
| 15, 18 | 1 | 25, 50 | 15 |
| 15, 25 | 2 | 25, 60 | 16 |
| 15, 38 | 3 | 25, 70 | 17 |
| 15, 50 | 4 | 25, 80 | 18 |
| 15, 60 | 5 | 38, 50 | 19 |
| 15, 70 | 6 | 38, 60 | 20 |
| 15, 80 | 7 | 38, 70 | 21 |
| 18, 25 | 8 | 38, 80 | 22 |
| 18, 38 | 9 | 50, 60 | 23 |
| 18, 50 | 10 | 50, 70 | 24 |
| 18, 60 | 11 | 50, 80 | 25 |
| 18, 70 | 12 | 60, 70 | 26 |
| 18, 80 | 13 | 60, 80 | 27 |
| 25, 38 | 14 | 70, 80 | 28 |
| Frequency (GHz) | Model Number | Frequency (GHz) | Model Number |
|---|---|---|---|
| 15, 18, 25 | 1 | 18, 38, 70 | 29 |
| 15, 18, 38 | 2 | 18, 38, 80 | 30 |
| 15, 18, 50 | 3 | 18, 50, 60 | 31 |
| 15, 18, 60 | 4 | 18, 50, 70 | 32 |
| 15, 18, 70 | 5 | 18, 50, 80 | 33 |
| 15, 18, 80 | 6 | 18, 60, 70 | 34 |
| 15, 25, 38 | 7 | 18, 60, 80 | 35 |
| 15, 25, 50 | 8 | 18, 70, 80 | 36 |
| 15, 25, 60 | 9 | 25, 38, 50 | 37 |
| 15, 25, 70 | 10 | 25, 38, 60 | 38 |
| 15, 25, 80 | 11 | 25, 38, 70 | 39 |
| 15, 38, 50 | 12 | 25, 38, 80 | 40 |
| 15, 38, 60 | 13 | 25, 50, 60 | 41 |
| 15, 38, 70 | 14 | 25, 50, 70 | 42 |
| 15, 38, 80 | 15 | 25, 50, 80 | 43 |
| 15, 50, 60 | 16 | 25, 60, 70 | 44 |
| 15, 50, 70 | 17 | 25, 60, 80 | 45 |
| 15, 50, 80 | 18 | 25, 70, 80 | 46 |
| 15, 60, 70 | 19 | 38, 50, 60 | 47 |
| 15, 60, 80 | 20 | 38, 50, 70 | 48 |
| 15, 70, 80 | 21 | 38, 50, 80 | 49 |
| 18, 25, 38 | 22 | 38, 60, 70 | 50 |
| 18, 25, 50 | 23 | 38, 60, 80 | 51 |
| 18, 25, 60 | 24 | 38, 70, 80 | 52 |
| 18, 25, 70 | 25 | 50, 60, 70 | 53 |
| 18, 25, 80 | 26 | 50, 60, 80 | 54 |
| 18, 38, 50 | 27 | 50, 70, 80 | 55 |
| 18, 38, 60 | 28 | 60, 70, 80 | 56 |
© 2020 by the authors. Licensee MDPI, Basel, Switzerland. This article is an open access article distributed under the terms and conditions of the Creative Commons Attribution (CC BY) license (http://creativecommons.org/licenses/by/4.0/).
Share and Cite
Pu, K.; Liu, X.; Hu, S.; Gao, T. Hydrometeor Identification Using Multiple-Frequency Microwave Links: A Numerical Simulation. Remote Sens. 2020, 12, 2158. https://doi.org/10.3390/rs12132158
Pu K, Liu X, Hu S, Gao T. Hydrometeor Identification Using Multiple-Frequency Microwave Links: A Numerical Simulation. Remote Sensing. 2020; 12(13):2158. https://doi.org/10.3390/rs12132158
Chicago/Turabian StylePu, Kang, Xichuan Liu, Shuai Hu, and Taichang Gao. 2020. "Hydrometeor Identification Using Multiple-Frequency Microwave Links: A Numerical Simulation" Remote Sensing 12, no. 13: 2158. https://doi.org/10.3390/rs12132158
APA StylePu, K., Liu, X., Hu, S., & Gao, T. (2020). Hydrometeor Identification Using Multiple-Frequency Microwave Links: A Numerical Simulation. Remote Sensing, 12(13), 2158. https://doi.org/10.3390/rs12132158


